regional policies and strategies for replacing lost
TRANSCRIPT

Regional Policies and Strategies for
Replacing Lost Manufacturing Jobs
Howard Wial, the Brookings Institution
Harold Wolman, George Washington University
Sloan Foundation Industry Studies Conference
Chicago, IL - May 28, 2009

The U.S. lost 24 percent of its manufacturing
jobs from 1980-2005
61 percent of this loss occurred in 114 metropolitan areas that
specialized in manufacturing in 1980 and lost manufacturing
jobs from 1980-2005
We ask: What policies/strategies (public, private, and/or
nonprofit) were adopted to influence the
replacement of lost manufacturing jobs and the
subsequent development paths in these regions?
What impact, if any, did these policies/strategies
have?
What else could explain the development paths of
these metropolitan areas from 1980-2005?
•
•
•
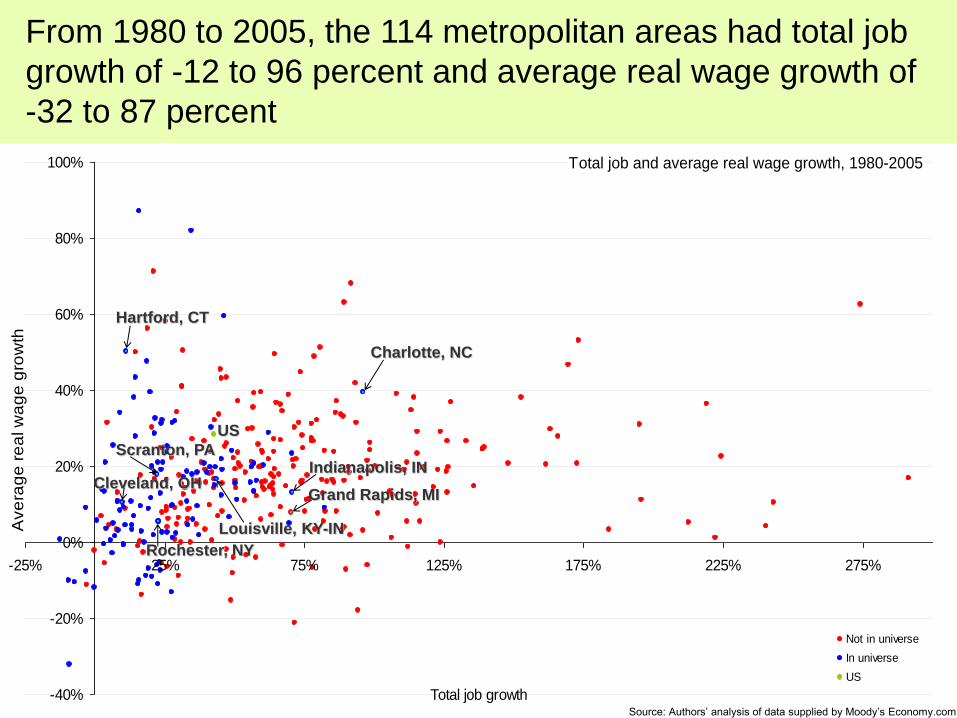
Total job and average real wage growth, 1980-2005
-40%
-20%
0%
20%
40%
60%
80%
100%
-25% 25% 75% 125% 175% 225% 275%
Total job growth
Ave
rag
e r
ea
l w
ag
e g
row
th .
Not in universe
In universe
US
Grand Rapids, MI
Indianapolis, IN Scranton, PA
Rochester, NY
Louisville, KY-IN
Hartford, CT
Cleveland, OH
Charlotte, NC
From 1980 to 2005, the 114 metropolitan areas had total job
growth of -12 to 96 percent and average real wage growth of
-32 to 87 percent
US
Source: Authors’ analysis of data supplied by Moody’s Economy.com
We visited each case study region to
conduct interviews
Economic development organizations •
Chambers of Commerce, other local business groups •
Public officials •
Business sectoral organizations •
Community colleges •
Workforce development officials •
Venture capitalists •
Manufacturing Extension Partnership centers •
Business journalists •
Firms, including those in major export-industries that reduced
employment and selected firms that have gained employment •
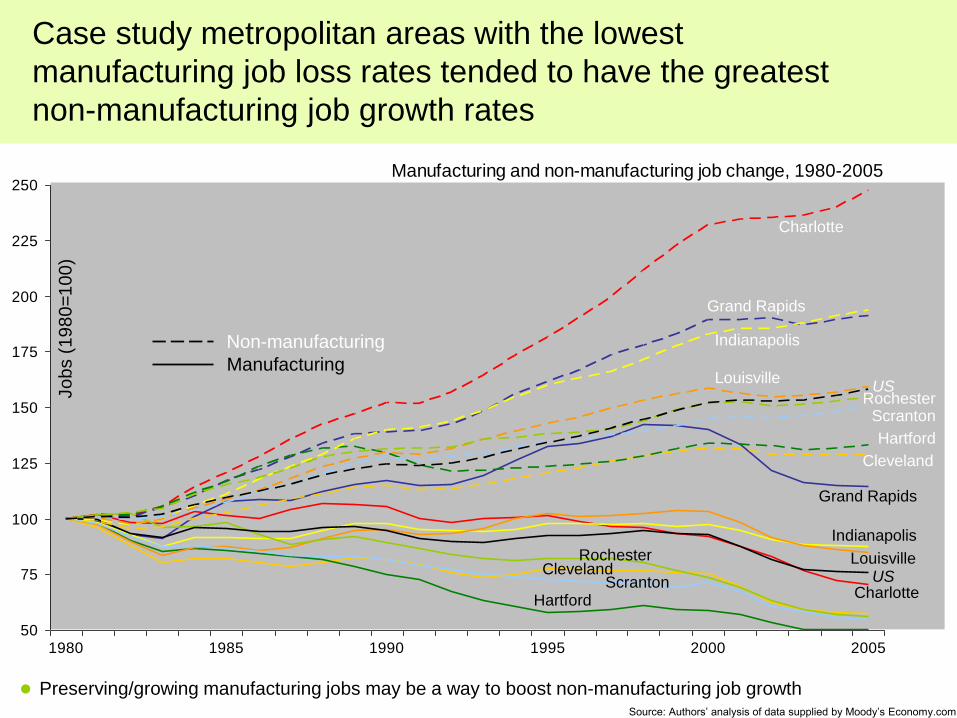
Case study metropolitan areas with the lowest
manufacturing job loss rates tended to have the greatest
non-manufacturing job growth rates
•
Manufacturing and non-manufacturing job change, 1980-2005
50
75
100
125
150
175
200
225
250
1980 1985 1990 1995 2000 2005
Jo
bs (
19
80
=1
00
)
Source: Authors’ analysis of data supplied by Moody’s Economy.com
Manufacturing
Non-manufacturing
Charlotte
Indianapolis
Grand Rapids
Louisville US
Rochester Scranton
Hartford
Cleveland
Grand Rapids
Indianapolis
Louisville US
Charlotte
Cleveland Rochester
Scranton
Hartford
Preserving/growing manufacturing jobs may be a way to boost non-manufacturing job growth
Public policymakers and business leaders rarely
anticipated or planned for manufacturing job loss
Exception: Indianapolis •
In some metropolitan areas there was little or no intentional
intervention to retain or replace manufacturing jobs
(Rochester, Charlotte, Hartford)
•
In others, policy/strategy followed a period of substantial
manufacturing job loss (Cleveland, Scranton, Louisville) •
In all metropolitan areas there was some public, nonprofit, or
above-the-firm-level business intervention to try to influence
the regional economic trajectory, often not specifically
designed to retain or replace manufacturing jobs
•

Policies/strategies were typical of those adopted at
state and local levels nationwide from 1980-2005
Subsidies to attract individual firms (including infrastructure, tax
abatements) •
Assistance to small and medium-sized manufacturing suppliers
(lean production, sometimes more) •
Technology-based economic development (esp. biotechnology) • Entrepreneurship promotion • Business incubators •
Industry cluster assistance (in manufacturing and some services) •
Generic infrastructure expansion (esp. highways and airports) •
Downtown redevelopment, including residential •
“Unlocking” unused technologies from large firms •
Community college programs (for manufacturing and growing
occupations, some customized for individual firms) •

Specific type of policy/strategy had little to do with impact •
Almost none of these policies/strategies had any discernable
impact on regional economic trajectory (major exception:
assistance to UPS in Louisville)
•
What did we learn about the typical policies and
strategies?
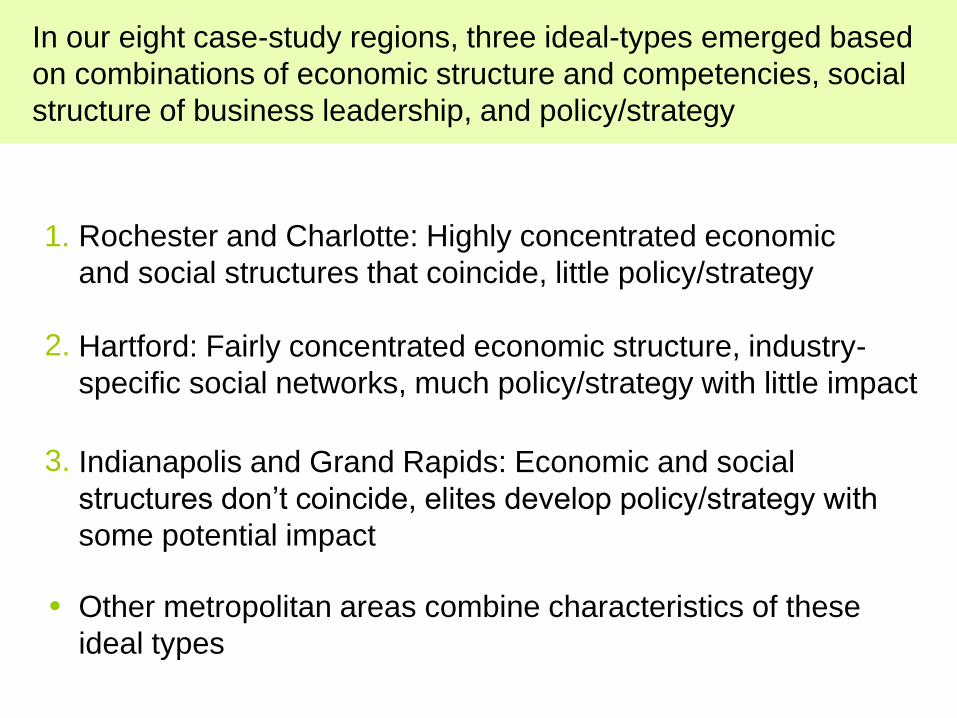
In our eight case-study regions, three ideal-types emerged based
on combinations of economic structure and competencies, social
structure of business leadership, and policy/strategy
Rochester and Charlotte: Highly concentrated economic
and social structures that coincide, little policy/strategy
1.
Hartford: Fairly concentrated economic structure, industry-
specific social networks, much policy/strategy with little impact
2.
Indianapolis and Grand Rapids: Economic and social
structures don’t coincide, elites develop policy/strategy with
some potential impact
3.
Other metropolitan areas combine characteristics of these
ideal types •

Rochester and Charlotte: Highly concentrated economic
and social structures that coincide, little policy/strategy
A few very large firms in a single industry or related industries with
headquarters and/or major operations in the region •
Rochester: Kodak, Xerox • Charlotte: Bank of America, Wachovia •
Characteristics of these large firms:
Account(ed) for a large share of regional employment • Highly vertically integrated within region, or designed products
for suppliers and provided stable markets for suppliers •
Locally owned or controlled; CEOs had commitment to region • Funded major local economic development projects (e.g.
downtown redevelopment), cultural amenities, philanthropies •
Able to influence the decisions of local government • Major determinants of regional economic trajectory •

Rochester and Charlotte: Highly concentrated economic
and social structures that coincide, little policy/strategy
Few economic development organizations; those that existed did
not develop policies/strategies or these efforts had no impact •
Alternative social networks of business leaders were slow to
develop •
Rochester: When the major firms’ business strategies failed,
they adapted by vertically disintegrating, seeking suppliers
worldwide (without assisting local suppliers), and cutting back
on local economic development and civic expenditures
•
The region was deprived of supplier capacity and the capacity
to respond to economic change •
Charlotte: The decline of dominant firms has occurred within
the last year—outcome uncertain •

Hartford: Fairly concentrated economic structure, industry-
specific social networks, much policy/strategy with little impact
Export firms somewhat more diverse (demand shocks to insurance
and aerospace in the region not highly correlated) •
Major firm CEOs either no longer in region (insurance) or were
never involved in local economic development, cultural, or
philanthropic funding and had less influence over local governments
(aerospace OEMs)
•
Social networks of export-firm leaders were specific to industry
(insurance) or segment of industry (aerospace OEMs, suppliers) •
Major firm strategies expanded production outside the region, but
R&D remained in-house and in the region •

Hartford: Fairly concentrated economic structure, industry-
specific social networks, much policy/strategy with little impact
Many small, single purpose economic development organizations,
mostly nonprofit, with many policies/strategies; several
organizations with overlapping or competing missions
•
Some policies/strategies may have had impact on industry
segments (aerospace cluster) but there is little evidence of broader
regional economic impact
•
Economic outcomes depended on major firm strategies and cost
characteristics of the region •

Indianapolis and Grand Rapids: Economic and social
structures don’t coincide, elites develop policy/strategy with
some potential impact
Many major export-firm executives live in region and are committed
to it, even if firms are not headquartered there •
Social norm that large firms with presence in region will help fund
local economic development or civic initiatives •

Indianapolis and Grand Rapids: Economic and social
structures don’t coincide, elites develop policy/strategy with
some potential impact
Indianapolis in 1980s: informal “city committee” included staff of
mayor and state legislature, lawyers, bankers, junior executives of
Eli Lilly and the Lilly Endowment
•
Indianapolis in late 1990s-2000s: Central Indiana Corporate
Partnership founded by executives of Eli Lilly, Lilly Endowment,
Rolls Royce, utilities, banks, universities, chemical companies,
FedEx, banks, health insurance firm, logistics firms, etc.
•
Grand Rapids: Leaders of Amway, Meijer, furniture manufacturers,
wood finishing firm, larger auto suppliers, and bankers founded
formal and informal economic development organizations (Grand
Action, The Right Place, Improvement Association)
•
Strongly connected leadership groups of major firm leaders from
diverse industries and, in Indianapolis, foundation and government
leaders/staff
•

Indianapolis and Grand Rapids: Economic and social
structures don’t coincide, elites develop policy/strategy with
some potential impact
Social networks of export-firm leaders cross industry lines. Leaders
often grew up together, lived in same neighborhoods, belonged to
same social clubs and religious communities
•
Major funding sources for large economic development projects,
cultural amenities, philanthropies: Lilly Endowment in Indianapolis,
wealthiest export firm owners or children of founders in Grand Rapids
•
Individual members of elite formulate policy/strategy ideas and
solicit support from others within elite; elites don’t generally agree on
policy/strategy in advance
•
These elites had strong influence over local government decisions •

Indianapolis and Grand Rapids: Economic and social
structures don’t coincide, elites develop policy/strategy with
some potential impact
Indianapolis in 1980s: Amateur sports and associated tourism as
regional export industry and way to revitalize downtown to attract
managers to Eli Lilly (involved eminent domain, enterprise zone
designation, publicly funded stadiums, Pan American Games)
•
•
(Louisville in early 1980s, similar to Indianapolis: Airport expansion
to induce UPS to create hub there (involved eminent domain)) •
Policies/strategies may have had some regional economic impact •
Grand Rapids beginning in 1985: The Right Place—unified publicly
and privately funded economic development organization, convenes
industry cluster groups, provides or coordinates assistance to small
and medium-sized manufacturers on lean production, market
development, export promotion, design

What else could account for the economic development
trajectories of our case study metropolitan areas?
In general (Louisville, Indianapolis for logistics and freight
transportation, Scranton’s proximity to New York for those industries
and insurance company back offices)
•
•
Transportation and communication costs •
Air access to national and international locations (disadvantage for
Scranton, Rochester, Grand Rapids, Cleveland)
Relatively low wages attracted mobile activities from elsewhere
(Charlotte-durable manufacturing, Scranton-insurance), or •
•
Wages (relative to productivity) •
Relatively high wages and changing firm strategies, aided by
improved communication technology, induced firms to relocate
lower-wage parts of production process elsewhere (Hartford-
insurance, Cleveland-diverse manufacturing)

What else could account for the economic development
trajectories of our case study metropolitan areas?
Workforce skills (Louisville-little precision manufacturing, information
technology, or biotechnology) •
Innovative capacity (Indianapolis and Grand Rapids suppliers) •
•
Pre-existing capabilities of export firms in metropolitan area,
sometimes spurred by public policy •
Other business strategy to increase revenue (Charlotte banking)

Few metropolitan areas that specialized in manufacturing in 1980
(and none of the case study areas) were able to make a transition to
a different economic base unless they also had a major, growing
non-manufacturing export industry to begin with
•
Explicit public policies or public-private-nonprofit strategies had less
impact on metropolitan economic development trajectories than did
individual firm strategies and capacities and costs and availability of
inputs in a region
•
A high degree of local vertical integration by dominant export firms
in a highly concentrated local economy impedes policy/strategy and
economic transformation
•
Conclusions

Conclusions
Lack of strong business leadership group in a metropolitan area
may be associated with a great deal of small-scale strategy, but
impacts if any, are very limited
•
A strong business leadership group from diverse industries, possibly
including public sector, may produce policies with some
metropolitan-level economic impact, but disadvantages of this
approach may include indifference to wage and productivity growth,
lack of transparency and democratic accountability, lack of influence
over economic development by labor and disadvantaged groups
•