regional planning for use in india
TRANSCRIPT


Regional Planning foR
SuStainable land uSe in india
edited by Rumi aijaz and felix Knopf

© 2019 Observer Research Foundation and Global Policy Journal. All rights reserved. No part of this publication may be reproduced, stored in a retrieval system or transmitted in any form or by any means, electronic, mechanical or photocopying, recording, or otherwise, without the prior permission of the publisher.
Observer Research Foundation20 Rouse Avenue, Institutional AreaNew Delhi, India [email protected]
ORF provides non-partisan, independent analyses on matters of security, strategy, economy, development, energy and global governance to diverse decision-makers including governments, business communities, academia and civil society. ORF’s mandate is to conduct in-depth research, provide inclusive platforms, and invest in tomorrow’s thought leaders today.
This publication is supported by the Land Use Planning and Management project of Deutsche Gesellschaft für Internationale Zusammenarbeit (GIZ), New Delhi, India.
Inside Design:Simi Jaison Designs
Printed by:xxxxxxxx
Cover Map Source:Natural Resources Census Project of National Remote Sensing Centre (NRSC), ISRO, Hyderabad, India. Online Map Bhuvan – Thematic Services, LULC-250K map/NRC/ISRO – India, viewed 31 May 2019, https://bhuvan-app1.nrsc.gov.in/thematic/thematic/index.php
ISBN: 978-93-89094-37-4
Citation:Rumi Aijaz and Felix Knopf, eds., Regional Planning for Sustainable Land Use in India (New Delhi: ORF and Global Policy Journal, 2019).

Contents
Acknowledgements ............................................................................................... 5
1 Introduction .............................................................................................................. 7 Rumi Aijaz and Felix Knopf
I. REGIONAL ISSUES
2 An Assessment of Regional Disparities in Karnataka ........................................... 18 Ashok D. Hanjagi
3 Regional Diversity and Planning in India: Issues around the Upliftment of Tribal Communities ............................................................................................. 33 V. Srinivasa Rao
4 Sustaining Nature-based Tourism: Spatial Planning Challenges in Tamil Nadu .. 41 Sugato Dutt
5 Development Discourse for an Inundated Space: The Case of a Disaster-Affected Region ......................................................................................... 51 Vinita Yadav
6 Role of Small and Medium Towns in Regional Development: The Case of Northeast India ........................................................................................................ 59 Benjamin L. Saitluanga
7 Role of Small Towns in Regional Development:Lessons from South Africa ......... 72 Tathagata Chatterji
8 Development, Commuting and Regional Planning: Inferences from the Census of India, 2011 ............................................................................................... 90 Sabiha Baig

II. REGIONAL PLANNING APPROACHES
9 Geography and Planning: An Alternate Development Discourse .......................... 104 Aparna Phadke
10 Planning for City-Regions: Emerging Geographies, Missing Hierarchies ............. 122 Anjali Karol Mohan
11 Planning and Development of the National Capital Region of Delhi: Issues and Challenges ............................................................................................... 133 Rajeev Malhotra
12 Environmentally Sustainable and Participatory Regional Planning in India: The Goa Model .......................................................................................................... 154 S. T. Puttaraju and Deepika Chauhan
13 Mainstreaming District Spatial Planning in India: Lessons from the Studio on Participatory District Planning in Ganjam, Odisha ................................................ 167 Saswat Bandyopadhyay and Prasenjit Shukla
About the Editors and Authors ............................................................................. 179

Acknowledgements
The editors of this publication acknowledge the contribution of each author. The chapters presented in this volume contain a wealth of information and the lessons documented by the contributing authors will be useful in building further understanding of spatial
planning in various regions of India.In the preparation of this publication, valuable advise was received from a distinguished panel
of experts, which helped improve the quality of manuscript. For their insightful comments, the editors are grateful to the following:
Dr. M. Ramachandran, Former Secretary, Ministry of Urban Development, Delhi•Dr. S.K. Kulshrestha, Urban & Regional Planner, Founder editor, Spatio-economic •Development Record (SEDR), DelhiDr. Vinod K. Tewari, Former Director, National Institute of Urban Affairs, Delhi•Prof. Jamal Husain Ansari, Former Director, School of Planning and Architecture, Delhi•Mr. P.S. Uttarwar, Former Adviser (Planning) & Additional Commissioner (Planning), Delhi •Development AuthorityProf. N. Sridharan, Director, School of Planning and Architecture, Bhopal•
At the Observer Research Foundation (ORF), Mr. Sunjoy Joshi, Chairman and Dr. Samir Saran, President, have been a constant source of inspiration.
The editors are also thankful to Manish Vaid (Junior Fellow, ORF) and Satish Kumar Tezaa (Data Analyst, ORF) for their assistance in the compilation of the manuscript. The language editing of this compendium was led by Vinia Datinguinoo Mukherjee.
This publication is supported by the Land Use Planning and Management project of Deutsche Gesellschaft für Internationale Zusammenarbeit (GIZ), New Delhi, India.
Rumi Aijaz Felix Knopf

Governments across the world increasingly realise that in addition to economic well-being, there are manifold layers to citizens’ aspirations to leading a healthy and productive life. This paradigm is today the basis for making policy and crafting strategy, and
governments are putting greater emphasis on introducing measures to ensure inclusive growth and development.
In India, for example, the social, economic, environmental and built conditions reveal a multitude of problems. Even as the country has immense potential in terms of human and other resources, the adversities are visible. To be sure, India has recorded achievements on numerous fronts. However, many problems remain, and the age-old slogans of ensuring every citizen’s access to roti, kapda aur makaan (bread, cloth and house) and paani, bijli aur sadak (water, electricity and road) still hold, as large populations across the vast country remain deprived of these essential needs.
Compounding the problems are the intra-state disparities and urban-rural disparities. According to the World Bank, for instance, poverty ratio in rural India was 26 percent in 2015 and a lower 14 percent in urban areas. In the same year, only 34 percent of the rural population had access to basic sanitation services, compared to the 66 percent in the urban regions.1
Inclusive development must embrace all sectors of the society—rural and urban, poor and rich, minorities and majorities. The postulate of equal living conditions helps to ensure economic competitiveness, social harmony and quality living. Some countries have included this postulate into federal law. To measure equality (or inequality) of living conditions, German authorities for example apply indicators such as economic performance, healthcare, distribution of wealth, security, housing conditions, education, culture, accessibility and mobility.2 While there is no singular norm or benchmark that has to be achieved, the characteristics of equal living conditions are determined as part of the central place theory. In 2018, the government of Germany appointed
1Introduction
Rumi Aijaz and Felix Knopf
1 World Bank, “Data Bank: World Development Indicators,” The World Bank, 2015, accessed 14 January 2019, https://databank.worldbank.org/data/source/world-development-indicators/preview/on.
2 “Raumordnungsbericht (Spatial Planning Report) 2011,” Bundesinstitut für Bau-, Stadt- und Raumforschung (Federal Institute for Research on Building, Urban Affairs and Spatial Development), 2012, 16, https://www.bbsr.bund.de/BBSR/DE/Raumentwicklung/RaumentwicklungDeutschland/Raumordnungsberichte/raumordnungsberichte_node.html.

8REGIONAL PLANNING FOR SUSTAINABLE LAND USE IN INDIA
a commission of equal living conditions to foster the understanding and implementation of this postulate.3
As part of the Smart City Mission of the Government of India, the Ministry of Housing and Urban Affairs has made a meaningful attempt to measure the quality of living conditions in cities. A territorial approach of equal living conditions, however, is yet to be seen as a serious policy approach.
Land use planning is understood as a discipline to secure equivalence of living conditions across a territory.4 Referring to article 1 of the German Spatial Planning law (ROG), the state is responsible for the provision of infrastructure, amenities to ensure that opportunities for prosperity are equal across the country. Thus, land use planning is seen as an entry point to cater to an equal distribution of goods, wealth and opportunities across the territory.
Land and the “Spatial Planning” Dimension
Land is a finite and essential resource, and governments attempt to devise policies, laws, plans and strategies for efficient land utilisation. The common aim is to ensure that land under various natural geographical features remains preserved for protection of biodiversity, and the needs of society for land are met in an organised and optimal manner. Inefficiencies in land management are rife, not only in India but in many other parts of the world; violations of land use rules also create problems for the environment and society. In India, there is no dearth of evidence of the widespread mismanagement of land, and some of the most crucial ones are discussed in the following paragraphs.
Unauthorised construction on hill slopes• : The hill towns of Aizawl (in Mizoram) and Shimla (in Himachal Pradesh) offer job opportunities, and/or attract a large number of tourists. To cater to the needs of these populations, there has been massive construction (houses, hotels, restaurants, shops) on the hill slopes in an unregulated manner, and without proper planning and vulnerability analysis. The developments have caused the reduction of green cover in these towns and have accelerated soil erosion. Such conditions make the regions vulnerable to landslides. The northern hilly and mountainous regions of India are also prone to earthquakes and lie in the high-risk seismic zone. The occurrence of earthquakes and landslides result in loss of lives and property.5, 6 Waste dumping on undesignated lands• : Huge quantities of solid waste are generated in Indian cities. Due to planning and administration deficiencies in waste management and disposal, there are instances of waste being dumped on undesignated vacant lands within the city or in the peri-urban area, such as the Aravalli hills near Gurugram in Haryana. Such open waste
3 “Gleichwertige Lebensverhältnisse (Equivalent Living Conditions),” BMI, 2018, https://www.bmi.bund.de/DE/themen/heimat-integration/gleichwertige-lebensverhaeltnisse/gleichwertige-lebensverhaeltnnisse-artikel.html.
4 “Gleichwertige Lebensverhältnisse (Equivalent Living Conditions),” Bundesinstitut für Bau-, Stadt- und Raumforschung (Federal Institute for Research on Building, Urban Affairs and Spatial Development), 2007, accessed 14 January 2019, https://www.bbsr.bund.de/BBSR/DE/Raumentwicklung/RaumentwicklungDeutschland/Projekte/Gleichwertig/Gleichwertig.html?nn=411742.
5 Anuradha Yagya, “Making a Smart City in a Fragile Ecosystem: The Case of Shimla,” ORF Special Report, No. 42, September 2017.
6 Benjamin L. Saitluanga, “Towards a Sustainable Smart City: The Case of Aizawl,” ORF Special Report, No. 73, August 2018.

9INTRODUCTION
dumping grounds are a nuisance (emitting foul odour, and posing health hazards) for the population living in the vicinity, and pollute the air and groundwater as well.Indiscriminate land use conversion in peri-urban areas• : Indian mega cities are experiencing phenomenal growth in population and built structures, and there is scarcity of land for accommodating further growth. Therefore, peri-urban/rural areas near mega cities are becoming the new growth centres, as vacant lands are available there. However, in various peri-urban areas, the construction is occurring in an uncontrolled and haphazard manner because of the absence of proper legislation, planning and development controls. Further, agricultural land is being converted to other uses by private builders and real estate developers. Such practices are creating a negative impact on food production and quality of life.7
Growth of slums and unplanned housing in cities• : A large number of poor people have been migrating to cities for jobs. They are unable to buy or rent a house, and therefore live in uninhabitable, poorly governed areas where they find no other recourse but to set up shelters on vacant lands situated near open drains, rivers, railway lines, and other such places not fit for habitation. Since such developments are unauthorised by the civic agencies and are therefore without basic amenities, the living and environmental conditions are abysmal. Despite the existence of master plans, a significant percentage of land in cities is occupied by unauthorised and poorly built structures. Lack of integrated rural-urban planning• : Every human settlement has a relationship with its surroundings. For example, the less-developed rural areas are dependent on the neighbouring urban areas for meeting various needs, such as health and education facilities, essential commodities, and employment. Similarly, the urban areas have linkages with the adjoining rural hinterlands. Vegetables produced in rural farmlands help meet food requirements of the urban population. Further, Indian cities experience a massive daily influx of so-called “floating” population from the neighbouring regions who come for work and other reasons. Despite the symbiotic relationship between rural and urban areas, however, there is inadequate attention to their integrated planning and development. As such, the two regions are often planned and developed in isolation from each other. Such deficiency is severely affecting the proper functioning of cities, as well as the quality of life in both rural and urban areas. Planning deficits in homogenous regions• : Vast tracts of land in the country exhibit similar characteristics. Examples include river basins, watershed areas, wetlands, backward areas inhabited by the scheduled castes and tribes, flood-prone areas, ecological and eco-sensitive areas, wildlife areas, mining areas, coastal areas, peri-urban areas, and areas having tourism potential. Since these are usually spread over a large land surface, they cut across rural and urban administrative boundaries at many places. For protecting the natural and human environment, such areas require an appropriate planning, development and governance approach. Many ongoing government initiatives in this regard are failing to produce satisfactory results.Unplanned urban sprawl• : India’s urban areas have developed fast in the past 20 to 30 years with high investment and growth rates. There are cities that have become globally competitive. At
7 Rumi Aijaz, “India’s Peri-Urban Regions: The Need for Policy and the Challenges of Governance,” ORF Issue Brief, No. 285, March 2019.

10REGIONAL PLANNING FOR SUSTAINABLE LAND USE IN INDIA
the same time, the definitions of “urban” and “rural” are no longer sufficient in today’s urban agglomerations, where urban characteristics are increasingly extending to rural areas. Strong urban growth in the past decade has given rise to a new type of urbanism that seems to be neither rural nor urban. These areas are characterised by a shift of employment from tertiary to secondary sector, and fast-growing populations in villages. Rural areas are transforming into previously undefined areas in the urban peripheries, called “peri-urban”. While these areas become more urban in terms of characteristics, their governance structure and basic services are not being adapted to the new conditions and remain rural. The scenario which is drawn is a continuum of productive and wealthy urban centers, underserved peri-urban areas in the agglomerations, and rural areas that are left behind and without adequate opportunities for employment and livelihood.
These examples help create a fuller understanding of the significance of land use planning and management. Land-related problems in various parts of the country indicate deficiencies in planning, as well as legal and administrative functioning. If these patterns continue, India will fail to achieve its goals of equity and sustainability. It cannot be overemphasised enough that land has a multitude of natural and human functions and it is essential that it is utilised optimally and in a responsible manner.
Spatial Planning in India
Land use planning and spatial planning are activities that are conducted by professionally trained planners to regulate the use of land, or to influence the distribution of people and activities in space (i.e., over the land surface). Using available data and technologies, planners map existing land use and spatial characteristics and offer future scenarios and strategies. The outcome of these efforts is the creation of a land use plan, which forms the basis for guiding future development.
This form of planning is widely practiced. Such plans are prepared for villages8 and towns or cities9 across India, and they are backed by legislations and regulations that prescribe penalties for violations. However, proper implementation of the plan has remained an area of concern. Furthermore, on a broader scale, such as a district or a region, only a few examples10 of such planning currently exist. In the Kollam district of Kerala, for instance, an Integrated District Development Plan was prepared for optimum utilisation of land. In the preparation of the plan, all stakeholders were involved (planning officials, political leadership, technocrats, NGOs and citizens), and an integrated spatial planning approach was adopted, instead of the previous sectoral approach.11
8 The Gram Panchayats (or village councils) adopted under Sansad Adarsh Gram Yojana (SAGY), 2014 prepare Village Development Plans (VDP) through a participatory process under the guidance of Members of Parliament. Until 2 January 2018, VDPs have been prepared by 1,155 Gram Panchayats. Of the total 63,586 projects, 32,682 (51 percent) projects are completed. (“Status of SAGY,” Press Information Bureau, 7 January 2019, http://pib.nic.in/newsite/PrintRelease.aspx?relid=187261.)
9 Examples include Master Plans and Smart City Plans.10 Regional Plans for Mumbai Metropolitan Region, National Capital Region etc.11 Department of Town and Country Planning, Handbook for Preparation of Integrated District Development Plan and Local
Development Plan (Thiruvananthapuram: Local Self Government Department, 2007), http://www.townplanning.kerala.gov.in/pages/ldp/home.pdf.

11
The constitutional provisions of 1992 (i.e. 74th Amendment Act) failed to produce positive results. These provisions called for the creation of District Planning Committees (DPCs) to consolidate the plans prepared by rural (panchayats) and urban (municipalities) local governments in the district and to prepare a draft development plan for the entire district, as well as the setting up of Metropolitan Planning Committees (MPCs) to prepare a draft development plan for the metropolitan area as a whole. The provisions failed because state governments were reluctant to constitute DPCs and MPCs. The National Rurban Mission (NRuM) launched in February 2016 for the development of a cluster of villages in various Indian states is yet another measure aimed at integrated planning, and its impact will be seen in the near future.
Land is a subject matter of state governments; however, states do not have sufficient mechanisms to deal with land issues. Therefore, the response is either missing or ad hoc, which leads to problems. In view of the high demand for land from various quarters (i.e., industry, housing and infrastructure) and the increasing pressure on land from urbanisation, the Department of Land Resources (DoLR) in the Ministry of Rural Development is formulating a National Policy Framework for Land Use Planning and Management. It is expected that the framework will guide state governments in formulating state-specific policies for optimal utilisation of land resources; incorporate concerns of various sectors and stakeholders; and minimise the occurrence of land-related conflicts.12 In 2014, the Urban Development Ministry formulated the Urban and Regional Development Plans Formulation and Implementation (URDPFI) Guidelines for balanced development of all settlements within a region.13
India’s economic liberalisation in the 1990s had a strong impact on land markets in increasingly capital intensive cities. This has led to the transition of cities from functional administrative and cultural centres to globally competitive cities. Rapid urbanisation transformed Indian cities to growth engines for job creation and aggregate value. Consequentially, the phenomenon has led to a rise in rural-urban migration post-1990s, building pressure on land’s carrying capacity and rapidly transforming the economic workforce in small towns and villages.
Given the economic importance of cities, spatial planning in India is still mostly limited to urban agglomerations. While land price developments, to a certain degree, can be controlled by urban master plans, the nature and extent of market controls in rural areas and small towns have been left mostly unattended in the absence of a comprehensive land use policy, institutions, and formal spatial planning instruments. The most important prerequisite for policies, institutions and technical methods and instruments are legal provisions.
As per the 74th Amendment Act (Articles 243ZD and 243ZE), spatial planning is incorporated in District and Metropolitan Area Development Plans. Spatial plans are used as a tool to minimise the conflicts arising from multi sectoral developmental activities. In accordance, however, with the 7th schedule (state list entry 18) of Constitution of India, land is a state subject and therefore it is the states who prepare land-related policies and legislations.
INTRODUCTION
12 Department of Land Resources, National Land Utilisation Policy – Framework for Land Use Planning and Management (Draft) (New Delhi: Ministry of Rural Development, July 2013).
13 Town and Country Planning Organisation, Urban and Regional Development Plans Formulation and Implementation (URDPFI) Guidelines (New Delhi: Ministry of Urban Development, January 2015).

12REGIONAL PLANNING FOR SUSTAINABLE LAND USE IN INDIA
Figure 1 shows which states have legal provisions for spatial planning. While all states in India have the legal provision for urban master planning through Town Planning Acts, only seven have the legal provision for spatial planning beyond urban boundaries, i.e. in the rural areas. Moreover, six metropolitan regions have spatial plans for peri-urban and rural areas with the respective metropolitan region (see Figure 1). Thus, the major part of Indian territory does not have legal provisions for spatial planning in rural areas. The data show that even if there is a mandate for rural or regional planning, it is still not executed due to neglected implementation of statutes, institutional dysfunctionalities, or unwillingness for distribution of power to rural areas. The latter especially becomes relevant, as land is a finite resource and the right to access and to make use of land a matter of economic and political negotiations.
The reality check after the legal assessment draws a different picture. There are very few cases in which consistent application of legal provisions for regional and rural planning have been realised. Few of these examples are presented in this publication.
Except in the case of the leading metropolitan cities in India—such as Mumbai, Delhi (NCR), Hyderabad, Bangalore, and the State of Goa—not many regional plans have been prepared in India. Regional plans for different regions in Tamil Nadu were prepared in 1974 but were not implemented. Recently, Maharashtra completed 36 regional plans, each prepared for a district, but these are yet to be published.
Earlier experiences of regional plan preparation and implementation were restricted to resource-based areas such as Damodar Valley Area, Western Ghats Region, and to some extent the
Figure 1: Legal Provisions for Spatial Planning in India
Source: Editor’s illustration.
13
Eastern Ghats area. However, due to administrative contestations and resource commitments, these regional plans, except in the case of Damodar Valley, did not fructify. The Damodar Valley Regional Plan could be implemented due to the creation of special purpose vehicle (Damodar Valley Corporation) and the plan does not have a detailed land use or settlement plan.
Discussing regional planning in India requires an examination at a larger scale. A regional plan encompasses both urban and rural and makes strategic indications for spatial development and land use for the region. While the regional plan can be considered as a rather centralised instrument, which determines land-use patterns and development corridors for a large area, it fails in catering to the specific needs and conditions at the local level. Therefore, planning at the local level in peri-urban and rural areas must complement the strategical regional spatial plan. This means decentralised and spatially informed decision-making at the local level. Villages and small towns in India are weak in their institutional setup and capacities for planning are dependent on decisions, funds and political power at higher administrative levels.
Land Use Planning and Management Project
The relationship between rural and urban areas is changing and the rural-urban divide is fading, with increasing flows of people, goods and services between the two and the emergence of new migratory and livelihood patterns. This is driven in part by high urbanisation rates in many developing countries, and particularly by urban growth in the continuum of rural areas with villages, towns and cities of fewer than 500,000 inhabitants. Boundaries between rural and urban areas are becoming less distinct, and urban and rural characteristics and activities can lead to diverging territorial needs and divides between governance functionalities.
Realising the full potential of these blurred boundaries is a challenge for policymakers and planners. Spatial planning and integrated land use management can be used as mechanisms to prevent negative consequences of the aforementioned current spatial developments, on the one hand, and on the other, to promote integrated development and equal distribution of wealth and living standards across the country. As spatial planning in India is still mostly limited to the urban agglomerations, the cooperation project of Department of Land Resources (DoLR) and Deutsche Gesellschaft für Internationale Zusammenarbeit (GIZ)—from hereon referred to as Land Use Planning and Management (LUPM) project—sought to address the need for another level of planning which encompasses both urban and rural. Consistent and systematic spatial planning at the regional level is an important contribution to address the increasing spatial complexities of the rural-urban linkage and unlocking the development potentials of urbanisation for rural areas.
While early initiatives have already been made, regional planning examples are still limited in India. The LUPM project started with the attempt to analyse experiences and different approaches of regional planning in India, and on that basis develop a holistic land use planning policy for two selected states of Tamil Nadu and Odisha.
Having initiated a series of spatial planning activities at all levels, including state, regional, district, municipal and village level, a striking evidence was found in all the cases: Realistic planning, addressing the real trends and prevalent issues in the respective regions, is only successful when the process of plan preparation is embedded in the day-to-day decision-making
INTRODUCTION
14REGIONAL PLANNING FOR SUSTAINABLE LAND USE IN INDIA
of governments, local administrations and communities. Therefore, mere participation from a bureaucratic point of view does not serve its real purpose if the mode of participation is not linked to the daily business of those who are participating. At the policy level, this means that existing policies and their applications are to be analysed and incorporated in the formulation of a new policy. At the community level, the preparation of land use plans has to start with the activation of the community, general opinions and interests must be formulated in a “goal-free” approach before getting down to perspective land use scenarios. Spatial planning is a discipline which shows that effective democracies always start at the people’s level, which stand above all others. Challenges and opportunities at the local level, formulated in local land use plans are the essential information base for regional plans. Real public participation can be ensured only through community participation for the development of local land use plans.
In Odisha, a regional level spatial land use plan for Ganjam district and another local level spatial land use plan for Hinjlicut peri-urban area within the same district were prepared in a participatory manner. The two demonstration plans show their inter-connectivity by aligning community perspectives to the broader district and state visions, thereby linking back to an inclusive land use policy. The Government of Odisha attach importance to a complete involvement and feedback from all stakeholders in various land use matters at the state, district and local levels. Stakeholder working groups have been institutionalised in the government to innovate new ideas and solutions desired, and agree upon best implementation techniques.
Meanwhile, the Government of Tamil Nadu has already defined regions as per the Tamil Nadu Town and Country Planning Act. For one of the regions (comprising of the districts of Coimbatore, Erode, Tiruppur and Nilgiris), a comprehensive land use study has been made with the goal of defining broad land use zones. These zones will guide local authorities and line departments in preparing local plans and developing infrastructure. The zones also contribute to the protection of vulnerable areas and therefore help the regions in developing in a manner that there is balance with natural resources.
About the Publication
The increasing pressure on land due to high demand and inefficiencies in land use planning and management by the State is adversely affecting the environment and society. Therefore, this publication aims to build knowledge of the best (or optimum) ways to utilise land through spatial planning on a broader scale, i.e., a district or a region. It comprises twelve chapters authored by Indian scholars and professionals, who describe the role regional spatial planning can play in overcoming India’s social, economic, environmental, and infrastructure challenges.14 In this regard, the contributing authors discuss various issues of regional significance, and offer ideas to overcome the problems.
14 The draft chapters were initially presented in a conference on “Regional Planning in India: Policy, Planning and Implementation,” organised by ORF and GIZ on 15 November 2018 in New Delhi. Eminent subject experts subsequently reviewed these chapters and provided valuable comments for improvement.

15
Structure of the Publication
The chapters included in this compendium cover a wide range of subjects. These can be classified into two broad categories.
The first category (Section I) includes analysis of specific problems at the regional level, namely:Sectoral imbalances in Karnataka •Deprivation of tribal communities in India •Vulnerability of natural landscape in tourism areas of Tamil Nadu•Loss of land due to inundation in a Haryana village•Weak rural-urban linkages in Northeast India•Decline of small towns in India•Mobility gaps in India’s urban regions•
The second set of analyses (Section II) comprises a critical appraisal of current regional planning approaches and novel initiatives:
Mumbai metropolitan region•Bangalore metropolitan region•National capital region•State of Goa•Ganjam district, Odisha•
The following paragraphs describe the 12 chapters and their main recommendations.
Social, economic and infrastructure inequalities are prominent in Indian states. Ashok D. Hanjagi observes that although Karnataka is one of the leading states in India in terms of economy, infrastructure, natural resources and per capita income, it remains fraught with regional disparities. The author argues that there is a need to frame a regional development policy to address regional disparities as a specific problem and ensure equitable development.
Indian’s human deprivation index is alarmingly high. V. Srinivasa Rao explores this subject in the case of the country’s tribal populations. The accessibility of their regions, illiteracy, lack of human resources, the apathy of government officials, and the political influence of these regions, are some of the most crucial hurdles to the development of India’s tribal communities. The analysis shows that centralised policies and programmes are not producing desirable results for the development of tribal communities. It suggests the prioritisation of creating convergence across various regions to bring balance.
Inadequate planning for tourism activities is taking a toll on the natural and built environment. Sugato Dutt builds a case that changing lifestyles of an expanding middle-class, facilitated by policies that accelerate growth, have significantly promoted nature-based tourism and adventure sports. His assessment reveals the vulnerability of natural landscape in tourism areas of Tamil Nadu. In his view, it is necessary to integrate regional planning and local area planning to enable the continued growth of the tourism industry.
INTRODUCTION

16REGIONAL PLANNING FOR SUSTAINABLE LAND USE IN INDIA
Disasters cause havoc on land and disrupt people’s lives. Vinita Yadav describes the case of Hassapur village in Palwal District of Haryana where the entire territory was lost due to inundation. She learnt that while the relocation resolved the problem of land availability for residential use, it left socio-cultural and economic issues unresolved even after 40 years since the loss of territory. The author recommends that a village development plan be prepared and integrated with block and district development plan.
The current ‘pro-city’ paradigm of urban development in a monocentric urban system has not only reinforced regional disparity but also weakened the resilience of the regional economy. Benjamin L. Saitluanga makes the point that the weak linkages among cities, towns and their rural hinterlands have resulted in increasing peripheralisation of remote areas in Northeast India. The author calls for the application of a polycentric approach as a decision-making tool in the regional planning process.
Employment generation for low-skilled surplus rural labour has become a crucial challenge in India. Tathagata Chatterji suggests learning from South Africa’s innovative Spatial Planning and Land Use Management initiative, designed to improve livelihood opportunities of the rural poor through agriculture-led district planning. This involves development of small towns and their rural hinterlands, through an integrated spatial-economic planning framework.
It has become nothing short of an imperative to enhance mobility and reduce congestion, accidents and pollution in India’s urban regions. Using data from the Census of India 2011, Sabiha Baig studies the percentage share of urban commuters, modes of transportation used for commuting, and the average distances travelled. Her analysis shows that commuting among urban workers in India varies regionally whereby the location of economic activities and extent of diversification along with socio-cultural practices in the region shape the way and nature of commuting in terms of transportation modes used, distances travelled, and other variables. The author concludes that regional planning must take into consideration commuting patterns as they follow a particular regional pattern and are influenced by the urban form.
Regional disparities are deepening in India. In spite of various efforts of deciphering the growth impetus, the lopsided pattern of socio-economic and spatial development remains prominent. Aparna Phadke attempts to offer ideas for planning sustainable habitats. She argues that every spatial form has unique resource, social and cultural composition and economic organisation. Therefore, the scale of planning should be such that it can acknowledge such uniqueness. The author makes a case against planning for a huge region such as the Mumbai metropolitan region (MMR). Instead, the best-fit unit of planning in India would be the tehsil (an administrative division comprising towns and villages).
Planning for city-regions in India is effectively missing. Anjali Karol Mohan presents the case of Bangalore Metropolitan Region (BMR) in Karnataka to illustrate the use of the Land Capability framework—a GIS-based decision-making tool—using multi-criteria parameters to analyse the capability of land for which it is best suited. The output of the Land Capability Analysis is used to effectively address and incorporate the region’s natural resources in the physical and policy planning framework for development.

17
The unprecedented growth of metropolitan cities in India is a serious concern for the government. Rajeev Malhotra observes that the Regional Plan-2021 for India’s National Capital Region (NCR) offers sound policies and proposals to address this challenge. He concludes that the success of the plan is in the adoption and implementation of its policies and proposals by the participating States and concerned central ministries who were equal partners in its preparation and approval at various stages.
India’s coastal belt is unable to cope with the increasing developmental pressures due to tourism, which is causing environmental degradation. S. T. Puttaraju and Deepika Chauhan explain that the Regional Plan for Goa – 2021 will enable land use control and guide developments in the State. Some distinguishing characteristics of the Goa plan include digitising and directly co-relating all data at the subregional level to the land survey records and revenue data, identifying areas of ecological importance that should not be touched, and engaging with the communities for preparing a peoples’ plan.
Most parts of India remain excluded from any spatial planning framework or interventions except for some special areas and regions. Saswat Bandyopadhyay and Prasenjit Shukla attempt a studio exercise to address this grey area, using the case of Ganjam district of Odisha. The studio aimed to showcase the process in which a district plan should be prepared involving various stakeholders from the state, district and local level, including civil society.
INTRODUCTION

Abstract
Regional disparities occur globally, in varying degrees and across a multitude of regions. Per capita income, standard of living, energy consumption, transport, irrigation, finance, urbanisation, industrialisation, communications, education, and health are some of the important indicators for assessing regional disparities. Although Karnataka is one of the leading states in India in terms of economy, infrastructure, natural resources, and per capita income, it has not maintained a balance across development indicators. Moreover, infrastructure facilities and socio-economic factors play a vital role in developing regions. Therefore, their spatial distribution has to be analysed to assess the development of the region. The data for assessing the growth of industry and urban centres in the region has been collected, processed and analysed. This growth has been mapped and computed using statistical techniques and a GIS software package. There is great discrepancy between the northern and southern regions of Karnataka in terms of human population and infrastructure distribution. These regional disparities are largely an outcome of the way in which socio-economic systems and their processes work. As in many other areas of development, regional imbalances stem mainly from the failure of the planning process, which is constrained by the framework of mixed economy and the emerging pattern of distribution. This chapter highlights the role of “planned efforts” for reducing regional disparities and promoting growth for Karnataka.
Introduction
Owing to a wide diversity in physical (topography, soil, vegetation, etc.) and cultural (socio-economic, history) aspects, India has been facing regional disparities in growth indicators not only among states but also between districts within states. This regional disparity has resulted in shortcomings that are further impeding the planning process. This, in turn, has led to the need for addressing regional disparity through various channels, including commissions, policy makers, economists, planners, and politicians. The case of Karnataka has been used in this analysis to further underscore the exigency for sustained efforts in reducing regional disparities in India.
2An Assessment of Regional Disparities in Karnataka
Ashok D. Hanjagi
19AN ASSESSMENT OF REGIONAL DISPARITIES IN KARNATAKA
Objectives and Data Sources
The objectives of the study are: (i) to understand the magnitude of regional disparity in Karnataka; (ii) to highlight the measures taken by the government; and (iii) to suggest suitable policy alternatives. The article is based on secondary sources of data.
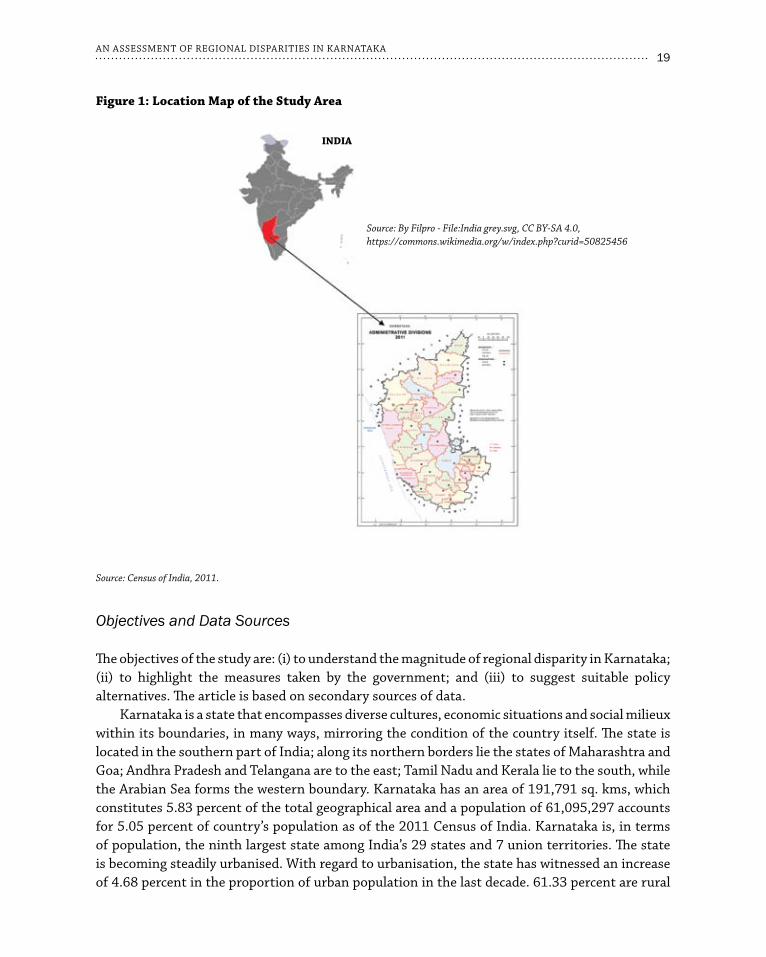
Karnataka is a state that encompasses diverse cultures, economic situations and social milieux within its boundaries, in many ways, mirroring the condition of the country itself. The state is located in the southern part of India; along its northern borders lie the states of Maharashtra and Goa; Andhra Pradesh and Telangana are to the east; Tamil Nadu and Kerala lie to the south, while the Arabian Sea forms the western boundary. Karnataka has an area of 191,791 sq. kms, which constitutes 5.83 percent of the total geographical area and a population of 61,095,297 accounts for 5.05 percent of country’s population as of the 2011 Census of India. Karnataka is, in terms of population, the ninth largest state among India’s 29 states and 7 union territories. The state is becoming steadily urbanised. With regard to urbanisation, the state has witnessed an increase of 4.68 percent in the proportion of urban population in the last decade. 61.33 percent are rural
Figure 1: Location Map of the Study Area
Source: Census of India, 2011.
INdIA
Source: By Filpro - File:India grey.svg, CC BY-SA 4.0, https://commons.wikimedia.org/w/index.php?curid=50825456
20REGIONAL PLANNING FOR SUSTAINABLE LAND USE IN INDIA
residents and 38.67 percent are urban residents.1 A larger proportion of its population lives in urban areas, as against the countrywide average. The state government has also been taking proactive measures to address the regional imbalances in development, making for a compelling case study in terms of remedial suggestions for the country.
Results and Discussion
Karnataka state is on a mission to promote faster and more inclusive growth. This is evident from the achievements in various key economic and social sectors, particularly through its implementation of inclusive programmes and policies. In the last five years Karnataka state has put a great deal of effort into accomplishing speedy growth through investments in agriculture and allied activities, industry, exports, rural development, urban development, natural resources, employment, infrastructure, human development, and gender and social equity. But, the growth has not been always been inclusive, with 25 percent of the state’s population living below the poverty line and a sharp north-south divide existing in the state.2
The regional imbalances within a state are more crucial than those between it and other states from the perspective of “inclusive development”. Among the regions, the Hyderabad-Karnataka area (Gulbarga Division) continues to be the most excluded and deprived area in Karnataka.3 The inhabitants of the area are then forced to migrate to relatively developed regions of south Karnataka, particularly Bengaluru, to earn their livelihoods. Regional disparity within the state in terms of human development, imbalances in income level, land use/land cover, irrigation, crop intensity imbalance, imbalance in water and vegetation, and distribution of urbanisation and industry have been assessed in this study to recommend sustainable solutions.
(i) Disparities in Human Development
In the Dr. D.M. Nanjundappa Committee (2002) report, 114 out of 175 taluks in Karnataka were declared backward, of which 59 were in North Karnataka. In a further sub-classification, 26 out of the 39 “most backward” taluks were from North Karnataka. Besides that, 7 out of 8 districts that have a Human Development Index (HDI) lower than India’s HDI level of 0.621 are in North Karnataka, whereas all 7 districts of Karnataka that have an HDI greater than the state average of 0.65 are in south or coastal Karnataka, namely Bangalore Rural, Bangalore Urban, Dakshina Kannada, Kodagu, Uttara Kannada, Shimoga and Udupi.4, 5 It must be noted that “human development” is a broader concept than these HDIs, which only cover literacy, life expectancy (health infrastructure), and per capita income. Human development is multifaceted, encompassing various aspects including access, opportunities, and freedoms. Understanding this
1 Economic Survey of Karnataka 2018–19, Directorate of Economics and Statistics, Government of Karnataka, 2019.2 Ibid.3 Shiddalingaswami and V.K. Raghavendra, “Regional Disparities in Karnataka: A District Level Analysis of Growth and
Development,” CMDR Monograph Series No. 60, Dharwad, 2010.4 Karnataka Human Development Report 2005, Government of Karnataka, 2005.5 “Karnataka: A Vision for Development,” Karnataka State Planning Board, Government of Karnataka, 2008.

21AN ASSESSMENT OF REGIONAL DISPARITIES IN KARNATAKA
allows for a more accurate picture of development in any region. This would then reframe the idea of what “development” truly entails. To begin with, population density is very much linked with the utilisation of natural resources. See Fig. 2 for the population density of Karnataka.
(ii) Disparities in Literacy, Health Infrastructure, Child Development Index and Gender Inequality Index
The imbalanced human development at the Karnataka regional level reflects the disparity in literacy, health infrastructure, Child Development Index (CDI) and Gender Inequality Index (GII). The CDI is an index combining performance measures specific to children — education, health, and nutrition. Gender Inequality Index (GII) is an index for measurement of gender disparity that was introduced in the 2010 Human Development Report by the United Nations Development Programme (UNDP). According to the UNDP, this index is a composite measure to quantify the loss of achievement within a country due to gender inequality. It also highlights the areas where critical policy interventions are required.
According to the 2011 Census, there is a wide inter-district variation in the literacy rate, even though the variations over the years have reported a declining trend. During 2011, the literacy
Figure 2: Population density of Karnataka State
Source: Census of India, 2011.

22REGIONAL PLANNING FOR SUSTAINABLE LAND USE IN INDIA
rate improved in all the districts, but it varied drastically between the highest rate of 88.62 percent in Dakshina Kannada to the lowest rate of 52.36 percent in Yadgir, with a difference of 36.26 percentage points.6 This difference between the highest and lowest literacy rate across districts declined by 7.19 percent over the period 2001-2011, but inter district variations still persist (Figure 3).
There are also wide disparities in health infrastructure existing in the state. Data from Karnataka’s Health Department shows that the coverage of rural populations by primary health centres (PHCs) in districts with better health indicators such as Chikmagalur, Hassan, Dakshina Kannada, Mandya, Mysore, and Shimoga has improved compared to the vulnerable districts like Bagalkote, Gulbarga, and Raichur. In some North Karnataka districts like Bagalkote, Bellary, and
Figure 3: Literacy Rate of Karnataka
Source: Census of India, 2011.
6 Mohammed Ashfaq Ahmed and P.M. Honakeri, “Regional and Gender Disparities of Literacy Rates in Karnataka: Evidence from Census 2001 and 2011,” Indian Streams Research Journal 2, no. 3 (2012): 1–4.

23AN ASSESSMENT OF REGIONAL DISPARITIES IN KARNATAKA
Bijapur, the coverage of rural population by sub centres has actually deteriorated. A major factor in the continuing regional disparity is the number of surplus PHCs in the better performing districts, while there is a shortage of facilities in the backward districts.7
In the Census 2011 there are huge variations between districts with regard to the Child Development Index (CDI) and Gender Inequality Index (GII). The development of children below 6 years with a specialised focus on supplementary nutrition, and informal preschool education is essential for the development of a region. Karnataka should also aim to provide a safe and secure environment for the overall development of children in need of care and protection to fulfil its larger aim of improving its human development indicators (Figure 4).
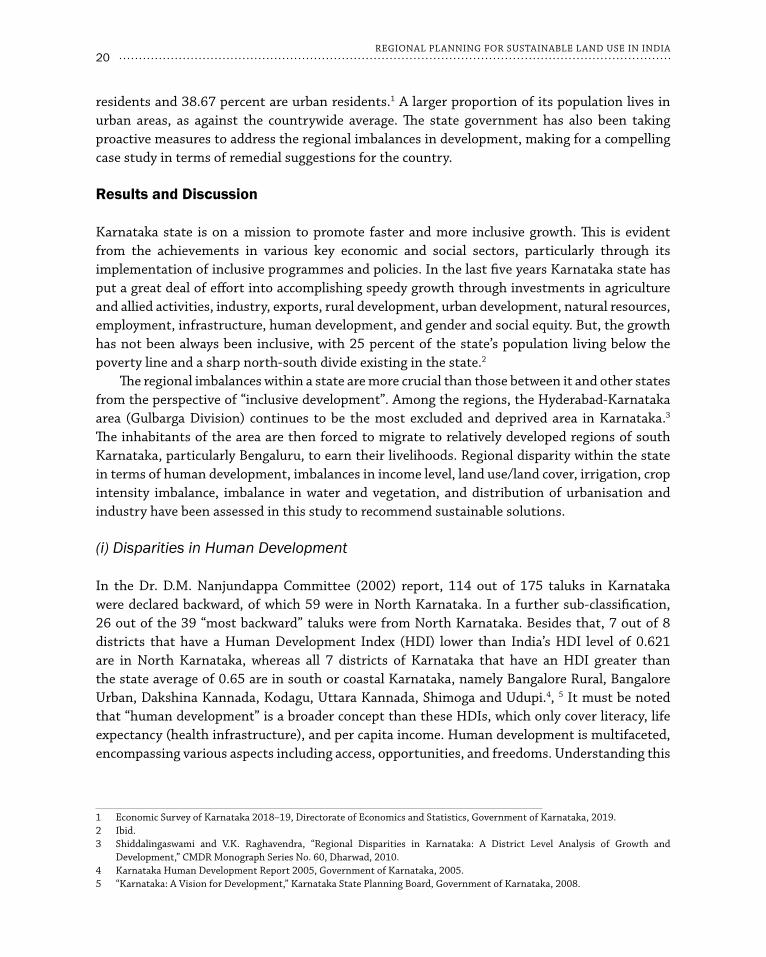
Gender equality and women’s empowerment are fundamental dimensions of human development. Gender gaps exist in capabilities as well as opportunities, and progress is still too slow for realising the full potential of half of humanity. The GII is a composite index that captures the inequality that many women face with regard to reproductive health, secondary education, political representation, and the labour market. Dakshina Kannada, Udupi, Kodagu, Hassan, and Chikmagalur districts have recorded amongst the highest sex ratios in the state. However, these states have also exhibited a greater amount of gender inequality as per the GII (See Figure 5 and Figure 6).
Figure 4: Child development Index, Karnataka
Source: Economic Survey of Karnataka, 2015-16.
7 Performance Evaluation Study of NRHM in Karnataka, Grass Root Research Advocacy Movement (NGO), Mysore, 2010.
24REGIONAL PLANNING FOR SUSTAINABLE LAND USE IN INDIA
Figure 5: district wise Sex Ratio, Karnataka
Source: Census of India, 2011.
Figure 6: Gender Inequality Index of Karnataka
Source: Economic Survey of Karnataka (2018-2019).
The gender gap within the development scenario in Karnataka has, of course, been gradually improving, with noteworthy signs of female empowerment and representation in areas like demography, life expectancy, household decision-making, and participation in Panchayati Raj Institutions. However, there are certainly still many areas like literacy, education, employment, and participation in high-level political spheres, where stark gender differences still prevail. These differences exhibit significantly high levels of female disadvantage factors (FDF) that need to be addressed with a greater focus on ensuring gender equality. The GII is high in the districts of North Karnataka. According to the 2011 Census, women comprise 49.31 percent of the total state population. The pattern is more or less same in most southern states of India. The percentage of scheduled caste (SC) women to total population is 8.53 percent (All-India 8.08 percent) and the percentage of scheduled tribe (ST) women to total population is 3.46 percent (All-India 4.29 percent). Creating opportunities for and access to development for women and children, particularly those who are disadvantaged, needs to be at the core of the nation’s human resource development efforts. The Women and Child Development Department of Karnataka formulates policies and programmes and coordinates the efforts of both governmental and non-governmental organisations to improve women and children. The department implements programmes in the areas of employment, training for women, awareness generation, and gender sensitisation. The Department has also taken up various programmes to ensure protection of women and children

25AN ASSESSMENT OF REGIONAL DISPARITIES IN KARNATAKA
against negligence, abuse and exploitation, and to guarantee their basic human rights. These programmes extend themselves to providing survival, development, and full participation in social, cultural, educational, and other endeavours necessary for their advancement and well-being. Another important facet to consider is the rights of non-binary people. The transgender community has been among the most neglected sections of society and there is a lack of adequate data about the community’s population, their occupation, and livelihoods, among other things. Their issues are unique and must not be relegated to the margins if gender equality is to be achieved.
(iii) Imbalances in Income Level
Gross State Domestic Product (GSDP) is the most important indicator in measuring the economic growth of any state, giving an overall picture of its economy. This enables policy makers, administrators and planners to formulate and appraise plans for balanced economic development. Analysis of this indicator at aggregate and disaggregated levels provides insights into patterns and sources of growth. In the Economic Survey of Karnataka 2018-2019, GSDP is defined as the “aggregate of the economic value of all goods and services produced within the geographical boundaries of the State, counted without duplication, for a specified period of time,” by convention, a financial year.
District income is a useful policy indicator to monitor the nature and degree of inter-district variations as well as disparities in the process of economic growth at the state level. Estimates of gross and net district incomes at current and constant (2004-05) prices for the year 2016-17 for 30 districts in the State, reveal that Bangalore Urban District stood first in total District Income as well as per capita district income for the year 2016-17. Bengaluru Urban District contributes 36.37 percent to GSDP at current prices followed by Dakshina Kannada (5.81 percent), and Belagavi (4.42 percent).8
At constant (2011-12) prices, the contribution of Bellari district to the primary sector GSDP was highest in 2016-17, due to a higher contribution in the mining sector. Bengaluru Urban district was at the top in secondary and tertiary sectors due to its high concentration of major industries and infrastructure facilities. A simple statistical indicator of inter-district variations in the levels of district income is the coefficient of variation. Figure 7 shows these computed values across the four divisions and at the State level.
Figure 7 indicates variations in gross district and per capita district income among the revenue regions (divisions) of Karnataka. The highest variation is evident with respect to Bengaluru division, if Bengaluru Urban District is included. Excluding Bengaluru Urban district, these inter-district variations in district income and per capita district income, are remarkably reduced at the division and state levels. The growing inter-district variation is an important indicator and a source of broader inter-regional disparities in the process of State’s economic development. However, a low coefficient of variation as such, does not necessarily imply either a higher or a lower district economic growth or regional disparity.
8 Economic Survey of Karnataka 2018–19, Directorate of Economics and Statistics, Government of Karnataka, 2019.

26REGIONAL PLANNING FOR SUSTAINABLE LAND USE IN INDIA
It can be observed from Figure 8 that the revenue region of Kalaburgi (comprising Ballari, Bidar, Kalaburgi, Koppal, Raichuru and Yadagiri districts), stood lowest in per capita income. Kalaburgi region’s per capita income is less than half the per capita income of Bengaluru region. This data clearly indicates that there are wide disparities in various economic indicators among districts of Karnataka.
(iv) Land Use/Land Cover, Irrigation, Crop Intensity Imbalance
Sustainable land management is a knowledge-based procedure that aims at integrating the management of land, water, bio-diversity, and other natural resources to meet human needs while sustaining livelihood.
Figure 7: Inter-district variation in Gross district Income
Source: Economic Survey of Karnataka, 2018-19.
Figure 8: division wise Per Capita Income
Source: Economic Survey of Karnataka, 2018-19.
27AN ASSESSMENT OF REGIONAL DISPARITIES IN KARNATAKA
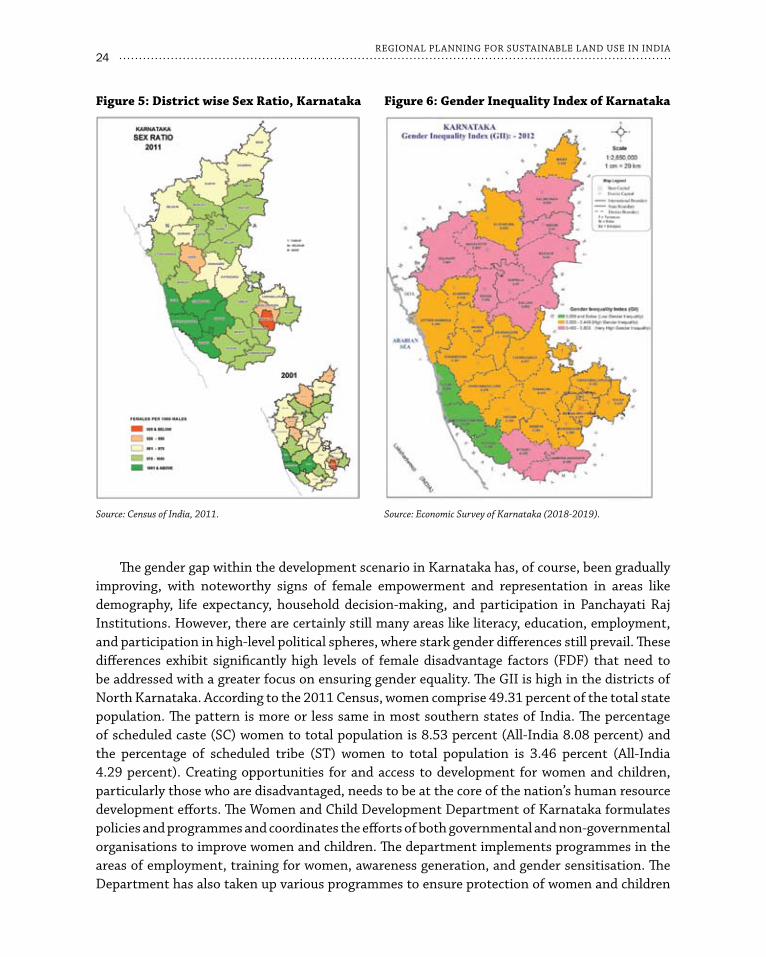
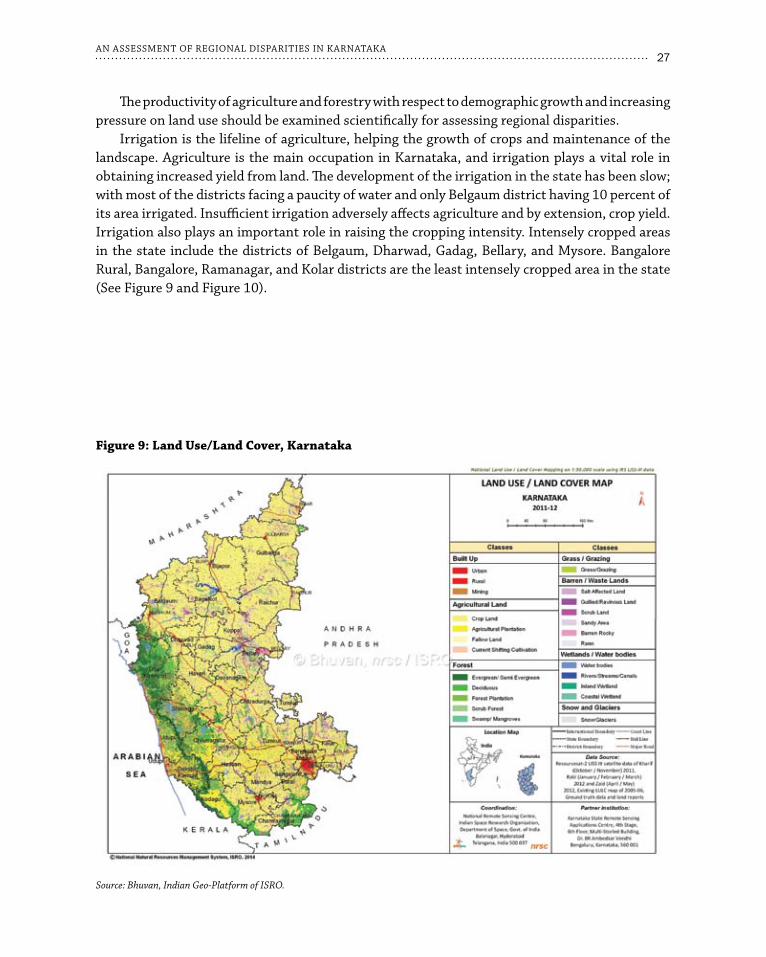
The productivity of agriculture and forestry with respect to demographic growth and increasing pressure on land use should be examined scientifically for assessing regional disparities.
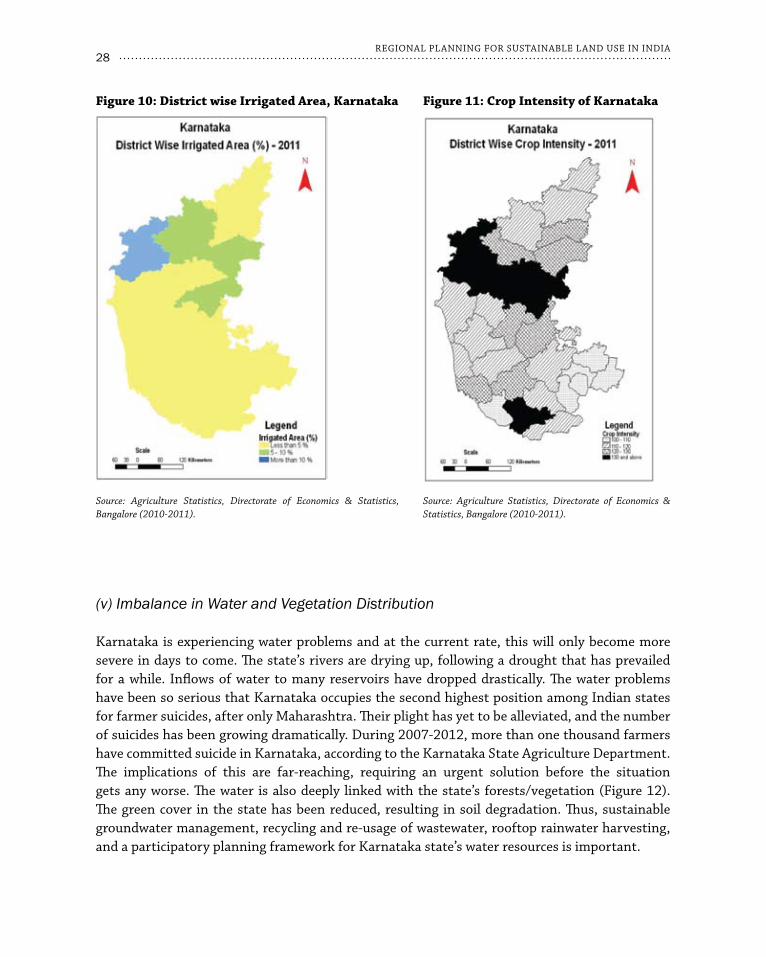
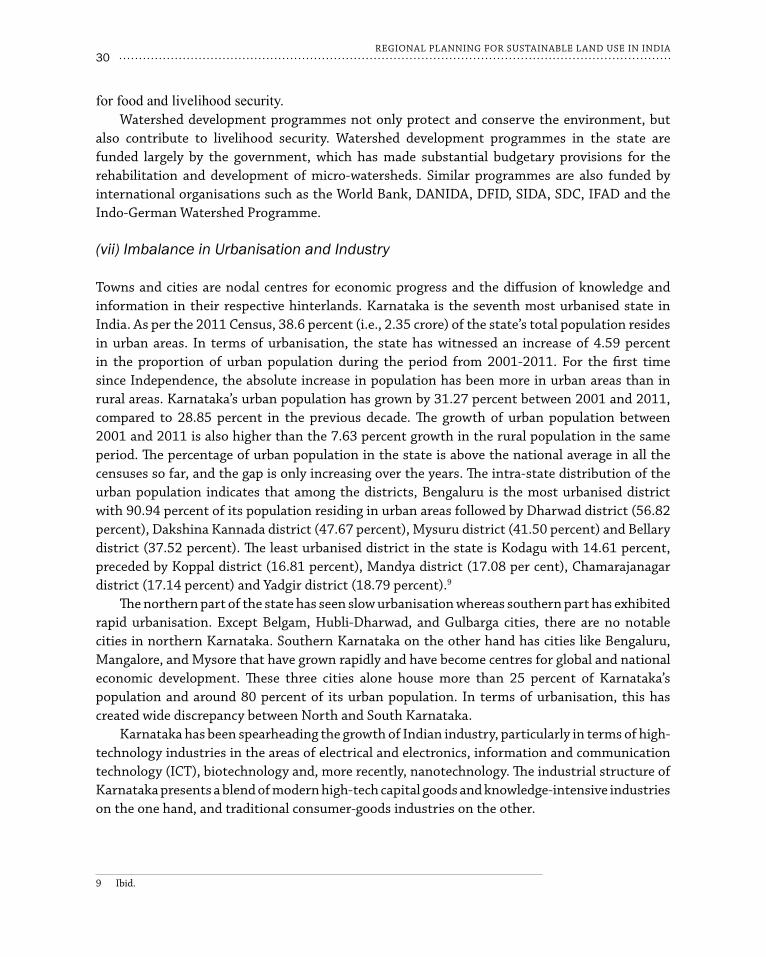
Irrigation is the lifeline of agriculture, helping the growth of crops and maintenance of the landscape. Agriculture is the main occupation in Karnataka, and irrigation plays a vital role in obtaining increased yield from land. The development of the irrigation in the state has been slow; with most of the districts facing a paucity of water and only Belgaum district having 10 percent of its area irrigated. Insufficient irrigation adversely affects agriculture and by extension, crop yield. Irrigation also plays an important role in raising the cropping intensity. Intensely cropped areas in the state include the districts of Belgaum, Dharwad, Gadag, Bellary, and Mysore. Bangalore Rural, Bangalore, Ramanagar, and Kolar districts are the least intensely cropped area in the state (See Figure 9 and Figure 10).
Figure 9: Land Use/Land Cover, Karnataka
Source: Bhuvan, Indian Geo-Platform of ISRO.
28REGIONAL PLANNING FOR SUSTAINABLE LAND USE IN INDIA
Figure 10: district wise Irrigated Area, Karnataka
Source: Agriculture Statistics, Directorate of Economics & Statistics, Bangalore (2010-2011).
Figure 11: Crop Intensity of Karnataka
Source: Agriculture Statistics, Directorate of Economics & Statistics, Bangalore (2010-2011).
(v) Imbalance in Water and Vegetation Distribution
Karnataka is experiencing water problems and at the current rate, this will only become more severe in days to come. The state’s rivers are drying up, following a drought that has prevailed for a while. Inflows of water to many reservoirs have dropped drastically. The water problems have been so serious that Karnataka occupies the second highest position among Indian states for farmer suicides, after only Maharashtra. Their plight has yet to be alleviated, and the number of suicides has been growing dramatically. During 2007-2012, more than one thousand farmers have committed suicide in Karnataka, according to the Karnataka State Agriculture Department. The implications of this are far-reaching, requiring an urgent solution before the situation gets any worse. The water is also deeply linked with the state’s forests/vegetation (Figure 12). The green cover in the state has been reduced, resulting in soil degradation. Thus, sustainable groundwater management, recycling and re-usage of wastewater, rooftop rainwater harvesting, and a participatory planning framework for Karnataka state’s water resources is important.

29AN ASSESSMENT OF REGIONAL DISPARITIES IN KARNATAKA
(vi) Watershed Development for Regional Balancing
The total geographical area of Karnataka is 190.50 lakh hectares, out of which 129.70 lakh hectares are available for watershed interventions. So far, 66.88 lakh hectares of rain-fed area has been brought under watershed interventions. The remaining area of 62.82 lakh hectares is due to be brought under scientific watershed interventions in a phased manner. Karnataka’s watershed development approach and subsequent interventions have been widely acknowledged for their effective implementation, community participation, and use of scientific tools. Scientific implementation of soil and water conservation programmes in the watershed area has resulted in several benefits such as reduction in soil erosion, improvement in ground water table, improvement in crop productivity, crop diversification, and enhanced availability of fodder, fuel, drinking water for domestic animals, and water for protective irrigation during critical crop growth period. Out of a total geographical area of 329 million hectares, 175 million hectares of land in India has been classified as “degraded”. Most of this area is rain-fed and prone to recurring drought. Further, about 65 percent of the net sown area in India falls into the category of “rain fed”. The purpose of watershed development is to rehabilitate and conserve the land and water resources in these areas
Figure 12: Vegetation Map of Karnataka
Source: Karnataka State Remote Sensing Application Centre.
30REGIONAL PLANNING FOR SUSTAINABLE LAND USE IN INDIA
for food and livelihood security. Watershed development programmes not only protect and conserve the environment, but
also contribute to livelihood security. Watershed development programmes in the state are funded largely by the government, which has made substantial budgetary provisions for the rehabilitation and development of micro-watersheds. Similar programmes are also funded by international organisations such as the World Bank, DANIDA, DFID, SIDA, SDC, IFAD and the Indo-German Watershed Programme.
(vii) Imbalance in Urbanisation and Industry
Towns and cities are nodal centres for economic progress and the diffusion of knowledge and information in their respective hinterlands. Karnataka is the seventh most urbanised state in India. As per the 2011 Census, 38.6 percent (i.e., 2.35 crore) of the state’s total population resides in urban areas. In terms of urbanisation, the state has witnessed an increase of 4.59 percent in the proportion of urban population during the period from 2001-2011. For the first time since Independence, the absolute increase in population has been more in urban areas than in rural areas. Karnataka’s urban population has grown by 31.27 percent between 2001 and 2011, compared to 28.85 percent in the previous decade. The growth of urban population between 2001 and 2011 is also higher than the 7.63 percent growth in the rural population in the same period. The percentage of urban population in the state is above the national average in all the censuses so far, and the gap is only increasing over the years. The intra-state distribution of the urban population indicates that among the districts, Bengaluru is the most urbanised district with 90.94 percent of its population residing in urban areas followed by Dharwad district (56.82 percent), Dakshina Kannada district (47.67 percent), Mysuru district (41.50 percent) and Bellary district (37.52 percent). The least urbanised district in the state is Kodagu with 14.61 percent, preceded by Koppal district (16.81 percent), Mandya district (17.08 per cent), Chamarajanagar district (17.14 percent) and Yadgir district (18.79 percent).9
The northern part of the state has seen slow urbanisation whereas southern part has exhibited rapid urbanisation. Except Belgam, Hubli-Dharwad, and Gulbarga cities, there are no notable cities in northern Karnataka. Southern Karnataka on the other hand has cities like Bengaluru, Mangalore, and Mysore that have grown rapidly and have become centres for global and national economic development. These three cities alone house more than 25 percent of Karnataka’s population and around 80 percent of its urban population. In terms of urbanisation, this has created wide discrepancy between North and South Karnataka.
Karnataka has been spearheading the growth of Indian industry, particularly in terms of high-technology industries in the areas of electrical and electronics, information and communication technology (ICT), biotechnology and, more recently, nanotechnology. The industrial structure of Karnataka presents a blend of modern high-tech capital goods and knowledge-intensive industries on the one hand, and traditional consumer-goods industries on the other.
9 Ibid.

31AN ASSESSMENT OF REGIONAL DISPARITIES IN KARNATAKA
Efforts initiated by the Government of Karnataka
The Government of Karnataka has developed several measures to address regional disparity in the state. As part of this endeavour, Hyderabad Karnataka Area Development Board (HKADB) came into existence in 1991, with the intention of providing additional assistance for the development of the most backward region of the state, which then comprised of Gulbarga, Bidar, Raichur, and Bellary districts. However, the impact of HKADB on regional development is negligible. Next, a major step taken by the government was the appointment of a High Powered Committee (HPC) on the redressal of regional imbalances. Popularly known as the Dr. Nanjundappa Committee, it submitted its report in June 2002. The Committee recommended policies for resource transfers, fiscal incentives and special programmes for the development of the 114 backward taluks in the State. The Committee also recommended establishing an appropriate institutional setup to accelerate the process of development in different sectors. The Karnataka government implemented one of the recommendations of the HPC for redressing regional disparity, namely, an eight-year Special Development Plan (SDP) in 2007-2008. It is unfortunate that disparity in Karnataka’s regional development has not decreased as expected during the SDP’s implementation period (2007-08 and 2012-13). Finally, in order to improve social and economic development of the state’s backward regions, the 118th constitutional amendment has facilitated Article 371 (J) that provides ‘Special Status’ from the Government of India to the Hyderabad-Karnataka Region comprising Gulbarga, Bidar, Yadgir, Raichur, Koppal, and Bellary districts.10 These are some of the measures adopted by the government to address regional imbalance.
Conclusion and Recommendations
A major constraint in the analysis of regional disparities within the districts of Karnataka is the non-availability of relevant data. This makes it necessary to generate data at the grassroots level, i.e. the taluk and Gram Panchayat level. The state government also has to collect and maintain data regarding the district-wise allocation of development funds. Since Gulbarga and Belgaum districts are less developed than Mysore and Bangalore districts, a substantial increase in budgetary allocations, especially to the districts of Hyderabad-Karnataka region, is required to bring about a significant transformation. The focus needs to be on education, health and nutrition, and skills development, along with the development of farming and other activities. Moreover, the formulation and effective implementation of development programmes tailored to the needs of the regions are required to meet their challenges. Article 371(J) may provide the necessary impetus for development of the region and it should be implemented systematically. No doubt, north Karnataka as a whole has to be taken care of but special attention should also be given to the poorer districts of south Karnataka.
To address the inter-district disparities in literacy rates, the infrastructure across educational institutions of the backward districts should be developed and the number of rural educational institutions has to be increased, providing easy accessibility for better enrolment rates. There is
10 Economic Survey of Karnataka 2013–14, Directorate of Economics and Statistics, Government of Karnataka, 2014.

32REGIONAL PLANNING FOR SUSTAINABLE LAND USE IN INDIA
also an urgent need for additional efforts in the area of public health in the northern districts. The focus of possible health intervention is to prevent and manage diseases, injuries, and other health conditions through surveillance of cases and the promotion of healthy behaviours, communities, and environments. Provision of good healthcare is an essential component for achieving overall socio-economic development.
The Karnataka State’s Industrial Policy 2014-19 aims at industrialisation in backward regions and also the development of industrial corridors and identifying potential locations to set up industries. It is essential to identify a spatial configuration of existing and future urbanisation in or near cities and along emerging urban corridors.
Finally, there is a need to frame a regional development policy to ensure equitable development. Regional disparities reflect the inadequacies of the development strategy that has been followed since Independence, and its failure to correct the distortions brought about by colonial rule. There is a need for a better understanding of the patterns of regionalisation, the nature of regional imbalances, and their changing structure over time. Development interventions must not only reflect suggestions to fill lacunae in existing policies, but also provide solutions for problems of the future. Balanced regional development is thus essential for Karnataka’s sustainable growth in the 21st century.
Nature-based Solutions
Physical and cultural drivers have been causing regional disparities. For example, climate change can result in less rainfall, drying up of rivers, decreasing vegetation, and loss of farmland due to soil erosion. Similarly, high population growth increases consumer demand and creates pressure on scarce resources. Such adversities lead to aridity and backwardness. For example, except for a few cities, many districts in the southern state of Karnataka display low levels of human development – health, education, and income. State government efforts have been largely unsuccessful. Smart interventions are needed for the development of agriculture and protection of forests. Geospatial technologies can help in sustainable watershed development. There is also a need to switch over to energy resources available in nature. Nature-based solutions can help in addressing regional disparities.

Abstract
How should India formulate regional plans with a development approach that mainstreams the interests of its tribal communities? The concept of ‘micro level plan’ (MLP) plays a pivotal role in this direction. The MLP is not a new concept and has been practiced by different agencies at the village, block and district levels. Communities are involved in preparation of these MLPs to identify existing resources that will address their issues at the grassroots. The issues identified in these MLPs are used by the states and central government in their programme design.
However, there are disparities in the development of these MLPs, given the regional peculiarities of programmes and laws seeking to address the issues. This paper discusses the importance of regional planning and suggests measures for the upliftment of the tribal populations.
Introduction
Since the global economic and political transition beginning in the late 1960s, the concept of “region” has been widely debated by scholars of the social sciences. Due to its multidimensional perspective, the “region” has emerged as a focal point in the planning process, and therefore “regional planning” has been a thoughtful subject in every developmental activity. As a result, the concept of “region” has become a subject for debate of various scales—from sub-nation to nation, and from country to continent.
How should “region” be conceptualised from the point of view of India’s aboriginal populations? How should the issues facing these communities be incorporated in regional planning?
A review of existing literature on the concept of “region”—and consequently, “regionalism” and “regionalisation”—has shown some agreement around the semantics. It has been articulated from social, political, economic, cultural, geographical aspects and therefore defined either in combination or any of the features such as a specific geographical closeness,1 mutual connection,2
3Regional Diversity and Planning in India: Issues around the
Upliftment of Tribal Communities
V. Srinivasa Rao
1 A. Hurrell, “Explaining the Resurgence of Regionalism in World Politics,” Review of International Studies 21, no. 4 (1995): 545–66.
2 J. Nye, “Patterns and Catalysts in Regional Integration,” International Organization 19, no. 4 (1965): 870–84.
34REGIONAL PLANNING FOR SUSTAINABLE LAND USE IN INDIA
common culture, homogeneous in character, physical location and geographical boundaries, shared governance principles, and mutual rights on common resources.
Mainstreaming Tribal Issues in Regional Planning: The Rationale
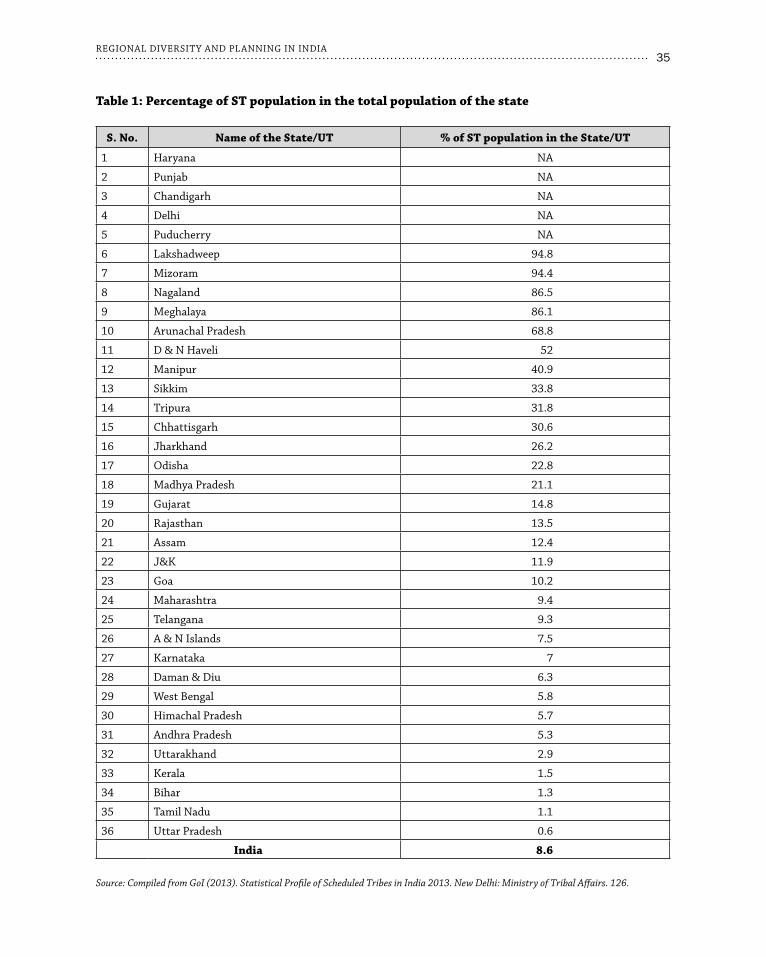
India’s tribal communities constitute 8.6 percent of the entire population, according to the 2011 census; this translates to around 11 crores. Indeed, India’s indigenous population is higher than that of the African continent.3 Therefore, their welfare should not only be a national priority, but also take its place in the global agenda.
India’s indigenous communities lag behind most other populations in terms of development indicators, such as literacy, access to health care, livelihood options, sanitation, the percentage of people living below the poverty line, and employment. They are largely excluded from basic services such as safe drinking water, food, and education. Compounding the problem is the variance across regions: their degree of impoverishment is hinged on their geographical location, as well as the intrusion of non-tribal people into their areas.
India’s indigenous tribes live in a belt along the Himalayas stretching through Jammu and Kashmir, Himachal Pradesh, and Uttar Pradesh in the west, to Assam, Meghalaya, Tripura, Arunachal Pradesh, Mizoram, Manipur, and Nagaland in the northeast. Another concentration lives in the hilly areas of central India, i.e., Madhya Pradesh, Odisha, and, to a lesser extent, Andhra Pradesh and Telangana. This belt is bounded by the Narmada river to the north and the Godavari river to the southeast where most of the tribal communities occupy the slopes of the region’s mountains. The other segments of tribals, i.e. the Santals, live in Bihar and West Bengal. There are smaller numbers of tribal people in Karnataka, Tamil Nadu, and Kerala, in western India in Gujarat and Rajasthan, and in the union territories of Lakshadweep, the Andaman & Nicobar and Dadra & Nagar Haveli Islands. Central Indian states have the country’s largest number of tribes, which is roughly 75 percent of the total tribal population in the country.
India’s regions are not homogenous, and they are identified based on social, economic, religious and administrative purposes. It is understood that the tribal communities of India are segregated and spread across different geographical locations and possess their own cultures, traditions, and livelihood patterns. If that is the case, how should India formulate—and implement—a uniform policy to address the diverse nature of issues confronting its tribal populations? To begin with, do India’s tribal communities require a uniform policy or a policy based on their regional requirements?
In the last 71 years, a single policy failed to address the manifold issues facing the country’s tribal groups. It is imperative to propose policies based on the regional requirements of the various tribal communities. Since the tribal regions are geographically scattered and their development varies from one region to another, the policy formulation shall also be addressed accordingly. In terms of literacy, for example, the tribes living in the northeast have achieved progress, whereas those in the central region are lagging behind. In this case, a uniform education policy may not
3 The concept of ‘indigenous’ has been used here in the global context. However, they are identified by the Indian Constitution as Scheduled Tribes.
35REGIONAL DIVERSITY AND PLANNING IN INDIA
Table 1: Percentage of ST population in the total population of the state
S. No. Name of the State/UT % of ST population in the State/UT
1 Haryana NA
2 Punjab NA
3 Chandigarh NA
4 Delhi NA
5 Puducherry NA
6 Lakshadweep 94.8
7 Mizoram 94.4
8 Nagaland 86.5
9 Meghalaya 86.1
10 Arunachal Pradesh 68.8
11 D & N Haveli 52
12 Manipur 40.9
13 Sikkim 33.8
14 Tripura 31.8
15 Chhattisgarh 30.6
16 Jharkhand 26.2
17 Odisha 22.8
18 Madhya Pradesh 21.1
19 Gujarat 14.8
20 Rajasthan 13.5
21 Assam 12.4
22 J&K 11.9
23 Goa 10.2
24 Maharashtra 9.4
25 Telangana 9.3
26 A & N Islands 7.5
27 Karnataka 7
28 Daman & Diu 6.3
29 West Bengal 5.8
30 Himachal Pradesh 5.7
31 Andhra Pradesh 5.3
32 Uttarakhand 2.9
33 Kerala 1.5
34 Bihar 1.3
35 Tamil Nadu 1.1
36 Uttar Pradesh 0.6
India 8.6
Source: Compiled from GoI (2013). Statistical Profile of Scheduled Tribes in India 2013. New Delhi: Ministry of Tribal Affairs. 126.
36REGIONAL PLANNING FOR SUSTAINABLE LAND USE IN INDIA
serve the purpose. Rather, an education policy based on the regional requirements may be more apt.
Tribal Upliftment: Why ‘Regional Planning’?
Earlier research4 by this author found that tribal identity is not singular across India. Their diversity is evident in their languages, health systems, livelihoods, cultures, geographical locations, gender relations, village settlements, and income-generation activities. How then can a uniform law help them address their diverse issues? Whatever acts or laws are made to address the tribal issues in India are uniform in nature. Except for the Fifth and Sixth Schedule to divide tribal India into the Northeast and the rest of the country, no effort has been made to address their issues in a community or region-specific manner. This division too was only to geographically segregate them for political purposes rather than to address their social and economic challenges. It is evident from the Indian tribal policy experience that no single piece of legislation can serve any real purpose considering the diversity inherent among the tribal communities in India.
Therefore, when it comes to planning for the upliftment of tribes in India, the policy should not focus on the diverse communities as a whole, but based on the specific characteristics and needs of the tribe. This would be possible only when the local natural resources and human capital are properly identified. Take for example the livelihood issue. The sources of livelihood are not uniform across the tribes and regions in India. These patterns change not only across regions or states, but from tribe to tribe. This is why micro-planning is more appropriate than macro planning.
Regional planning is important not only in the area of livelihood but also in others such as education, health, utilisation of natural resources, access to safe drinking water, and forest management, among many others.
Literacy
Widespread illiteracy is one of the major concerns among India’s tribal populations. Overall, even as India’s education policies set out ambitious goals, their implementation is lacklustre, given lack of political will and administrative ability. The problems are even more manifold amongst the country’s tribal populations, where education should play a crucial role.5 Tribal schools record high dropout and low enrolment rates. There is inadequate infrastructure and lack of trained teaching staff.6
Social marginalisation, exploitation and poverty are the main reasons for low literacy rates among tribes.7 The government of India recognised the importance of education and provided
4 V. Srinivasa Rao, Adivasi Rights and Exclusion in India (New Delhi: Routledge, 2019).5 Joseph Di Bona and R.P. Singh, “Modernity and Tradition in Indian Education,” in Education and the Process of Change, eds. Ratna
Ghosh and Mathew Zachariah (New Delhi: Sage Publication, 1987), 226–31.6 V. Srinivasa Rao, “Lack of Community Participation in the Sarva Shiksha Abhiyan: A Case Study,” Economic and Political Weekly 44,
no. 8 (February 2009): 61–4.7 V. Srinivasa Rao, “Problems of Tribal Education in Contemporary India,” Social Vision 2, no. 4 (Jan–Mar 2016): 85–94.
37REGIONAL DIVERSITY AND PLANNING IN INDIA
various provisions through Ministry of Tribal Affairs and Ministry of Human Resources Development. The Right to Education Act, 2010 has also been introduced to provide free and compulsory education to all children of below 14 years. The government has also launched more community-oriented education programmes such as Sarva Shiksha Abhiyan (SSA) to make the community and school teachers accountable to the school at the village level. On top of this, residential schools like Ashram Schools, Kasturba Gandhi Balika Vidhyalayas, Ekalavya Model Residential Schools have also been established in most of the scheduled areas. Succeeding governments have occasionally tried to launch community-oriented education programmes to bring the policy provision to the doorsteps of the tribal populations. However, most of them are not properly implemented due to lack of accountability at the level of school and community. To begin with, the community members are not aware of their roles and responsibilities as members in the school education management committee.8 Even teachers working in the schools located in scheduled areas are not properly oriented on the provisions of the education policies and programmes.
To attract more enrolees, the government of India has passed policy provisions for the establishment of schools within access to the tribal hamlets, and with at least one teacher from the tribal community.9 Monitoring at the ground level, however, is largely ineffective.
Malnutrition
The rates of malnutrition are high in most of India’s tribal populations, particularly among the children and women, and most severely in the inner and inaccessible tribal areas. It is an urgent policy imperative to raise the capabilities of tribal populations to access and buy food. Measures should be taken to make food affordable, and subsidies have to be provided especially to those families below poverty line. Safe drinking water should be made available, along with health care and sanitation,10 as these will all help tribal populations mitigate malnutrition. Even as they live in areas that are naturally endowed with resources like water, land, forest, and crops, scheduled tribes remain poorest in terms of food security and a balanced diet.11
The forests are the basic source of subsistence for India’s tribes. They cultivate forestlands by adopting shifting cultivation or slash-and-burn practices while ensuring the sustainability of their environment. During the British era, the tribal communities were restricted from using forest resources and agricultural land.12 Their lands were later appropriated by the landlords during the reign of zamindari and ryotwari systems.13 Attempts at redistribution of land to scheduled tribes failed in the post-independence period, even after the abolition of old land monitoring systems.
8 V. Srinivasa Rao, “Lack of Community Participation in the Sarva Shiksha Abhiyan: A Case Study,” op. cit., 61– 4.9 L.C. Jain, “Emancipation of Scheduled Castes and Tribes: Some Suggestions,” Economic and Political Weekly 16, no. 9 (February
1981): 325–32.10 Ch. Balaramulu, “Governance and Food Security Policies,” Journal of Public Administration LIX, no. 1 (March 2013): 55–6.11 K.C.S. Acharya, Food Security System of India, Evaluation of the Buffer Shocking Policy and its Evaluation (New Delhi: Concept
Publishing Company, 1983).12 M. Dilip Misal, “Tribal Development Policies in India: An Overview,” International Journal of Humanity and Social Sciences 5, no. 1
(August 2016): 81–3.13 Rahul Banerjee, “Adivasis and Unjust Laws,” Economic and Political Weekly 42, no. 39 (September 2007): 4010–011.

38REGIONAL PLANNING FOR SUSTAINABLE LAND USE IN INDIA
Since liberalisation in the 1990s, the government has also become the owner of most tribal lands—these territories were used for the construction of huge dams, national parks, wildlife sanctuaries and private companies.14 It is estimated that nearly 40 percent of all those displaced by government projects across the country are tribal communities: a person belonging to a tribal group is five times more likely to be forced to sacrifice their land compared to a non-tribal.15 For example, the non-tribal leaders, especially in some of the regions of Odisha and Chhattisgarh, have signed a series of leases with mining companies allowing those entities to dispossess tribal communities of the land they have owned and cultivated across generations. These lands are rich in natural wealth such as iron ore and bauxite.16 As rightly commented by then Prime Minister Manmohan Singh, the tribal communities were not given a stake in the modern economic process, resulting in their over the decades.17
To undo these and other historical injustices that have been imposed on the country’s tribal populations, the government has introduced a series of policies and programmes meant for their upliftment. The Forest Rights Act, 2006, for example, aims to protect forest-dwelling scheduled tribes and traditional forest dwellers. The gram sabha at the village level is mandated to implement this law, along with various departments such as revenue, forest, and tribal welfare. The involvement of multiple departments and officials in the implementation of this Act has posed challenges to its implementation. Moreover, the guidelines issued by the central government were not properly disseminated to the concerned authorities; as a result, there is great confusion on the ground.18
To be sure, this is not entirely a new phenomenon when it comes to implementation of government programmes in the tribal areas. Verrier Elwin, who was heading a committee constituted by the government of India to examine the implementation of government schemes in tribal areas immediately a decade after independence, found that the officials were “lacking in any intimate knowledge of their people [and] had very little idea of general policies for tribal development…. There was a tendency for an official to regard themselves as superior, as heaven-born missionaries of a higher culture.”19 Therefore, it is important to not only make policies, but to nurture political commitment.
Regional Diversity of India’s Tribal Communities
It cannot be overemphasised enough that India’s tribal communities are highly diverse in culture, language, geographical location, and livelihood. In Maharashtra, for example, the proportion of agricultural labourers in the tribal community are less in Thane district as compared to that
14 Jagannath Ambagudia, “Tribal Rights, Dispossession and the State in Orissa,” Economic and Political Weekly 45, no. 33 (August 2010): 60 –7.
15 W. Fernandes, “Development-induced Displacement and Tribal Women,” in Tribal Development in India: The Contemporary Debates, ed. Govind Chandra Rath (New Delhi: Sage Publication, 2006).
16 Ramachandra Guha, Democrats and Dissenters (Gurgaon: Penguin Random House India, 2016).17 V. Srinivasa Rao, Adivasi Rights and Exclusion in India, op. cit.18 Anirban Roy, “A Critical Appraisal of Forest Acts and Policies in Colonial and Post-Colonial India with Emphasis on ‘Forest Rights
Act- 2006’,” Asian Journal of Science and Technology 8, no. 9 (September 2017): 5501–505.19 Ramachandra Guha, op. cit.
39REGIONAL DIVERSITY AND PLANNING IN INDIA
in Dhule. Every district has its own problems according to the proportion of their population, climatic conditions, land structures, and livelihood patterns.20 It is similar in Gujarat: the tribes in the eastern region are concentrated at mountain tracts and forest, and their main occupation is shifting cultivation. Political negligence, social and economic isolation are some of the main reasons behind stratification among tribal communities in Gujarat.21
Regional Convergence and Tribal Upliftment
The regions play a crucial role in the development of the economy, and India’s regions are highly diverse. In the context of policymaking for the upliftment of the country’s tribal populations, it is necessary to achieve regional convergence; the way forward begins with micro-level analysis. Regional convergence is more important in order to share resources. Convergence of the available natural resources in tribal areas for their development is a crucial aspect in the programme implementation. Involving these tribal communities in their own developmental activities by making them stakeholders in their own resources may result in better outcomes.
Regional convergence ensures sustainable development. Regional planning must include equity strategies and collaboration of people on their regional issues. Sustainable development includes focusing on education skills and workforce skills, developing housing infrastructure in the region, transportation and subsistence wage rate. When low-income communities get the minimum benefits for their livelihood, it brings social equality and long-term subsistence level of living.22 Planning requires systematic coordination and organising people and institutions. The formation of regional bodies or committees and ensuring regular participation of the members in meetings enables greater outcome.
Conclusion
India’s tribal populations continue to be deprived of the same development that is already occurring in many regions across the country. Over the years, the centralised policies and programmes have not yielded significant results for these communities. An important step, moving forward, is to decentralise policymaking for the tribal populations. This is an urgent imperative, given that in many cases, the tribal groups are already endangered: their population is steadily dwindling, and they might be wiped out if proper steps are not initiated by government.
Tribal regions face a multitude of constraints in nurturing and implementing development programmes, including their remoteness, high rates of illiteracy, lack of human resources, and the apathy of government officials.
Regional convergence and micro-level planning are some of the most important aspects of policymaking for the country’s tribal populations. Effective regional convergence strategies
20 S. Kulkarni, “Class and Caste in a Tribal Movement,” Economic and Political Weekly 14, no. 7/8 (February 1979): 465, 467–68.21 Pradip Kumar Bose, “Stratification among Tribals in Gujarat,” Economic and Political Weekly 16, no. 6 (February 1981): 191–96.22 Miriam Zuk and Karen Chapple, “Housing Production, Filtering and Displacement: Untangling the Relationships,” Institute of
Governmental Studies, Berkeley, 2016, accessed on 10 December 2018, https://www.urbandisplacement.org/sites/default/files/images/udp_research_brief_052316.pdf.

40REGIONAL PLANNING FOR SUSTAINABLE LAND USE IN INDIA
enable social equality, regional land use, ensures sustainability, creates a strong community, provides employment to the local people, enhances infrastructure, water management, integrated transport and implementing and effective monitoring of developmental activities. The utilisation of natural resources in tribal areas should be top priority, while involving the tribal communities in policymaking and programme implementation.

Abstract
In recent years, people living in India’s urban centres have experienced a marked rise in disposable incomes. The concomitant changing lifestyles of this expanding middle class have led to, among others, an increase in so-called “nature-based tourism” in the rural peripheries (i.e., seaside and hill resorts). These “peri-urban” spaces are challenging conventional approaches in spatial planning and are calling for more innovative strategies in land management. Meanwhile, factors such as constraints in local body funding, rising tourist influx, their unforeseen resource consumption trends, and the local community’s own perceptions of livelihood opportunities pose more obstacles to the execution of plans. They raise concerns on the sustainability of underlying ecosystems that are the basis for tourist-centered economies. Using the cases of Kodaikanal and Mammalapuram, both in the state of Tamil Nadu, as well as a literature review, this chapter examines these issues and suggests means to integrate plans of promoting tourism sector with ecological and socio-economic concerns.
Introduction
Tourism contributed a significant 9.4 percent to India’s GDP in 2017,1 with domestic travel alone accounting for some 88 percent of the sector. The industry, recognised as the world’s fastest growing, has recently diversified into different branches such as medical tourism, pilgrim tourism, business tourism, and even rural tourism. India’s liberalised economy has encouraged the country’s growing middle class to embrace new leisure pursuits, such as nature-based tourism and adventure sports.2 Activities such as hiking, trekking, parasailing and surfing, are finding their place in the emergent national tourism policy.3
4Sustaining Nature-based Tourism:
Spatial Planning Challenges in Tamil Nadu
Sugato Dutt
1 “Travel and Tourism Economic Impact, India 2018,” World Travel and Tourism Council, accessed 3 December 2018.2 D.S. Bhardwaj, Domestic tourism in India (India: Indus Publishing, 1998).3 “Draft National Tourism Policy 2015 for Comments,” Ministry of Tourism, Government of India, accessed 3 December 2018.
42REGIONAL PLANNING FOR SUSTAINABLE LAND USE IN INDIA
Tourism continues to be a growing industry given the marked rise in disposable income in India’s centres of urban growth; after all, a rise in income gives more opportunity for recreation and travel. Changing lifestyles for the country’s expanding middle class, facilitated by policies that accelerate growth in this sector, have promoted nature-based tourism and adventure sports. However, the rural periphery, often the destinations for this newly liberated urban traveller, continues to be characterised by inequities in access to basic amenities and a rapid decline in water and land-based resources for local citizens. The increasing impact of these uneven geographic patterns on the sustainability of natural resources in faraway seaside and hill resorts, compounded by a frenetic fluctuation in seasonal numbers, pose questions on conventional approaches and provoke innovation in spatial planning and landscape architecture.
Indeed, the variation in regional economic growth among the states in India, has been linked to the level of investments in infrastructure, e.g., in transportation, communications and power.4 Many Indian states, such as Tamil Nadu, are therefore investing in boosting infrastructural investments with a view to enhancing tourism prospects.5 As elsewhere in the world, there is a growing demand for hotels, air terminals, road connections, transportation, as well as parking bays, jetties and promenades in remote and previously underdeveloped locations.6
The tourist destination itself can be recognised as being in the distant “periphery” of the country’s urban “centre.” As such, the tourist spots are “peri-urban” in nature: they have the characteristics of both rural and urban areas. These peri-urban spaces exhibit a two-way flow of goods (the tourist’s holiday “experience”) and services7 (communications, transport, residential infrastructure, among others). Moreover, the peri-urban interface is institutionally complex, having to address a range of activities lying between rural and urban jurisdictions. Livelihoods therefore are constructed across rural and urban spaces, their values and land use forms.
Using two case studies from Kodaikanal and Mamallapuram, both in the state of Tamil Nadu, as well as available secondary data, this article examines India’s problems in spatial planning. It offers a theoretical framework in which the natural assets in combination with basic tourism infrastructure are considered a “common pool of resources.” It then reviews how a spatial planning approach can synergise with local level planning to conserve, maintain and regulate the growing tensions outlined that can be attributed to the difference between local and global/national/regional concerns.8 The paper concludes with specific recommendations for integrating plans for the tourism sector with ecological and socio-economic concerns.
4 Jeffrey D. Sachs, Nirupam Bajpai and Ananthi Ramiah, “Understanding Regional Economic Growth in India,” Asian Economic Papers 1, no. 3 (2002): 32–2.
5 Final Report on 20 Years Perspective Tourism Plan for Tamil Nadu 2003, Ministry of Tourism, Government of India, March 2003, accessed 3 December 2018, http://tourism.gov.in/sites/default/files/Other/tamilnadu.pdf.
6 Mansour Esmaeil Zaei and Mahin Esmaeil Zaei, “The Impacts of Tourism Industry on Host Community,” European Journal of Tourism Hospitality and Research 1, no. 2 (2013): 12–21.
7 Vishal Narain and Shilpa Nischal, “The Peri-urban Interface in Shahpur Khurd and Karnera, India,” Environment and Urbanization 19, no. 1 (2007): 261–73.
8 Angelique Chettiparamb and Huw Thomas, “Tourism and Spatial Planning,” Journal of Policy Research in Tourism, Leisure and Events 4, no. 3 (November 2012): 215–20.

43SUSTAINING NATURE-BASED TOURISM
Issues of Sustainability
Concerns on “the sustainability of underlying ecosystems” and the possible “erosion of their economic value” have simultaneously arisen in discourse on tourism in developing countries like India.9 This is particularly true of wildlife tourism, where there is a great need to integrate ecosystem management with economic concerns.10 Attendant concerns are poor solid waste or sewage management; and vehicular, air and sound pollution in settlements neighbouring tourist destinations.11
Sustainable development as a paradigm of economic growth builds upon the Brundtland Commission’s classic, Our Common Future which defines the phenomenon as that which “meets the needs of the present without interfering with the ability of future generations to meet their own needs.” Sustainable tourism may thus be defined as a form of tourism which can “maintain its viability in an area for an indefinite period of time”—in other words, tourism that is developed and maintained in such a manner and scale that it remains viable and does not degrade or alter the environment (human and physical).12
These essentially rural locations have been alluded to as “pleasure peripheries”13–products of economic forces and cultural values that characterise the metropolitan “centre.” The occupation of these sites by (temporarily) resident tourists, within infrastructure (hotels, resorts, homestays) generated by this relatively new service sector, provoke spatial imbalances or “tensions” that merit introspection especially by planners and policymakers.
The growing network of resort managers, travel agencies, and larger media houses attests to the influence of the “centre” on the flow of goods and services to such peripheries. This expands the geographic space of the “peri-urban” to well outside, indeed far away from, immediate city limits. This powerful network also redefines the rural-urban relationship, and comprises multiple actors and influences that characterise the changing globalised world. Understanding the “who” (actors), “what” and “why” (goals and problems) as well as “how” (courses of action) within this network holds promise in delineating a spatial planning framework in this regard.14
The essential issue is the sustainability of the same resources that appear to have made this enterprise possible. Irresponsible institutions trigger concern, as do unprecedented rise in customer demand and the fragility of ecosystems. It is imperative to study the manner in which a spatial planning framework can contribute to the effectiveness of tourism management, and its sustainability in the longer term.
9 Ravi Sharma and Prakash Rao (eds.), Environmental Impacts of Tourism in Developing Nations (India: IGI Global, 2018).10 Krithi K. Karanth and Ruth DeFries, “Nature-based Tourism in Indian Protected Areas: New Challenges for Park
Management,” Conservation Letters 4, no. 2 (2011): 137–49.11 Helen Briassoulis and Jan van der Straaten (eds.), Tourism and the Environment: Regional, Economic, Cultural and Policy Issues, Vol.
6 (Springer Science & Business Media, 2013).12 Richard W. Butler, “Sustainable Tourism: A State-of-the-Art Review,” Tourism Geographies 1, no. 1 (1999): 7–25.13 Tuner and John Ash, International Tourism: The Pleasure Periphery (London Constable, 1975).14 Helen Briassoulis, “Sustainable Development and its Indicators: Through a (Planner’s) Glass Darkly,” Journal of Environmental
Planning and Management 44, no. 3 (2001): 409–27.

44REGIONAL PLANNING FOR SUSTAINABLE LAND USE IN INDIA
Spatial Planning and Tourism
The tourism market
Nature-based tourism capitalises on natural assets. These natural assets, together with man-made resources, are considered as “background tourist elements”15 (BTEs) that characterise the location as a “tourist attraction” (Further discussion in the latter sections of this article). These BTEs serve a fundamental purpose for visitors who come for an experience that is different from their daily lives. The internet allows for the linking of destinations to the market promoters and the consumers, whose growing sophistication in tastes and preferences is in turn leading to newer market dynamics. In such a system, tour operators, tourists, and the locals form the varied user groups dependent on the BTEs.
Most studies show that Indian tourists comprise largely of professional, educated and middle-class people.16 These tourists have a choice of either budget hotels,17 nature camps, and wildlife resorts.
Increased tourist demand requires the management agencies (i.e., tourism development corporations) to spatially manage the seasonal flux that continues to increase from year to year. It remains relevant that demands continuously change in the tourism industry, bringing forth newer opportunities and clientele.
Changing patterns of tourism
Multiple actors and influences shape the patterns of tourism in a particular circuit (or “region”). Nature-based tourism now includes experiences such as bird watching, surfing, parasailing, and wildlife photography. Infrastructural and logistical requirements cover a wide range: campsites, resorts and accompanying equipment, tour guides, tour trails, and transport. Tourist destinations themselves witness a rise in local commerce, with the mushrooming of handicraft shops (beads, necklaces, other trinkets or as in the case of Mahabalipuram, stone carvings), food joints serving local cuisine (or as in the case of Kodaikanal, handcrafted chocolates). The influx of visitors has its concomitant problems, too, such as higher density of vehicles that compete for sparse space. Indeed, even as these local tourism-based enterprises have provided livelihood, they have also begun to choke the meagre land resources.18
The relative inability of local bodies (municipalities, town panchayats) to raise funds for civic services is an additional concern. This often results in roads in a state of disrepair, waterlogging, or improper sewage disposal. Moreover, the marginalisation of the original local economy—for example, fishing, farming, or woodcutting—leads to socio-cultural and socio-economic conflicts
15 Helen Briassoulis, “Tourism and Common Pool Resources,” in Handbook of Tourism and Sustainability, eds. C. Hall, S. Gosling and D. Scott (Routledge, 2015), 92–104.
16 “Indian Hospitality Trends and Opportunities Report 2018,” Hotelivate, accessed 3 December 2018, https://hotelivate.com/hotel-operations/2018tando/.
17 Ibid.18 Hari Babu, Shirley Susan and Dhanaraj Keezhara, The Dossier on Tourism: Issues in Tamil Nadu (Equations, 1997).

45SUSTAINING NATURE-BASED TOURISM
as well.19 Significantly, with growing congestion, trampled patches of grasslands, and increased waste, visitors tend to not have the most valuable experience and are discouraged from repeating their visit; this is an important example of the negative externalities of unsustainable tourism. These problems of congestion in the “tourism commons” are by no means peculiar to India and are defying solutions and challenging management strategies.
Evident, therefore, is the issue of “carrying capacity20” in its multiple facets—physical, social, ecological and economic. The tools of spatial planning such as zoning and the delineation of land use categories may be strategically used to plan the distribution of varied infrastructure (hotels, campgrounds, recreational areas, and parking spaces) in relation to ecologically sensitive elements such as woodlands, grasslands, salt marshes, mudflats, among others, thereby diverting the congestion from the main site and addressing the limits of varied carrying capacities. The development of appropriate infrastructure in less exploited areas will test the veracity of these new approaches to spatial planning. Local aspirations will also need to be incorporated into the otherwise economically appealing growth story of tourism.
There is no doubt that local managers need to know the changing demands in the tourism sector and their impacts on their business plans. To track market trends, their adoption by tourist clientele, the shift in their (socio-economic) profile as well as the impact these have both on the sensitive local ecosystems (lakes, grasslands, streams, sand dunes) and the local economy, an integrated mechanism will need to be developed. Such mechanism should use a set of suitable indicators to monitor the changes in the various facets of “carrying capacity” as outlined earlier. Drawing upon available literature, indicators for use intensity, ecological stress and local economic growth are suggested in Table 1.21 Their utility for monitoring and policy relevance are also indicated.
19 Harold Goodwin, “Local Community Involvement in Tourism around National Parks: Opportunities and Constraints,” Current Issues in Tourism 5, no. 3–4 (2002): 338–60.
20 Carrying capacity, a term borrowed from ecology, is defined as the number of people or animals an environment can support without undergoing degeneration.
21 Helen Briassoulis, “Sustainable Development and its Indicators: Through a (Planner’s) Glass Darkly,” op. cit.22 World Tourism Organisation, Indicators for Sustainable Management of Tourism Destinations (UNWTO E-Library), https://
www.e-unwto.org/doi/pdf/10.18111/9789284407262.
Table 1: Indicators for Spatial Use intensity, local economic growth and Ecological stress
SPATIAL USE INTENSITY ↓ LOCAL ECONOMIC GROWTH ↓ ECOLOGICAL STRESS ↓
Indicators22
→
Number of hotel beds per unit area (sq km);Footfalls per tourist site per month/year
Tourist arrivals/ native population;Growth/loss of job opportunities
Growth/loss in area of sensitive habitats (grasslands, sholas); Dissolved oxygen(in lakes, mangroves)
Monitoring utility i.e. what is monitored
In/adequacy of available infrastructure
Local benefits from tourism Site stress
Policy relevance
Decisions on expansion and/or dispersal of infrastructure
Decisions on support measures, training and other capacity-building measures
Decisions on ecosystem amelioration
*Note: Comprehensive indices on site stress or local economy may be developed from the above.Source: Indicators for Sustainable Development of Tourism Destinations, World Tourism Organization.
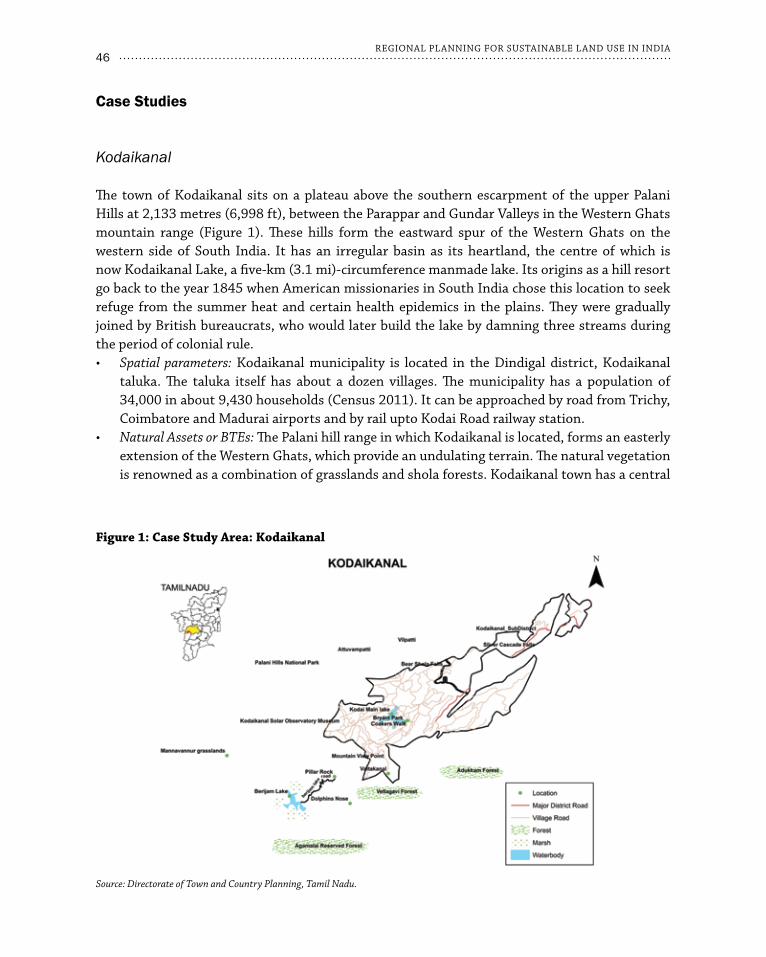
46REGIONAL PLANNING FOR SUSTAINABLE LAND USE IN INDIA
Case Studies
Kodaikanal
The town of Kodaikanal sits on a plateau above the southern escarpment of the upper Palani Hills at 2,133 metres (6,998 ft), between the Parappar and Gundar Valleys in the Western Ghats mountain range (Figure 1). These hills form the eastward spur of the Western Ghats on the western side of South India. It has an irregular basin as its heartland, the centre of which is now Kodaikanal Lake, a five-km (3.1 mi)-circumference manmade lake. Its origins as a hill resort go back to the year 1845 when American missionaries in South India chose this location to seek refuge from the summer heat and certain health epidemics in the plains. They were gradually joined by British bureaucrats, who would later build the lake by damning three streams during the period of colonial rule.
Spatial parameters:• Kodaikanal municipality is located in the Dindigal district, Kodaikanal taluka. The taluka itself has about a dozen villages. The municipality has a population of 34,000 in about 9,430 households (Census 2011). It can be approached by road from Trichy, Coimbatore and Madurai airports and by rail upto Kodai Road railway station. Natural Assets or BTEs:• The Palani hill range in which Kodaikanal is located, forms an easterly extension of the Western Ghats, which provide an undulating terrain. The natural vegetation is renowned as a combination of grasslands and shola forests. Kodaikanal town has a central
Figure 1: Case Study Area: Kodaikanal
Source: Directorate of Town and Country Planning, Tamil Nadu.
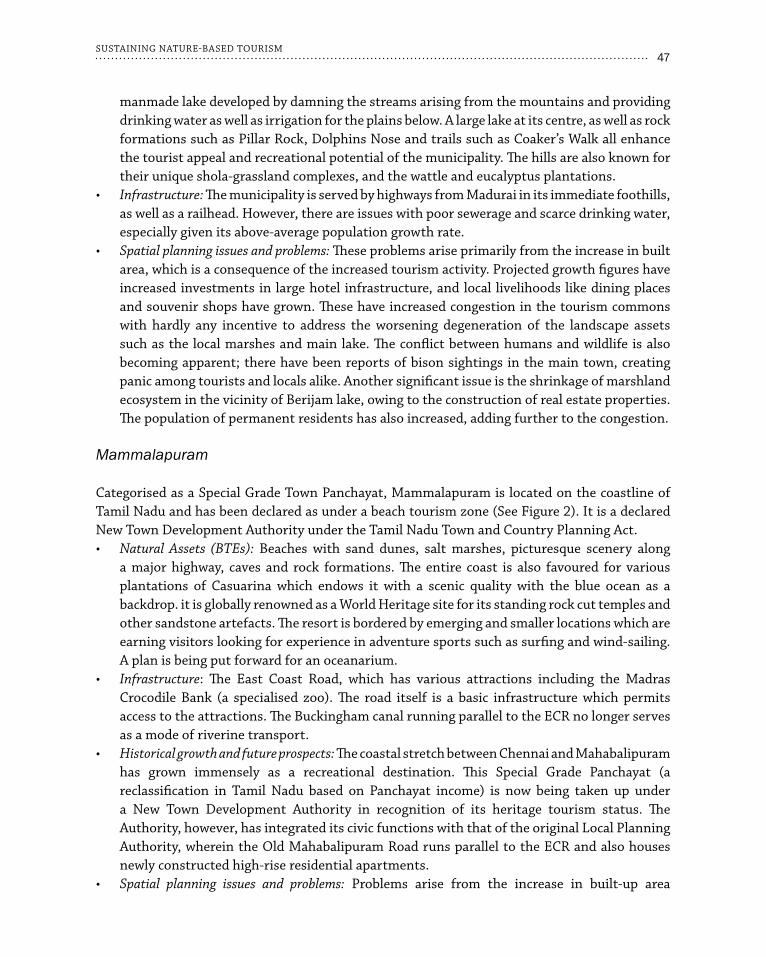
47SUSTAINING NATURE-BASED TOURISM
manmade lake developed by damning the streams arising from the mountains and providing drinking water as well as irrigation for the plains below. A large lake at its centre, as well as rock formations such as Pillar Rock, Dolphins Nose and trails such as Coaker’s Walk all enhance the tourist appeal and recreational potential of the municipality. The hills are also known for their unique shola-grassland complexes, and the wattle and eucalyptus plantations. Infrastructure:• The municipality is served by highways from Madurai in its immediate foothills, as well as a railhead. However, there are issues with poor sewerage and scarce drinking water, especially given its above-average population growth rate.Spatial planning issues and problems:• These problems arise primarily from the increase in built area, which is a consequence of the increased tourism activity. Projected growth figures have increased investments in large hotel infrastructure, and local livelihoods like dining places and souvenir shops have grown. These have increased congestion in the tourism commons with hardly any incentive to address the worsening degeneration of the landscape assets such as the local marshes and main lake. The conflict between humans and wildlife is also becoming apparent; there have been reports of bison sightings in the main town, creating panic among tourists and locals alike. Another significant issue is the shrinkage of marshland ecosystem in the vicinity of Berijam lake, owing to the construction of real estate properties. The population of permanent residents has also increased, adding further to the congestion.
Mammalapuram
Categorised as a Special Grade Town Panchayat, Mammalapuram is located on the coastline of Tamil Nadu and has been declared as under a beach tourism zone (See Figure 2). It is a declared New Town Development Authority under the Tamil Nadu Town and Country Planning Act.
Natural Assets (BTEs):• Beaches with sand dunes, salt marshes, picturesque scenery along a major highway, caves and rock formations. The entire coast is also favoured for various plantations of Casuarina which endows it with a scenic quality with the blue ocean as a backdrop. it is globally renowned as a World Heritage site for its standing rock cut temples and other sandstone artefacts. The resort is bordered by emerging and smaller locations which are earning visitors looking for experience in adventure sports such as surfing and wind-sailing. A plan is being put forward for an oceanarium. Infrastructure• : The East Coast Road, which has various attractions including the Madras Crocodile Bank (a specialised zoo). The road itself is a basic infrastructure which permits access to the attractions. The Buckingham canal running parallel to the ECR no longer serves as a mode of riverine transport.Historical growth and future prospects:• The coastal stretch between Chennai and Mahabalipuram has grown immensely as a recreational destination. This Special Grade Panchayat (a reclassification in Tamil Nadu based on Panchayat income) is now being taken up under a New Town Development Authority in recognition of its heritage tourism status. The Authority, however, has integrated its civic functions with that of the original Local Planning Authority, wherein the Old Mahabalipuram Road runs parallel to the ECR and also houses newly constructed high-rise residential apartments. Spatial planning issues and problems:• Problems arise from the increase in built-up area
48REGIONAL PLANNING FOR SUSTAINABLE LAND USE IN INDIA
resulting, in turn, from the growth in tourism activity. One serious issue is that the Coastal Zone Regulation which restricts the construction activity for about 200 m from the high tide line, has itself undergone revision in recent times. No expansion is permissible on the seaward side of the East Coast Road as well.
With regards to marine life, issues include the development of breeding grounds for the Olive Ridley Turtle with appropriate scientific expertise. In addition, rampant construction activity has impacted the coastal ecosystem which now suffers from erosion and saltwater ingress.
As with most other locations in India, urban growth through the southward expansion of Chennai city, poses a conflict with local rural development. A series of land use changes have emerged as the area gets converted from rural to urban.
Analysis
‘Spatial planning’ can be described simply as the planned distribution of people and activities in a given terrestrial space. In case of tourism circuits (physically a cluster of talukas or an assemblage of aesthetic landscapes in nature-based tourism) such regional economy is highly dependent on
Figure 2: Case Study Area: Mamallapuram
Source: Directorate of Town and Country Planning, Tamil Nadu.

49SUSTAINING NATURE-BASED TOURISM
seasonal tourist arrivals. Effective spatial planning, therefore, has the potential to forge regional goals or aspirations through enhanced business opportunities and employment generation, while giving direction to the physical distribution of infrastructural investments. In the case of nature-based tourism, the distribution of space by monitoring statistics on visitor arrivals, their budgetary concerns and their patterns of expenditure, will help determine the manner in which new infrastructure may be dispersed.
Zoning regulations, commonly practiced in urban planning, can be adapted to re-distribute the lodging and transportation infrastructure in accordance with the changing tourist footfall. Restoration of heavily used landscape elements can also be done through water recharge or vegetation restoration. Special thematic planning may be emphasised for water and solid waste management, including the development of scientifically managed landfills.
The issue of funding is crucial. While local body revenues have definitely increased from tourism, there is a need for a system of integrating central or state-level funding with local resources. This is particularly evident where enhancing infrastructure is concerned (e.g., transportation, road networks). Ecological restoration approaches (such as removal of exotic species, replanting grasslands) may incur high capital and recurring funds, as well as technical inputs which, again, require external assistance.
Emerging solutions:• Spatial planning promises to bring some order into the prevailing chaos brought about by the growth of the tourism sector (owing, in turn, to the growth in disposable income amongst the middle class). Lessons may be drawn from strategic planning, regional development plan approaches, and town planning in engaging with spatial planning for tourism. Various scholars note that tourism enterprises are said to be privately owned with a view to profit maximisation while town planning is a statutory and public sector activity undertaken for the public good.23 Town planners deal with tourism in peripheral ways. States themselves may contribute to tourism by laying out broad policies (e.g., tax concessions, waivers) that emphasise the growth of the industry. Funds may also be enhanced in shaping major infrastructure such as roads and airports. The State also engages with the market through its promotion policies. Local town planners, on the other hand, are charged with development control and regulation in this rapidly developing space.
As seen in Mahabalipuram, much of the “development” in tourist destinations has perhaps occurred in an uncoordinated manner and in unpredictable ways that may often be described as “unplanned” growth due to the challenges involved in coordinating infrastructure development and market changes in tourism. It is also probable that future predictions of the growth of the tourism sector are overly optimistic in their emphasis on the high-budget traveller.24 The expansion of the infrastructure will likely occur in the areas that remain outside the purview of Master Plan areas, i.e., Local Planning Authority areas as designated by the Town and Country Planning Act. Such being the case, it becomes more necessary to integrate Regional Planning and
23 Dianne Dredge and Stewart Moore, “A Methodology for the Integration of Tourism in Town Planning,” Journal of Tourism Studies 3, no. 1 (1992): 8–21.
24 Ministry of Tourism, Government of India, 2003.

50REGIONAL PLANNING FOR SUSTAINABLE LAND USE IN INDIA
Local Area Planning. This will enable the continued, sustainable growth of the tourism industry and ensure the welfare of the local populations as well.
Conclusion
Development planning remains centralised and mainly supply-oriented. India’s tourism sector, like in many other developing countries, has focused on infrastructure development, be it in the form of communication networks or air and road transport.25 There is a tendency to emphasise the benefit of increased foreign exchange from overseas visitors, leading to a proliferation of luxury hotels. Yet, these hotels have such low occupancy rates, that there is a need to review the tariff and taxation structure that may have artificially hiked the costs. Indeed, there is growing tourist preference for homestays and budget hotels, reflecting a shift in market demand and thereby a response from a different section of clients in this service-based industry.
As discussed earlier, the peri-urban space witnesses a two-way flow of goods and services between rural and urban. Both the case studies show that the flow of visitors into the destination is inordinately high and the local community participates only marginally, mainly as workers (manual labour or hospitality staff) in the tourism establishments. Nonetheless, in both cases, local entrepreneurship is emerging in the hospitality industry (for instance, surfing at Mahabalipuram, or candles and chocolates in Kodai). There is a growing trend in generating local employment in both locations.
Regional planning would need the integration of the various components of a tourism system. Power should be decentralised to local authorities to deal with problems of crowd congestion and environmental ruin. Indeed, if new initiatives such as the Grasslands complex at Mannavannur (Kodaikanal) and the surfing school (Mamallapuram) are any indication, sustainable local enterprise could grow further considering the growing appeal of these coastal and hill regions for tourism among the emerging middle class.
This article has examined the issue of sustainable and responsible tourism, the two main elements of the draft national tourism policy. It has outlined theoretical concepts in the growth of tourism and provided two case studies in how the tourism industry has developed in two scenic locales in Tamil Nadu. It has drawn on certain key aspects of sustainable tourism by emphasising both economic and ecological features in tourism management. It studied available literature on sustainable tourism in defining the course of such tourism and in elaborating the concept of regional planning in the context of tourism in developing countries. Conscious of the fact that mass tourism is extremely popular and only likely to grow further in the coming years, this article has proffered ways and means by which local planning could be integrated into regional planning to ensure the sustainable growth of tourism in the state of Tamil Nadu. These examples should then provide lessons to India’s other states.
25 Cevat Tosun and Carson L. Jenkins, “Regional Planning Approaches to Tourism Development: The Case of Turkey,” Tourism Management 17, no. 7 (1996): 519–31.

Abstract
The temporary or permanent submergence of land due to water inundation is a common occurrence in many parts of India. For instance, heavy rainfalls in Varanasi and Haridwar often lead to flash floods, submerging temples and houses located on the banks of the Yamuna. In extreme scenarios, entire territories are lost due to inundation, leaving people homeless and landless. As land is an important economic asset for people to rebuild their lives, in its absence, the recovery process becomes slower and more painful. Moreover, disaster-related risks are magnified when the legal framework does not provide any solution for inundated areas. In Hassapur village of the Palwal District in the state of Haryana, a great flood in 1968 resulted in the large-scale displacement of people who were then relocated to another area. This chapter uses the Hassapur village experience as a case study to explore the planning and governance issues arising out of inundation, and suggests possible solutions.
Development Discourse and Disaster
“Disaster risk” encompasses hazard and vulnerability, and its severity is inversely related to the capacity and preparedness of both communities and governments to handle risk. Disaster Risk Reduction (DRR) is closely linked to achieving the Millennium Development Goals, as disasters lead to environmental degradation, social decay and economic collapse, which, in turn, cause policy unsustainability. While underdevelopment directly increases social and economic vulnerability, development discourses suggest that climate change, global warming and tertiarisation, too, magnify susceptibility to risk by rendering all development lopsided.1 For example, rural families are dependent on rivers for their daily needs, such as drinking, bathing, washing clothes and cattle, and irrigation. The changing of a river’s course thus affects rural residents by either creating “no man’s lands” or forcing people to find new residence and agricultural land. It also creates ripples in the social and economic fabric of their rural typology. While the legal framework
5Development Discourse for an Inundated Space:
The Case of a Disaster-Affected Region
Vinita Yadav
1 A.E. Collins, “Disasters and Development,” in Routledge Perspective on Development (New York: Routledge, 2009).
52REGIONAL PLANNING FOR SUSTAINABLE LAND USE IN INDIA
helps in reducing the impact, it has limitations in certain “source-based” areas that have not been considered by legal experts, such as inundated, ecologically fragile regions. Thus, it fails to provide residents with an alternate “ecological economics” vision for generating livelihoods.
This chapter aims to understand development discourses in water-inundated areas, with the help of the current legal framework. It discusses how inundation occurs and affects the surrounding region, and then uses an affected area to study the impact of the disaster. Finally, the author offers suggestions for dealing with inundation and submergence to ensure minimal human and economic loss.
The first section of this chapter introduces the problem and describes the objectives of the analysis. The second section reviews existing literature. The last section discusses the case of Hassapur village, presenting the findings and the conclusion.
Disaster, Development and Displacement
Disasters and development are interconnected, affecting each other in many un-defined ways. Often, disasters due to development are concealed, as their onset is slow and rarely immediate. Scholars from different schools of thought categorise disasters differently. Some distinguish them based on whether they are natural, industrial or human, while others categorise them based on what they affect, e.g. water, land or people.2
“River meandering” occurs when, after floods, silt is deposited, causing the river to change its course. Human interference, riverbed construction and the blockage of natural waterways exacerbate the meandering, which would otherwise be contained within the catchment area. During floods, territories along the river are inundated, submerging settlements in the lowland regions. This phenomenon is experienced in many countries across the world, with increased frequency of flooding in the lower reaches of the Rhine in Europe and the Ganges in India. Territorial re-adjustments due to mass displacement can cause economic, religious and cultural conflicts. Furthermore, forest degradation has changed the rainfall patterns, and as a result, sea levels are predicted to rise by 20 cm over the next century. New areas are getting submerged, and the situation will only worsen in the coming years. The amount of water discharged in the fields also affects agriculture. Institutional failure to act in time adds to the misery of catchment inhabitants.
The results of inundation, including territory loss, must be understood in the context of administration and legal provisions and the resumption of essential services within the shortest possible timeframe, all of which require the availability of alternate land to resettle and rehabilitate the affected population. However, inundated regions are not specifically mentioned in the legal framework, and the relevant issues are not covered under any existing law.
By studying the case of Hassapur village, this chapter will explore the impact of inundation on people’s lives. To understand the situation at a village level, secondary data related to the population of the district, the block and the village were collected from the Census of India,
2 G.A. Tobin and B.E. Monitz, Natural Hazards: Explanation and Integration (New York and London: Guilford Press, 1997).

53DEVELOPMENT DISCOURSE FOR AN INUNDATED SPACE
2011. For disaster-specific information, the authors used data from the 2014 District Disaster Development Plan by the Department of Revenue and Disaster Management, Government of Haryana, to understand the impact of inundation on surrounding settlements.3 Consultations were held with stakeholders, i.e. the village panchayat head, gram sachiv and villagers,4 to understand the impact of inundation on a village and work out possible solutions.
One limitation of the study is the lack of any records of earlier settlements, which makes it difficult to assess the social, economic, psychological and cultural impact of inundation on a settlement. Moreover, the District Disaster Plan of Palwal for 2014 covers the district as a whole, and there is no disaggregated data for individual settlements.
The Case of Hassapur Village
A Vulnerable Community in an Inundated Region
Before discussing an inundated village, it is important to understand the history, land utilisation, administrative structure and disaster vulnerability of the block and district in which the village is situated. Palwal is the block where Mahatma Gandhi was arrested when he entered erstwhile Punjab, disregarding the ban imposed on entering the province. During land-pooling as per the Haryana Ceiling on Land Holding Act, 1972, 25 percent of the land was reserved for gaushalas, burial grounds, grazing land, and ponds, and the remaining 75 percent was allotted on lease in the month of May–June. In the district, the gram panchayat land has been reduced due to the increased allotment for playgrounds, schools, stadiums, panchayat ghars and electricity stations.
The Palwal district was previously a part of Faridabad and became a separate district in 2008. The last major flood in Palwal occurred in 2010, with some 13,924 acres of agricultural land damaged and families in some villages forced to flee due to high levels of water discharge in the Yamuna. The main cause of floods in the Palwal district is the Yamuna, which flows on the eastern side. During the monsoon, floods affect villagers located near the Yamuna and the Zahar drain, an offshoot of the Yamuna. There are three major drains around Palwal:
Gaunchi Main Drain •Ujjina Diversion Drainage System •Palwal City Eastern and Western Zone along the Gurgaon Canal•
Two catchment areas are catered by the Gaunchi Main Drain, which is on the right side of the Agra Canal, bounded by Hodal Uttawar Road in the Uttawar District of Gurgaon and the Ujjina Diversion Drainage System in the Hathin and Hodal Tehsil of the district. The Ujjina Diversion Drain outfalls into the Gaunchi Main Drain and then into the Yamuna. Thus, it can save the villages in the Hodal Tehsil and the areas along the Agra Canal and the Yamuna from inundation.
3 HIIPA, “District Disaster Management Plan 2014,” Department of Revenue and Disaster Management, Government of Haryana, 2014.
4 As part of a Focus Group Discussion (FGD).

54REGIONAL PLANNING FOR SUSTAINABLE LAND USE IN INDIA
The Gaunchi Main Drain overflows, causing the malfunctioning of link drains and leading to the overflow of water. When the Gaunchi Main Drain overflows, so does the Ujjina Diversion Drain, due to silting and the backflow of water during heavy rainfall, which floods the areas upstream of the Yamuna, submerging the nearby villages. The affected areas fall majorly in the Palwal Tehsil, and villages along the drain and the river remain submerged in water for more than two months. The communities living near the river—either along the river or on the embankment—are highly vulnerable during floods, and inundation makes them even more susceptible. Such submergence affects both human lives and livestock.
Hassapur village is located in the Palwal block within the Palwal district of Haryana. The village was inundated in the late 1960s and relocated in 1972. The relocation resolved the problem of land availability for residential usage but left the sociocultural and economic issues unresolved, even after 40 years.
Hassapur is one out of 82 villages and 65 gram panchayats. Due to the carving out of the Prithla block by a notification in 2012, the number of villages and gram panchayats was reduced from 124 and 102, respectively. A notification was issued earlier, but implementation happened only in January 2015. The following seven villages have become nagar parishads: Dholagarh, Kuslipur-I, Kuslipur-II, Ronija, Raipur, Sansawa, Kithwari. Hassapur has an area of 1,243 acres and a population of 1,562 people. The Thakurs and Rajputs (dominant caste) have about 150 households each; Harijans (marginal caste) have 50 households; other backward groups, such as Kumhars, have 10 households; and 10 households are of those living below the poverty line.
The hillock valleys and undulated terrains increase Hassapur’s susceptibility to floods. The main cause of floods is either heavy rains or the overflowing of the Yamuna from the Tajewala head. The Yamuna forms an eastern boundary, and a few hill torrents cross the whole district.
In the flood of 1968, Hassapur was submerged under the Yamuna and the river changed its course. At the time of the disaster, the village comprised 240 households, 3,000 people and 800 voters. The poor were worst affected, primarily due to the lack of social support and their inability to recover from the losses. Many were left homeless without any movable assets.
Approximately 90 percent of the people were engaged in agriculture. The entry of water in the fields increased the soil’s salinity, leading to decreased productivity. Moreover, the stagnant water resulted in crop loss, affecting the livelihood of many farmers and the overall farmer community. According to the 2015 woman sarpanch of the village, “The village got submerged in the late 1960s. The villagers were given only abadi (residential) land from the Kulena village. However, there was no land available for drainage and solid waste management.”5
In 1972, Deputy Commissioner Sarla Khanna provided land for residential purposes from Kulena Gram Panchayat, to those affected in Hassapur. Both Kulena and Hassapur were under the same gram panchayat since the total number of voters was less than 500. In 1982, the two were separated. In the month of March–April, out of the total 70 acres, 65 acres of shared land (shamlat jamin) was leased out through an auction, for INR 2,385,000. Out of 150 acres of Hassapur gram panchayat land, 18 acres of land had been given to Baghpur Khurd for sowing. The villagers from
5 As narrated during the FGD with the villagers.
55DEVELOPMENT DISCOURSE FOR AN INUNDATED SPACE
Baghpur Khurd refused to return the land, which led to a court case to reclaim the land from the villagers. After a long battle, the Hassapur Gram Panchayat won the case, but it is yet to obtain physical possession of the land. For the remaining 50 acres in the possession of Baghpur Khurd, the villagers won the case, leading to a loss of land for Hassapur gram panchayat, reducing their overall gram panchayat land.6
The disparity in land values is also an important factor during inundation. Kulena’s land is valued at twice that of Hassapur’s land. The reason for this difference is the location of the fields. In Kulena, fields are close to the residential areas, while in Hassapur, fields are located away from the residential areas. While the absolute distance between Hassapur’s residential areas and fields is only about two km, the distance by road is 15 km. Similarly, the Yamuna is only two km away from the village, but in the absence of any flyover at the nearest point, Hassapur residents are forced to use the flyover located 12 km away in Mohanpur. Villagers face hardships and incur higher costs of travel, having to commute at odd hours and multiple times a day. Those who do not own personal vehicles give their land on lease, as there is no public transport connecting residential areas to agricultural fields. Land values are further affected during the month of monsoon every year, especially in July and August. Due to the rise in water levels in the Yamuna, the surrounding fields, located about one km from the village, get submerged. The stagnant water leads to mosquito breeding and an increase in instances of diseases such as malaria and filariasis.
Most farmers in Hassapur are marginal farmers, with less than five acres of land. These farmers find it difficult to manage the fields due to a higher cost of management. Moreover, wild animals such as deer, wild pig and the neelgai frequently destroy the produce. The decline in profits coupled with the increasing cost of living affects the quality of life, forcing people to migrate to cities for better opportunities. Only the farmers who own more than five acres of land lead a comfortable life in the village.
In a resettled habitation, there is no thought given to the provision of land for public and semi-public facilities, such as religious centres; community centres; playgrounds for children; and infrastructure facilities, e.g. solid waste management or drainage.
“The village has taken land on lease by paying rupees 30,000 per year for a piece of farmland to accumulate water of stormwater drains. The gram panchayat money is getting spent on a service whose responsibility lies with the government. Else, it would have been used for health and education.”7
During resettlement, there is no space provided for banks, police stations and schools. For the Hassapur resettlement, the police station is located at a distance of 1.5 km. Since its opening, police corruption has increased in the form of demands of INR 500–1,000 under the pretext of fines, e.g. for flouting traffic rules. The resettled villagers have bank accounts in banks in other villages, e.g. Mohanna, Koteshwara Gramin Bank or Kisan co-operative bank.
6 Personal interactions with villagers, Hassapur, 3 February 2015.7 Ibid.

56REGIONAL PLANNING FOR SUSTAINABLE LAND USE IN INDIA
Provisions in the Regional Planning Framework
Disaster laws in Haryana have a provision to prepare a District Disaster Plan, which documents the history of disaster, the vulnerability of the district, persons responsible for disaster management and the evaluation plan. However, such a plan does not explain the basis of awarding compensation and does not provide the baseline information of the affected population for areas where floods are a cyclic phenomenon. In case of an inundated settlement, the resettlement policy should include the provision of land, funds for housing and livelihood options for the affected people.
In the inundated village of Hassapur, the legal framework has failed to provide solutions to basic problems such as drainage, solid waste management, water quality, and availability of schools and hospitals. Given the Yamuna’s proximity, water is available in abundance. However, the water quality is poor due to the absence of a water treatment facility. The underground water is polluted as well. While it is dangerous to use such water for drinking or even bathing purposes, people are forced to do so. The Yamuna’s water level has decreased by 60–70 feet, making it uneconomical for irrigation.
The District Disaster Plan also does not take into consideration essential requirements such as burial grounds. Since the gram panchayat only provides land for abadi, during the monsoon, villagers have to use the burial ground of Balai village. So far, residents of Balai have not objected to this.
Electricity for irrigation is supplied alternatingly: during the day for one week, then during the night the next week. However, at night, villagers find it difficult to water the crops due to the 15-km gap between the residential area and the fields, which leads to crop damage. Distance also prevents farmers from effectively saving crops from animals and hinders female involvement in farms, which, in turn, affects people’s social life.
In the Hassapur resettlement, there are two anganwadi centres, with two teachers, two helpers and one primary school, which employs three teachers. The standards of education in government schools are very poor. For example, only four students have passed the 10th standard, with the rest having to appear for compartment examinations. Many of the children are thus sent to private schools, e.g. Gold field, S.R. Modern, situated in Mohana, all of which are at least four km away. The fees vary between INR 600–900 and INR 2,500 per month, which most villagers are unable to afford. Moreover, people are not comfortable sending their daughters to schools in other villages, which often leads to early marriages. The high school in Amarpur, 1.5 km from the Hassapur resettlement, saw a higher dropout rate.
According to the women of Hassapur village, “Most of the girls are educated only up to [the] 10th standard and then married off. No one talks about female foeticide openly, but there was a recent case when a woman had gone to Bulandshahr, which is 50 km away. Around INR 4,000 is spent in getting an ultrasound done and INR 2,500 is needed for the treatment. The women do this to avoid the stringent laws against sex determination.”
Implications and Recommendations
While preparedness to handle the aftermath of disasters is important, it is preferable to prevent flooding in the first place. Thus, anti-flooding measures must be included in the regional planning
57DEVELOPMENT DISCOURSE FOR AN INUNDATED SPACE
toolkit to help the administration prevent such tragedies. One of the most common reasons for flooding is the clogging up of, or encroachment on,
natural drainage systems. These drainage systems must be mapped using the maps available in the Public Works Department. Surface water, and any changes in its course, must be tracked with the help of satellite images. Satellite data can also be regularly analysed using the geographic information system to monitor the course of the river. Engineering techniques can help plan the surface drainage system of the area to prevent flooding in the future.
Embankments often fail to hold water in areas where the water level is high and the velocity greater, leading to breaches. Thus, it is more feasible to construct such embankments in areas where both the flow velocity of the river and its water level are low.
For flood risk assessment, water levels must be continuously monitored. An alarm system to announce an increase in the water table height can be extremely useful so that an action team can be deployed as soon as the water level reaches a critical point. The role and responsibility of each of the member of the action team can be decided beforehand, to avoid the duplication of efforts and to ensure efficiency.
To reduce disaster threats, it is necessary to analyse environmental hazards and vulnerability at both macro and micro level. The disaster management plan provides information on emergency preparedness, e.g. escape procedures, critical procedures before evacuating the buildings, regular security drills, means of reporting disasters, medical team and contact details of responsible persons at the time of disasters. However, the current plan does not focus on the needs of the villagers, whose requirements are different from those of the urban residents within the same region. Urban residents, who contribute more to the Gross Domestic Product, are better equipped to cope with the aftermath of flooding disasters. Villagers suffer much more exponentially due to the administration’s apathy, who undermine their losses and take longer to respond to them. Thus, a village development plan, as per the 73rd Constitutional Amendment Act (CAA), must be prepared and integrated with the block and district development plan.
The District Development Plan does not contain a separate chapter on disaster-related issues. Most district disaster plans carry out analyses only at the macro level and fail to provide a detailed account of human and economic loss. They also do not factor in the emotional and mental distress faced by the survivors. The District Disaster Act must make it mandatory to collect, collate and interpret such information, so as to maintain a repository of real-time data and information that can help in policy formulation. The District Disaster Plan should be integrated with the District Development Plan for a comprehensive understanding of the disaster.
Risk assessment is closely linked with disaster reduction. Major disasters can only be understood with the help of varied expertise and knowledge.8 DRR requires the involvement of stakeholders such as politicians, village sarpanch, village sachiv, and the residents of villages and towns.
During flood-related inundation disasters, the focus should be on timely and effective response, which depends on the preparedness measures. However, in most situations, the response is only
8 A.E. Collins, op. cit.

58REGIONAL PLANNING FOR SUSTAINABLE LAND USE IN INDIA
initiated after the visit of a politician or an official announcement. A toolkit must be prepared to provide information about preventive measures and preparedness, which will help the District Administration initiate appropriate action at the time of disaster.
A number of villages in the river catchment areas have been provided with ring bunds to reduce flooding problems to a great extent. However, the construction of these bunds leaves much room for improvement. The poor construction quality results in frequent breaches and a high flow of water, wiping out villages in a shorter span of time. Since the villagers are caught unawares, they suffer more loss due to the lack of preparedness.
In inundation cases, the state government shall be mandated to use the latest provisions made by the Government of India, wherein the centre must meet 75 percent of the amount required for the State Disaster Relief Fund. If there is a shortage of funds, a claim can be made on the National Disaster Relief Fund, from which money is released only after the centre’s assessment.9
While preparing a disaster plan, occupants (regular or transient, with disabilities or elderly), buildings (the type of structure and function of the building, e.g. hospitals) and business activities in the buildings must be prioritised.10 Any disaster plan must include an evacuation strategy and a proposal for an alternate space that the residents can occupy in case of inundation.
There is scope for further research to study inundated areas and assess the damage and loss incurred by individual households during a major flood. Psychological stress must also be taken into consideration and a psychologist must be employed. A baseline study must be carried out for areas within 1,000 m of both sides of the river so that better resettlement and rehabilitation packages can be provided. Any disaster management plan for DRR should include the five Ps:
Places• affected by the disasterPeople• affected by the disasterPathway• to escape the disaster Politicians• as people’s representatives to provide maximum possible helpPerceptions• of people, politicians and officials to minimise risks
Additionally, it should:assess the probability of a disaster occurring in rural and urban areas separately, •audit the hazards and facility analysis to determine potential disasters,•assess the potential impact of a disaster in both urban and rural areas, and•identify limitations and constraints to resource availability for residents at the ward level in •urban areas and at the gram panchayat level in rural areas.
9 “Centre allocates Rs. 1,030 cr. to flood-hit AP,” The Hindu, 25 November 2015, http://www.thehindu.com/news/national/telangana/centre-allocates-rs-1030-cr-to-floodhit-ap/article7914224.ece.
10 J.F. Gustin, Disaster and Recovery Planning: A Guide for Facility Managers, 5th Edition (Lilburn: Fairmont Press, 2010).
Abstract
Northeast India, defined officially as a “peripheral region”, is one of India’s least urbanised geographies. Most of the towns are small and medium towns (SMTs) with less than 50,000 residents. These towns lack the adequate infrastructural and basic services to enhance their growth potential and many of them do not have proper administrative machineries. Moreover, the weak linkages among cities, towns and rural hinterlands have resulted in increasing peripheralisation of remote areas. The current “pro-city” paradigm of urban development in a monocentric urban system has not only enhanced regional disparity but also weakened the resilience of the regional economy. This article analyses the demographic, socio-economic and governance structures of urban centres in Northeast India. It argues for the adoption of a polycentric approach as a decision-making tool in the regional planning process. It also presents the roles of small and medium towns in the reduction of peripheralisation of remote rural areas.
Introduction
Regional development may be best described as “a process of multi-dimensional development within a particular area, a region.”1 The term “region” refers to those areas ‘in between’ the local and the global or the micro and the macro scales. The main purpose of regional planning or planning within regions, is to reduce regional inequality and improve national and regional prosperity through coordinated, inter-sectoral and decentralised approach.
The thought and practice of regional planning has long been dominated by two contrasting groups – the ‘metropolitanists’, who advocate sustaining the primacy of central cities, and the ‘regionalists’ who advocate for the decentralisation of the city and its functions.2 During the second half of the 20th century, the ‘growth centre’ approach was adopted in a number of developed
6Role of Small and Medium Towns in Regional Development:
The Case of Northeast India
Benjamin L. Saitluanga
1 John Glasson and Tim Marshall, Regional Planning (London and New York: Routledge, 2007).2 Robert Fishman, “The Death and Life of American Regional Planning,” in Reflections on Regionalism, ed. Bruce Katz (Washington,
DC: Brookings Institution, 2000), 107–26.

60REGIONAL PLANNING FOR SUSTAINABLE LAND USE IN INDIA
and developing countries.3 This approach has, however, failed to meet expectations. The relevance of small and secondary towns in regional planning has also declined considerably. Eventually, with increased global interconnections through global cities, the agglomeration of population and economic activities has resulted in positive externalities for economic growth, as posited by New Economic Geography (NEG).4 Large cities in the Global South, which are experiencing severe lack of amenities, services and housing, have also begun to be seen as “engines of growth” and “strategic sites for global integration”.5 All these have led to increasing metropolitan and capital city bias in the allocation of urban development funds.6
On the other hand, SMTs are in positions of disadvantage with not only limited support from both the national and state governments,7 but also little private investment.8 Poverty is higher in small and medium towns.9 They are seen as “in between” or “transitional” places and are merely regarded as “conduits through which rural resources, both material and human, flowed up the urban hierarchy to the core.”10 However, there is a late resurgence in the interest towards SMTs, which may be considered as a part of the move away from the “metrocentricity” bias.11
Recent studies in India have suggested that large towns and cities do not convincingly show that they are the drivers of economic growth.12 With limited jobs in the urban formal economy, except for the highly skilled jobs, leading to “exclusionary urbanisation”,13 the process of urbanisation in India is becoming dispersed–small towns have grown relatively faster in all the rich, medium and poor states during 2001 and 2011.14 It is now believed that SMTs can play a major role in the process of development by maximising their competitive advantages in manufacturing activities due to lower costs of production and living.15 They are also known to play a strong role in the
3 Amitabh Kundu, “Exclusionary Urbanisation in Asia: A Macro Overview,” Economic and Political Weekly 44, no. 48 (2009): 48-–8; Cecilia Tacoli, “Why Small Towns Matter: Urbanisation, Rural Transformations and Food Security,” Briefing, International Fund for Agricultural Development (March 2017), http://pubs.iied.org/pdfs/10815IIED.pdf.
4 Peter Lanjouw and Rinku Murgai, “Urban Growth and Rural Poverty in India: 1983–2005,” in Economic Reform in India: Challenges, Prospects, and Lessons, eds. Nicholas C. Hope, Anjini Kochar, Roger Noll and T.N. Srinivasan (New York: Cambridge University Press, 2014), 371–404.
5 Barbara Harriss-White, “Introduction: The Economic Dynamism of Middle India,” in Middle India and Urban-Rural Development: Four Decades of Change, ed. Barbara Harriss-White (Springer, 2016), 1–28.
6 Sama Khan, “Big City: Big Share,” Infochange, 22 July 2017.7 Sama Khan, “The Other Jawaharlal Nehru National Urban Renewal Mission: What Does It Mean for Small Town India?” in
Subaltern Urbanisation in India: An Introduction to the Dynamics of Ordinary Towns, eds. Eric Denis and Marie-Helene Zérah (New Delhi: Springer, 2017), 337–70; Partha Mukhopadhyay, “Does Administrative Status Matter for Small Towns in India?” in Subaltern Urbanisation in India: An Introduction to the Dynamics of Ordinary Towns, eds. Eric Denis and Marie-Helene Zérah (New Delhi: Springer, 2017), 443–72.
8 Amitabh Kundu, “Urbanisation and Urban Governance: Search for a Perspective beyond Neo-Liberalism,” Economic and Political Weekly 38, no. 28 (2003): 3079–087.
9 Peter Lanjouw and Rinku Murgai, op. cit.10 David Drakakis-Smith, Third World Cities (London and New York: Routledge, 1987), 62.11 Tim Bunnell and Anant Maringanti, “Practising Urban and Regional Research beyond Metrocentricity,” International Journal of
Urban and Regional Research 34, no. 2 (2010): 415–20.12 Basudeb Chaudhuri, Boishampayan Chatterjee, Mainak Mazumdar and Safayet Karim, “Income Ranking of Indian States and
their Pattern of Urbanisation,” in Subaltern Urbanisation in India: An Introduction to the Dynamics of Ordinary Towns, eds. Eric Denis and Marie-Helene Zérah (New Delhi: Springer, 2017), 91–118.
13 Amitabh Kundu and Lopamudra Ray Saraswati, “Migration and Exclusionary Urbanisation in India,” Economic and Political Weekly 47, no. 26–27 (2012): 219–27.
14 Chaudhuri et al., op. cit.15 Ibid.

61ROLE OF SMALL AND MEDIUM TOWNS IN REGIONAL DEVELOPMENT
diversification of rural economy16 and growth of towns matters more than that of cities in the reduction of rural poverty.17 They play an important role in the process of rural development by providing market facilities and services to the rural populations and by acting as linkages between villages and cities.
Northeast India is one of the least developed regions in the country. It is also the least urbanised region of India with only 18 percent of its population living in 414 towns and cities. It is a peripheral region as defined in terms of “distance, difference and dependence”.18 The peripherality of the region and the perceived homogeneity in cultural and geographical aspects has presented Northeast India as a single planning region to the imagination of the outside world. In 1972, the central government established a statutory body, the North Eastern Council (NEC) under the North Eastern Council Act, 1971 (as amended in 2002) to facilitate and coordinate development planning and maintain internal security in the entire Northeast India. The NEC has a dual role to play – develop the region and integrate the region. It was mandated in 2002 to become a regional planning body which has not yet been implemented. Unfortunately, the NEC has not yet succeeded in integrating the remote, enclosed and multi-ethnic region inhabited by tribes who often put ‘local’ before ‘region’ and ‘nation’.
The Northeast may also be seen as a fragmented and diversified region with each unit following different trajectories of development processes. For some, the term ‘Northeast’ has relevance only in the outside world, whereas inside, they are busy trying to carve out their own ethnic niches. In this region, ethnicity equates nationality and, regionalism arises when inequality exists among regions. This is particularly evident in the case of Mizoram, which may be divided into the northern Aizawl region and the southern Lunglei region. The latter, which was no less developed during the colonial period, has now developed regional tendencies due to rising disparity between the north and the south. Rising regional inequality has also led to demand for new districts in the state. Towns like Saitual, Khawzawl and Hnahthial have been fighting to become district headquarters by separating from their respective districts.
Overview of Urbanisation in Northeast India
As per the 2011 Census, only 18.3 percent of the entire population of Northeast India was found in towns and cities. This is far below the national average of 31.2 percent. All states except Mizoram have recorded a lower level of urbanisation than the national average. Internal variation in the level of urbanisation is profound within the region. The level of urbanisation in the region ranges from 14.08 percent in Assam to 51.51 percent in Mizoram (Figure 1). The latter is the second most urbanised state in India. In spite of low level of urbanisation, Northeast India has recorded
16 Eric Denis, Partha Mukhopadhyay and Marie-Hélène Zérah, “Subaltern Urbanisation in India,” Economic and Political Weekly 47, no. 30 (2012): 52–62.
17 John Gibson, Gaurav Datt, Rinku Murgai, Martin Ravallion, “For India’s Rural Poor, Growing Towns Matter More than Growing Cities,” Policy Research Working Paper 7994, Poverty and Equity Global Practice Group, World Bank, 2017.
18 Peter Flora, Stein Kuhnle and Derek Urwin (eds.), State Formation, Nation-Building, and Mass Politics in Europe: The Theory of Stein Rokkan (Oxford: Oxford University Press: 1999), 115.

62REGIONAL PLANNING FOR SUSTAINABLE LAND USE IN INDIA
a significant rate of urbanisation after Independence. The level of urbanisation in the region was only 4.45 percent in 1951 while India had recorded 17.3 percent. It may also be pointed out that Nagaland has registered the highest decadal growth rate in the country with 65 percent in the 2011 Census, while the corresponding figure for the national average was only 21 percent.
Urbanisation in Northeast India largely corresponds to expansion of administrative functions. Administrative capitals with more functions and functionaries became proportionately bigger than other towns and most of them ended to become primate cities. These large cities have contributed more than 30 percent of urban population in the region. Currently, there are 12 cities in the region as per the Census of India classification of urban centres (See Table 1). There is no million city although Guwahati, with 0.9 million population, is expected to become one by 2021.
The growth rates of cities or class I towns as well as their percentage share have been declining since 1991. Large and medium-sized towns are also showing declining growth rates while their numbers have been increasing. On the contrary, small towns have increased significantly in terms of both number and percentage composition. The shooting growth rate of small towns, particularly during 2001-2011, is mainly attributed to the addition of the number of Census Towns (CTs) in Assam and Tripura. Moreover, a number of small notified/ statutory towns have been added since 1991 as it is solely the prerogative power of the state government to notify a town, and no state has laid down any demographic and economic criteria to become a town. These small towns form ‘peripheries’ within the periphery. They are unplanned and loosely governed units of administration. They lack the adequate infrastructural and basic services to enhance their growth potential. In fact, many of them still retain the characteristics of ‘villages’ perfectly.
Small and Medium Towns (SMTs) are not attractive enough for the rural people to migrate.
Figure 1: Level of Urbanisation, Northeast India, 2011
Source: Census of India, 2011.
0
10
20
30
40
50
60
Percentage of urban Popula�on
Urban popula�on as % of urban popula�on of NE India

63ROLE OF SMALL AND MEDIUM TOWNS IN REGIONAL DEVELOPMENT
Establishment of government offices and institutions, coupled with increasing inflow of money, better infrastructure and amenities seems to be the only impetus to grow. At the same time, the economic policies of the states are mainly directed towards increase in productivity while neglecting the regional dimension.
Table 2 shows that all urban centres in Mizoram are statutory towns (STs). In Arunachal Pradesh and Sikkim, all towns except one each are also statutory towns. Assam, Nagaland,
Table 1: Number of Towns, Percentage of Urban Population and decadal Growth Rate (dGR) of Size-class Towns, Northeast India, 1981-2011
Year Class 1 Class II Class III Class IV-VI
No % dGR No % dGR No % dGR No % dGR
1981* 3 35.78 - 1 6.70 - 7 18.12 - 61 39.40 -
1991 8 35.55 293.96 7 9.00 433.16 35 23.56 415.46 153 31.88 220.76
2001 10 35.28 36.93 11 12.21 87.06 46 23.27 36.26 189 29.25 26.58
2011 12 31.72 35.27 14 10.03 23.57 56 17.70 14.43 336 40.55 108.56
Note:* Excluding Assam where Census was not conducted.Source: Census of India, 2011.
Table 2: Statutory and Census Towns in Northeast India, 2011
State
Number of Towns
New towns Added (2011)
decla-ssified towns (2011)
Villages with > 5,000
population(% of total rural
population)
Towns with< 5,000
population(% of total urban
population)ST CT ST CT
Arunachal Pradesh 26 1 9 1 0 1 (0.6) 9 (8.2)
Assam 88 126 5 85 2 330 (8.5) 28 (2.5)
Manipur 32 23 0 15 0 46 (16.9) 7 (3.3)
Meghalaya 10 12 0 6 0 7 (1.9) 1 (0.8)
Mizoram 23 0 1 0 0 2(2.3) 8 (4.9)
Nagaland 19 7 10 7 0 31 (14.6) 2(1.6)
Sikkim 8 1 0 1 0 4(5.7) 3(6.4)
Tripura 16 26 2 22 3 149 (41.3) 1 (0.5)
Total 223 195 107 57 5
Source: Census of India, 2011.
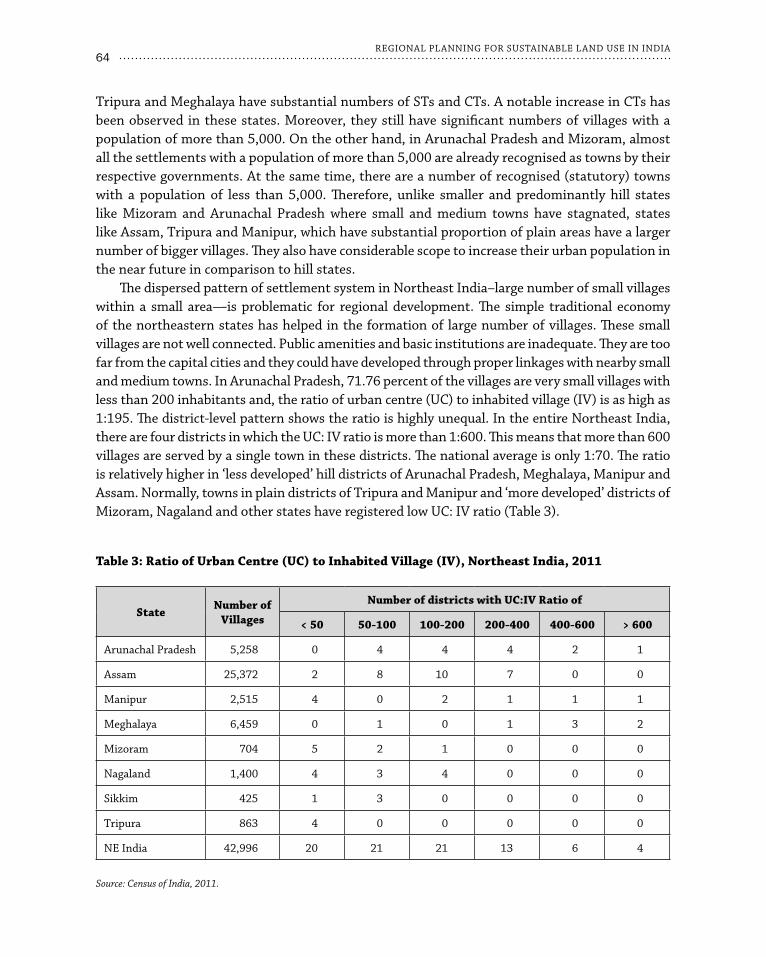
64REGIONAL PLANNING FOR SUSTAINABLE LAND USE IN INDIA
Tripura and Meghalaya have substantial numbers of STs and CTs. A notable increase in CTs has been observed in these states. Moreover, they still have significant numbers of villages with a population of more than 5,000. On the other hand, in Arunachal Pradesh and Mizoram, almost all the settlements with a population of more than 5,000 are already recognised as towns by their respective governments. At the same time, there are a number of recognised (statutory) towns with a population of less than 5,000. Therefore, unlike smaller and predominantly hill states like Mizoram and Arunachal Pradesh where small and medium towns have stagnated, states like Assam, Tripura and Manipur, which have substantial proportion of plain areas have a larger number of bigger villages. They also have considerable scope to increase their urban population in the near future in comparison to hill states.
The dispersed pattern of settlement system in Northeast India–large number of small villages within a small area—is problematic for regional development. The simple traditional economy of the northeastern states has helped in the formation of large number of villages. These small villages are not well connected. Public amenities and basic institutions are inadequate. They are too far from the capital cities and they could have developed through proper linkages with nearby small and medium towns. In Arunachal Pradesh, 71.76 percent of the villages are very small villages with less than 200 inhabitants and, the ratio of urban centre (UC) to inhabited village (IV) is as high as 1:195. The district-level pattern shows the ratio is highly unequal. In the entire Northeast India, there are four districts in which the UC: IV ratio is more than 1:600. This means that more than 600 villages are served by a single town in these districts. The national average is only 1:70. The ratio is relatively higher in ‘less developed’ hill districts of Arunachal Pradesh, Meghalaya, Manipur and Assam. Normally, towns in plain districts of Tripura and Manipur and ‘more developed’ districts of Mizoram, Nagaland and other states have registered low UC: IV ratio (Table 3).
Table 3: Ratio of Urban Centre (UC) to Inhabited Village (IV), Northeast India, 2011
State Number of Villages
Number of districts with UC:IV Ratio of
< 50 50-100 100-200 200-400 400-600 > 600
Arunachal Pradesh 5,258 0 4 4 4 2 1
Assam 25,372 2 8 10 7 0 0
Manipur 2,515 4 0 2 1 1 1
Meghalaya 6,459 0 1 0 1 3 2
Mizoram 704 5 2 1 0 0 0
Nagaland 1,400 4 3 4 0 0 0
Sikkim 425 1 3 0 0 0 0
Tripura 863 4 0 0 0 0 0
NE India 42,996 20 21 21 13 6 4
Source: Census of India, 2011.
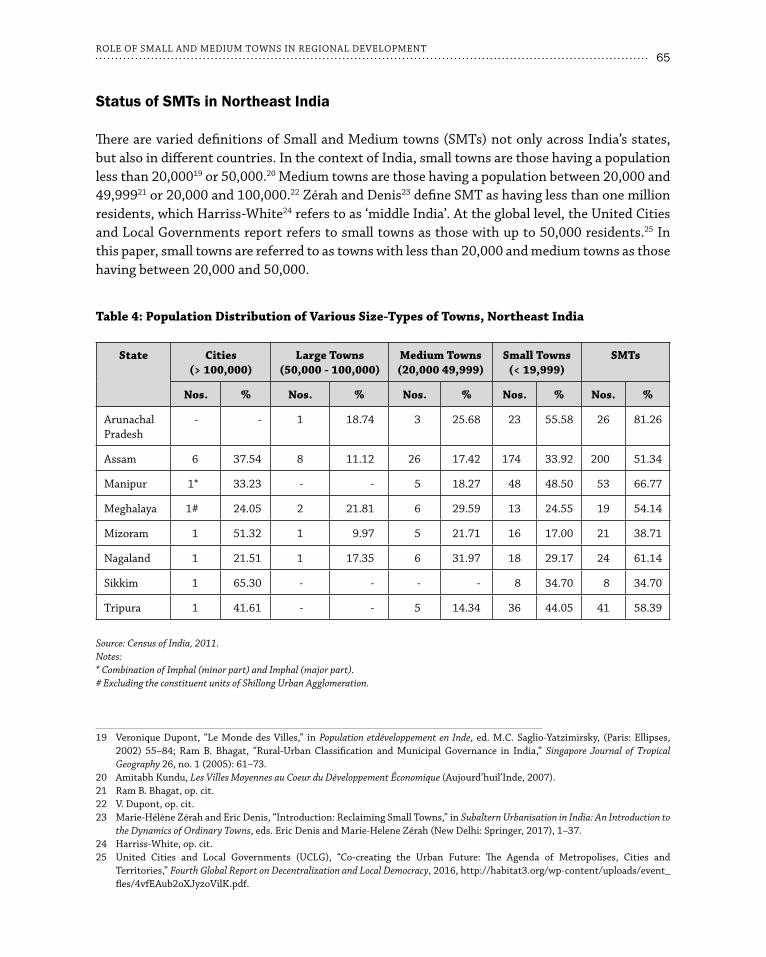
65ROLE OF SMALL AND MEDIUM TOWNS IN REGIONAL DEVELOPMENT
Status of SMTs in Northeast India
There are varied definitions of Small and Medium towns (SMTs) not only across India’s states, but also in different countries. In the context of India, small towns are those having a population less than 20,00019 or 50,000.20 Medium towns are those having a population between 20,000 and 49,99921 or 20,000 and 100,000.22 Zérah and Denis23 define SMT as having less than one million residents, which Harriss-White24 refers to as ‘middle India’. At the global level, the United Cities and Local Governments report refers to small towns as those with up to 50,000 residents.25 In this paper, small towns are referred to as towns with less than 20,000 and medium towns as those having between 20,000 and 50,000.
19 Veronique Dupont, “Le Monde des Villes,” in Population etdéveloppement en Inde, ed. M.C. Saglio-Yatzimirsky, (Paris: Ellipses, 2002) 55–84; Ram B. Bhagat, “Rural-Urban Classification and Municipal Governance in India,” Singapore Journal of Tropical Geography 26, no. 1 (2005): 61–73.
20 Amitabh Kundu, Les Villes Moyennes au Coeur du Développement Économique (Aujourd’huil’Inde, 2007).21 Ram B. Bhagat, op. cit.22 V. Dupont, op. cit.23 Marie-Hélène Zérah and Eric Denis, “Introduction: Reclaiming Small Towns,” in Subaltern Urbanisation in India: An Introduction to
the Dynamics of Ordinary Towns, eds. Eric Denis and Marie-Helene Zérah (New Delhi: Springer, 2017), 1–37.24 Harriss-White, op. cit.25 United Cities and Local Governments (UCLG), “Co-creating the Urban Future: The Agenda of Metropolises, Cities and
Territories,” Fourth Global Report on Decentralization and Local Democracy, 2016, http://habitat3.org/wp-content/uploads/event_fles/4vfEAub2oXJyzoVilK.pdf.
Table 4: Population distribution of Various Size-Types of Towns, Northeast India
State Cities (> 100,000)
Large Towns (50,000 - 100,000)
Medium Towns(20,000 49,999)
Small Towns (< 19,999)
SMTs
Nos. % Nos. % Nos. % Nos. % Nos. %
Arunachal Pradesh
- - 1 18.74 3 25.68 23 55.58 26 81.26
Assam 6 37.54 8 11.12 26 17.42 174 33.92 200 51.34
Manipur 1* 33.23 - - 5 18.27 48 48.50 53 66.77
Meghalaya 1# 24.05 2 21.81 6 29.59 13 24.55 19 54.14
Mizoram 1 51.32 1 9.97 5 21.71 16 17.00 21 38.71
Nagaland 1 21.51 1 17.35 6 31.97 18 29.17 24 61.14
Sikkim 1 65.30 - - - - 8 34.70 8 34.70
Tripura 1 41.61 - - 5 14.34 36 44.05 41 58.39
Source: Census of India, 2011.Notes:* Combination of Imphal (minor part) and Imphal (major part).# Excluding the constituent units of Shillong Urban Agglomeration.

66REGIONAL PLANNING FOR SUSTAINABLE LAND USE IN INDIA
SMTs (including the constituent units of urban agglomeration) constitute more than 50 percent of urban population in Northeast India. Arunachal Pradesh has the highest percentage of urban population living in SMTs with 81.26 percent followed by Manipur and Nagaland. On the other hand, a large proportion of urban population in Sikkim and Mizoram are living in their capital cities Gangtok and Aizawl, respectively. Census 2011 has shown that all the state capitals contain more than 30 percent of their urban population with the exception of Arunachal Pradesh, Meghalaya and Nagaland (Table 4). In Arunachal Pradesh, only 18.74 percent of urban population is settled in the capital city Itanagar. However, combining the population of Itanagar with its twin town Naharlaguna, which is next to Itanagar in terms of population size, the percentage composition goes up to 30.14 percent. Similarly, the Shillong Urban Agglomeration (UA) comprises as many as 11 census towns. Adding up their populations brings the proportion to 59.58 percent of the total urban population of Meghalaya.
Decentralised Urbanisation and Polycentric Urban Region
Central cities in Northeast India have grown tremendously bigger with respect to other urban centres due to factors associated with centralisation of power and resources. The diseconomies of scale operating in these environmentally fragile and unplanned cities have created anxiety towards the future of urbanisation. At this juncture, there is a serious call for ‘decentralised urbanisation’ to offload the mounting pressure on existing cities and ‘polycentricity approach’ as a “decision-making tool in the regional planning process.”26
Decentralised urbanisation is also needed to reduce spatial inequality. Decentralised urbanisation through provision of infrastructure and human resources will increase the attractiveness and absorbing capacity of smaller towns. This could help in strengthening the economic, environmental and social sustainability of both cities and towns. Moreover, there are only a few towns, if any, in the remotest corners, while a number of towns have developed around the central cities. Without having towns nearby, villages in the peripheral areas are usually deprived of accessibility to better education, healthcare and other amenities. Policy needs to be oriented towards increasing physical and socio-economic linkages between and among towns and villages to reduce the increasing peripheralisation of large number of villages scattered in the hills and mountains.
The ‘growth centre’ approach has failed largely because “in most cases they were not sufficiently context specific, and were instead based on general ideas of what small towns should be.”27 Utmost importance must therefore be attached to ‘context specificity’ due to the varied functions of SMTs. A regional planning approach based on SMTs should look into the evolution and development process of each town, their functions and linkages with rural areas and other bigger towns and cities. Understanding the specificity of each town will help in charting the course of its socio-economic development, land-use planning, setting up of specific skill training centres and entrepreneurship incubation centres, among others.
26 David Shaw and Olivier Sykes, “The Concept of Polycentricity in European Spatial Planning: Reflections on its Interpretation and Application in the Practice of Spatial Planning,” International Planning Studies 9, no. 4 (2004): 283–306.
27 Tacoli, op. cit.
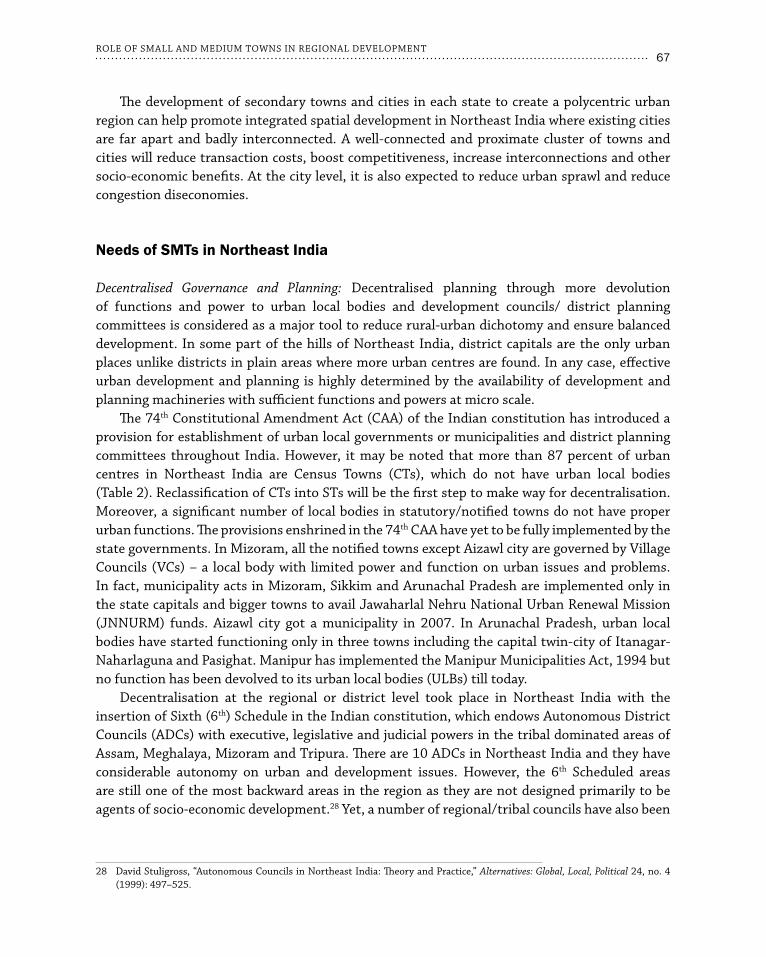
67ROLE OF SMALL AND MEDIUM TOWNS IN REGIONAL DEVELOPMENT
The development of secondary towns and cities in each state to create a polycentric urban region can help promote integrated spatial development in Northeast India where existing cities are far apart and badly interconnected. A well-connected and proximate cluster of towns and cities will reduce transaction costs, boost competitiveness, increase interconnections and other socio-economic benefits. At the city level, it is also expected to reduce urban sprawl and reduce congestion diseconomies.
Needs of SMTs in Northeast India
Decentralised Governance and Planning: Decentralised planning through more devolution of functions and power to urban local bodies and development councils/ district planning committees is considered as a major tool to reduce rural-urban dichotomy and ensure balanced development. In some part of the hills of Northeast India, district capitals are the only urban places unlike districts in plain areas where more urban centres are found. In any case, effective urban development and planning is highly determined by the availability of development and planning machineries with sufficient functions and powers at micro scale.
The 74th Constitutional Amendment Act (CAA) of the Indian constitution has introduced a provision for establishment of urban local governments or municipalities and district planning committees throughout India. However, it may be noted that more than 87 percent of urban centres in Northeast India are Census Towns (CTs), which do not have urban local bodies (Table 2). Reclassification of CTs into STs will be the first step to make way for decentralisation. Moreover, a significant number of local bodies in statutory/notified towns do not have proper urban functions. The provisions enshrined in the 74th CAA have yet to be fully implemented by the state governments. In Mizoram, all the notified towns except Aizawl city are governed by Village Councils (VCs) – a local body with limited power and function on urban issues and problems. In fact, municipality acts in Mizoram, Sikkim and Arunachal Pradesh are implemented only in the state capitals and bigger towns to avail Jawaharlal Nehru National Urban Renewal Mission (JNNURM) funds. Aizawl city got a municipality in 2007. In Arunachal Pradesh, urban local bodies have started functioning only in three towns including the capital twin-city of Itanagar-Naharlaguna and Pasighat. Manipur has implemented the Manipur Municipalities Act, 1994 but no function has been devolved to its urban local bodies (ULBs) till today.
Decentralisation at the regional or district level took place in Northeast India with the insertion of Sixth (6th) Schedule in the Indian constitution, which endows Autonomous District Councils (ADCs) with executive, legislative and judicial powers in the tribal dominated areas of Assam, Meghalaya, Mizoram and Tripura. There are 10 ADCs in Northeast India and they have considerable autonomy on urban and development issues. However, the 6th Scheduled areas are still one of the most backward areas in the region as they are not designed primarily to be agents of socio-economic development.28 Yet, a number of regional/tribal councils have also been
28 David Stuligross, “Autonomous Councils in Northeast India: Theory and Practice,” Alternatives: Global, Local, Political 24, no. 4 (1999): 497–525.

68REGIONAL PLANNING FOR SUSTAINABLE LAND USE IN INDIA
Table 5: Urban Local Bodies and Regional development Councils in Northeast India
Sta-tes Urban Local Bodies district Councils/Regional Councils/
district Planning Committee
Miz
oram
The Mizoram Municipalities Act, 2007.- Only 1 municipality i.e. Aizawl Municipal
Corporation (AMC). - 6 functions have been transferred to AMC.- Other towns are governed by Village Councils
(under State and ADCs).
Autonomous District Councils (3)- Chakma, Mara, and Lai Autonomous - District Councils.- Statutory Autonomous Council (1)- Sinlung Hills Development Council.- District Planning Committee (DPC) (6)- Lunglei High Powered Committee.- DPCs in five non-6th Scheduled districts.
Meg
hala
ya
The Meghalaya Municipal Act, 1973.- 6 Municipal Boards. - 16 functions have been transferred to the ULBs.- Town Committees (under ADCs).- No municipal election has been conducted.
Autonomous District Councils (3)- Khasi Hills, Garo Hills, and Jaintia Hills
Autonomous District Councils.- District Planning and Development Councils
(DPDC) (2)- These cover the entire state.
Trip
ura
The Tripura Municipal Act, 1994.- 1 Municipal Corporation, 13 Municipal Councils & 6
Nagar Panchayats.- All the 18 functions had been transferred to the
ULBs. - Regularly conduct municipal elections.
Autonomous District Council (1)- Tripura Tribal Areas Autonomous District
Council (TTAADC), which covers 2/3rd of the total area of the state.
Ass
am
The Assam Municipal Act, 1956.- 28 Municipal Boards and 44 Town Committees
(TCs) - 12 functions have been fully or partially transferred.- Guwahati has its own Municipal Act i.e., Guwahati
Municipal Corporation Act, 1969.
Autonomous District Councils (3)- Bodoland Territorial Council, Karbi Anglong,
and Dima Hasao District Autonomous Councils.
- Statutory Autonomous Councils (6)- Rabha Hasong, Lalung, Mising, Thengal
Kachori, Sonowal Kachari, and Deori Autonomous Councils.
- District Planning Committees - Constituted in all the non-6th scheduled
districts but were yet to perform their mandated functions.
Man
ipur The Manipur Municipalities Act, 1994.
- 9 Municipal Councils, 18 Nagar Panchayats, and 1 Small Town Committee
- No function has been yet transferred to ULBs.
Statutory Autonomous Councils (6)- Chandel, Churachandpur, Sadar Hills,
Manipur North, Tamenglong and Ukhrul Autonomous District Councils.
Sikk
im
The Sikkim Municipalities Act, 2007. - 1 Municipal Corporation, 1 Municipal Council and 5
Nagar Panchayats.- 18 functions transferred but only three are yet
executed till 2013.
Sikkim Panchayati Raj Act, 1993- District Planning Committee.
Aru
nach
al
Prad
esh
The Arunachal Pradesh Municipal Act, 2007.- Only Itanagar-Naharlaguna & Pasighat have
Municipalities.- 10 functions have been delegated excluding town
planning.- No statutory body to govern 24 notified towns.
The Arunachal Pradesh Panchayat Raj Act, 1997 (Amended in 2018)- District Planning Committee.
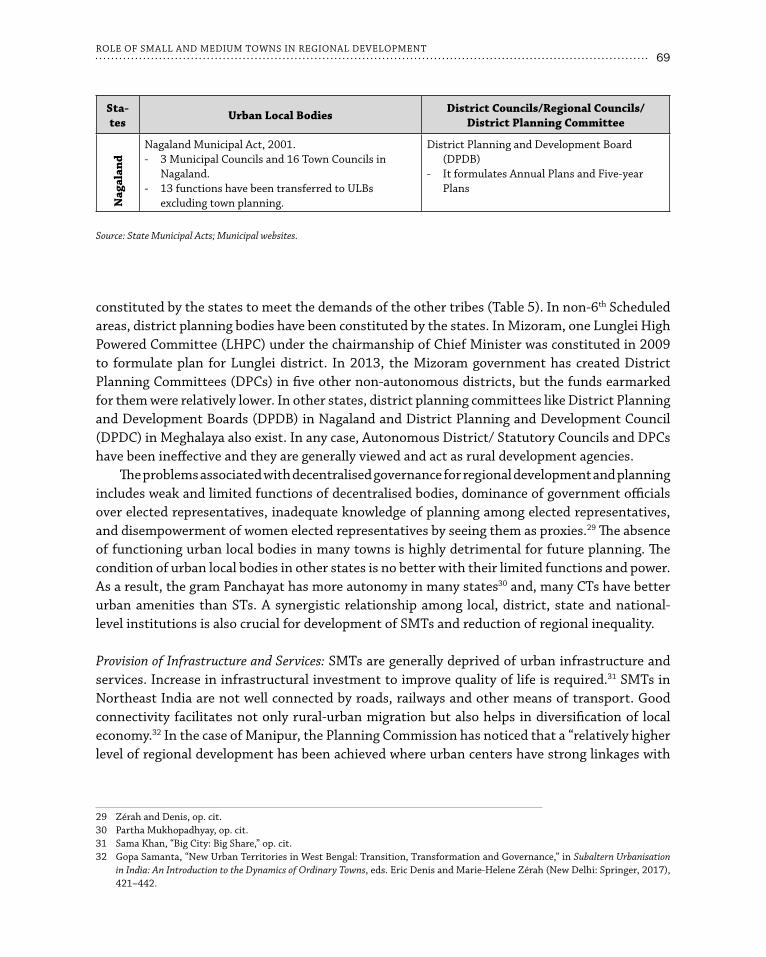
69ROLE OF SMALL AND MEDIUM TOWNS IN REGIONAL DEVELOPMENT
constituted by the states to meet the demands of the other tribes (Table 5). In non-6th Scheduled areas, district planning bodies have been constituted by the states. In Mizoram, one Lunglei High Powered Committee (LHPC) under the chairmanship of Chief Minister was constituted in 2009 to formulate plan for Lunglei district. In 2013, the Mizoram government has created District Planning Committees (DPCs) in five other non-autonomous districts, but the funds earmarked for them were relatively lower. In other states, district planning committees like District Planning and Development Boards (DPDB) in Nagaland and District Planning and Development Council (DPDC) in Meghalaya also exist. In any case, Autonomous District/ Statutory Councils and DPCs have been ineffective and they are generally viewed and act as rural development agencies.
The problems associated with decentralised governance for regional development and planning includes weak and limited functions of decentralised bodies, dominance of government officials over elected representatives, inadequate knowledge of planning among elected representatives, and disempowerment of women elected representatives by seeing them as proxies.29 The absence of functioning urban local bodies in many towns is highly detrimental for future planning. The condition of urban local bodies in other states is no better with their limited functions and power. As a result, the gram Panchayat has more autonomy in many states30 and, many CTs have better urban amenities than STs. A synergistic relationship among local, district, state and national-level institutions is also crucial for development of SMTs and reduction of regional inequality.
Provision of Infrastructure and Services: SMTs are generally deprived of urban infrastructure and services. Increase in infrastructural investment to improve quality of life is required.31 SMTs in Northeast India are not well connected by roads, railways and other means of transport. Good connectivity facilitates not only rural-urban migration but also helps in diversification of local economy.32 In the case of Manipur, the Planning Commission has noticed that a “relatively higher level of regional development has been achieved where urban centers have strong linkages with
Sta-tes Urban Local Bodies district Councils/Regional Councils/
district Planning Committee N
agal
and
Nagaland Municipal Act, 2001.- 3 Municipal Councils and 16 Town Councils in
Nagaland.- 13 functions have been transferred to ULBs
excluding town planning.
District Planning and Development Board (DPDB)
- It formulates Annual Plans and Five-year Plans
Source: State Municipal Acts; Municipal websites.
29 Zérah and Denis, op. cit.30 Partha Mukhopadhyay, op. cit.31 Sama Khan, “Big City: Big Share,” op. cit.32 Gopa Samanta, “New Urban Territories in West Bengal: Transition, Transformation and Governance,” in Subaltern Urbanisation
in India: An Introduction to the Dynamics of Ordinary Towns, eds. Eric Denis and Marie-Helene Zérah (New Delhi: Springer, 2017), 421–442.
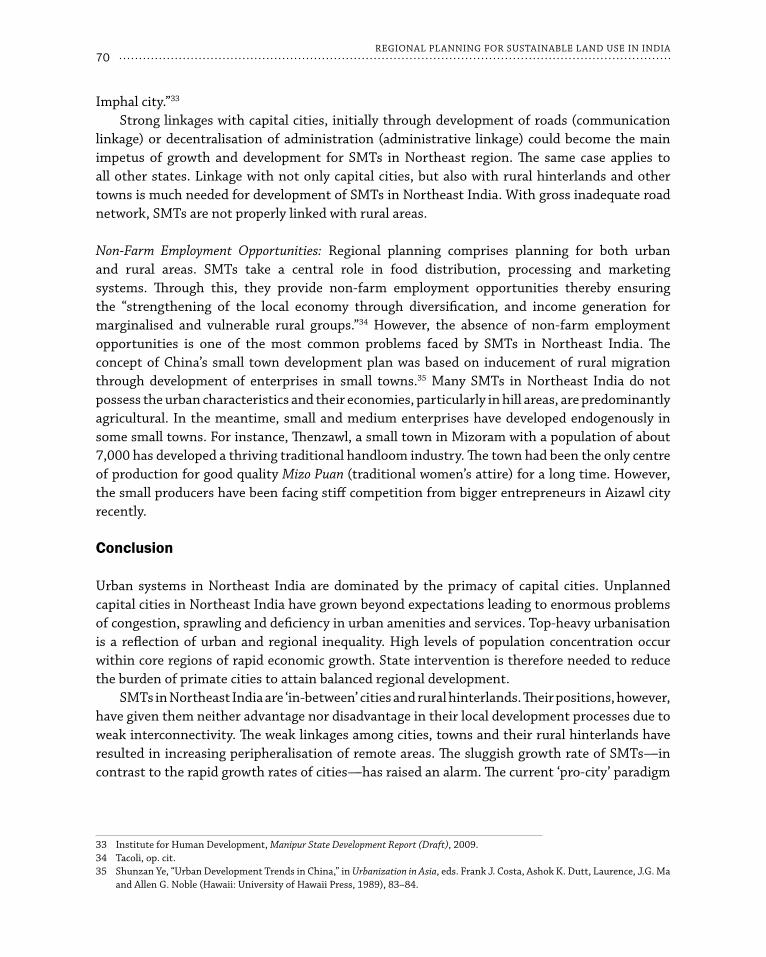
70REGIONAL PLANNING FOR SUSTAINABLE LAND USE IN INDIA
Imphal city.”33
Strong linkages with capital cities, initially through development of roads (communication linkage) or decentralisation of administration (administrative linkage) could become the main impetus of growth and development for SMTs in Northeast region. The same case applies to all other states. Linkage with not only capital cities, but also with rural hinterlands and other towns is much needed for development of SMTs in Northeast India. With gross inadequate road network, SMTs are not properly linked with rural areas.
Non-Farm Employment Opportunities: Regional planning comprises planning for both urban and rural areas. SMTs take a central role in food distribution, processing and marketing systems. Through this, they provide non-farm employment opportunities thereby ensuring the “strengthening of the local economy through diversification, and income generation for marginalised and vulnerable rural groups.”34 However, the absence of non-farm employment opportunities is one of the most common problems faced by SMTs in Northeast India. The concept of China’s small town development plan was based on inducement of rural migration through development of enterprises in small towns.35 Many SMTs in Northeast India do not possess the urban characteristics and their economies, particularly in hill areas, are predominantly agricultural. In the meantime, small and medium enterprises have developed endogenously in some small towns. For instance, Thenzawl, a small town in Mizoram with a population of about 7,000 has developed a thriving traditional handloom industry. The town had been the only centre of production for good quality Mizo Puan (traditional women’s attire) for a long time. However, the small producers have been facing stiff competition from bigger entrepreneurs in Aizawl city recently.
Conclusion
Urban systems in Northeast India are dominated by the primacy of capital cities. Unplanned capital cities in Northeast India have grown beyond expectations leading to enormous problems of congestion, sprawling and deficiency in urban amenities and services. Top-heavy urbanisation is a reflection of urban and regional inequality. High levels of population concentration occur within core regions of rapid economic growth. State intervention is therefore needed to reduce the burden of primate cities to attain balanced regional development.
SMTs in Northeast India are ‘in-between’ cities and rural hinterlands. Their positions, however, have given them neither advantage nor disadvantage in their local development processes due to weak interconnectivity. The weak linkages among cities, towns and their rural hinterlands have resulted in increasing peripheralisation of remote areas. The sluggish growth rate of SMTs—in contrast to the rapid growth rates of cities—has raised an alarm. The current ‘pro-city’ paradigm
33 Institute for Human Development, Manipur State Development Report (Draft), 2009.34 Tacoli, op. cit.35 Shunzan Ye, “Urban Development Trends in China,” in Urbanization in Asia, eds. Frank J. Costa, Ashok K. Dutt, Laurence, J.G. Ma
and Allen G. Noble (Hawaii: University of Hawaii Press, 1989), 83–84.
71ROLE OF SMALL AND MEDIUM TOWNS IN REGIONAL DEVELOPMENT
of urban development in a monocentric urban system has not only reinforced regional disparity, but also weakened the resilience of the regional economy.
The Planning Commission36 has recommended existence of more small and medium-size towns uniformly rather than having one or two large towns/cities in view of the unstable geology and fragile environment. Currently, small and medium towns constitute more than half of the urban population in Northeast India. More than half of these SMTs are statutory towns and they are without proper functioning urban local bodies. The region has also witnessed the rapid emergence of ‘rurally administered’ census towns around capital cities. The future of these SMTs is dim in spite of their important role in the process of regional development. It is imperative to provide infrastructure and amenities to induce rural-urban migration and improve non-farm employment opportunities. There should also be devolution of power and functions to urban local bodies so that they can become more equipped to manage and strengthen their own ‘locally embedded’ development process and induce competiveness among themselves.
36 Planning Commission, Arunachal Pradesh Development Report (New Delhi: Academic Foundation, 2009).
Abstract
Employment generation for low-skilled surplus rural labour has become a crucial challenge in India. Agricultural jobs are shrinking, but low-skill job opportunities in big cities are not increasing proportionately. Data from the National Economic Survey shows that over the past two decades, construction sectors have become the main source of non-agricultural employment for the rural poor. Recent academic research on economic planning also calls for greater policy focus and investments in sectors such as handicraft and agro-processing. This chapter argues that to realise the full potential of such economic objectives, it is necessary to develop small towns and their rural hinterlands, through an integrated spatial-economic planning framework. There is greater realisation about the need for convergence across sectors to bring about administrative efficiency as articulated by newer policies, such as the NuRM (Shyama Prasad Mukherji National Rurban Mission), which has also introduced the concept of land use planning for development of rural economic clusters. In this scenario, South Africa’s Spatial Planning and Land Use Management Act (SPLUMA) of 2013, which revolves around district municipalities as the anchor points for local economic development, can provide valuable lessons to further improve policies such as NuRM.
Introduction
Planning processes in India continue to be defined by the administrative binaries of rural and urban, whereas greater integration across spaces and sectors are becoming increasingly important for livelihood strategies and product value chains. Small towns are crucial for the functioning of such micro-scale economic networks and reflect bottom-up urbanisation process, but seldom feature in policy discourse. This paper explores the role of small towns1 as nodes in regional
7Role of Small Towns in Regional Development:
Lessons from South Africa
Tathagata Chatterji
1 The term “small town” in this paper refers to all urban settlements that are not classified as Class-1 city by Indian Census. In case of South Africa, the term “small town” refers to all urban settlements that are not classified as Metropolitan Cities.
73ROLE OF SMALL TOWNS IN REGIONAL DEVELOPMENT
network strategies connecting rural and urban spatial systems. It examines South Africa’s recent policy initiatives like the National Development Plan (NDP) of 2011, Spatial Planning and Land Use Management Act (SPLUMA) of 2013, and Agri-Park Policy of 2015. These innovative policies are designed to improve livelihood opportunities in South Africa’s rural areas by stimulating small town economies and are being implemented through an integrated regional planning framework involving national, provincial and local governments. India and South Africa are both part of the BRICS grouping (Brazil, Russia, India, China and South Africa) and the Commonwealth. Since the two countries share broadly similar developmental concerns and institutional contexts, this paper seeks to tease out appropriate inputs from South Africa, which may inform policy debate in India.
Employment generation for low-skilled surplus rural labour has become a crucial challenge in India. Job absorption in agriculture declined by 14 million between 1991 and 2011,2 while rural population increased by 204 million over the same period.3 Inadequate livelihood opportunities are pushing surplus rural workforce to the lower rungs of the informal labour market. Petty construction work accounted for 70 percent of the net increase in rural non-farm employment between 2004 and 2014.
While such petty jobs in the informal sector may not produce high level of skill enhancement, nor reduce widening socio-economic polarisation, economists argue that a pro-poor growth strategy cannot overlook the importance of such jobs in the livelihood strategies of India’s burgeoning rural population.4 The State of Working in India report, published in 2018, calls for greater policy focus and investments in sectors such as handicraft and agro-processing, which could generate alternative work opportunities for the low-skilled rural workforce.5
To realise the full potential of such economic objectives, it is necessary to develop small towns and their rural hinterlands through an integrated spatial-economic planning framework. Small towns typically act as service centres for education and healthcare for their surrounding rural belt, and as nodes of articulation for capital, labour, produce, raw material and information flows. For example, mandi towns of India are deeply tied with their surrounding rural belts as hubs of agricultural produce marketing, farmers’ cooperative banks, micro-credit institutions and retailing of farm equipment. Greater policy focus on such towns can substantially galvanise rural economy in their catchment area by developing a labour supply-chain network and also as service centres for education and healthcare facilities.6
However, agrarian towns, census towns and big villages—settlements that typically act as nodes of rural economy in India—require substantial strengthening of their governance capacities
2 Eric Denis and Marie-Hélène Zérah, “Rural-Urban Linkages: India Case Study,” Research Report 124, Centro Latinoamericano para el Desarrollo Rural, 2014, 13–14.
3 Registrar General and Census Commissioner, “Population Census 2001–11,” Government of India, Delhi, 2011.4 Himanshu Himanshu, Peter Lanjouw, Abhirup Mukhopadhyay and Rinku Murgai, “Non-farm Diversification and Rural Poverty
Decline: A Perspective from Indian Sample Survey and Village Study Data,” Working Paper No. 44, Asia Research Centre, London School of Economics and Political Science, 2011.
5 Centre for Sustainable Employment 2018, “State of Working in India,” Azim Premji University, accessed 1 February 2019, https://cse.azimpremjiuniversity.edu.in/wp-content/uploads/2018/10/State_of_Working_India_2018.pdf.
6 Himanshu Himanshu, et. al., op. cit.

74REGIONAL PLANNING FOR SUSTAINABLE LAND USE IN INDIA
supported by a robust land use planning mechanism for sustainable development.7 The current scenario of in-situ urbanisation happening in such settlements are characterised by haphazard conversion of fertile agricultural land, filling up water bodies and leading to deforestation. These have adverse implications for environment and food security.
While the legislative mandate for integrated rural-urban planning in India has been in place since the early 1990s, under the District Planning framework of the 74thConstitutionAmendment Act, 1992 (74th CAA), its implementation had been problematic in most states. Recently, however, there is growing realisation about the need for convergence across sectors to bring about administrative efficiency as articulated by newer policies such as the NRuM (Shyama Prasad Mukherji National Rurban Mission, or Rurban Mission), which introduced the concept of land use planning for development of rural economic clusters.
In this scenario, South Africa’s recent initiatives such as NDP (2011), SPLUMA (2015) and Agri-Park Development Programme, merit attention. These programmes revolve around district municipalities as the anchor points for local economic development. These new instruments are designed for coordinated planning, which involve multi-tiered governance hierarchies, settlement topologies and economic sectors. These ideas can provide valuable inputs to further improve policies, such as NRuM to realise an agro-centric growth strategy in India.
The next section provides a brief literature review pertaining to the role of the small towns in furthering rural-urban interdependency. The third section discusses opportunities and constraints for integrated planning in India under the district planning mechanism. The penultimate section explores South Africa’s new integrated planning framework. The chapter closes with a discussion of the lessons learnt and their future policy implications.
Small Towns in Rural-Urban Equation
A large body of literature on settlement systems has focused on the need for an integrated approach towards rural and urban areas as they constitute a system of settlement hierarchies that are functionally tied to each other. Tacoli observed that rural-urban relations need to be understood and addressed in the context of linkages and flows, such as:8
Economic: By exchange of unprocessed and processed products, with both rural and urban •areas acting as markets for each other Service: Provide a central location for retail, commercial, administrative and transport •services for agricultural producers Demographic: Through flows of migration of people•Environmental: By mediating the demand for natural resources and polluting effects of •urban-based production activities Infrastructure: Connect rural and urban areas by infrastructure networks comprised •principally of transport, electricity and telecommunication networks
7 Tathagata Chatterji, “Strengthening Rural-Urban Linkages through District Planning Framework in India,” Paper Presented at the 14th International Congress of the Asian Planning Schools Association, Beijing, 12–14 October 2017.
8 Cecilia Tacoli, “The links between Urban and Rural Development,” Environment and Urbanization 15, no. 1 (2003): 3–12.
75ROLE OF SMALL TOWNS IN REGIONAL DEVELOPMENT
Small towns act as intermediate nodes, where several of the products and produce flows converge. Nodal roles of small towns involve the following functions:9
Act as centres of demand/markets for agricultural produce from the rural region•Act as centres for the production and distribution of goods and services to their rural region•Become centres for the growth and consolidation of rural non-farm activities and •employmentAttract rural migrants from the surrounding region•Manage natural resources in ways that respond to the needs of growing rural and urban •populations
However, economic planning to integrate higher and lower-tier settlements are extremely complex and contextual. Value chain requirements of the items involved in transaction across settlement hierarchies differ substantially and do not follow any pattern.10 For instance, Tripathy and Rani claim that labour mobility substantial depends on the degree of mechanisation of agriculture and the nature of crop.11 By correlating state-level agricultural productivity data with rural-urban migration data, they argue that rice cultivation, which in India is usually labour-intensive, creates more rural jobs, vis-à-vis wheat or maize production—which are more technology intensive. Consequently, rice producing regions show less out-migration, compared to those that produce wheat or maize.12
Douglass also highlights the importance of the regional spatial organisation pattern and settlement hierarchy.13 In the ‘growth pole’ pattern, spatial organisation is vertical and linear, dominated by a single big city as the node. The centre city enjoys high degree of primacy and agglomeration advantages. Equilibrium of regional backward-forward flows is heavily tilted towards the urban core. In such areas, smaller towns often function as commuter suburbs, while the roles of the rural hinterlands are restricted to resource supply. As a result, rural-urban gaps widen.
In contrast, the ‘regional network cluster’ model suggests a more horizontally aligned and defused spatial system.14 A complex web-like relationship between higher and lower-tier settlements represents the spatial organisation. Activities and functions are dispersed amongst mutually interdependent functional-economic clusters – connected to the regional web-grid. Process and produce flows in such web-grids are multi directional. Instead of having a single big city (as in a growth pole), nodal functions in such spatial models are represented by a cluster of small towns, having complimentary specialisations. Smaller rural settlements can take advantage of this diversity (or range of services offered) and connect to specific nodal towns in
9 “Why small towns matter: Urbanisation, Rural Transformations and Food Security,” IIED Briefing, March 2017, 1–4.10 Mike Douglass, “A Regional Network for Reciprocal Rural-Urban Linkages: An Agenda for Policy Research with Reference to
Indonesia,” in Rural-Urban Linkages, ed. Cecilia Tacoli (London: Earthscan Press, 2006).11 Sabyasachi Tripathi and Chetana Rani, “The Impact of Agricultural Activities on Urbanization: Evidence And Implications for
India,” Lovely Professional University, accessed 4 September 2018, https://mpra.ub.uni-muenchen.de/76213/.12 Ibid.13 Mike Douglass, op. cit.14 Ibid.

76REGIONAL PLANNING FOR SUSTAINABLE LAND USE IN INDIA
the value chain as necessary. Clusters of small towns at the core combine to offer similar level of agglomeration advantage to that of a single node but avoid overcrowding and other negative externalities associated with hyper concentration.
Policies for Rural –Urban Integration in India
This section discusses three noteworthy policy interventions targeted towards rural-urban integration through spatial planning in India–the Integrated Development of Small and Medium Towns (IDSMT) programme and its successor Urban Infrastructure Development Scheme for Small and Medium Towns (UIDSSMT), the formation of District Planning Committees under the 74thCAA, and the recently launched National Rurban Mission (NRuM).
The IDSMT scheme was launched in 1979-80; eventually, in 2005-06, it was subsumed under the JNNURM programme as UIDSSMT. At the time of its launch during the Sixth Five Year Plan period, the coverage of the scheme was restricted to 235 small towns that had a population below 1,00,000.15 The population threshold was later increased to 5,00,000. The numbers of towns under the scheme also continued to grow from the Seventh Five-year Plan onwards, and all together, IDSMT covered 1,854 towns between 1979-80 and 2005-06.16
The IDSMT scheme sought to stimulate development of smaller urban centres to reduce population pressure on big cities. The main objectives of IDSMT were improving infrastructural facilities and helping in the creation of durable public assets in small and medium towns, decentralising economic growth and employment opportunities and promoting dispersed urbanisation, increasing the availability of serviced sites for housing, commercial and industrial uses, integrating spatial and socio-economic planning as envisaged in the Constitution, and promoting resource-generating schemes for the urban local bodies to improve their overall financial position. To achieve these objectives, the project component of the IDSMT included development of the following:17
Low-income housing projects, including sites and services, slum improvement•Construction and improvement of roads, street-lighting, traffic improvement schemes, etc.•Markets / • mandis, shopping complex, industrial estates, etc.Bus / truck terminals, cycle /rickshaw stands•Slaughter houses•Parks, gardens, playgrounds•Tourism facilities•Solid waste management•
15 R.K. Wishwakarma, “Integrated Development of Small and Medium Towns: Critical Areas and Issues for Policy Options,” Indian Institute of Public Administration, New Delhi, 1982.
16 K.C. Sivaramakrishnan, Re-visioning Indian Cities (New Delhi: Sage, 2011).17 Grant Thornton, “Appraisal of Jawaharlal Nehru National Urban Renewal Mission,” Final Report Vol. 1, 2011, accessed 4 February
2019, http://www.cmamp.com/CP/FDocument/JnNURMvolumeI.pdf.

77ROLE OF SMALL TOWNS IN REGIONAL DEVELOPMENT
The IDSMT scheme was unable to meet its primary objective— reduce population pressure on big cities by improving the small towns. Nevertheless, it was an important milestone, for being the first national-scale centrally sponsored programme in the urban sector, and substantially influenced the design of its successor scheme UIDSSMT. The IDSMT scheme was useful in improving the infrastructure of the small and medium sized towns in a limited way. However, the implementation of the project was problematic and later evaluations noted several areas of concern:18,19
Difficulties of multilevel coordination: There had often been an inordinate time lag between formulation of projects, appraisal and sanctioning. Non-availability and non-release of matching funds from the state share by the State Governments, within the specified time, severely impacted pace of work. Moreover, non-submission of fund utilisation certificates by the States delayed held-up Central grants.
Institutional weakness of the ULB: Non-availability of land free from encroachments and frequent changes of location of the approved components by implementing agencies harmed the projects. ULB also lacked project planning, management and monitoring capabilities, which frequently resulted in inappropriate selection of projects with understanding of their long-term economic viability; and cost overruns, and construction delays.
While the ULBs faced problems in accessing financial grants from the States and the national government, they are reluctant to approach financial institutions, such as HUDCO, which were authorised to provide 10 percent of the funding.
At the time of launching the UIDSSMT Scheme, there was an attempt to streamline some of the operational difficulties faced by the IDSMT programme at the time of implementation. Thus, the objective of reduction in migration to big cities was deleted from the scope of UIDSSMT since it was realised that no single project by itself can adequately address such complex issues driven by macroeconomic and other factors. Second, the UIDSSMT sought to improve the capacity of the ULB staff in project finance and contract management by setting aside a fund for trainings and workshops. Moreover, private sector consultants were roped in, in a big way to support the ULB in project design and management. Third, the range of projects eligible for funding was pruned to prioritise delivery of basic civic amenities like water supply, sewerage, solid waste disposal and roads. Fourth, the UIDSSMT encouraged the PPP (Public Private Partnership) mode for delivery of urban infrastructure, instead of accessing loans from financial institutions. Finally, as part of JNNURM, UIDSSMT required cities to carry out obligatory and optional reforms related to e-governance, accounting practices, public disclosures etc.20
The UIDSSMT scheme was in operation until 2014-15 and subsequently, the AMRUT (Atal Mission for Rejuvenation and Urban Transformation) was launched with mandate of providing basic urban infrastructure in 500 cities and is currently in vogue.
18 Ibid.19 Anand Sahasranaman, “Financing and Development of Small and Medium Towns,” Economic and Political Weekly 47, no. 24 (16
June 2012): 59–66.20 Ministry of Housing and Urban Affairs, “Urban Infrastructure Development Scheme for Small and Medium Towns: Overview and
Salient Features,” Government of India, New Delhi, 2009.

78REGIONAL PLANNING FOR SUSTAINABLE LAND USE IN INDIA
Considering the fact that most Indian small towns are deficient in terms of basic services, it is understandable that the national government supported programmes like IDSMT, UIDSSMT and AMRUT prioritised on infrastructure delivery. However, it would be pertinent to note here that although infrastructure development is a prerequisite behind growth, availability of infrastructure per se does not stimulate growth, as it depends on several other factors, such as policies, regulations, institutions, labour skill, etc. The small towns derive their economic vibrancy by being nodes of exchange in the supply chain logistics connecting big cities and their rural hinterland, and by acting as locus of education, healthcare and financial services of dispersed rural settlements. However, the small town ULBs in India presently neither have legal mandate nor institutional capacity to undertake such complex planning responsibilities, as integrated planning will not only require high degree of harmonisation between economic objectives, land supply and infrastructure availability, but also state and non-state actors at multiple governance hierarchies. Most state governments are yet to devolve urban planning / town planning functions to ULBs as envisioned under Article 74th CAA and spatial planning continues to be guided by the Development Authorities and state level Town Planning Directorates.
Local governance reforms through the 74th CAA sought to establish a framework for integrated planning encompassing rural and urban areas at district level regional scale by establishing District Planning Committee (DPC) as a permanent institutional platform. District was sought as the appropriate administrative level to effect vertical coordination with line agencies, and horizontal coordination between urban and rural areas, as it had been the anchor of local administration in India for a long time.
However, the implementation of the DPC as envisioned under Article 243ZD of the Constitution had not been smooth due to administrative inertia and the lack of political will of the state governments.21 There was also confusion about the nature of the district plans, whether they should be an amalgamation of the plans prepared by the ULBs and the Panchayats (rural council), or limited to functions devolved to urban and rural local governments, or take a macro view and include functions under the purview of the state governments as well.
The Planning Commission sought to address the issues during the preparation of the Eleventh 5-Year Plan. Release of certain central grants (i.e., Backward Region Grants Fund) was made conditional to the state governments establishing the DPC. In order to streamline the district planning process, the Planning Commission issued guidelines for integrated planning following the bottom-up approach. It was suggested that planning should start at the lowest tier, at the Gram Sabha level and progressively inform upper tiers to maximise scope for public participation. The task of the DPC would then be to consolidate the plans prepared by panchayats, urban municipalities, and plans prepared by the sectoral departments of the state government, pertaining to the district, to prepare a draft development plan for the entire district.22 District Plans would then inform state level planning and in turn State Plans provide vital input for national level planning .
21 K.C Sivaramakrishnan, op. cit.22 Planning Commission of India, “Report on District Planning: Status and Way Forward,” Government of India, 2008.
79ROLE OF SMALL TOWNS IN REGIONAL DEVELOPMENT
At present, 20 out of 29 state governments and six out of seven Union Territories have constituted DPCs, but their functioning remains problematic. The spirit of integrated planning for rural and urban areas is yet to be imbibed by most states, barring few exceptions like Kerala, Rajasthan and Odisha. As Oommen observed, “Although 12 States reported that they had formulated integrated district development plans, most of them may not stand professional scrutiny, and citizens’ approval.”23
State government apathy apart, the institutional design of the DPC is also problematic. The Second Administrative Reforms Commission (Sixth Report) noted that in several states, ministers occupy the DPC chairman’s position, which alters the power equation vis-à-vis the Zila Parishad. Moreover, the provision of nominated members in the DPC is often misused to nominate political functionaries, and this unduly politicises the planning process. To overcome such problems, the Expert Group on Planning at Grassroots Level headed by V Ramachandran suggested that the DPC should be headed by a professional planner. The DPC would anchor the district process in its entirety, including maintenance of data bases, monitoring outcomes of centrally and state funded programmes, training and capacity building of planners, etc. Mandates of other district level agencies, (e.g., District Health Service) could be amended, to provide primacy to the DPC.24
Subsequently, the concept of District Council was floated by the Panchayati Raj department. It was proposed that the Article 243 of the Constitution will be amended to form a District Council as a unified and elected body for the entire district. The District Council will include both rural as well as urban settlements (except metropolitan cities). It will be responsible for delivery of 11th and 12th schedule functions and the DPC will be made its planning arm.25 Sivaramakrishnan also argued for subjugating the DPC under the District level elected local government. He suggested that DPCs be made ‘part and parcel’ of the Zila Parishad, so that its functioning becomes integral to the Zila Parishad’s mandate. However, these suggestions are yet to be accepted by the government.26
Another ambitious new approach to address perceived developmental disparities between rural and urban areas began with the launching of the National Rurban Mission (NRuM) in 2016. The Mission aims to develop 300 rural growth clusters (100 clusters in first phase) over a three-year period. Each cluster is a set of geographically contiguous villages with a defined population threshold.27 The mission aims to strengthen economy and livelihood opportunities in the identified clusters with the provision of social (e.g., education, vocational training, healthcare) and physical (e.g., roads, sanitation, water supply, LPG) infrastructure facilities. The cluster approach offers advantages in terms of economy as well as infrastructure cost optimisation. The larger aims of the mission are to:
23 M.A. Oommen, “Decentralisation has Fallen off the Agenda,” The Hindu Business Line, 26 October 2016, accessed 11 February 2019, https://www.thehindubusinessline.com/opinion/decentralisation-has-fallen-off-the-agenda/article9272167.ece.
24 Second Administrative Reforms Commission, “Sixth Report: Local Governance,” Department of Administrative Reforms and Public Grievances, New Delhi, 2007.
25 K.C. Sivaramakrishnan, op. cit.26 Ibid.27 “Rurban Cluster,” National Rurban Mission 2016, Ministry of Rural Development, Government of India, accessed 7 November
2017, http://rurban.gov.in/cluster.html.

80REGIONAL PLANNING FOR SUSTAINABLE LAND USE IN INDIA
Bridge rural-urban divide in terms of opportunities and facilities•Stimulate local economy, reduce poverty and unemployment•Spreading social benefits of development •Attract new investments into rural areas•
The design of the rurban mission was inspired by the PURA (Provision of Urban Amenities in Rural Areas) propagated by former President of India Dr. APJ Abdul Kalam, which also seeks to develop Smart Villages as counterpoint to the Smart Cities.28 NuRM is still at a nascent stage, and therefore, it will be difficult to provide any objective analysis. Nevertheless, a particularly significant and positive component of the scheme is the inclusion of land use planning at a micro level village scale, as until now land use planning in India had remained confined to urban areas only. On the other hand, the scheme does not indicate any policy towards integration of the rurban clusters to urban nodes. Integration with the District Planning framework is also not clear.
Policies for Rural – Urban Integration in South Africa
Political and Economic Context:
South Africa has a population of 56.5 million, out of which 66.7 percent are of working age (15 to 64 years).29 Although South Africa is a major emerging economy and has a relatively high per capita GDP (PPP) of $130,090,30 income inequalities are extremely high as the apartheid era legacy persists. Employment generation is a major concern since overall unemployment level is 26.7 percent, and for the youth population (between 15 to 24 years) it is a staggering 52.4 percent.31
South Africa’s urbanisation level is 64.6 percent.32 Economic opportunities are lopsidedly concentrated around metropolitan cities.33 The end of apartheid era restrictions on mobility led to a sharp jump in urbanisation level amongst the black population, and 5.5 million people migrated to the cities between 1996 and 2001. Consequently, there had been a spurt in growth of slums and informal settlements.34
28 Chandni Singh and Andaleeb Rahman, “Urbanising the Rural: Reflections on India’s National Rurban Mission,” Asia & Pacific Policy Studies 5, no. 2 (2018): 370–77.
29 “Mid-year Population Estimate,” Statistics South Africa, accessed 20 October 2018, https://www.statssa.gov.za/publications/P0302/P03022017.pdf.
30 World Development Indicators 2018, World Bank, accessed 4 November 2018, https://data.worldbank.org/indicator/NY.GDP.PCAP.PP.CD?locations=ZA.
31 “Quarterly Labour Force Survey,” Statistics South Africa, accessed 20 October 2018, http://www.statssa.gov.za/wp-content/uploads/2018/05/Image-1.jpg.
32 United Nations, World Urbanization Prospects: The 2018 Revision, United Nations Department of Economic and Social Affairs, accessed 31 October 2018, https://population.un.org/wup/.
33 Ivan Turok and Jaquline Borel-Saladin, “Is Urbanisation in South Africa on a Sustainable Trajectory?” Development Southern Africa 31, no. 5 (2014): 675–91.
34 Alison Todes, Pieter Kok, Marie Wentzel, Johan van Zyl and Catherine Cross, “Contemporary South African Urbanisation Dynamics,” Paper Presented at UNU-WIDER Conference: Beyond the Tipping Point, African Development in an Urban World, Cape Town, 2008.

81ROLE OF SMALL TOWNS IN REGIONAL DEVELOPMENT
During the apartheid years, spatial arrangements in South Africa were characterised by racial segregation, movement restrictions, and extreme inequalities between rural and urban areas. The post-apartheid regime has sought to redress this imbalance through restructuring of local governance system, redistributive economic policies, rural land reforms and balanced regional development.
Constitutional reforms following the passage of the Local Government Act:
The Municipal Structure Act (1998) sought to abolish rural-urban differences in administrative terms and substantially empower local governments. Under the new arrangement, nine provinces of the country are sub-divided into eight metropolitan municipalities and 44 district municipalities. Third-tier in administrative hierarchy, district municipalities execute local government functions at the district level (Similar to the Zila Parishad in India). Below the district municipalities are local municipalities, which include both urban and rural areas. Big cities are governed as metropolitan municipalities. Thus, the urban-rural divide no longer exists in South Africa in administrative terms but is still in practice for functional applications such as census enumeration, land use management and development planning.
The instrument to guide economic planning is the National Development Plan (NDP). The NDP-2011 has identified agriculture (primarily livestock rearing) and agro-processing as thrust areas to address rural employment needs. Medium Term Strategic Framework of NDP has set an ambitious target of generating one million new jobs in the rural economy and reduction of rural unemployment from 49 percent to less than 40 percent by 2030. The short-term target is to generate 1,45,000 new jobs in agro-processing by 2020 and distribute land amongst 3,00,000 small farmers.35
Spatial planning for land use management has emerged as a significant tool to translate such political economic ideas into practice. One of the first acts of the government was to bring out a white paper on spatial planning in 1994.36 The NDP-2011 articulates a strong commitment towards spatial planning, for spatial targeting of developmental interventions and infrastructure investments through delineation of functional economic regions, as well as spatial planning objectives at national, state and district level, through an integrated planning framework.37 As part of the strategy, the NDP also highlighted the integral role of the small towns in urban-rural linkages for economic viability, delivery of public services, skills development and infrastructure connectivity.
35 Clinton Heimann, “Towards Inclusive Economic Development: Agri-parks Programme as a Response,” Paper Presented to National Local Economic Conference, Pretoria, 9 November 2017.
36 Gill Lincoln, “Regional Planning in South Africa: An absent mandate from 1994?” Paper Presented to 52nd ISOCARP Congress 2016, Durban, 12–16 September 2016.
37 Nozizwe Makgalemele and Ross Hoole, “District Rural Development Planning to Guide the Transformation and Upliftment of the Lives of Rural Communities through Linking Economic Production to the Value Chains and Rural-Urban Markets,” Paper Presented at the 52nd ISOCARP Congress 2016, Durban, 12–16 September 2016.
82REGIONAL PLANNING FOR SUSTAINABLE LAND USE IN INDIA
Spatial Planning and Land Use Management Act:
SPLUMA provides the normative basis to carry forward the visions of the National Development Plan (2011) towards an inclusive and equitable spatial framework for South Africa. As Makgalemele and Hoole put it, the legislation recognises the importance of land use management as the implementation mechanism for spatial plans and policy and the application of the developmental principles into practice.38 The key objectives of the act are39:
Development of a framework for spatial planning and land use management across the •country by explicitly defining the relationship between the spatial planning and the land use management system and other kinds of planning;Ensure that the system of spatial planning and land use management promotes social and •economic inclusion;Provide for development principles and norms and standards for sustainable and efficient •use of land;Ensure cooperative government and intergovernmental relations amongst the national, •provincial and local spheres of government; andRedress the imbalance of the past and to ensure that there is equity in the application of •spatial development planning and land use management systems.
SPLUMA defines the roles and responsibilities of national, provincial and local governments regarding spatial planning and requires all three spheres of government to produce SDF (Spatial Development Framework).40 The lower-tier SDFs are required to align with the priorities of the upper-tier. The national SDF provides broad strategic direction, economic priorities and identifies infrastructure investment areas. The Department of Rural Development and Land Reform (DRDLR) had been entrusted with the primary responsibility of the national SDF and guiding land development in the national interest, framing of regulations, exemptions and delegations in terms of the Act. The provincial government coordinates the planning process. It supports, monitors and strengthens the municipalities, settles disputes and frames the provincial SDF.
The municipal governments are responsible for framing of the SDF within their area. District Municipalities are responsible for district level planning, and integration of plans prepared by Local Municipalities. By firmly placing the municipalities in charge of land use planning and development process, SPLUMA has also sought to simplify the planning process. The earlier system involved several agencies with overlapping jurisdictions.
The municipal SDF is a comprehensive document, which articulates long-term and near-term development vision, application of development planning principles, implementation roadmap and investment requirements. It must be aligned with priorities identified by the upper-tier and needs to be reviewed at five-year intervals.
The Department of Rural Development and Land Reform has developed a GIS-based National
38 Ibid.39 Spatial Planning and Land Use Management Act, 2013, Department of Rural Development and Land Reform, Pretoria, 2013.40 N. Makgalemele and R. Hoole, op. cit.

83ROLE OF SMALL TOWNS IN REGIONAL DEVELOPMENT
Spatial Economic Opportunity Atlas (NSEOA), which provides a vital tool for integration of municipal, provincial and national SDF under SPLUMA.41 The Atlas is being used to collate existing base information and analyses of growth sectors, threats, opportunities and weaknesses in the South African spatial economy, and will present these in an easy to use electronic and internet-based system, which will allow for scenario modelling and trend analysis. It is envisaged that the Atlas will also become a portal to link other relevant economic and spatial information, legislation, policies, plans and relevant initiatives occurring in South Africa.
Agriculture-led District Planning:
This sub-section illustrates how the integrated planning encompassing economic and spatial dimensions, and involving multi-tiered governance hierarchies, as conceptualised by the NDP (2011) and legislated by the SPLUMA (2013) is unfolding, through the example of the Agri-Park planning by District Municipalities.
South Africa’s Department of Rural Development and Land Reform launched a Comprehensive Rural Development Programme (CRDP) in 2009 with three goals42 meeting basic needs in terms of
Figure 1: Agri-Park Network in South Africa
Source: Heimann, 2017.43
41 Mfanafuthi Gama, Enkosi Mpondo and Sue Bannister, “District Rural Development Planning to Guide the Transformation and Upliftment of the Lives of Rural Communities through Linking Economic Production to the Value Chains and Rural-Urban Markets,” Paper Presented at the 52nd ISOCARP Congress 2016, Durban, 12–16 September 2016.
42 C. Heimann, op. cit.43 Ibid.
84REGIONAL PLANNING FOR SUSTAINABLE LAND USE IN INDIA
infrastructure provisions, rural enterprise development, and establishment of village industries and expansion of access to credit facilities. In 2015, the scope of CRDP was expanded to include an ambitious programme of developing Agri-Parks in each of the 44 rural districts of the country (27 districts in priority), to improve value chain linkages of agricultural produce and impart skill development for rural population. Figure 1 shows national Agri-Park network arrangement.
District Municipalities have been entrusted as nodal agencies to rollout the master plan for the Agri-Parks within its spatial development framework.44 District Municipalities are required to develop a business model, by targeting one or more commodities based on its agricultural comparative advantage and SWOT analysis. This involves comprehensive mapping of the economic potential of the district, especially regarding agriculture (including cropping, livestock, dairy farming, fisheries, etc.) and agro-processing. Functional economic regions associated with the agricultural comparative advantage are analysed and areas associated with the value chain flows are identified. The business model then informs infrastructure planning, land use guidelines, funding arrangements, capacity building and training needs, and implementation roadmap.
Agri-parks are visualised as a networked innovation of agro-production, processing, logistics, marketing, training and extension services located in a District Municipality.45 As a network, it enables a market-driven combination and integration of various agricultural activities and rural transformation services. As a governance model, it is a stakeholder consultation platform, which attempts to bring together various government departments and parastatal agencies together. It also opens opportunities for greater engagement between government and private sector actors. On a programmatic front, Agri-parks are designed to ensure increased access to infrastructure and production as well as developing existing and creating new markets to strengthen and expand value-chains, and thus, promote rural urban linkages. The specific model was designed after studying agricultural produce marketing practices in India, Mexico, Brazil and few European countries.
The four key strategic objectives of Agri-parks are46: The establishment of Agri-parks in all the 44 District Municipalities of South Africa, which •will kick-start the rural economic transformation for these rural regions; To further develop the skills of, and provide support to smallholder farmers through the •provision of capacity building, mentorship, farm infrastructure, extension services, production inputs and mechanisation inputs; To enable producer ownership of the majority of Agri-parks’ equity (70 percent), with the •state and commercial interests holding minority shares (30 percent); and, To bring under-utilised land (especially in Communal Areas, other state land and land reform •farms) into full production over the next three years and expand irrigated agriculture.
44 N. Makgalemele and R. Hoole, op. cit.45 C. Heimann, op. cit.46 Ibid.

85ROLE OF SMALL TOWNS IN REGIONAL DEVELOPMENT
The Agri-park comprises three distinct, but interrelated components:47
Farmer Production Support Unit (FPSU): is a rural outreach centre that links farmers with •markets. The FPSU does primary collection, some storage, some processing for the local market, and extension services including mechanisation. It supports the targeted commodity producers. Agri-Hub Unit (AH): The AH is a production, equipment hiring, processing, packaging, •logistics and training (demonstration) unit. Rural Urban Market Centre Unit (RUMC): has three main purposes: •i. Links and contracts rural, urban and international markets ii. Acts as a holding-facility, releasing produce to urban markets based on seasonal trends. iii. Provides market intelligence and information feedback, to the AH and FPSU, using latest
information and communication technologies.
Figure 1 shows the components of the Agri-park and their interrelationships. Figure 2 shows spatial clustering and network arrangements according to Agri-park Master Plan and SDF of Bojanala Platinum District in North West Province of South Africa.
47 Ibid.
Figure 2: Agri-park Model and its Linkages
Source: Agri-park Draft Master Plan (2016), Bojanala Platinum District Municipality Location of FPSU, AH and RUMC are decided by the District Municipalities and are incorporated within District SDF and Local SDF.
District Municipality Growth and Development Objec�ves
Farmer one
Farmer two
Farmer three
Farmers ...n
2: Farmer Produc�on
Support Unit (FPSU)
Number of Small scale industrial sites across a
District
i.e. can incl.: Feedlots,
Cattle Collection
scheme, auction
facility, small
abattoir, butcher for
local market,
extension services,
mechanisation
centre, etc
3: Agri-Hub (AH)
Large Agri-related industrial park
site
i.e. can incl.: Agro-
processing plants
(e.g. large aba�oir, etc), equipment hire,
packaging material
suppliers, logistics,
Retail & Of�ice space,
Community services
facilities and etc
4: Rural Urban Market
Centre(RUMC)
i.e. can incl.: Marke�ng &
Informa�on centre , can also include distribu�on depot
for markets
Export Markets
Domes�c Markets(provincial & na�onal)
Local market(i.e. District and/or local
Municipal and community
based)
Provincial Growth and Development Objec�ves
South Africa’s Na�onal Development Priority Outcomes (incl. Na�onal Development Plan Goals)
District Municipality Spa�al Development Framework Objec�ves (integra�ng Agri-Park Model)
A: Farm Gate B: Consumer Plate & Products
1: Targeted Commodity(ies) Producers
5: Markets
ab c
d
e
f

86REGIONAL PLANNING FOR SUSTAINABLE LAND USE IN INDIA
District planning in the case of Bojanala Platinum District shows a concerted effort to synergise between economic and spatial planning objectives.48 Economic analysis identified Beef Cattle (including dairy milk production, meat processing, hide and tanning) to be the primary agricultural commodity. Functional regions within the district were analysed to identify functional economic areas associated with the supply chain linkages of the commodity and spatial alignment requirements (Figure 3). Detailed business plan was developed in consultation with the concerned stakeholders to identify infrastructure and skill development needs.
Based on the above analysis, locations, spatial distribution in the Local Municipalities (LM) and numbers of agri-park components to be developed within the district were identified:49
FPSU: Madibeng, Moses Kotane, Rustenburg, Kgetleng River, Moretele Local Municipalities•AH: Moretele Local Municipality•RUMC: Madibeng LM or Rustenburg Local Municipality•
Figure 3: Bojanala Platinum district Spatial development Framework
Source: Agri-park Draft Master Plan (2016), Bojanala Platinum District Municipality.
48 “Agri-Park Final Draft Master Plan 2016,” Bojanala Platinum District Municipality, North West Province, South Africa, accessed 18 October 2018, http://www.ruraldevelopment.gov.za/phocadownload/Agri-parks/Cammisa/BOJANALA-Agri-Park-MBP-April2016.pdf.
49 Ibid.

87ROLE OF SMALL TOWNS IN REGIONAL DEVELOPMENT
In terms of physical planning, the District Plan has adopted a ‘cluster-network’ approach to facilitate balanced development in all five-constituent local municipal areas. Thus, each local municipality has been allocated one Agri-park component. Moreover, in keeping with the NDP guideline regarding spatial consolidation around small towns to achieve scale economy in infrastructure provision, the district plan has sought to locate the agri-park components such as FPSU, AH and RUMC as integrated clusters around small towns, instead of dissipating the same into sparse rural settlements.50
By launching the ambitious Agri-park programme, South Africa has made a strong pitch to revive small town economies and increase rural jobs. By and large, lower tier governments have also reacted positively, and within a short time, over 75 percent of the District Municipalities have prepared relevant plans and guidelines. It is to be seen how the plans are being implemented. Main challenges envisaged are inadequate planning capacities, especially in poorer District Municipalities,51 complex co-ordination problems between the three levels of government and within municipalities, and difficulties in financing of infrastructure projects in a low economic growth environment, as anticipated private sector investment flows may slow down.
Lessons Learnt and Policy Takeaways
South Africa had been able to put in place a fairly robust institutional architecture for coordinated planning, through instruments such as National Development Plan (2011), Spatial Planning and Land Management Act (2015), and the Agri-park programme (2015). These recent initiatives offer certain valuable lessons for development planning in India, as both countries face similar structural challenges.
One, South Africa’s national government has shown high level of commitment towards spatial planning. This could be attributed to the unique political culture of the country, informed and inspired by the legacy of the anti-apartheid struggle against racially segregated spatial arrangements. Policy elites see spatial planning at a regional level as a crucial instrument of nation building–to reverse past wrongs, and to build a less unequal and just society. Apart from passing the landmark SPLUMA act, all higher tier policy statements such as NDP 2011, Infrastructure Plan 2012, and Agri-park Policy (2015) had also foregrounded spatial planning and land management issues. Higher visibility in the policy praxis had aided downstream implementation.
Two, regional planning in South Africa has developed an elaborate institutional framework to bring closer alignment across governance hierarchies, settlement topologies and economic sectors. Roles and responsibilities of the government at national, provincial and local scales have been specified under planning instruments such as SPLUMA and Agri-park. The Agri-park policy has a built-in mechanism for harmonisation between economic plans, business plans, physical plans, funding plans and institutional human resource capacity. Planning for agricultural commodity flows, span across rural and urban spaces of various sizes to leverage value chain
50 Ibid.51 “Quarterly Labour Force Survey,” op. cit.
88REGIONAL PLANNING FOR SUSTAINABLE LAND USE IN INDIA
potentials. The business plan shows stakeholder engagement involving public and private sector, small and big farmers, agriculture and agro-processing industry. Thus, physical planning is based on comprehensive economic analysis and marketing strategy.
Three, South African governance arrangements have substantially empowered the District Municipalities with planning and implementation responsibilities. Centrally-funded programmes like agri-parks are dovetailed within district planning frameworks, and not implemented in isolation by line agencies. District plans cut across the rural-urban divide and provide an integrated spatial platform to bring convergence between sectoral plans and centrally-funded programs. Prime conceptual thrusts of the District Plans are to strengthen the small-town economies. South Africa’s rural development policies are thus, anchored around small towns. Agricultural support facilities and business activities are clustered around small towns, which allow several advantages, such as peer learning and skill spill over amongst the workforce and operational ease through shared cost of co-located facilities, discharge of effluents, etc. Logistics networks connect the small towns to generate scale advantages and reduce delivery cost of infrastructure support.
District level coordination between economic and spatial planning, and between rural and urban spaces had not taken-off in India, barring a few isolated cases. Developmental activities continue to shape along rural urban binaries and sectoral policies of line agencies. Moreover, centrally sponsored schemes like NRuM are being rolled out without reference to the District Plan. As the South African planning experience demonstrates, to realise the economic potentials of the small towns as engines of local economic growth and non-agricultural employment generation in rural areas, it is necessary to go beyond this fragmented approach and adopt a more cohesive planning framework at a district level regional scale. Studies indicate two major hindrances: administrative inertia of the state governments, and the institutional arrangement of the DPC vis-à-vis the political and bureaucratic hierarchy of the district administration.
The national government needs to play a proactive role to make the state governments take up district planning activities seriously. As suggested by the Planning Commission during the Eleventh Plan, release of centrally sponsored schemes, such as AMRUT, NuRM, NULM (National Urban Livelihood Mission), PMAY (Pradhan Mantri Awas Yojana) could be made conditional to the state governments constituting DPC and initiating integrated district planning. Moreover, the central schemes could be spatially targeted as per the recommendations of the district plans to improve their functional efficiency. Subsequently, the criteria for performance benchmarking of the districts across the country could be established to incentivise better performing districts. Hopefully, the National Urban Agenda, which is being finalised, will take up this issue.
It is also necessary to revisit the position of the DPC in the decision-making hierarchy and place it under the ambit of the Zila Parishad for improved administrative coordination. Districts had been the fulcrum of India’s administrative machinery for a long time and involve both rural and urban settlements. If the DPC is turned into the planning arm of the Zila Parishad, it will help the cause of democratic decentralisation, as the Zila Parishad is the elected body, which draws its mandate from the people of the district. Moreover, the functioning of the DPC will get coordinated on a day-to-day basis with other developmental activities being handled by the district administration, as suggested by Sivaramakrishnan. In this context, it will also be necessary to revisit the District Council idea circulated by the Panchayati Raj department for a holistic restructuring of the district governance system.

89ROLE OF SMALL TOWNS IN REGIONAL DEVELOPMENT
Once the DPC starts integrating the spatial plans of the rural panchayats and urban municipalities, and the sectoral plans of the line agencies through a common spatial planning framework, the next step will be to develop synergies between economic planning and physical planning. As a first step, this will include dovetailing of land use plan with centrally-funded programmes, such as Start-up India (for development of strategic marketing and business plans), NULM (training and skill development plans) and AMRUT (infrastructure plans) – to identify land banks for new entrepreneurial activities. The next step should include widening the scope for district level economic governance by including market actors and community activists in the planning process, as had been done in South Africa.

Abstract
While urban centres are known to be dynamic in terms of economic and cultural settings, equally dynamic challenges lie ahead for planners thinking about the future of what is termed as ‘mobility’. The ways in which people traverse within cities, give these spaces their character. Advancement in modes of transportation, the need for mass transit in overcrowded metropolitans of developing nations, and changed preferences in terms of residential locations have altered the way people commute. An understanding of commuting can help in developing regional plans that are oriented towards providing better transport infrastructure. This chapter examines the commuting patterns of urban workers. It explores spatial mobility patterns across urban areas in terms of commuting, and their regional characteristics. Regional planning should ideally take into consideration commuting patterns, as they follow a particular regional pattern and are influenced by urban form, and this analysis seeks to explore these patterns further.
Introduction
Urban areas as living spaces are growing, with greater migration towards cities, accompanied by natural population growth. This has resulted in the growth of metropolises, particularly in developing nations.1 Cities, as a result, have become centres of economic growth and social development.
India’s urbanisation process tends to be top-heavy, where metropolitan areas are expanding, with increased flows and interaction. The influence of metropolitan areas is no longer restricted to administrative boundaries, and is beginning to extend to the surrounding region. Economies are diversifying, with firms and residences being segregated, leading to a higher separation between the home and workplace and a subsequent demand for travel. People often choose to commute over longer distances in order to save on rent. With the existing infrastructure and spurious urbanisation, there is a higher pressure on existing transport infrastructure. To meet longer
8Development, Commuting and Regional Planning:
Inferences from the Census of India, 2011
Sabiha Baig
1 Edward W. Soja, Postmetropolis: Critical Studies of Cities and Regions, No. 307.764 S6 (Oxford: Blackwell, 2000).
91DEVELOPMENT, COMMUTING AND REGIONAL PLANNING
commutes, motorised means of transportation are being used, leading to higher automobile dependence, and contributing to pollution and energy consumption.
Urban mobility has become highly complex, with different modes of transportation being added, modal preferences of passengers changing, increasing home-to-work distances, and the friction of road density that leads to traffic congestion. Urban transportation issues are thus vital for an understanding of the needs of urban agglomerations.
The movement of people and goods impacts development and indeed the well-being of populations. Better transport infrastructure facilitates higher mobility whereby people can travel for longer distances over shorter periods of time. Spatial mobility has been viewed as a positive societal trend for people to discover new spaces, interact, and produce a culture of their own. With increased mobility, access to economic opportunities also increases.
This analysis presents an examination of regional mobility patterns. In doing so, it highlights the importance of the data being studied from a regional planning perspective. The main purpose of analysing regional travel flows and mobility patterns is to suggest that such parameters may be considered in a regional planning process.
Importance of Commuting Data in India
Mobility not only has physical implications, but also sociological ones. The way in which a city’s transportation is designed has effects on its social dynamics. Drawing a correlation between different socio-economic factors and commuting data can help in understanding the underlying factors affecting social dynamics. Recently with the emergence and rapid diffusion of information through varied communication channels, there have been notable changes in the economic and social structure of cities, with one of them being the physical substitution of mobility. Thus, commuting being substituted with remote jobs can be explored from the category of workers who “do not travel to work”.
The data relating to travel patterns in India is usually generated through surveys conducted at the city or town level. However, cities are dynamic, and as mentioned previously, their functional linkages extend beyond their municipal boundaries. Accordingly, analysing data at the regional level will help in understanding regional travel flows, and will allow for devising proper infrastructure to support such flows. Such steps will be useful in accelerating growth and development in the region.
Indian policy makers and city planners have focused on migration into cities for too long now. Migration is a part of mobility that is one-way in nature, and associated with population growth in cities. But for the first time, the Census of India 2011 published data on commuting distances and modes of transportation for ‘other workers’. According to the 2011 Census, “workers other than cultivators, agricultural labourers or working in the household industry are termed as other workers (OW).” This data provides insights into how Indians go to work and will help planners in devising better mobility plans. As the data is available at district level, it will be helpful in devising district specific solutions. Commuting behaviour will also help in understanding the socio-cultural fabric of particular urban areas.
The data available in Table B-28 of General Economic Tables of the 2011 Census has been used for this study. This data throws light on one of the three important elements of commuting,
92REGIONAL PLANNING FOR SUSTAINABLE LAND USE IN INDIA
i.e., distance travelled, and can help in understanding time-space convergence. While commuting distances have changed across the cities, the average commuting times have remained the same. The table gives the number of “other workers” by distance travelled for work and mode of travel. The data does not distinguish between inter-city and intra-city commutes. The data is available at district level for both urban and rural settings, of which only urban population has been studied.
The data is analysed in a given framework using appropriate methods of research. Simple percentages and averages were computed to look into the differences in commuting modes among different population size class of urban areas. To measure the relationship between the factors influencing different modes of transportation, multivariate correlation is used. The correlation technique shows the extent to which two or more variables are related. A correlation expresses the strength of linkage or co-occurrence between two variables in a single value between -1 and +1. The data relating to different socio-demographic parameters has also been obtained from the 2011 Census.
Mapping is an integral part of geographical research that provides clear visual impressions of various phenomena over space. As the data is present for all the districts in India, it can be visually represented for predominant modes and regional patterns can be seen. Physical constraints affect the modes used and the distances travelled. Looking at the physio-geographic map along with that of commuting with respect to distance and modes gives a clear understanding at regional scale.
Choropleth maps have been generated using ArcGIS10 software. Different methods of classification such as quantile and Jenks natural breaks classification method have been used, and will be explained in detail with the maps.
Literature Review
Researchers, academics, and several planning organisations have all examined the relevance of analysing commuting patterns in the planning process. Demography is a major driver of spatial relationships, which in turn drives residential and mobility patterns.2 The emergence of the suburb in the era of urban concentration has led to the decentralisation of economic activities whereby the production functions and people have started to move out of the cores. With the use of technology—mainly the use of private motorised means of transport — the ties that once bound urban functions have started to loosen.3 The spread of the urban institution over the landscape has become a part of the complex “outer city” which now includes jobs as well as residences.4
2 Ilan Salomon, Paul Waddell and Michael Wegener, “Sustainable Lifestyles?” in Social Change and Sustainable Transport (Indiana University Press, 2002), 125.
3 Robert Cervero, “Mixed Land-uses and Commuting: Evidence from the American Housing Survey,” Transportation Research Part A: Policy and Practice 30, no. 5 (1996): 361–77; Ralph Gakenheimer, “Urban Mobility in the Developing World,” Transportation Research Part A: Policy and Practice 33, no. 7–8 (1999): 671–89.
4 Robert Fishman, “Bourgeois Utopias: Visions of Suburbia,” in Readings in Urban Theory (Cambridge, USA: Blackwell Publishers, 1996), 23–60.
93DEVELOPMENT, COMMUTING AND REGIONAL PLANNING
Land use that creates two spatially segregated activities, — living and working —initiates the act of commuting.5 The geographical distribution of goods, services, and amenities determines the level of movement required in order to access them. Zoning, one of the important elements of present-day urban planning, results in land use which is separated according to functions, leading to an increased amount of distance involved in order to access basic needs.
The three elements of land use—density, diversity and design (commonly known as the 3Ds) — affect mobility patterns and are also considered in planning processes to achieve travel demands.6 High density ensures closer proximity of amenities and guards against urban sprawl characteristics and use of personalised motorised modes of transport that cause traffic congestion. High density is often associated with mixed land use neighbourhoods to bring in shorter trips with non-motorised transport, indicating a direct relationship between commuting and land use. Land use characteristics of residence are usually taken into account while studying the effects of it on commuting. But land-use characteristics of workplaces, including the availability of parking and the presence of bus stops, also play a very important role in commuting patterns.7 Stough8 in his study found that land use influences daily travel behaviour mainly through interaction with long-term decisions on commuting distances, car ownership and transit pass ownership.
The spatial configuration and local diversity of residences and workplaces in the city are reflective of the development pattern conditioned by planners and policy makers. At the metropolitan level, jobs and housing are generally balanced. However, within the region itself, some portions of the metropolitan areas will be rich, replete with jobs but with less available housing, and vice versa.9 Researchers work with complex urban structures, analysing the relative locations of jobs with respect to housing and the spatial separation between them as a possible underlying force driving commuting.10 According to World Urbanization Prospects: The 2014 Revision, the largest urban growth will take place in India with a projection of 404 million urban dwellers being added by 2050.11 Managing these centres will be the most important development challenge.
A decline in the mobility within developing cities can have damaging effects. The pace of urbanisation in some cities is more than 10 percent annually, resulting in enormous congestion. But the transport facility capacity and urban structure adjustments need to go hand in hand. American cities, for example, may have an average of 750 vehicles per thousand population (as
5 Robert Cervero and Samuel Seskin, “An Evaluation of the Relationships between Transit and Urban Form,” TCRP Research Results Digest 7 (1995); Susan L. Handy, “Regional versus Local Accessibility: Neo-traditional Development and its Implications for Non-work Travel,” Built Environment (1978) 18, no. 4 (1992): 253–67.
6 Robert Cervero and Kara Kockelman, “Travel Demand and the 3 Ds: Density, Diversity and Design,” Transportation Research Part D: Transport and Environment 2, no. 3 (1997): 199–219; Veronique Van Acker and Frank Witlox, “Commuting Trips within Tours: How is Commuting Related to Land Use?” Transportation 38, no. 3 (2011): 465–86.
7 Rachel Aldred, “The Commute,” in The Routledge Handbook of Mobilities (Routledge, 2014), 450–59.8 R.R. Stough, “Institutions, Landuse and Transportation,” in Handbook of Transport Geography and Spatial Systems, eds. D.A.
Hensher, K.J. Button, K.E. Haynes and P.R. Stopher (Bingley, UK: Emerald Group Publishing Limited, 2004), 26–31.9 Akshima T. Ghate, “Achieving Sustainable Mobility,” Economic & Political Weekly 51, no. 9 (2016): 33.10 Mark W. Horner, “Spatial Dimensions of Urban Commuting: A Review of Major Issues and their Implications for Future
Geographic Research,” The Professional Geographer 56, no. 2 (2004): 160–73.11 United Nations, World Urbanization Prospects: The 2014 Revision, Population Division of UN Department of Economic and Social
Affairs, 2015, https://population.un.org/wup/Publications/Files/WUP2014-Report.pdf.

94REGIONAL PLANNING FOR SUSTAINABLE LAND USE IN INDIA
compared to, say Bangkok, with 54)—but the US cities are managed better in terms of transport facilities and urban structures.12 While planning mobility projects, infrastructure requires an understanding of its impact on the socio-cultural environment of the city.13 As development leads to diversification in the economy, demand for mobility increases. This needs to be addressed with proper mobility plans aimed at providing short-term and long-term solutions.
Commuting in India
People commute as an alternative to migration in order to lower costs and lessen risk. Commuting takes place both at local and at regional scale. Many urban centres in India are unable to cater to the demands for travel due to imbalances in modal split, inadequate transport infrastructure, and lack of integration of land use and transport planning, which has encouraged a shift towards personalised modes.14 Most people prioritise saving money on rent, often substituting this with long commutes by living far away from their workplace at lower rental rates. According to an online survey portal, Numbeo, in India the average distance and time (two-way) travelled for work is 15 km and 46 minutes respectively.
The percentage share of urban workers to total workers in India shows a gradual increase, as we move up in the urban hierarchy. However, mega-urban regions have a lower average share of urban workers than metropolitan urban areas. This is because a mega-urban region is a regional spread-out of various open spaces, towns and cities. On looking regionally in different physio-geographic settings (The 1991 Census of India classified India into different physio-geographic regions at the district level), it is seen that coastal plains and islands have the highest share of urban workers in mega-urban regions, metropolitan urban areas and the small-sized urban areas. Cities in coastal regions were originally developed for the export of internal goods, and this brought about social, political, structural, and transportation changes that accelerated the process of urbanisation in this region. Flat terrain and supply of water from the rivers have helped in laying down railway tracks and roads that provide better accessibility and proximity.
As mentioned, a gradual increase is seen in the share of urban workers commuting, as we move up in urban hierarchy. Mega urban regions (93.48 percent urban workers; 80.02 percent commuters) indicate a contradiction, with a lower share of urban workers in comparison to metropolitan urban areas (94.18 percent urban workers; 79.41 percent commuters) but a higher average of commuters. The Golden Quadrilateral Highway network connects the four major metros in India —Delhi, Mumbai, Kolkata and Chennai. These regions have high density of roads with a radial pattern that allows free movement to the core from peripheral areas. Roads and railways are well unified in mega-urban regions. Proper city and regional plans for Delhi, Mumbai and Kolkata have led to segregated land use, better road infrastructure and re-location of economic
12 Ralph Gakenheimer, op. cit.13 Philipp Rode, “Mumbai: The Compact Mega City,” in Urban India: Understanding the Maximum City (London, UK: Urban Age,
London School of Economics, 2009), 45–46.14 M. Kosambi, “Urbanisation, Migration and Commuter Flows in India with a Focus on Maharashtra State’,” in Inequality, Mobility
and Urbanisation: China and India Compared, ed. Amitabh Kundu (New Delhi: Indian Council of Social Science Research and Manak Publications, 2000).
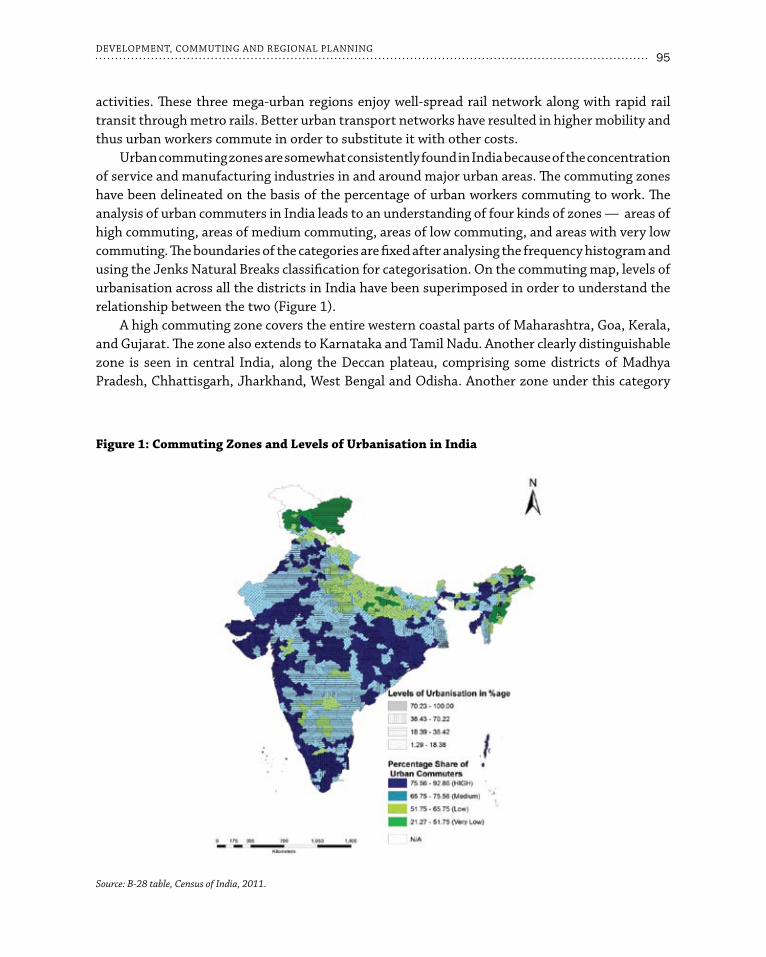
95DEVELOPMENT, COMMUTING AND REGIONAL PLANNING
activities. These three mega-urban regions enjoy well-spread rail network along with rapid rail transit through metro rails. Better urban transport networks have resulted in higher mobility and thus urban workers commute in order to substitute it with other costs.
Urban commuting zones are somewhat consistently found in India because of the concentration of service and manufacturing industries in and around major urban areas. The commuting zones have been delineated on the basis of the percentage of urban workers commuting to work. The analysis of urban commuters in India leads to an understanding of four kinds of zones — areas of high commuting, areas of medium commuting, areas of low commuting, and areas with very low commuting. The boundaries of the categories are fixed after analysing the frequency histogram and using the Jenks Natural Breaks classification for categorisation. On the commuting map, levels of urbanisation across all the districts in India have been superimposed in order to understand the relationship between the two (Figure 1).
A high commuting zone covers the entire western coastal parts of Maharashtra, Goa, Kerala, and Gujarat. The zone also extends to Karnataka and Tamil Nadu. Another clearly distinguishable zone is seen in central India, along the Deccan plateau, comprising some districts of Madhya Pradesh, Chhattisgarh, Jharkhand, West Bengal and Odisha. Another zone under this category
Figure 1: Commuting Zones and Levels of Urbanisation in India
Source: B-28 table, Census of India, 2011.

96REGIONAL PLANNING FOR SUSTAINABLE LAND USE IN INDIA
emerges in the north, from the National Capital Territory (NCT), extending downwards along the industrial corridor and northwards towards Punjab and Haryana. In north-eastern India, districts of upper Assam and Arunachal Pradesh have high commuting patterns.
On linking high levels of commuting with levels of urbanisation, a duality is found where only mega-urban regions have both high levels of urbanisation and high volumes of commuting among urban workers. Other regions with higher commuting are mostly characterised by lower levels of urbanisation. With lower levels of urbanisation, the economy is less diversified and presents limited job opportunities. In order to see maximum benefits, urban workers tend to commute, even between districts.
The second category of medium commuting occurs more widely, particularly in Andhra Pradesh, Karnataka, western Rajasthan and Madhya Pradesh. The third category, i.e., low commuting forms a belt along the Indo-Gangetic plains, starting from the foothills of the Himalayas in Punjab and Haryana, and continuing down to Uttar Pradesh and Bihar. Other districts under this category are along the border districts of Arunachal Pradesh, Nagaland, and Mizoram. The zone of lowest commuting is found in Jammu and Kashmir, Manipur, Nagaland, and some districts of Uttar Pradesh and Bihar.
Commuting Modes in Different Regions
Regions are dynamic and non-linear, working on the basis of functional connections like transportation, flows of goods, and economic activities. A higher degree of intra-regional economic interaction results in the formation of a functional region that encompasses a territorial area.15 A functional region is characterised by its “agglomeration of activities and by its intra-regional transport infrastructure,” which facilitates the movement of people, materials and ideas.16
Taking only the uppermost group for each mode of transportation, an overlay method in ArcGIS is used. It is one of the simplest methods in ArcGIS, in which different maps are superimposed on each other. This intersection of two different variables produces a new feature that symbolises areas with higher commuting as they have more than one mode of commuting in majority.
From this analysis, some major commuting regions emerge (see Figure 2). These regions have emerged singly throughout different parts of the country and form a grouping based on the high share of more than one mode of transportation, noted as follows:i) Southern part of peninsular India: This region covers the southernmost part of India that
includes districts in Tamil Nadu, Kerala, and Karnataka. The existence of two big metropolitan cities in this region makes it dynamic and economically diverse. These urban centres have led to considerable growth of numerous industrial centres in surroundings areas that are linked to one another through a well-developed road and rail network. This in turn has given rise to the spread of urban areas and land use segregation. This region has a high share of bus usage for work commutes, followed by water transport along the well-developed ports, and
15 Miha Konjar, Anka Lisec and Samo Drobne, “Methods for Delineation of Functional Regions Using Data on Commuters,” in Proceedings of the 13th AGILE International Conference on Geographic Information Science, Portugal, 2010.
16 Ibid.

97DEVELOPMENT, COMMUTING AND REGIONAL PLANNING
trains and cars, respectively. Among the privatised modes of transportation, urban workers in this region tend to prefer cars/jeeps/vans. The southern cities are marked by higher female workforce participation, better sex ratios, higher literacy rates, greater number of banks per unit of population, and higher levels of urbanisation.17 Thus, in this zone, the transport infrastructure is well developed, resulting in greater use of public transport. People travelling to longer distances for work as a share of public transport modes is highest in the region and only two districts in the region have high numbers of commuters walking to work. Greater gender equality in this region has resulted in women workers using public transport more frequently than in other parts of the country, thus raising the overall share of the mode of public transportation in this region.
ii) Coastal parts of Gujarat and Maharashtra: The trend of major transport modes used in this area is dominated by mopeds/scooters/motorcycles followed by cars/jeeps/vans, and intermediate public transport and trains. This zone has been a major, complex industrial
Figure 2: Regions by Transport Modes
Source: B-28 table, Census of India, 2011.
17 Kusum Lata Taneja, Morphology of Indian Cities, Vol. 7, National Geographical Society of India, 1971.

98REGIONAL PLANNING FOR SUSTAINABLE LAND USE IN INDIA
region because of the textile mills established here during British rule. This is reflected in the complex choices with respect to the modes of transportation used for commuting. This zone is dominated by the usage of private means of motorised transport, with trains being the only major public mode concentrated in the Mumbai metropolitan region.
iii) The National Capital Region (NCR) along with Delhi-Mumbai industrial corridor: The capital city of India is famous for its administrative functions. The fast expansion of the NCT, resulting in the recognition of a dedicated NCR has accelerated the growth of transport facilities. This in turn has encouraged the sprawl of what is now a major urban centre. The NCR is one of the most densely populated regions, with urban centres with similar functional characteristics along its industrial corridor. A high share of commuting in the central part of the NCT takes place through buses and cars/jeeps/vans. An interesting pattern is seen in this region, with the most urbanised nodes, Delhi and Mumbai, exhibiting a high share of commuters using several modes of transportation due to higher incomes. As one moves away from these centres, there is an increase in the use of motorcycles/mopeds/scooters, and intermediate public transportation modes, owing to the absence of public transport infrastructure.
iv) Upper eastern coastal plains of Odisha and West Bengal: Kolkata is located at the edge of the eastern Gangetic plain, forming the commercial capital of the megalopolis. West Bengal’s urban workers generally prefer to use trains and bicycles as their main modes of commuting. This pattern is different from those seen in other large megalopolises like Delhi and Mumbai. The coastal part of Odisha shows a high tendency of urban workers commuting to work by bicycles and mopeds/scooters/motorcycles. Odisha is one of eight Empowered Action Group states in India (that contribute to nearly 48 percent of its population, but tend to rank poorly on several human development indicators, including sex ratio and maternal mortality) and lacks proper transportation infrastructure. Due to lower levels of urbanisation, the land use pattern is mostly mixed type, resulting in shorter distances for workers between the home and workplace. This region’s commuting pattern is mainly dominated by the use of non-motorised transport (NMT) and two-wheeler motorised mode reflecting the dominance of low skilled workers in the region.
v) Chhottanagpur plateau region: This region comprises of most parts of Jharkhand as well as adjacent parts of Chhattisgarh, Bihar, Odisha, and Madhya Pradesh. The region displays a mix of modes similar to those described in the section above, with bicycling and mopeds/ scooters/ motorcycles being the major modes of transportation. Commuting by train is only limited to well-developed industrial towns like Jamshedpur, Bokaro, and Dhanbad. This region also shows the highest levels of disparity in terms of the modes used as it has some areas being served by train, which need high infrastructural investment and also districts where walking and bicycling is predominant.
vi) North-eastern tract: A concentration of different modes of transportation is seen in the north-eastern part of India. The region has hilly tracts, which hamper the growth of public transport infrastructure. There is thus a very high concentration of cars/jeeps/vans in this region, reflecting autonomy for people when it comes to deciding their routes and travel time. A typical system that operates in this region is the use of jeeps and vans as intermediate transport mode. Most of the vans and jeeps run on sharing basis, as intermediate public transport (IPT) like autos and tempos are not always strong enough for the rough terrain and

99DEVELOPMENT, COMMUTING AND REGIONAL PLANNING
roads of this region, Moreover, there is a need to maximise passengers per trip. The region is industrially underdeveloped and the urban centres mainly serve as headquarters of the respective districts, primarily for administrative purpose.
Different Correlates of Transportation Modes
According to transport economists, a worker acts as a rational consumer and chooses the mode that provides the maximum utility in terms of cost, feasibility, comfort, and time spent. The socio-economic and demographic characteristics of households become the defining elements while choosing the mode of transportation for commuting. Most literatures have found the relation between the socio-demographic factors and mode choice to be significant. In order to study the effects of different socio-economic and demographic indicators on the mode choice, a simple correlation has been carried out for different modes of transportation. The variables have been categorised into two sets based on their defining characteristics.i) Urban characteristics: Public modes of mass transportation like buses and trains are
positively correlated with the number of towns and area of the urban districts. Public modes are supported in urban areas having proper planning in terms of land use that allows the movement of these modes. All motorised modes of transportation are positively related to the area of the urban districts, as they help in overcoming space in a shorter period of time. As population density increases, people commuting by foot and bus decreases and there is a significant increase in the use of trains. As population density is one of the defining characters of urban regions, the evolution of urban transport shows the shift from a sedentary mode of transportation to faster and advanced modes of transportation.18 Commuting by foot is negatively related to the number of towns and the area they occupy, as these two indicators portray the physical extent of the urban areas, and walking is restricted only to short distances. Workers not travelling to work are negatively related, with the number of towns and the area signifying that urban workers who do not travel to work are concentrated in the small-sized urban areas.
ii) Socio-economic characteristics: To see the association between different socio-economic indicators and different modes, literacy rates and vehicular ownership have been taken into account. Vehicle ownership acts as a proxy indicator for wealth as ownership involves investment of a fair amount of capital. Literacy rate is seen to be statistically significant with all modes of transportation except by foot. Higher literacy among the population is generally linked with higher incomes, through which people can access modes of private and public transport to achieve higher comfort and reliability. There is a positive relationship between literacy rates and mode choice of cars/vans/jeeps, buses, tempos/taxis/auto-rickshaws, and mopeds/scooters/motorcycles. Commuters who are educated tend to show higher propensity towards the use of collective public transport like buses. This is because in congested metro areas, where jobs for the highly educated may be concentrated in specific areas, bus networks
18 Peter Cox, Moving People: Sustainable Transport Development, Zed Books Ltd., 2013.

100REGIONAL PLANNING FOR SUSTAINABLE LAND USE IN INDIA
provide ready service.19 Literacy rate is inversely related to modal choices for commuting like walking, bicycling, train, water transport, and no travel. From this, it can be inferred that urban workers in India commute by non-motorised means of transport due to affordability constraints, as lower literacy rates generally lead to worker being engaged in lower end jobs. The non-travelling urban workers in India are usually engaged in the informal labour market.
Average Distances Travelled
Various modes of transportation used for commuting reconfigure everyday experiences of distance and spatial ordering of social networks.20 For certain modes of transportation, like buses or metro rails, people start to perceive distances in terms of stations to be covered, thus experiencing distance in the form of stations rather than in terms of units of length. Different urban forms require different forms of infrastructure, and also shape the size and development of new projects and land use patterns. This part examines whether modes of transport used for commuting or the region in itself (i.e., the urban form) are important in terms of the average distances travelled for commuting.
Figure 3 reflects two aspects of commuting distances, the overall average commuting distance for a single urban worker and the average distance travelled by an urban worker according to different modes. The classification of average distances travelled by a worker is done through the Jenks natural breaks classification method as the data is not normally distributed and the top hundred districts for each mode of transportation are mapped. The top hundred districts have been taken into consideration, as there are large variations in the distances according to different modes, thus affecting comparability. This has been done to see if districts with higher overall commuting distance coincide with districts exhibiting higher usage of each mode. Differences between the two would result in the region or the urban form playing an important role in determining the distances to be travelled. From Figure 3, several observations have been made.
The pattern that emerges from the map on the overall average commuting distance travelled by an individual urban worker is seen to be high in and around the three mega-urban regions and in the metropolitan urban areas in southern India (around Chennai metropolitan area and Bengaluru). Urban workers in the state of Jammu and Kashmir also travel longer distances. Urban workers in mega urban regions like the NCT, Mumbai Metropolitan Area, and Kolkata Metropolitan Area travel over much longer distances as the economic activities in the region are highly diversified and decentralised. With better road transport infrastructure in these areas, the employers gain higher flexibility in terms of location of firms, causing people to travel further. In the state of Jammu and Kashmir, the average distance of commute for an individual urban worker is high because land use is highly segregated. The urban areas serve largely administrative
19 Narisra Limtanakool, Martin Dijst and Tim Schwanen, “The Influence of Socioeconomic Characteristics, Land Use and Travel Time Considerations on Mode Choice for Medium- and Longer-distance Trips,” Journal of transport geography 14, no. 5 (2006): 327–41.
20 Op. cit., n. 7.

101DEVELOPMENT, COMMUTING AND REGIONAL PLANNING
purposes and offices are mainly concerned with public administration. People tend to live in their native homes and commute for longer distances to work, possibly due to harsh climatic conditions and relative isolation of the place. As the data does not record whether the commute is intra or inter district in nature, it becomes difficult to understand the commuting pattern in detail. However, as most of the adjoining districts of the mega-urban regions have higher average distances of commuting, it can be inferred that some portion of the commuting by urban workers is taking place at an inter-district level around the higher size-class of the urban areas.
The all-India average distance travelled by an urban worker to commute (one-way) is 7.27 km, which show that most urban areas commutes can and should be planned with the framework of urban sustainability in mind. Mega, metropolitan and large urban areas have an average commute distance that is higher than the national average at 9.84 km, 9.07 km, and 7.83 km respectively. Small and medium sized urban areas have average commuting distances of 7.32 km and 6.46 km respectively. In these two size classes of urban areas, there are high regional variations in terms of the distances travelled.
Figure 3: Average distance covered (One-Way) by Urban Workers
Source: B-28 table, Census of India, 2011.
102REGIONAL PLANNING FOR SUSTAINABLE LAND USE IN INDIA
Most urban workers in India travel distances between 4 km to 10 km on an average, which is still less than workers in most developed nations. Areas where the average commuting distances are low are the hilly districts of north-eastern India and some backward districts in Madhya Pradesh, Bihar, Jharkhand, and Rajasthan. The backward districts and hilly districts are not diversified in terms of economic activities and lack proper transport infrastructures, resulting in shorter commutes.
Looking at areas of high commuting distances for individual urban workers (top hundred districts) it is interesting to note that the areas with overall high commuting distances do not coincide with the areas that display higher distances travelled for each mode. This shows that for a region to have a higher overall commuting distance, it needs to have fair share of all modes of transportation being used by urban workers.
Conclusion
Urban commuting is multi-dimensional in terms of the modes being used, distances covered, and policy decisions that govern them. The complexities of urban commuting need a thorough understanding. Commuting patterns in India vary regionally in terms of the modes of transportation and distances travelled. Physio-geographic conditions along with different socio-demographic factors give rise to commuting regions that are exclusive. From the analysis it is seen that areas of maximum commuting are concentrated along mega and metropolitan urban regions as their economies are diversified, with better transport infrastructure through which the spatial extent of opportunities increases.
The point to emphasise is the dataset provided in the Census for the first time emphasises an understanding of commuting patterns. Although it fails to capture if commuting is inter- or intra-city/town in nature, it gives clear insights in to the modes and distances travelled, reflecting commuting behaviour across the country. Even gender differences in commuting habits can be explored through this data.
Commuting has causal linkages with socio-economic and demographic parameters. Commuting patterns and preferences among the population remain varied based on regional variations in the socio-economic conditions of households and individuals and the extent of diversification seen among the population. Commuting zones in India are found to be dependent on the concentration of service and manufacturing industries in and around major urban areas. The choice of transport mode is thus the product of economic, cultural, political, and demographic parameters. In India, a majority of commutes take place by road-based transport systems, with rail-based commuting being concentrated mainly in the mega and metropolitan urban areas. The urban commuting landscape in India is still dominated by the use of NMTs. Among NMTs, commuting on foot is the most dominant mode (28 percent of urban workers.) There is a large share of the population using sustainable modes for commuting. Walking to work in India is more because of economic constraints rather than by choice. IPT thus plays an important role across all the size class of the urban areas. IPTs act as substitutes for public transportation modes and also serve as feeder services for them.
The distance to be travelled helps in mode selection. For short distances ranging between 0 km to five km in length, the preferred transport mode for commuting is by cycle and by foot. The
103DEVELOPMENT, COMMUTING AND REGIONAL PLANNING
modes that have average distances travelled more than 10 km are car/jeep/van (13 km), other modes (13.07 km), bus (23km), train (29 km) and water transport (14km). While planning for mega urban regions, these modes need to be prioritised, according to regional demands and variations.
Likewise, for the medium and small urban areas, IPT, motorcycles, and bicycles are of importance. This shows that proper planning needs to be done for people to adopt public transport even for shorter distances. Collecting data on travel time, age group of commuters, inter-modal transport, office hours, and telecommuters can help meet the gaps in data collection. It will also help in providing a detailed scenario of the transport system in India. Mapping commuting regions will help in devising better regional plans as commuting has a historical (in terms of social parameters) and spatial context.
Abstract
The rapid development of a few megacities in India has left the peripheries impoverished, leading to an extremely uneven pattern of regional development. Despite various efforts at deciphering the growth impetus, the lopsided pattern of socio-economic and spatial development has continued to dominate. At the policy level, the political and administrative efforts have remained half-hearted, failing to grasp the nature of India’s economic and societal complexities and cultural diversities. At the same time, newer regimes of globalisation have given birth to a developmental discourse that is rooted in a huge scale of spatial transformations and is found to have largely catered to the needs of finance capital while homogenising all urbanisation as ‘development’. The consequences of such grandiose scale of urban development could be seen in the form of emerging economic, environmental and political unsustainability. To plan a sustainable habitat, therefore, there is a need for discursive intervention and an alternate paradigm that recognises the specificities of various spaces. This chapter examines these issues, using as reference the megacity region of Mumbai.
Introduction: Geography, Space and Development
Regional and subregional forms of human habitation are rooted in unique socio-economic and politico-cultural processes, giving way to the shaping of the process of spatial reproduction and geographical appropriation. Although broadly, these subregional spaces are categorised as either “urban” or “rural”, there are various spatial forms between the two which are characterised by diverse cultural settings, as well as socio-spatial and economic organisations. These urban and rural forms attain their distinctive characteristics from the diversity of natural resources and human cultures. Through comparative territorial advantages, each geographical space has products, processes and territorial specialisations; they have something unique to offer and are bound to have a significant contribution to the “mother” region.
In a regional system, the subregional spaces are interwoven; each hamlet, village, town and city play their own roles according to their capacities and potentials. The independence of the sub-
9Geography and Planning: An Alternate Development Discourse
Aparna Phadke
105GEOGRAPHY AND PLANNING
spaces is maintained, even as they are interdependent, too. Jefferson1 explains this balance: the city-regions play significant roles by making cities and putting them up to specific functions to be carried out in the interest of the periphery. The “being and becoming”2 of geographic spaces is not only bound by interactions in time and space but also influenced by multiple actors placed at various scales. The political, economic and socio-cultural systems continue to evolve and reframe institutional structures to reproduce the finest “spaces” to serve the contemporary politico-economic interests of that time. A definite geographical pattern of spatial and functional co-existence emerges in the process of organic evolution, suiting the needs and demands of society.
For a greater part of Indian history, regional development remained mostly balanced. For example, the western coast had small port towns that were involved in regional trade with Arabs from the 7th to 13th century. These port towns had their own areas of influence, i.e., vibrant peripheries that have entrusted the function of commerce and trade to the cities. Many such city and peripheral spaces emerged over time, continuously repositioned in the regional hierarchy according to the existing socio-political and economic necessities. In the process, some of these spaces also lost their leading positions as trade centres and became secondary, although the process took time, allowing for the smoother economic and social transformation of these spaces.
Various regional spaces in South Asia, and India in particular, had been ruled and controlled by various dynasties but there was always continuity in the developmental paradigm. For instance, the present Kalyan city, one of the most important port towns on the western coast in Maharashtra, continued to hold its position under the successive regimes of Shakas, Kushanas, Maratha and Mughals, and there was little polarisation in the regional development. The forward and backward linkages between the core and periphery were reciprocal, symbiotic and harmonious for the larger part of history. As Adams has suggested, the regional developmental process was the result of reliance on widely different food resources and occupational specialisations.3 Similarly, Sjobeg has observed that economic prosperity with well organised power structures in the form of the ‘state’ were key factors in the development of pre-colonial urban spaces.4 A well-balanced and self-sufficient local spatial structure with enormous small and medium towns functioning as service and commercial centres was a special feature of regional subsystems. The structuring of spaces was largely based on geography, human skills, and finally capital. The rootedness of developmental processes into decentralised geographies was the most important characteristic feature of pre-colonial economy and regional development.
These equations got disrupted with the entry of the colonial capital. Colonial capital came with a different set of technologies, and engaged in resource exploitation and trade rooted in possibilistic attitudes. This altered the scale of trading operations in terms of spatial interactions and volumes. Although every epoch observed different scales of capital accumulation, there was continuity throughout history in the form of propertied wealth. It was the colonial capital that altered the equations of regional development and accumulation of wealth. It subverted
1 M. Jefferson, “The Distribution of the World’s City Folks,” Geographical Review 21 (1931).2 H. Lefebvre, Dialectic Materialism, trans. J. Sturrock (Minneapolis, London: University of Minnesota Press, 1991).3 Robert M. Adams and Carl H. Kareling, City Invincible (Chicago: University of Chicago, 1960), 32.4 G. Sjöberg, The Pre-Industrial City of Past and Present (New York: Free Press, 1960), 69–75.
106REGIONAL PLANNING FOR SUSTAINABLE LAND USE IN INDIA
geography, culture and social institutions to capital, market and commodification. Gradually, the organic processes were interrupted to become lopsided with the increasing accumulation of colonial capital in select spaces like a few cities, mostly in the coastal areas. This laid the foundation for a capital-centric form of regional development. The urban space became the locus and became intrinsically connected with the deployment and withdrawal of capital; in the process, the peripheries were excluded.
According to Lefebvre,5 this capitalistic urbanisation was decisive in dictating the appearance/disappearance, and upward/downward mobility of select spaces and their positions in the regional, national and global structural hierarchies. The massive scale of industrialisation—with its parallel accelerated pace of production, consumption and distribution—led to large-scale urbanisation in developed countries. Economies of scale resulted in exponentially rising profits that needed to be reinvested. These reinvestments preferred the existing city centres, followed by the peripheral regions that were approachable and could be connected with the centres through infrastructure. With the increasing pace of industrial urbanisation, urban and regional planning became an important means to deal with the emerging complexities of urban spaces. With cities becoming more important over regions, regional planning also shifted to city-centric paradigms. Various models pertaining to industrial and urban planning in both developed and developing countries became largely city-centric, rendering the peripheries as passive entities.
Altogether, the colonial processes founded a base of a new urban-centric regional system in India where the newly established urban centres were planned by the colonial powers to have more complementarity with the requirements of the European colonial powers.6 Such urbanisation resulted in a break in the urban continuum in space and introduced urban and rural discontinuities while treating them as disparate entities.7 The foundations of these urban structures were led by the fall of indigenous industries that supported small and medium, town-based poor artisans, who were forced to move into the newly formed colonial city centres. A pattern of urbanisation emerged with major patterns such as, for instance, lopsided economic development that led to uneven intra-urban and regional development. These regional inequalities, in turn, induced specific patterns of rural-urban migration directed towards a few megacities. The megacities eventually became overpopulated, having a highly inadequate base of civic services and infrastructural facilities that only worsened the inequalities. This led to the formation of slums which would become a feature of cities in both developing and underdeveloped countries. The socio-cultural complexities increased with the movement of heterogeneous population groups into the city—leading to conflicts, segregation and social division in the absence of any proper mechanisms for economic and social inclusion. These colonial-era trends were consolidated further post-independence, forming permanent structures of selective social, economic and spatial inclusions at the city and regional levels.
5 H. Lefebvre, op. cit.6 M. Reddy, “Urbanisation in India During Colonial Rule and Historiography: Prospectives and Problems,” Indian Journal of Research
3, no. 2 (February 2004).7 Ibid.

107GEOGRAPHY AND PLANNING
Policies of Regional Development: A Critique
Following Independence, the Indian state faced various challenges in planning, including deciphering its territory’s growth at larger scales and embracing distant geographic areas into mainstream development. The challenges were multidimensional and complex, given the diversity at the level of geographical resources, cultures, and human skills. At the same time, there were huge social and economic disparities with caste, communal and racial dimensions. Compounding the situation was the fiscal deficit at the national and regional levels, and its varied impact on the subregions. Meanwhile, the planning policies had to follow existing colonial, regional and spatial structures to continue the growth impetus in light of limitations vis-à-vis the availability of private and public capital investments in productive sectors. The following were the major challenges:
Surviving in the international market and maintaining the country’s balance of payments; •Integrating the diverse geographies, cultures and political aspirations into one administrative •and political system; Satisfying the diverse set of demands from various economic and social classes;•Establishing basic infrastructural facilities and promoting inclusive development;•Generating economic and employment momentum to deal with the problems of poverty, •unemployment, marginalisation and exclusion;Maintaining the sovereign status of the states in appropriating policies to recognise the local •terms and conditions through constitutional framework;Establishing a democratic economic, socio-cultural and political institutional framework that •would guide policymaking; Most importantly, to keep the Constitution as the fundamental institutional framework •in establishing the socio-economic development agendas of the regional planning and development policy.
The resultant planning efforts were consolidated in the form of short-term and long-term goals and five-year plans. The First to Sixth Five-Year Plans implemented consecutively from 1951-1956 to 1980 – 1985 addressed issues in a phased manner. The major planning efforts were decongestion of primate megacities; inception of growth poles; identification of backward regions; metropolitan regional development; rural development; development of small and medium cities and towns; and decongestion of primate cities. To achieve these objectives, the two approaches of regional and spatial integrations were top-down and bottom-up. The patterns of regional development can be summarised in the following points.
To decongest megacities, metropolitan regions were conceived as the unit of planning for •industrial and urban growth. For instance, the 1964 industrial location policy of South Korea to restrict the expansion of Seoul was followed in Mumbai Metropolitan Region (MMR); urban policy of London to develop new (twin) towns (1946) got replicated in India; relocation of offices in the peripheral regions in many cities like Mumbai, Delhi, followed the plan of Copenhagen that was meant for regulating the urban sprawl. Also, the radial corridor plan for the national capital region of Washington was followed to design the national capital region of Delhi.
108REGIONAL PLANNING FOR SUSTAINABLE LAND USE IN INDIA
The growth of megacities was restricted by imposing various regulations like the urban •land ceiling act which imposed restrictions on the development of vacant urban lands. The industrial growth was redirected towards the identified outlying industrial district and estates by offering subsidies and incentives to small, medium and large-scale industries. Establishment of twin cities, planned towns and satellite towns to decentralise the urban •development over a metropolitan region.Schemes like Integrated Development of Small and Medium Towns (IDSMT) were introduced •to distribute the developmental impetus to small cities and towns, to reduce the burden on the few megacities. The concept of settlement hierarchy within a metropolitan region with nested power •hierarchy became the base of metropolitan regional planning.8 A Task Force on Planning and Development of Small and Medium Towns was constituted in 1975 while prioritising the existing cities and towns within a population range of 50,000 to 300,000.9 To achieve the targets, the Integrated Urban Development Programme was launched. The Sixth Five-Year Plan (1980-1985) highlighted the provision of financial assistance to small and medium towns and small cities for creating economic base in the form of newer industrial estates, new commercial markets, development of advanced services and infrastructural facilities to facilitate economic growth.
The cumulative impact of these efforts can be summarised in the following:The potential of agricultural hinterlands to develop agricultural practices commercially, •remained unfulfilled due to lack of infrastructure and a comprehensive policy to rejuvenate traditional occupations. A proper network to connect agricultural hinterlands with the urban markets was also absent. The Plans did not focus on the integration of various civic and administrative bodies for promoting holistic policymaking and implementation. Such integration was necessary to boost the agricultural economy and redirect agricultural products to urban markets present in the region. The development of regulated markets and cooperative marketing organisations could have been the most important strategies for regulating the flow of agricultural produce to markets.10 The lackadaisical approach to the integration of rural hinterlands resulted in their stagnation. The new industrial growth poles failed to grow independently in the absence of timely •provision of infrastructure and dependence of these industries on their “mother cities” for market facilities, labour, and technological support. Second, the types of industries were coherent with the industries in the mother cities but hardly had any backward linkages with the local economy and resources. Such industries therefore had a limited role in developing the local resources and human skills and became a case of isolated industrial development.
8 A. Kundu, “Migration, Urbanisation and Inter-Regional Inequality,” Economic and Political Weekly 21, no. 46 (1986): 2005–08; Dennis A. Rondinelli, “Asian Urban Development Policies in the 1990s: From Growth Control to Urban Diffusion,” World Development 19 (1991): 791–803; L. Batra, “A Review of Urbanisation and Urban Policy in Post-Independent India,” Working Paper Series, Centre for the Study of Law and Governance, Jawaharlal Nehru University, New Delhi, 2009.
9 S. Banerjee-Guha, “Shifting Cities: Urban Restructuring in Mumbai,” Economic and Political Weekly 37, no. 2 (2002): 121–28.10 V. Phadke, “An Analysis of the Socio-economic Characteristics of the Bombay Metropolitan Region with Special Reference to its
Rural Rimland,” PhD Thesis, University of Mumbai, Mumbai, 1982.
109GEOGRAPHY AND PLANNING
Shaw explains how the satellite towns largely failed to serve the purpose for which they were •originally set up and became victims of top-down approach with hardly any ‘trickle down’ evident and only few of these satellite towns could succeed in fulfilling the objectives.11 Most of the satellite towns became mere residential appendages dominated by the metropolis. An analysis by Kundu of urban and regional planning in the period of nationalisation (1947 •to 1991) shows that even though the number of towns in various categories increased (except class VI), the percentage of urban population in class II to VI cities and towns declined.12 In contrast, the rate of concentration of population in class I cities showed a steady increase (from 26 percent in 1901 to 68.67 percent in 2001). The efforts of decentralisation had limited success in most of the urbanised states except •Punjab and Haryana. A positive impact in those states was seen in increased agricultural productivity. In fact, a much more balanced pattern of urban and regional development in the form of more prosperous small and medium towns was witnessed in these states, standing in contrast to the stagnation of small and medium towns in the remaining states.13 The dramatic growth of small towns was most evident in areas that had been successful in producing commercial crops with agro-processing industries, as in the wheat and sugar belts of Punjab, Haryana and Western Maharashtra. The sugar industries in western Maharashtra in the initial years can be cited as good examples of cooperative movement that brought some prosperity to farmers. The ‘Amul’ movement in Gujarat also needs special mention in this regard—it emerged as a strong cooperative movement to incorporate farmers from 300 villages while giving them a sustainable source of income.
The balanced pattern of regional development was an effective measure of inclusive development for assuring distributive and spatial justice to communities at the individual and societal levels by offering opportunities and access. However, the institutional arrangements for implementing the policies remained weak. The political hierarchies degenerated into cronyism, capitalism, and corruption. They remained subservient to the political elites, leading to conditional access and availability of basic infrastructure. Similar trends dominated the successive developmental policies where structuring inaccessibility became the essential and unsaid norm of any developmental policy. For instance, the qualification criteria for having benefits of any social welfare scheme are purposive, introduced to appropriate limited resources to huge populations. Therefore, the question, who should have access to resources? –was answered with structured inaccessibility through the setting up of basic qualifying norms like having a ration card.
Interestingly, such qualifying norms became integral to any development policy. Yet, this goes against the fundamental principles of the Indian Constitution that intends to abolish
11 A. Shaw, “Satellite Town Development in Asia,” in Urban Development: A Case of Navi Mumbai, eds. R. Sharma and K. Sita (Jaipur: Rawat Publication, 2001).
12 A. Kundu, “Exclusionary Urbanisation in Asia: A Macro Overview,” Economic and Political Weekly XLIV (28 November 2009): 48–58.
13 C. Benninger, “Towns in the Development Scenario,” in Indian Median Towns: An Appraisal of their Role as Growth centres, ed. J. Diddee (Jaipur: Rawat Publication, 1997), 48–54.

110REGIONAL PLANNING FOR SUSTAINABLE LAND USE IN INDIA
discrimination. The regional and urban developmental planning is no exception to structuring inaccessibility and the same could be witnessed in the form of spatial and regional disparities, corrupt political activities, and stark socio-economic inequalities that prevailed at various spatial and regional scales, leading to fragmented pattern of development. The limited improvements were not really through the regional development and planning mechanisms but through the schemes implemented by the Centre and State. The schemes that proved most beneficial were the ones implemented by the Central Government. It is noteworthy that hardly any cognisance was taken of the schemes offered by central and state governments while formulating and implementing the regional plans. At the level of gram panchayat, there are over one hundred schemes proposed for the inclusive development of villages. Do the regional planning initiatives take them into consideration? The new economic policy introduced in 1991 deepened the already structured in accessibilities. In the absence of coordination, the various policies remained disparate, eliminating the idea of holistic planning and development.
The Logic of Contemporary Form of Urbanisation
The economic policy of liberalisation, privatisation and globalisation came as a prescription to supposedly rescue India from its problems pertaining to urbanisation. Economic liberalisation and privatisation was mainly brought to improve the health of key economic sectors. Though it prescribed the adoption of market economy principles, in the Indian context, the policy was appropriated for social welfare goals that aimed to include the masses in mainstream development. In the first decade of liberalisation, the carefully phased—and extremely slower—integration of the Indian economy into the global economy allowed the penetration of advanced economic activities; inflow of foreign direct investments; and advanced forms of technology. According to Parker, the financialisation of global capital and its presence in several forms marked the second phase of globalisation. This global capital took the form of insurance, shares, debenture and bonds, mutual funds, infrastructure bonds, capital and credits, equity share, trade share and lease finance, loans from financial institutions, venture funding, asset securitisation, payables, bill discounting, factoring services, investments in insurances, and most importantly, real estate.14 Laptavistas calls it “profit without producing”.15 This change, in the way capital recreates capital, altered the patterns of investments in places, spaces and people. Politically, it clubbed the crony capitalists with the global financial agents to form yet another layer in the political economy of urban and regional governance that was supranational. Spatially, it pushed “urbanisation” as the process of “development”, rendering all the other spatial forms and economic functions subsidiary.
The re-realisation by the Indian State about the role of megacities as engines of growth and places of global-regional-local interactions brought back the focus on megacities and, by default,
14 Tim Parker, “The Basics of Financing a Business,” accessed on 15 February 2018, https://www.investopedia.com/articles/pf/13/business-financing-primer.asp.
15 C. Lapavitsas, “The Financialization of Capitalism: ‘Profiting without Producing’,” City 17, no. 6 (2013): 793–95, DOI: 10.1080/13604813.2013.853865.

111GEOGRAPHY AND PLANNING
their regions as the most significant geographical spaces. To appropriate various forms of finance, the innovative alternatives and policy initiatives were formulated. The institutionalisation of private finance capital is seen in schemes like the JNNURM (Jawaharlal Nehru Urban Renewal Mission), AMRUT (Atal Mission for Rejuvenation and Urban Transformation), SMART cities, and SMART villages, among others. By default, megacities and their regions became the seat of these financial experiments, leading to a range of capital-intensive and technology-based urban and regional planning experiments. The retrofitting of new planning experiments over the existing regional and spatial structures is something specific that one needs to recognise while analysing the impact of current planning on spaces.
Pertaining to these changes, there has been a major policy shift vis-à-vis contemporary spatial planning and development, leading to specific forms of regional (urban) development:
Three essential features of present form of regional (urban) development are denationalisation, •jumping of scales, and selective spatial penetration. The local-regional-global economic interactions and integration are taking place at the city-regional level, many times bypassing the national and state governments. For instance, the MMRDA (Mumbai Metropolitan Regional Development Authority) can sign agreements with Australian or Chinese firms directly. As the very process of development is controlled by the private sector and speculators, mostly strategic spaces are selected and rescaled to access global markets. For example, Kharghar, a node in Navi Mumbai, predominantly an agrarian landscape was raised to house high-rise buildings meant for NRI (Non-residential Indians) and global consumer centres like shopping malls and multiplexes. The transformation has been so rapid that Kharghar has jumped many intermediate scales in the regional spatial hierarchy. The public and private capital investments are not taking place at a regional scale but in specific spaces. The select few strategic spaces within a wider region are receiving capital investment, infrastructure development and advance technology. Special Economic Zones, Export Processing Zones, Infotech parks, among others, are best examples of selective spatial development and not regional development. The spatial restructuring of megacities is leading to specific internal geography as shown in •Figure 1. The advanced economic activities like headquarters of transnational corporations and their subsidiary commercial activities like shopping malls are found to be concentrated in the key locations of megacities. Their immediate suburbs have IT & software, pharmaceuticals, and biotechnology firms. The inner peripheral towns house back offices, call centres and such subsidiary activities that have secondary importance. The outer peripheries house production sites, ports, and manufacturing. Such spatial organisation invites specific composition of resident population as well. The spaces are used for the construction of various residential and housing complexes—row houses, second homes, farmhouses, resorts, and ‘illegal’ housing in the form of encroachments. These locational specifications impact ‘what’ should come ‘where’ and ‘how’. This in turn affects the metropolitan regional planning. To support such dispersal of activities, huge infrastructure projects are taken up to link •distant peripheries to metropolitan regions, and finally to “mother cities”. Agricultural, forest, wetland, marshes, and barren lands are being converted to non-•agricultural uses in the megacity regions as well as in distant peripheries. The present form of development is land-hungry as it is the primary source of profit when processed through

112REGIONAL PLANNING FOR SUSTAINABLE LAND USE IN INDIA
many transaction cycles. In fact, the resources that can be recycled financially several times are getting commodified.
The trajectory of regional planning and development in post-independence India can be summarised in the following:
The planning efforts are highly distorted and hardly have any backward linkages with the area •of inception. There is hardly any functional co-existence and symbiosis between the newer economic activities and traditional economic activities, nor between the natural and human resources.The whole history of regional planning in India has been more of • metropolitan regional planning rather than holistic regional planning, and therefore policies have been megacity-centric. The schemes for small cities and towns could never turn them into “growth poles”. There are a number of planning authorities for a single region, leading to confusion over •jurisdictions, work areas, and decision-making. The planning unit continues to change with different schemes and different planning agencies •across time and scale, bringing ambiguity at the implementation level.
Figure 1: Restructuring of Regional Spaces: Mumbai Metropolitan Region
Source: Author’s own.
113GEOGRAPHY AND PLANNING
The implementation of policies is highly politicised and influenced by the vested interests of •the politically and economically affluent class. The policies change overnight according to who sits in power. For example, the UPA-II •government introduced JNNURM as its flagship programme for urban regeneration. The succeeding NDA government discontinued the funding to those projects that were sanctioned under JNNURM, which by then had accomplished less than 50 percent of its targets. As the policies are consolidated globally and centralised nationally, by default, they lead to •homogenisation in terms of urban transformations; technological applications; infrastructural development; and rural development. The micro-level planning is bypassed and it is at the regional level where the planning mandate is prepared and imposed from. The penetration of newer activities is evident at the cost of displacement or complete •disappearance of traditional and conventional activities and the people involved in them.There is a hasty change introduced in the land use pattern as well by liberating several land •use related regulations to allow newer land uses. The present form of urban and regional development is finance-led and real estate-led model of development. The most compromised space in the process is natural habitat that includes wetland, marshes, forests, hills, streams and flora and fauna. Highly fertile agricultural lands are being concretised, as well as open scrubs and pastoral lands essential for the survival of migratory and indigenous fauna, and even mangrove areas. With the introduction of yet another level of centralised planning in the form of global urban •policies, there remains hardly any scope for indigenous wisdom and knowledge even though the rhetoric puts emphasis on the “participatory approach”. Community participation—while taken as a core philosophy of block-level planning—is hardly implemented.India is amongst the countries that are severely threatened by the worst consequences of •climate change. Yet, in none of the recent city (vision 2020 plans) and metropolitan regional development plans (2016-36) prepared by urban local bodies and planning agencies like Mumbai Metropolitan Regional Development Authority is there reference to climate change resilience. The impacts on land use, the environment, economies, and even the cultures, of subregional •spaces, are largely irreversible. This is why the overall sustainability of current urban and regional transformations should be of serious concern.
The fallouts of current metropolitan regional planning are already being witnessed in the form of polarised social and economic development; increasing gap between the rich and poor; the concentration of capital and infrastructure in megacities; the marginalisation of weaker economic groups; huge spatial and economic displacements; and decline of conventional economic activities. The rural-urban migration continues to remain dominant, resulting in the concentration of populations in a few megacity-regions and in turn leading to immense pressure on infrastructure and civic facilities. The erosion of public and governmental social infrastructure is further worsening the people’s plight by magnifying multiple inaccessibilities. The myth of the rural being “backward” and the urban being “advanced” continues to reappear in various forms through not only official policies but also in everyday life. The urban dichotomy continues to dominate the planning visions and general perceptions with the notion of “to urbanise means

114REGIONAL PLANNING FOR SUSTAINABLE LAND USE IN INDIA
to develop”. There are increasing incidences of imbalance in terms of regional and sectoral development. The ‘sunset’ economic activities like conventional industries, agriculture are facing severe neglect at policy and investment levels. The emerging sectors and strategic regions are getting reselected for the global financial investments at various spatial scales. (See Table 1 and Figures 2 and 3).
Figure 3: World Pattern of Investment distribution by Major Sectors or Industry, 2017
Source: RBI FDI annual report, 2017-18.
Figure 2: Sectoral Foreign direct Investments – Patterns in India and the World Economy
0
2000
4000
6000
8000
10000
12000
US
$ m
illion
Sectors
2013-142014-152015-162016-172017-18 P
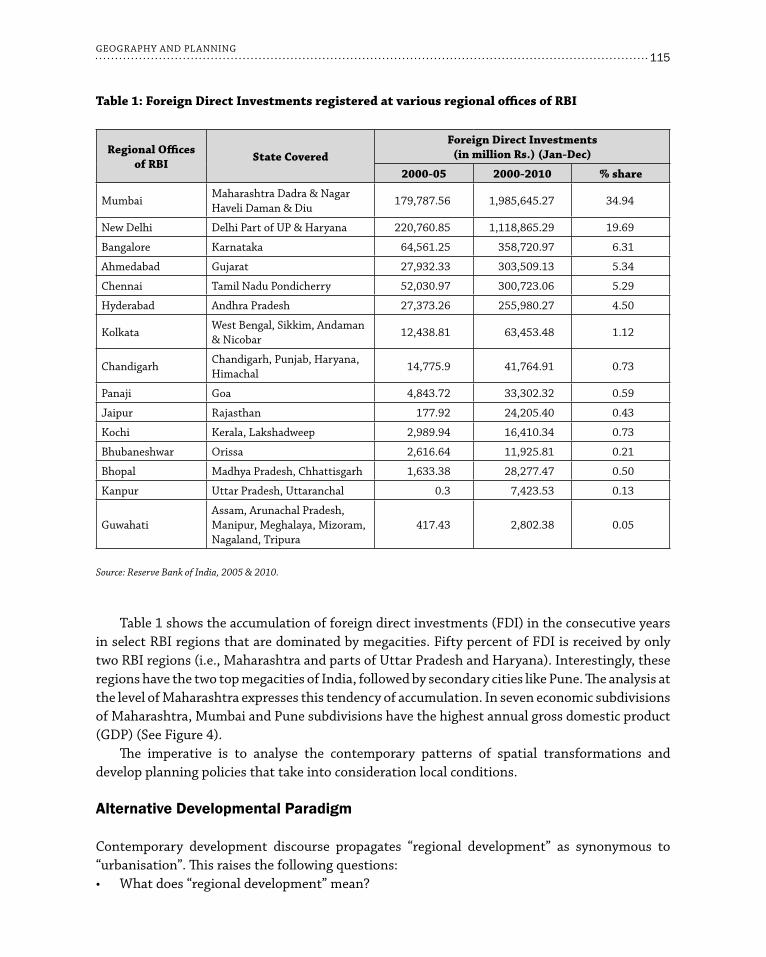
115GEOGRAPHY AND PLANNING
Table 1 shows the accumulation of foreign direct investments (FDI) in the consecutive years in select RBI regions that are dominated by megacities. Fifty percent of FDI is received by only two RBI regions (i.e., Maharashtra and parts of Uttar Pradesh and Haryana). Interestingly, these regions have the two top megacities of India, followed by secondary cities like Pune. The analysis at the level of Maharashtra expresses this tendency of accumulation. In seven economic subdivisions of Maharashtra, Mumbai and Pune subdivisions have the highest annual gross domestic product (GDP) (See Figure 4).
The imperative is to analyse the contemporary patterns of spatial transformations and develop planning policies that take into consideration local conditions.
Alternative Developmental Paradigm
Contemporary development discourse propagates “regional development” as synonymous to “urbanisation”. This raises the following questions:
What does “regional development” mean?•
Table 1: Foreign direct Investments registered at various regional offices of RBI
Regional Offices of RBI State Covered
Foreign direct Investments (in million Rs.) (Jan-dec)
2000-05 2000-2010 % share
MumbaiMaharashtra Dadra & Nagar Haveli Daman & Diu
179,787.56 1,985,645.27 34.94
New Delhi Delhi Part of UP & Haryana 220,760.85 1,118,865.29 19.69
Bangalore Karnataka 64,561.25 358,720.97 6.31
Ahmedabad Gujarat 27,932.33 303,509.13 5.34
Chennai Tamil Nadu Pondicherry 52,030.97 300,723.06 5.29
Hyderabad Andhra Pradesh 27,373.26 255,980.27 4.50
KolkataWest Bengal, Sikkim, Andaman & Nicobar
12,438.81 63,453.48 1.12
ChandigarhChandigarh, Punjab, Haryana, Himachal
14,775.9 41,764.91 0.73
Panaji Goa 4,843.72 33,302.32 0.59
Jaipur Rajasthan 177.92 24,205.40 0.43
Kochi Kerala, Lakshadweep 2,989.94 16,410.34 0.73
Bhubaneshwar Orissa 2,616.64 11,925.81 0.21
Bhopal Madhya Pradesh, Chhattisgarh 1,633.38 28,277.47 0.50
Kanpur Uttar Pradesh, Uttaranchal 0.3 7,423.53 0.13
GuwahatiAssam, Arunachal Pradesh, Manipur, Meghalaya, Mizoram, Nagaland, Tripura
417.43 2,802.38 0.05
Source: Reserve Bank of India, 2005 & 2010.

116REGIONAL PLANNING FOR SUSTAINABLE LAND USE IN INDIA
Is becoming “urban” suggestive of better development?•What kind of urbanisation is expected to happen?•Would this pattern of regional development assure balanced, equitable, inclusive and •sustainable development?Is it possible to offer economic opportunities to all in digital urban economies?•Is the aim to • urbanise spaces or to develop spaces?Is it • city or country or city and country perspective that needs to be acknowledged?
There have been various theoretical approaches about integration of city and its region to bring about symbiotic development for a balanced pattern of development. The regional approach has been popularised by many researchers but most importantly, Myrdal and Friedman had envisioned a gradual process of transformation which would bring change from a highly centralised to a polycentric system, leading in turn to a socio-cultural shift towards a continuously modernising surface and an economic shift towards increasing dispersal of economic activity. Several other researchers like Dickinson and Jecobs have stated that to achieve integrated development, there is a need to give priority to a region’s socio-economic fabric and the existing link between urban centres and their umlands.16 While such integration is important, in the case of India, the rural backwardness is so stark that often, such integration remains city-dominated. The levels of economic and socio-cultural development in subregional spaces vary to a great degree and integration of several such subregional spaces into one region is a difficult task. A traditional top-down approach cannot bring such integration. Rather, there should be an appropriate mix of top-down and bottom-up approaches. The development impetus should be multidirectional and multidimensional to address the social and cultural complexities of socio-cultural spaces.
Figure 4: Percent Share of Economic Regions in GdP
Source: Directorate of Statistics and Economics, Maharashtra, 2013.
16 R. Dickinson, City Region and Regionalism: A Geographical Construction to Human Ecology (London: Routledge and Kegan Paul Ltd., 1952); J. Jacobs, The Death and Life of Great American Cities (New York: Random House, 1961).
0
5
10
15
20
25
Mumbai &Suburban
Pune Kokan Nasik Aurangabad Nagpur Amaravati
Economic Subdivisions of Maharashtra
Perc
enta
ge s
hare
117GEOGRAPHY AND PLANNING
A case study of the Mumbai Metropolitan Region (MMR) would be appropriate here. The present MMR extends over an area of 4,355 sq. km. and comprises Municipal Corporations of Greater Mumbai, Thane, Kalyan and New Mumbai, incorporating 16 municipal towns, seven non-municipal urban centers, and 995 villages. Its administrative limits cover Mumbai city and Mumbai suburban districts and parts of Thane and Raigad districts. There are 40 planning authorities responsible for the regional sectoral development and micro level planning of the region. MMR has socio-economic set-ups in the form of conventional industries, agrarian and rural systems, tribal systems, small cities and towns, and class one cities. The regional development plans have been made in 1972, 1998 and 2017. These plans show planning in the form of zones. The zones in the regional plan of 1998 and 2017 are inspired by the needs of the financial capital. To offer macro level planning, the regional approach may allow the planners to have a planning design that is based on zones. Such zoning is disastrous, however, as it does not recognise the individual spaces and their societal, economic and cultural uniqueness in terms of their interrelations with physical environments and with each other. For example, in MMR, urbanisable zone II is planned along with the suburban railway. Along Karjat branch of Central Railway, from Badlapur to Karjat, these were agricultural fields supporting some hundreds of farmers for their living. With a zone planned along the railway, the fertile paddy lands started getting converted to non-agricultural land where buildings were eventually constructed (without any proper drainage and other necessary civic services). The similar consequences have been repeatedly experienced in rural hinterlands of MMR. Another example is Vasai Tehsil, known for fruit gardening especially bananas and chikoos. Zoning Vasai as urbanisation zone II resulted in the disappearance of these fruit gardens. It is not just about land use change. With the end of these activities, the people directly and indirectly involved in them were made vulnerable, pushing them to either the pool of unskilled labour or the unemployed. If there is no proper mechanism in place to offer alternative livelihoods, what rights does the planning agency have to uproot these people from their traditional occupations? Is it still “development”? The same goes with various other primary activities, traditional industries and other activities that do not fit in the neoliberal logic.
Such homogenised form of planning is inherent to regional planning. As the boundaries of metropolitan regions are not coterminous with either local or regional governments, it has become increasingly important to identify micro regions in a larger city-region on the basis of functional, economic, socio-cultural and political coherence than simply incorporating the adjacent areas into which the city has expanded. The individual spaces and their uniqueness get blurred in the process as regions are homogenised.
What should then be the unit of planning? The metropolitan region as a unit of planning is too big. For instance, MMR includes an area of 4,355 sq. km. Such huge area planned mechanically has definitely yielded more adversities than benefits. If the village is selected as a planning unit, it becomes too small in case of tribal villages where the number of household is as less as 20.
In the Indian context, the ideal unit of planning would be the tehsil – an administrative and fiscal unit, community development block and sub-district in India. Within tehsil, a spatial planning approach would be essentially helpful. The following are the advantages of making the tehsil the unit of spatial planning:
Tehsil remains largely homogeneous in terms of natural resources, human skills and social •
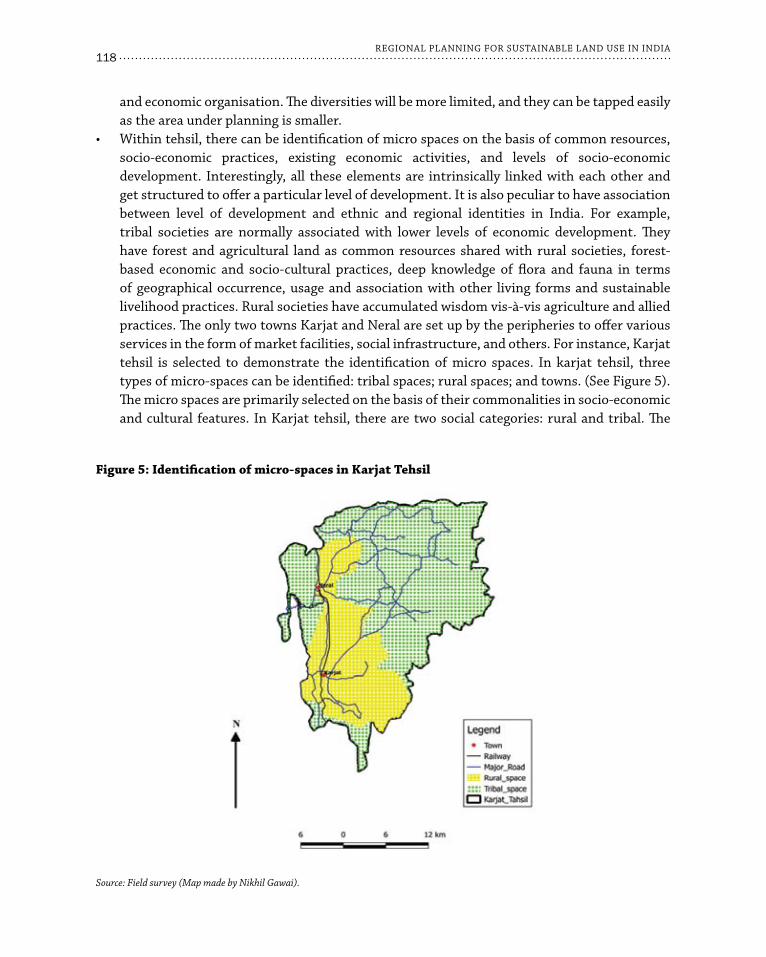
118REGIONAL PLANNING FOR SUSTAINABLE LAND USE IN INDIA
and economic organisation. The diversities will be more limited, and they can be tapped easily as the area under planning is smaller. Within tehsil, there can be identification of micro spaces on the basis of common resources, •socio-economic practices, existing economic activities, and levels of socio-economic development. Interestingly, all these elements are intrinsically linked with each other and get structured to offer a particular level of development. It is also peculiar to have association between level of development and ethnic and regional identities in India. For example, tribal societies are normally associated with lower levels of economic development. They have forest and agricultural land as common resources shared with rural societies, forest-based economic and socio-cultural practices, deep knowledge of flora and fauna in terms of geographical occurrence, usage and association with other living forms and sustainable livelihood practices. Rural societies have accumulated wisdom vis-à-vis agriculture and allied practices. The only two towns Karjat and Neral are set up by the peripheries to offer various services in the form of market facilities, social infrastructure, and others. For instance, Karjat tehsil is selected to demonstrate the identification of micro spaces. In karjat tehsil, three types of micro-spaces can be identified: tribal spaces; rural spaces; and towns. (See Figure 5). The micro spaces are primarily selected on the basis of their commonalities in socio-economic and cultural features. In Karjat tehsil, there are two social categories: rural and tribal. The
Figure 5: Identification of micro-spaces in Karjat Tehsil
Source: Field survey (Map made by Nikhil Gawai).
119GEOGRAPHY AND PLANNING
third category could be identified as small towns that are rurban in nature. The identification of rural, tribal and urban spaces is done on the basis of occurrences and location of villages and towns. The tribal space represents the area occupied by tribal villages whereas the rural space represents the area occupied by rural villages. The next step could be the identification of uniqueness in terms of resources, skills, •and cultural elements. A detailed analysis of existing economic activities in terms of opportunities, incomes, and future potential to sustain development impetus is necessary. The vulnerability of these spaces to various natural and manmade hazards must be calculated. The information can be processed to emerge with a SWOC analysis. The prediction models could be prepared to understand the durability of present models of economic development, applying the scientific methods. The students and teachers from local schools, colleges and other educational institutions can be involved in data collection, scientific applications, technological appropriations and problem solutions. Identification of new activities that can be incorporated with the existing economic fabric is essential. Introduction of supportive economic activities, introducing appropriate and low-priced technologies and strengthening of backward and forward linkages along with appropriate infrastructure with the market would supplement the socio-economic integration. For example, organic and natural farming practices; local food specialities and cuisine; agro-based industries; milk production and milk products; making of artefacts like warli paintings; agro-tourism; and adventure tourism. The next step would be developing a collective front of various agents in planning for the •tehsil. A task force consisting of community representatives, local government authorities, representatives of nongovernmental organisations, geographers, geologists and researchers from various disciplines (mostly belonging to local areas) should be involved in designing and implementing policies. At least three plans should be made to fit various probable scenarios that can be caused by climate change, economic change and/or social change. For designing the discourse of development, the communities should be involved. To improve the involvement of the community, the task force can design various activities in the form of cultural programmes, awareness programmes, and lectures. Gram sevak• , the administrative representative in the gram panchayat, should ideally be a local who has in-depth understanding of the issues. It has been observed that most of the gram sevaks in the gram panchayats in Karjat tehsil were not local, but rather from North Maharashtra; they had little understanding of the local problems. At the level of the tehsil, a task force is expected to accumulate the available policies of social •welfare and economic inclusion from the Centre, State and other agencies and integrate them in developmental policy. The information about all these schemes should be displayed in every gram panchayat office. Social media should be utilised to circulate such information. The tehsil plan should be discussed with the local people and must have the consent of at least 90 percent of local people for implementation.Technology, especially Geographical Information System (GIS), must be utilised to collect •and preserve data. There are various mobile-based applications freely available for spatial and non-spatial data collection, such as the Open Data Kit Collect. The data collected through these applications can be easily transferred to GIS environment and processed to derive specific details.
120REGIONAL PLANNING FOR SUSTAINABLE LAND USE IN INDIA
Educational systems need to be appropriated and restructured to accommodate local •knowledge and wisdom, skills, technology and geography. Educational systems can be planned in an innovative manner to have subjects dealing with scientific and technological knowledge about farming and other activities based in the region. The final outcome should be a tehsil identified with its uniqueness in terms of physical and •human resources, leading to territorial specialisation. The urban centres should be equipped with the necessary infrastructure to sell the products that are produced by the periphery.There should be at least three alternate plans that take into consideration the changing •market and climatic situations. Depending on the circumstances, the communities should decide together which plan is to be implemented. For instance, a decision about which crop to be planted in a particular climatic situation can be taken by the community on the basis of the local knowledge base. As Dickinson suggested, the functional symbiosis and spatial coexistence should be recognised •before introducing any changes. The changes cannot be defined by exact boundaries but must have a basis to harmonise as closely as possible with the existing regional fabric of the society.17
The focus of planning should be inclusive development. When the stimuli of development are locally generated and appropriated, the spaces become economically independent and are able to contribute in spatial interdependence through their territorial specialisations. This approach would not only reconstruct various spaces creatively but also strengthen the environmental and economic sustainability and preservation of local knowledge systems. As suggested by Brenner and Keil, the process of globalisation here can be appropriated creatively in terms of glocalisation.18
The proposed schema may look identical to the micro level planning in the form of block-level planning. There are, however, certain basic differences in the conception. Foremost is that the proposed schema offers a comprehensive integration of various elements of natural, economic and social life into a planning process (See Figure 6). For example, a major restructuring of educational system has been proposed where the local resource base, skills base, and knowledge systems would be acknowledged and made part of the syllabus. The blending of traditional knowhow with modern knowledge and technological systems would not only help in preserving the natural resource base but also increase the involvement of the younger, educated generation in commercialising traditional activities. There is no point in establishing agricultural universities where the courses offered are either undergraduate or postgraduate courses. These courses require a minimum level of higher secondary certification, and preferably in the natural sciences. This reinforces the inequality in educational access as the local youth will likely not have reached higher secondary education, and that too in natural sciences. Introducing agriculture as a discipline/vocational subject at the school level, would make a bigger impact. Second, the focus of the proposed scheme is on overall sustainability that strives for a balance between development
17 R. Dickinson, op. cit.18 N. Brenner and R. Keil, “Global City Theory in Retrospect and Prospect,” in The Global Cities Reader, eds. Brenner and Keil
(Abingdon: Routledge, 2006).

121GEOGRAPHY AND PLANNING
and environmental conservation where the communities would take up an action plan according to changing market situations and climatic changes. The most difficult task at present is to build climate-resilient communities and spaces. Third, alternative plans will be made and implemented by the community and tehsil level taskforce or committee as mentioned above (refer point d) in consultation with each other.
Conclusion
It is necessary to examine existing paradigms of development and examine whether these may be too narrowly based on the aims of “urbanisation of spaces”. Is this model of development capable of absorbing a half-billion working population? If not, then the reconstruction of various spaces through the local resources has to be strengthened, while respecting the geographical diversity that will be translated to spatial uniqueness. The planning should be such that most of the people get the rights to not only resources (physical, financial and infrastructural) but also to plan for their own resources and livelihoods in a sustainable manner for the long term and larger communal welfare. With the sense of rights, it is also the sense of responsibility that gets built in the community vis-à-vis resource development. The sustainability concerns would be most vital henceforth in light of the larger sustainability goals of inclusion, equity and responsibility.
Figure 6: Tehsil based Spatial Planning
Source: Author’s own.
Abstract
Contemporary urbanisation processes are vastly different in pace, scale and geography, from those of the previous century. Concentrated largely in the global South, they have led to the emergence of mega-cities, encompassing massive landmasses and populations. These mega cities are both an emerging imperative and a challenge for urban practitioners and policymakers. The inadequacy of existing planning approaches has led to a call to reinvent planning and urban management that will have to bear the additional burden of resilience. This analysis focuses on the Bangalore Metropolitan Region (BMR) in Karnataka, India, to argue for: i) acknowledging the need to delineate city-regions as the overarching planning geographies; ii) institutionalising regional plans as ‘resource plans’ that map the natural features of the city-region as ‘positive constraints’; and, iii) establishing and operationalising an iterative three-tier planning hierarchy towards a new mode of urban development and management.
Introduction
The 21st century is often referred to as the “urban century”, owing largely to the unprecedented pace, scale, and nature of urbanisation. In 2008, the United Nations Human Settlement Programme estimated that for the first time in human history, the number of people living in urban areas surpassed those in rural areas. In 1990, there were ten mega-cities (i.e. urban centres with 10 million inhabitants or more) across the world, housing 153 million people (approximately seven percent of the global urban population).1 By 2014, there were 28 mega-cities worldwide, housing 453 million people (approximately 12 percent of the global urban population). In 2015, this number rose to 34 and by 2030, the world is projected to have 43 mega-cities.2 Interestingly,
10Planning for City-Regions: Emerging Geographies,
Missing Hierarchies
Anjali Karol Mohan
1 To qualify as a megacity, an urban area must have a population of 10 million people. The UN considers urban sprawl and measures populations beyond official city limits. Based on these criteria, India currently has five megacities. The Census of India accepts this definition of mega-cities.
2 United Nations, World Urbanization Prospects: The 2014 Revision, Population Division of UN Department of Economic and Social Affairs, 2015, https://population.un.org/wup/Publications/Files/WUP2014-Report.pdf; United Nations, “Key Facts,” World Urbanization Prospects: The 2018 Revision, Population Division of UN Department of Economic and Social Affairs, 2018, https://population.un.org/wup/Publications/Files/WUP2018-KeyFacts.pdf.
123PLANNING FOR CITY-REGIONS
a majority of the 28 mega-cities of 2014 – 16 in Asia, four in Latin America, three each in Africa and Europe, and two in Northern America – are in the developing world. In other words, there is a shift in the geography of urbanisation, occurring largely in the global South. Furthermore, according to the World Urbanization Prospects, India, China, and Nigeria (all in the global South) together are expected to account for 35 percent of the growth in the world’s urban population between 2018 and 2050. India is projected to add 416 million urban dwellers, China 255 million and Nigeria 189 million. Thus, even within the global South, India is a forerunner.
Not only is there a discernible shift in the geography of urbanisation, the scale and patterns of urbanisation have also changed from those experienced in the previous century by developed nations or the global North. Mega-cities are a phenomenon of the developing world and encompass massive landmasses and populations. New urban forms characterised by sprawls, burgeoning peri-urban areas, and attendant informality differentiate the urban in the global South from that in the North. The ‘Rurban’ is a new challenge for the Southern cities.3
These statistics foreground the emerging imperative of evolving new pathways to planning cities. Massive urbanisation has given rise to challenges pertaining to the day-to-day requirements of growing populations — basic services, education and health, housing, transportation, energy systems, and other infrastructure. At the same time, the phenomenon has made “city building” an important agenda of the 21st century. An added complexity for this task of city building is that of resilience, necessitated by the global concerns of climate change, natural resource depletion, and food insecurity.4 There is an increasing acknowledgement that cities are vulnerable geographies susceptible to a range of challenges, both natural and human-induced.
India’s cities are no exception to these complexities. Economic liberalisation in the 1990s fuelled urbanisation to the extent that the beginning of the 21st century witnessed cities supporting approximately 30 percent of the total population in the country, contributing around 60 percent of the national GDP, 90 percent of the government’s tax revenues, and more than 80 percent of the incremental job creation.5 Yet, along with being centres of wealth and opportunity, Indian cities, like most contemporary cities, are sites of conflict, demanding both proactive and course-corrective planning and management interventions. Rapidly declining quality of life in these cities, especially in mega-cities, indicates the failure of current planning and governance systems. This owes, in part, to planning being “borrowed” and “imposed” by ideas developed in the global North, through complex processes of colonialism and globalisation.6 Thus, planning must
3 The term “Rurban” is gaining traction in foregrounding the integration of rural and urban areas and communities here. The idea is to match rural living standards to those in urban areas. The Government of India launched the National Rurban Mission in 2016, with the objective of stimulating local economic development, enhancing basic services, and creating well-planned Rurban clusters across the country. The policy constitutes an opportunity to start locating cities within their hinterlands or regions. For more details, see http://rurban.gov.in/about.html.
4 The 21st century has witnessed both international and national governments and other stakeholders focusing on building resilience of cities. For instance, Rockefeller Foundation’s programme titled “100 Resilient Cities” is dedicated to helping cities around the world become more resilient to physical, social and economic challenges. Similarly, UN Habitat has declared 31 October as “World Cities Day.” In 2018, the focus was on building urban resilience.
5 Sanjeev Sanyal, Sumati Nagrath and Gorika Singla, The Alternative Urban Futures Report: Urbanisation and Sustainability in India: An Interdependent Agenda (New Delhi: World Wide Fund for Nature India, 2008). http://www.habitatsummit.org/pdfs/Executive%20Summary.pdf (last accessed on 23-01-2019); Planning Commission, Twelfth Five Year Plan (2012–17), Economic Sectors, Vol. II.
6 Vanessa Watson, “‘The planned city sweeps the poor away…’: Urban planning and 21st century urbanisation,” Progress in Planning 72, no. 3 (2009): 151–93.

124REGIONAL PLANNING FOR SUSTAINABLE LAND USE IN INDIA
be reinvented so that it contextualises the transitions in the pace and scale of urbanisation and the attendant urban forms – burgeoning and sprawling cities and city-regions being a critical one. The re-invented planning pathways will also have to bear the additional burden of resilience.
While the inability of the existing planning approaches to cope with these burgeoning geographies cannot be emphasised enough, notably, most planning is limited to the city — as against the emerging city-region. Thus, planning for city-regions in the country is absent, despite the prevalent policy framework in the country – the 74th Constitutional Amendment Act (CAA), 1992 –that adopts the principle of subsidiarity to provide for a three-tier, iterative planning framework at the ward (micro)-city (meso)-region (macro) level. Few cities have operationalised this framework, although much of this is patchy and neither adheres to the philosophy nor the principle of subsidiarity. Planning is still largely limited to cities and their Local Planning Areas (LPAs) through the statutory tool of Master Plans. At best, these Master Plans constitute but one tier—meso—of the three tier hierarchy. Both the macro and the micro in this hierarchy are currently absent in most parts of the country.
Furthermore, these frameworks lack any explicit mention of achieving the crucial objective of resilience. Key questions remain unanswered: What planning approaches and processes will render cities and their regions resilient? What should such planning entail? What does a plan that aims for resilience look like? The BMR and its Structure Plan for 2031 (BMR-RSP 2031) have been used in this study to answer these questions.7 The Structure Plan employs a Land Capability Analysis (LCA) to arrive at a ‘resource plan’ at the regional scale whereby natural resources, including Bangalore’s extensive tank and valley system and watersheds are identified as ‘positive constraints’ to steering the growth and development of the region. In doing so, the paper emphasises ‘resource planning’ at the regional scale, to streamline the lower level city and ward plans, albeit iteratively. Furthermore, resource planning at the regional level, this article argues, goes a long way in achieving the objective of enhancing resilience.
City and City-region Debates
Cities have been, and continue to remain, at the centre of scholarly debates that examine, on one hand, emerging urban forms — gated communities, sprawls, edge cities, peri-urban, rurban — and, on the other, the failure of existing planning methods to manage these evolving forms. The latter is seen in high levels of poverty and inequality, coupled with a near-breakdown of urban services and amenities in these geographies. Emerging urban forms, in turn, have led to arguments where the “city in the narrow sense is [considered] less an appropriate or viable unit of local social organisation than the city-region or networks of cities in regional context.”8 Increasingly, coalitions of adjacent units of local political organisations (provinces, Länder, counties, metropolitan areas, municipalities, departments, and so on) are viewed as a means of
7 The regional plan for the Bengaluru Metropolitan Region is referred to as its Structure Plan. It is defined as a regional-level perspective plan, supporting a long-term vision for development and related spatial perspective for integrated development in the area without compromising on its ecology and natural environment.
8 Allen J. Scott, John Agnew, Edward W. Soja and Michael Storper, “Global City-regions: An Overview,” Global City Regions (Oxford: Oxford University Press, 2001).

125PLANNING FOR CITY-REGIONS
dealing with the threats and opportunities of globalisation.9 These processes, in turn, have given rise to “global city-regions” as new geographies of planning and management.
In Asian cities, the “urban field” of economic, social, and technological influences of mega-cities extend way beyond their formal boundaries. These can expand to include airports, new industrial estates, watersheds, larger recreation areas, utilities infrastructure like water and sewerage treatment facilities, power plants, urban farms, and smaller urban centres. Such regions support large populations and may fall entirely within a single political/administrative space.10 McGee uses the term ‘desakota’ to describe the growth of Asian mega cities where ‘desa’ means village and ‘kota’ refers to the city. ‘Desakota’ brings out the mixed rural-urban characteristics of mega-cities in the South-East Asian context. According to him, city-regions tend to “produce an amorphous and amoeba-like spatial form, with no set boundaries or geographic extent and along regional peripheries; their radii sometimes stretching 75 to 100 km from the urban core.”11 Asian mega-cities have thus expanded into mega-urban regions or extended metropolitan regions that encompass much larger territories and populations.12
In India too, mega-cities and city regions are on the rise. Following liberalisation, with the spurt in urbanisation, “urban (re)development [emerged] as a tool of Indian statecraft and governance,” marking a “shift away from post-Independence policies of urban containment and the primacy attached to rural development.” The “rise in the political and economic prominence of a handful of key cities and megacities … has been the driving force underpinning the more recent interest in urban issues”.13 As of 2016, India has five mega-cities – New Delhi (26.5 million), Mumbai (21.4 million), Kolkata (15 million), Bengaluru (10.5 million) and Chennai (10.2 million). It is predicted that by 2030, Hyderabad and Ahmedabad will also qualify as mega cities.14 As elsewhere, in India too, the breakdown of urban services and amenities in these geographies has necessitated the need to rethink and reinvent planning approaches.
City-Regions: Emerging, Yet Missing Planning Geographies
In India, spatial planning is limited to cities and a few city-regions. These rapidly urbanising towns and cities are planned and managed through Master/Development Plans prepared by planning authorities as per State, Town, and Country Planning Acts.15 Master Plans are synonymous with
9 Ibid.10 John Friedmann, “Toward a Non-Euclidian Mode of Planning,” Journal of the American Planning Association 59, no. 4 (1993):
482–85; Gavin Shatkin, “The City and the Bottom Line: Urban Megaprojects and the Privatization of Planning in Southeast Asia,” Environment and Planning A 40, no. 2 (2008): 383–401; A. Laquian, “The Planning and Governance of Asia’s Mega-urban Regions,” Population Distribution, Urbanization, Internal Migration and Development: An International Perspective, United Nations Department of Economic and Social Affairs, Population Division (New York: United Nations, 2011): 302–22; Allen J. Scott, John Agnew, Edward W. Soja and Michael Storper, op. cit.
11 T.G. McGee, “Metrofitting the Emerging Mega-urban Regions of ASEAN: An Overview,” The Mega-urban Regions of Southeast Asia, 1995, 3-26; A. Laquian, op. cit.
12 For a detailed analysis of planning and governance of mega-city regions, see A. Lacquian, 2011.13 David Sadoway, Govind Gopakumar, Vinay Baindur and Madhav G. Badami, “JNNURM as a Window on Urban Governance,”
Economic and Political Weekly 53, no. 2 (2018): 71.14 UN Habitat, “World Cities Report 2016,” Nairobi, Kenya, 2016.15 Urban development, housing, urban policy and urban-planning are state subjects under the Constitution of India. The central
government can, at the most, “issue directives, provide advisory services, set up model legislation and fund programmes which the states can follow at will” (Shaw, 1996 in Batra, 2009, 3).
126REGIONAL PLANNING FOR SUSTAINABLE LAND USE IN INDIA
land use plans and are often criticised as ‘colouring exercises’ having failed to coordinate the rapidly growing towns and cities in the country. Part of the problem is that the underlying approach of planning is “an uncritical import from the then [post-Independence, i.e., 1947] prevalent town planning and regulatory practices in Britain and the United States of America.”16 Largely based on forecasting and management models, the master-planning model is a rational Euclidian model,17 which calls for the development of cities through strict spatial segregation of land uses.18 Scholars and practitioners argue that these Euclidian modes of planning are a part of the problem in an increasingly non-Euclidian world of multiple space-time geographies.19
There are other factors that have contributed to the failure of planning in India. A faulty definition of a Master Plan and an equally flawed process (mainly top-down and prepared by a single agency, as against a multi-stakeholder process), weak governance and implementation frameworks, lack of budgets, fragmented planning and implementation responsibilities, and lack of coordination amongst various arms of the government, are a few that merit mention. This, in turn, creates a discernible gap between challenges and emerging imperatives that cities encounter, and the planning approaches that aim to address them. Even as Master Planning for cities continues, over the last decade several cities/regions across the country—Mumbai, Goa, Delhi and Bengaluru—have witnessed increased civil society activism, often relying on the judiciary to question, and in some cases even stall these plans. This activism is accompanied by an equally emphatic call for alternatives to the current Master Plan approach.
Recently, a host of programmes and mission mode projects have been launched, encompassing urban renewal, infrastructure creation and management, housing, basic services and poverty reduction, and governance reforms. While they may be interpreted as a reaction to the failure of Master Plans to coordinate India’s rapidly expanding urban areas, many of them have little or no reference to each other. Notably, there is little that focuses on the emerging mega city-regions. Thus city-regions, while critical emerging planning geographies, are ‘missing’ in the planning hierarchies, despite a policy focus in the form of the 74th CAA.
The 74th CAA, premised on the principle of subsidiarity, mandates decentralised planning and governance structures. It provides opportunities to manage the changes associated with rapid urbanisation through a hierarchical system of plans which includes: i) micro or ward level plans by the ward committees; ii) meso or city plans at the municipal level by the municipality; and, iii) macro or regional plans at the metropolitan/district level by the Metropolitan Planning Committee/District Planning Committee. The MPC/DPC is required to prepare a draft development plan for the defined region as a framework for lower level plans.20
16 Lalit Batra, “A Review of Urbanisation and Urban Policy in Post-Independent India,” Centre for the Study of Law and Governance, New Delhi, 2009.
17 John Friedmann, op. cit.18 Lalit Batra, op. cit.19 John Friedmann, op. cit.; Darshini Mahadevia and Rutul Joshi, “Subversive Urban Development in India: Implications on
Planning Education,” 10th Congress of the Association of Planning Schools of Asia (2009): 1–18. Vanessa Watson, op. cit.20 The draft development plan is mandated to be prepared with due consideration to one, urban and rural plans prepared by
municipalities and Panchayats in the metropolitan area / district / region; and two, to matters of common interest between the municipalities and Panchayats, including coordinated spatial planning of the area. Unfortunately, the term “coordinated spatial planning” has been replaced by, in many policy documents and state acts as “consolidated planning,” referring to the consolidation of urban and rural plans.
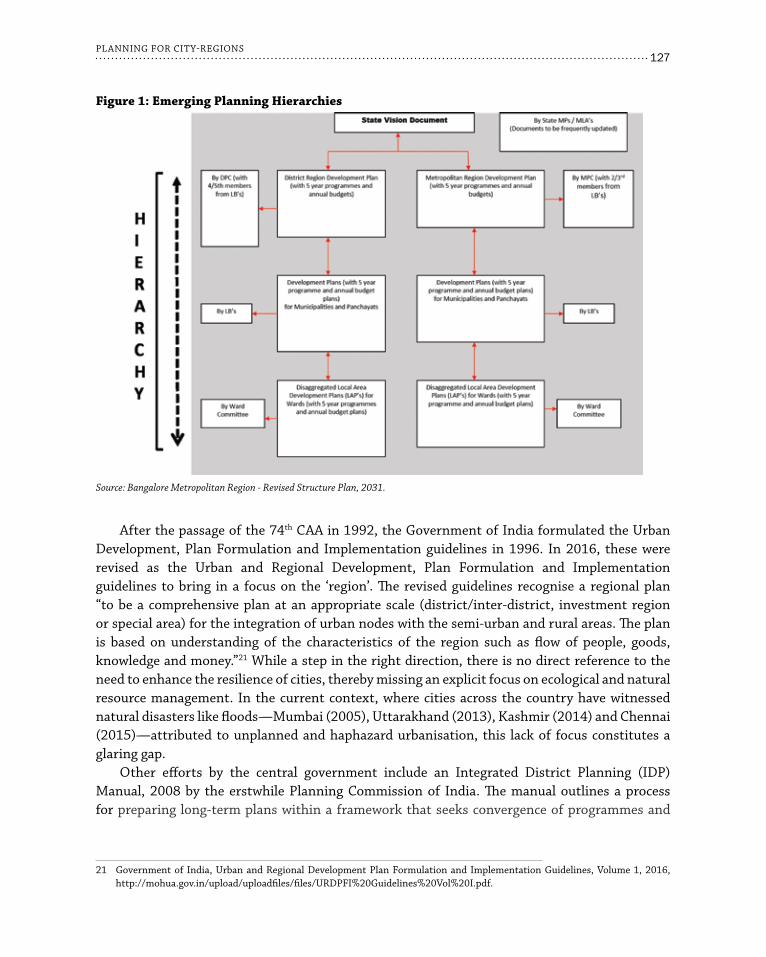
127PLANNING FOR CITY-REGIONS
After the passage of the 74th CAA in 1992, the Government of India formulated the Urban Development, Plan Formulation and Implementation guidelines in 1996. In 2016, these were revised as the Urban and Regional Development, Plan Formulation and Implementation guidelines to bring in a focus on the ‘region’. The revised guidelines recognise a regional plan “to be a comprehensive plan at an appropriate scale (district/inter‐district, investment region or special area) for the integration of urban nodes with the semi‐urban and rural areas. The plan is based on understanding of the characteristics of the region such as flow of people, goods, knowledge and money.”21 While a step in the right direction, there is no direct reference to the need to enhance the resilience of cities, thereby missing an explicit focus on ecological and natural resource management. In the current context, where cities across the country have witnessed natural disasters like floods—Mumbai (2005), Uttarakhand (2013), Kashmir (2014) and Chennai (2015)—attributed to unplanned and haphazard urbanisation, this lack of focus constitutes a glaring gap.
Other efforts by the central government include an Integrated District Planning (IDP) Manual, 2008 by the erstwhile Planning Commission of India. The manual outlines a process for preparing long-term plans within a framework that seeks convergence of programmes and
Figure 1: Emerging Planning Hierarchies
Source: Bangalore Metropolitan Region - Revised Structure Plan, 2031.
21 Government of India, Urban and Regional Development Plan Formulation and Implementation Guidelines, Volume 1, 2016, http://mohua.gov.in/upload/uploadfiles/files/URDPFI%20Guidelines%20Vol%20I.pdf.

128REGIONAL PLANNING FOR SUSTAINABLE LAND USE IN INDIA
resources to address regional imbalances through the preparation of the district development plan. It also notes that regional (macro) and local (micro) area planning often remains neglected, thus making the consolidation of urban and rural plans a virtual non-starter. Planning for rural and urban areas follows separate processes and is along different dimensions.
Panchayats prepare socio-economic plans while planning authorities in urban areas prepare land use plans, often resulting in both bodies losing perspective of each other’s proposals. What is needed is a process of consolidation of these plans. In this context, the IDP highlights priority areas for consolidation: mobility linkages and infrastructure, water resource planning — including issues of sharing of resources, rights over resources, distribution responsibilities, user charges, planning for growth and addressing environmental impact, solid waste management and related infrastructure, and protection of lakes, water bodies and tanks. While this document implicitly foregrounds the need to focus on ecology and natural resource management at a regional scale, there is little or no clarity on what the consolidated/regional plan should look like. Even though planning at all three hierarchies/scales is critical to proactively manage cities and their regions in an informed manner, the regional or macro-level plans pose an added criticality as they provide the framework for lower level plans.22
In practice, there is little or no planning on either of these scales. The most prevalent and visible exercise is that of preparing Master Plans for LPAs (and not city jurisdictions), areas larger than municipal jurisdictions. An LPA is delineated as the city’s immediate hinterland, the objective being to capture and control the immediate areas for future expansion. This delineation is often a political decision, one that is isolated from the dynamics of the city and its regions. It negates the symbiotic relationship between the city and its larger geography. Cities rely upon their regions for water, food, and energy. In turn, at the minimum, cities offer markets and employment to their regions. However, the city-centric focus of planning has recently rendered this relationship extractive and exploitative, where cities are often seen dumping waste and creating landfills in the periphery with little or no regard to the ecological consequences.
India’s five mega cities—New Delhi, Mumbai, Kolkata, Bengaluru, and Chennai—are emerging geographies. State governments have statutorily defined regions for all five cities and made provisions for preparing plans.23 In effect, though, while there is a recognition of a larger region within which the city is embedded, planning for these geographies is either missing, not given due importance, or fundamentally flawed. These plans neither recognise the symbiotic relationship between the city and the region, nor are they complied with as frameworks that guide the lower level plans.24
Evolving a regional plan is both desirable and critical to provision and manage regional level infrastructure (roads, water supply networks) as well as natural networks such as open spaces,
22 Within India, micro-level planning at the ward level through ward committees is much deliberated upon (albeit there is little to show as progress). In contrast, macro- or regional-planning, barring a few exceptions, continues to be neglected.
23 Apart from the mega-cities, several other metropolitan cities have defined and statutorily notified city-regions. 24 For example, the Bangalore Metropolitan Region was delineated in 1985; the first plan was initiated as late as 1997. The same
plan was revised and submitted to the Government of Karnataka in 2008 and was approved in 2016. In the interim eight years’ period, the Bangalore Metropolitan region has grown rapidly, in turn, compromising the ability of the plan to effectively steer the growth and development of the region.

129PLANNING FOR CITY-REGIONS
forests, and water bodies — including ground water resources. Furthermore, the presence of such a framework will enable proactive planning at the meso and micro scale as against the current practice of incremental fixes. These fixes have, in the context of rapidly exploding cities, become part of the master planning exercises at the city level. Notably, the key to getting the policy framework right lies in delineating an accurate and appropriate city-region.
Regional Planning as Resource Planning: The BMR, Karnataka, India
Defining a region for a city can be premised on several dimensions and can be arrived at through multiple ways. Administrative boundaries, socio-economic cohesion, cultural and political inter-dependency, regional and service linkages, and demographics are some of the factors that facilitate delineation.25 Critical to this delineation is the identification of the larger ecosystem that provisions the city. Identifying/demarcating city-regions basis this understanding will, in practice, imply identifying an ecological boundary — one that assists in maintaining the metabolism of the city-region. This, in turn, will enhance resilience and reduce vulnerability. Establishing ecological boundaries entails interpreting the natural capacity of the region to arrive at the capability of land for various uses/purposes. Once land capability is established and unpacked, it can be leveraged to establish a balanced relationship between the city and its region.
Establishing ecological boundaries is a detailed and complicated exercise. A crucial first step is the mapping of natural resources as ‘positive constraints’ in the city and its region. This will help in an upfront identification of ecological parameters that may be used positively to steer growth and development in the region. Both the BMR and the BMR-RSP 2031 constitute a good case study to demonstrate the mapping of ecology as ‘positive constraints’ that could eventually guide the growth and development of a region.
In 1985, the government of Karnataka constituted the Bangalore Metropolitan Region Development Authority under the BMRDA Act, 1985 and a statutory limit named ‘Bangalore Metropolitan Region’ with an area of 8,005 sq. km came into existence. The state of Karnataka has only one metropolitan region — the BMR, with Bangalore (now Bengaluru) being the only megacity in the state. Administrative boundaries are a major criterion in this delineation. The region encompasses three districts: Bangalore Urban, Bangalore Rural and Ramanagara and Channapatna. The first plan was prepared in 1997 for the year 2011. A revision was undertaken in 2008 for the year 2031. The 2031 Plan acknowledges the region as a sensitive one, especially with respect to water resources.
25 While several cities in the country have delineated city-regions, the National Capital Region (NCR) is often in the news, referred to as a “unique example” of inter-state regional development planning for a region, having a total area of over 33,500 sq. km, spanning over 15 districts in the states of UP, Haryana and Rajasthan and the National Capital Territory of Delhi, with the Nation Capital as its core. Constituted under the NCRPB Act, 1985, the key rationale was to promote balanced and harmonised development of the region, and to contain haphazard and unplanned urban growth by channelising the flow and direction of economic growth (on which the urban phenomenon feeds) along more balanced and spatially oriented paths (National Capital Region Planning Board, Ministry of Urban Development, Government of India). Similarly, the delineation of the Western Ghats Region for inclusion in the Western Ghats Development Programme was settled in 1981. The region was delineated based on elevation (600 m above MSL) and contiguity with taluka (a territorial administrative unit) was adopted. Currently, the programme is being implemented in 159 talukas, comprising Western Ghats in five states viz. Maharashtra (62 talukas), Karnataka (40 talukas), Kerala (29 talukas), Tamil Nadu (25 talukas) and Goa (three talukas).

130REGIONAL PLANNING FOR SUSTAINABLE LAND USE IN INDIA
Bangalore city is one of few in the world situated above the 1,000-metre mark. Located on a plateau, the city has several catchments in all directions draining away from it. Having no access to perennial sources of water, the city’s recent development has been driven by a reliance on the nearest perennial source, the Cauvery River. Water is pumped to the city from a facility located at a distance of 108 kilometres and more crucially, at a lower elevation of 450 metres. Prior to the reliance on Cauvery River, historically the city’s water needs were met through a system of tanks, lakes, and ponds created especially for this purpose. With the introduction of the piped water supply from the Cauvery on one hand, and the explosive growth of the city on the other, a majority of these lakes have either dried up or are under threat.
The BMR-RSP 2031 engages the Land Capability framework—a GIS based decision making tool—using multi-criteria parameters to analyse the capability of land for which it is best suited. The analysis is derived from overlaying environmental, demographic, transport, and economic parameters (referred to in Figure 3 below). “Suitability coefficients (or weightages) are used in the generation of various sectoral and intersectoral thematic maps. The output of the LCA is used to effectively address and incorporate the region’s natural resources in the physical and policy planning framework for development.”26 To move away from an exclusive ecological or environmental bias and to accommodate other critical factors that impact development, mapping of the ecological parameters is overlaid with anthropometric parameters such as industry, transport, and demographics. Together this overlaying led to an understanding of the capability of land for various purposes of development.27
Figure 2: Bangalore Metropolitan Region and Bangalore Metropolitan City
Source: Compiled by the author from various sources.
26 Government of Karnataka, Revised Structure Plan 2031, Bangalore Metropolitan Region, 2016.27 While the land capability analysis is not new in urban- and regional-planning exercises, the normal procedure is to use a Cartesian
grid for the assessment and grading of land parcels. Such a division, assessment and grading of land resource, whether urban or rural, fails to effectively recognise any of its natural characteristics. Acknowledging this aspect of conventional land capability analysis as a limitation and recognising the critical nature of Bangalore region’s natural resources, especially the criticality of water resource, the random Cartesian grid has been replaced by the mini-watershed as the reference grid.
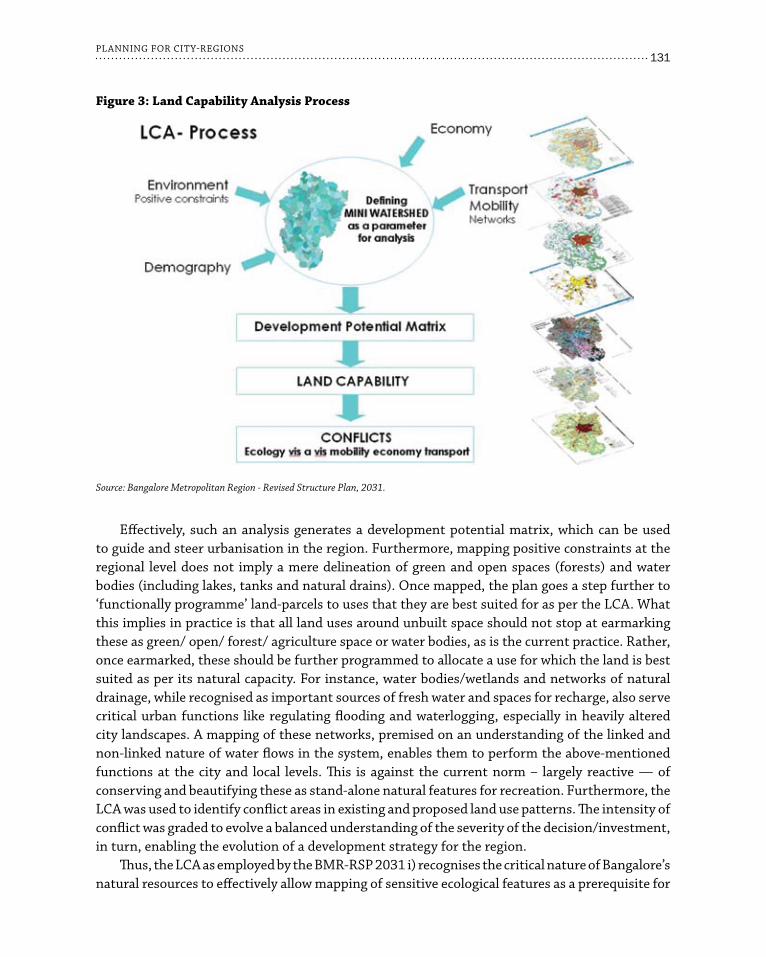
131PLANNING FOR CITY-REGIONS
Effectively, such an analysis generates a development potential matrix, which can be used to guide and steer urbanisation in the region. Furthermore, mapping positive constraints at the regional level does not imply a mere delineation of green and open spaces (forests) and water bodies (including lakes, tanks and natural drains). Once mapped, the plan goes a step further to ‘functionally programme’ land-parcels to uses that they are best suited for as per the LCA. What this implies in practice is that all land uses around unbuilt space should not stop at earmarking these as green/ open/ forest/ agriculture space or water bodies, as is the current practice. Rather, once earmarked, these should be further programmed to allocate a use for which the land is best suited as per its natural capacity. For instance, water bodies/wetlands and networks of natural drainage, while recognised as important sources of fresh water and spaces for recharge, also serve critical urban functions like regulating flooding and waterlogging, especially in heavily altered city landscapes. A mapping of these networks, premised on an understanding of the linked and non-linked nature of water flows in the system, enables them to perform the above-mentioned functions at the city and local levels. This is against the current norm – largely reactive — of conserving and beautifying these as stand-alone natural features for recreation. Furthermore, the LCA was used to identify conflict areas in existing and proposed land use patterns. The intensity of conflict was graded to evolve a balanced understanding of the severity of the decision/investment, in turn, enabling the evolution of a development strategy for the region.
Thus, the LCA as employed by the BMR-RSP 2031 i) recognises the critical nature of Bangalore’s natural resources to effectively allow mapping of sensitive ecological features as a prerequisite for
Figure 3: Land Capability Analysis Process
Source: Bangalore Metropolitan Region - Revised Structure Plan, 2031.

132REGIONAL PLANNING FOR SUSTAINABLE LAND USE IN INDIA
dictating the built environment in the region; ii) employs the mini-watershed as the defining parameter for analysis and grading of land parcels; and, iii) grades the natural potential of land in conjunction with anthropometric parameters such as industry, transport, and demographics, to evolve a development potential matrix that ultimately translates into a land utilisation plan. The land utilisation plan guides planning efforts at the lower level – the city and the ward level, although this is not the current practice, for reasons mentioned earlier.
Conclusion
For planning (for development) to enable proactive choices that foresee future risks, two fundamental changes need to be incorporated as a priority. First, the process of evolving city plans (against the current practice of preparing Master Plans for an extended area referred to as the LPA) that are capable of steering development should necessarily be an amalgamation of micro plans (ward level plans as envisaged in the 74th CAA). This will ensure a voice to the citizen agency and enable addressing genuine requirements articulated through a bottom-up process. Second, the city plan should be evolved within a framework that outlines inherent capacities and potentials of land for various uses. This framework needs to be articulated at a larger level as part of the regional plan. The regional plan should necessarily, and critically map ecological networks and other elements upfront as ‘positive constraints.’ These resources, once mapped, can guide and coordinate rapid urbanisation through lower level plans which, in adhering to the framework, are forced to acknowledge the utility of these constraints. In other words, the regional plan should fundamentally be a resource plan.
Preparing resource plans at the regional level implies an acknowledgement of the intrinsic behaviour and characteristics of the larger matrix of environment (earth systems) and their inherent potential to define limits and thresholds. This is as important, if not more, than the economic decisions, political mandates, and socio-cultural priorities that direct planners and their plans towards narrowing down development choices and priorities. Acknowledging the larger environment will enable planners to steer and guide economic and political decisions, mandates, and choices within these defined limits and thresholds. Clearly, the current master planning approach is far from achieving this objective. Operationalising the missing plans at the ward and regional scale with a simultaneous embedding of the city plan, inclusive of the objectives and the processes that drive planning at all three scales, will pave the path towards achieving resilience while avoiding further fragmentation and disruption.

Abstract
India’s urban population is growing at a fast pace. The unprecedented growth and administrative irregularities in management is leading to chaotic conditions and haphazard development. This chapter argues for the regulation of the current runaway urban growth by channelling the flow and direction of economic growth along more balanced and spatially oriented paths and developing them in the regional context. The case of India’s National Capital Region (NCR) is presented to draw attention towards ongoing efforts in this direction. A critical appraisal of the Regional Plan-2021 for NCR reveals that the plan provides a model for sustainable development of urban and rural settlements to improve quality of life as well as rational regional land use. The analysis finds that even as the plan has achieved certain goals, a lot more still needs to be done.
Introduction
Urbanisation, or the spatial concentration of people and economic activities, has been the most significant social transformation in the history of civilisation. While the timing and speed of the process have been different across countries and continents, it has left no region untouched. Post the advent of industrialisation at the end of the 19th century, urbanisation has seen continuous growth and is now a global phenomenon.
The urban population of the world has grown rapidly from 751 million in 1950 to 4.2 billion in 2018. The UN World Urbanization Prospects: The 2018 Revision states that 55 percent of the world’s population living in urban areas as of 2018, which is expected to increase to 68 percent by 2050. It was 37.3 percent in 1975, which increased to 49.4 percent in 2005 and 53.9 percent in 2015. Asia, despite its relatively lower level of urbanisation, is home to 54 percent of the world’s urban population, followed by Europe and Africa, with 13 percent each. Tokyo is the world’s largest city with an agglomeration of 37 million inhabitants, followed by Delhi with 29 million and Shanghai with 26 million.1
11Planning and Development of the National Capital
Region of Delhi: Issues and Challenges
Rajeev Malhotra
1 United Nations, World Urbanization Prospects: The 2018 Revision, Population Division of UN Department of Economic and Social Affairs (UN-DESA).

134REGIONAL PLANNING FOR SUSTAINABLE LAND USE IN INDIA
The report also made projections indicating a gradual shift of population from rural to urban areas. By 2050, the world’s population can add another 2.5 billion people to urban areas, with nearly 90 percent of this increase taking place in Asia and Africa. Specifically, India, China and Nigeria will together account for 35 percent of the projected growth, with India adding 416 million, China 255 million and Nigeria 189 million urban dwellers.
Urbanisation and Metropolitan Cities in India
The urban population in India is growing rapidly. In 1901, it was 10.84 percent; in 1951, 17.29 percent; in 2001, 27.81 percent; and in 2011, it was 31.6 percent (377.1 million) (See Table 1). The addition of population in urban areas over the last decade has been 91.0 million. The decadal percentage growth of urban population increased from 0.35 percent during 1901–11 to 46.14 percent during 1971–81 and declined to 31.48 percent during 1991–2001. However, it marginally increased to 31.79 percent during 2001–11. Table 1 shows that the share of the urban population has increased consistently, despite the decline in the decadal growth rate between 1981 and 2011.
The number of towns in India increased from 5,161 in 2001 to 7,935 in the year 2011. According to the 2011 Census, the number of metropolitan cities with a million-plus population increased to 53, from 35 in 2001.
Table 1: Urbanisation in India
YearPopulation (in Millions) Share of Urban
Population (%)decadal Growth
Rate (%)Total Urban
1901 238.40 25.85 10.84 –
1911 252.09 25.94 10.29 0.35
1921 251.32 28.09 11.18 8.27
1931 278.98 33.46 11.99 19.12
1941 318.66 44.15 13.86 31.97
1951 361.09 62.44 17.29 41.42
1961 439.23 78.94 17.97 26.41
1971 548.16 109.11 19.91 38.23
1981 683.33 159.46 23.34 46.14
1991 846.30 217.61 25.71 36.47
2001 1028.74 286.12 27.81 31.48
2011 1210.20 377.10 31.60 31.79
Source: Census of India, 1951–2011.

135PLANNING AND DEVELOPMENT OF THE NATIONAL CAPITAL REGION OF DELHI
The aggregate population of these metro cities accounts for about 32 percent of the country’s total urban population, which is spread over more than 7,900 towns. Table 2 shows the increase in the number of metropolitan cities and their population in India.
This unprecedented increase in the number of metropolitan cities has become a source of serious concern for the Government of India as well as metro-city corporators, planners, demographers and social scientists. As such, the 53 metro (or million-plus) cities should be the focus of a sustained, country-wide effort to regulate and contain runaway urban growth, by channelling the flow and direction of economic growth (on which the urban phenomenon feeds) along more balanced and spatially oriented paths and developing them in a regional context. This is essentially what the National Capital Region (NCR) Planning Board is attempting to do with respect to the national capital city. Other metropolitan cities such as Mumbai (Mumbai Metropolitan Region), Kolkata (Kolkata Metropolitan Region), Chennai (Chennai Metropolitan Region) and Bangalore (Bangalore Metropolitan Region) are also making similar efforts.
The UN World Urbanization Prospects: The 2018 Revision, prepared by the Population Division of UN Department of Economic and Social Affairs (UN-DESA), indicated that in terms of population, Delhi (29 million inhabitants) is number two after Tokyo (37 million inhabitants). The report also stated that Delhi will become the most populous city in the world by 2028, because the population of Tokyo will start to decline after 2020.
Growth of Population in Delhi
NCT-Delhi is one of the major urban agglomerations in the world. The decadal growth of population in Delhi (above 52 percent for the four decades from 1951-1991, came down to 47 percent during 1991–2001 (See Table 3) and to 21 percent during 2001–21. The growth of population and the decadal growth rate of Delhi have been shown graphically in Figures 1(a) and 1(b), respectively.
Table 2: Increase in the Number of Metropolitan Cities/Population (in Millions)
Year Number of Million Plus Cities
Population of Million Plus Cities
Total Urban Population
Growth Rate of Population of Million
Plus Cities (%)
Growth Rate of Million Plus Cities
(%)
1951 5 23.16 61.99 – –
1961 7 32.05 78.34 26.39 40.00
1971 9 45.63 108.26 38.18 28.57
1981 12 65.62 156.42 44.49 33.33
1991 23 89.62 215.77 37.94 91.67
2001 35 121.06 286.12 32.60 52.17
2011 53 160.73 377.11 31.80 51.43
Source: Census of India, 1951-2011.

136REGIONAL PLANNING FOR SUSTAINABLE LAND USE IN INDIA
Table 3: Growth of Population in NCT-delhi (1901–2011)
Year Population decadal Growth (%)
1901 405,819 –
1911 413,851 1.98
1921 488,452 18.03
1931 636,246 30.26
1941 917,939 44.27
1951 1,744,072 90.00
1961 2,658,612 52.44
1971 4,065,698 52.93
1981 6,220,406 53.00
1991 9,420,644 51.45
2001 13,850,507 47.02
2011 16,787, 941 21.21
Source: Census of India, 1901–2011.
Figure 1 (a) & (b): Growth of Population in NCT-delhi and the decadal Growth Rate (1901–2011)
Source: Census of India, 1901–2011.
National Capital Region
Given the unprecedented growth of population and the haphazard development of urban areas following the Partition, the GoI felt it necessary to formulate a planned development for Delhi.
0
10
20
30
40
50
60
70
80
90
100
1901 1911 1921 1931 1941 1951 1961 1971 1981 1991 2001 2011
Dec
adal
Cha
nge
(in %
)
-
2,000,000
4,000,000
6,000,000
8,000,000
10,000,000
12,000,000
14,000,000
16,000,000
18,000,000
1901 1911 1921 1931 1941 1951 1961 1971 1981 1991 2001 2011
Pop
ulat
ion

137PLANNING AND DEVELOPMENT OF THE NATIONAL CAPITAL REGION OF DELHI
The Town Planning Organisation (TPO) prepared an Interim General Plan (IGP) in 1956, which stressed the need to plan Delhi in a regional context: “Serious consideration should be given for a planned decentralisation to outer areas and even outside the Delhi region.” This was reiterated in the Master Plan for Delhi (MPD-1962) for the perspective year 1981, which defined the Delhi Metropolitan Area of 800 square miles comprising the Union Territory of Delhi and six ring towns, viz. Loni and Ghaziabad in UP, Faridabad, Ballabhgarh, Bahadurgarh and Gurgaon in Punjab (now Haryana) and Narela in the Union Territory of Delhi. Following the publication of the MPD-1962, the GoI took cognisance of the recommendation and set up a “High Power Board” under the chairmanship of the Union Home Minister, with the chief ministers of Punjab and Uttar Pradesh (representative of the Planning Commission), the Commissioner and the Mayor of Delhi as its members. The board was later reconstituted under the chairmanship of the Union Minister of Works and Housing (now Ministry of Housing and Urban Affairs).
To plan Delhi in the regional context under a suitable legislation that could control and regulate development in the region, the Parliament enacted the National Capital Region Planning Board (NCRPB) Act in 1985, with the consensus of the constituent state legislatures “to provide for the Constitution of a Planning Board for the preparation of a plan for the development of the National Capital Region and for coordinating and monitoring the implementation of such plan and for evolving harmonised policies for the control of land uses and development of infrastructure in the National Capital Region so as to avoid any haphazard development of that region and for matters connected therewith or incidental thereto.”
The NCR covers an area of 33,578 sq. km, as per the “regional plan for the NCR of Delhi for the perspective year 2021” notified in 2005, and as defined in Schedule {Section 2 (f)} to the Act, 1985 as well as subsequent notifications issued prior to notification of the Regional Plan-2021 (RP-2021) in 2005 (See Figure 2). The four constituent subregions of NCR are given below:
The Haryana subregion comprising eight districts—Faridabad, Gurgaon, Mewat, Rohtak, •Sonepat, Rewari, Jhajjhar and Panipat—that together constitute approximately 40 percent (13,413 sq. km) of the region;The Uttar Pradesh subregion comprising five districts—Meerut, Ghaziabad, Gautam Budha •Nagar, Bulandshahr and Baghpat—that together constitute approximately 32.30 percent (10,853 sq. km) of the region;The Rajasthan subregion comprising the Alwar district, constituting approximately 23.30 •percent (7,829 sq. km) of the region; and The NCT of Delhi, constituting approximately 4.40 percent (1,483 sq. km) of the region. •
After the notification of the RP-2021 for NCR in 2005, new districts have been added in NCR. These are discussed in subsequent paragraphs.
The functions of the NCRPB, as provided under Section 7 of the NCRPB Act, 1985, are reproduced below:
to prepare the regional plan and the functional plans; •to arrange for the preparation of subregional plans and project plans by each of the participating •states and the union territories; to coordinate the enforcement and implementation of the regional plan, functional •

138REGIONAL PLANNING FOR SUSTAINABLE LAND USE IN INDIA
Figure 2: NCR Constituent Areas
Source: Regional Plan-2021.
plans, subregional plans and project plans through the participating states and the union territories; to ensure proper and systematic programming by the participating states and the union •territories in regard to project formulation, determination of priorities in the NCR or subregions, and phasing of development of the NCR in accordance with stages indicated in the regional plan; andto arrange for, and oversee, the financing of selected development projects in the NCR, •through central and state-plan funds and other sources of revenue.
Section 10 of Chapter IV of the NCRPB Act, 1985 provides for the preparation of the “regional plan.” Section 15 of the Act gives directions regarding the review and how the revision is to be carried out. Section 15 (2) provides for the preparation of a fresh regional plan, as per the procedure laid down in Section 12.
Growth of Population in the NCR: The population of NCR was 460.69 lakhs in 2011. The subregions of NCT-Delhi, Haryana, Rajasthan and Uttar Pradesh accommodated 36.4 percent, 24.0 percent, eight percent and 31.6 percent of NCR’s population, respectively (See Table 4). The decadal (2001–11) growth rate of the NCR was 24.2 percent (See Table 5).

139PLANNING AND DEVELOPMENT OF THE NATIONAL CAPITAL REGION OF DELHI
Table 6 provides urban–rural components of population in the NCR. It reveals that during the last four decades, the urban share in NCR has registered a higher growth rate, with a continuous decline in the rural population. In 2011, the urbanisation level in NCR was 62.60 percent.
Regional Plan-2001 (RP-2001) for the NCR: As per the mandate, the NCR Planning Board prepared a regional plan for the perspective year 2001, which was approved by the Board in November 1988 and notified on 23 January 1989. It visualised the important goal of “a balanced and harmoniously developed region, leading to dispersal of economic activities and immigrants to Delhi, thereby leading to a manageable Delhi.” The plan proposed “a policy of strict control on [the] creation of
Table 4: Subregion-wise Growth/distribution of Population in the NCR
SubregionPopulation Share of Population (%)
1981 1991 2001 2011 1981 1991 2001 2011
NCT-Delhi 6,220,406 9,420,644 13,850,507 16,787,941 31.4 34.4 37.3 36.4
Haryana 4,938,541 6,643,604 8,687,050 11,031,515 24.8 24.3 23.4 24.0Rajasthan 1,755,575 2,296,580 2,992,592 3,674,179 8.8 8.4 8.1 8.0UP 6,968,646 9,001,704 11,570,117 14,575,668 35.0 32.9 31.2 31.6NCR 19,883,168 27,362,532 37,100,266 46,069,303 100.0 100.0 100.0 100.0
Source: Census of India, 1981–2011.
Table 5: Population Growth Rate in NCR (in percent)
Subregion 1981–91 1991–01 2001–11
NCT-Delhi 51.4 47.0 21.2
Haryana 34.5 30.8 27.0
Rajasthan 30.8 30.3 22.8
Uttar Pradesh 29.2 28.5 26.0
NCR 37.6 35.6 24.2
Source: Census of India, 1981–2011.
Table 6: Urban–Rural Components of Population in the NCR (1981–2011)
Urban–Rural Component/ Year
Population (in Million) Percent share (%)1981 1991 2001 2011 1981 1991 2001 2011
Total NCR 19.88 27.36 37.10 46.07 100.00 100.00 100.00 100.00
Urban NCR 9.12 13.74 20.92 28.84 45.87 50.23 56.39 62.60
Rural NCR 10.76 13.62 16.18 17.23 54.13 49.77 43.61 37.40
Source: Census of India, 1981–2011.

140REGIONAL PLANNING FOR SUSTAINABLE LAND USE IN INDIA
employment opportunities within the Union Territory of Delhi, moderate control in the Delhi Metropolitan Area and, encouragement with incentives, in the areas outside Delhi Metropolitan Area within the NCR.”
The RP-2001 for the NCR provided a unique model for sustainable urban development within a predominantly rural setting and sought to achieve its objectives through a policy framework for population re-distribution, settlement systems, regional land-use pattern, environmental factors, economic activities and infrastructural facilities.
Regional Plan-2021 for NCR: After RP-2001 for the NCR was reviewed in 1999, a new regional plan was prepared for the perspective year 2021, which was notified on 17 September 2005. The policies and proposals were prepared with the active participation of the senior officers from the participating states and concerned central ministries, members of the Planning Committee, and the members of the Board. The RP-2021 aims to promote spatially balanced development, accelerate the rate of economic growth in the NCR and provide for the development of the NCR. In short, “to promote growth and balanced development of the National Capital Region,” by:
Providing a suitable economic base for future growth by identifying and developing regional •settlements capable of absorbing the economic development impulse of NCT-Delhi Providing efficient and economic rail- and road-based transportation networks (including •mass-transport systems), integrated with land-use patterns, to support balanced regional development in such identified settlementsMinimising the adverse environmental impact that may occur in the process of development •of the NCR. Developing selected urban settlements with urban infrastructural facilities comparable with •that of NCT-Delhi, e.g. transport, power, communication, drinking water, sewerage and drainage. Providing a rational land-use pattern to protect and preserve good agricultural land and •utilise unproductive land for urban uses. Promoting sustainable development in the region to improve the quality of life.•Adopting innovative methods of resource mobilisation and improving the efficiency of •the existing ones, as well as incentivising and guiding private investment in the desired direction. The RP-2021 for NCR provides a model for sustainable development of urban and rural
settlements to improve the quality of life. It also delineates a rational regional land-use pattern to protect and preserve good agricultural land and environmentally sensitive areas, as well as utilise unproductive land for urban areas through interrelated policy framework regarding settlement systems, economic activities, transportation, telecommunication, regional land use, power, sewerage, drainage, water, social infrastructure, environment, disaster management, heritage, tourism etc. The salient features of the RP-2021 are given in Box 1. The thrust areas of the RP-2021 include:
Laying down land uses at the regional level in terms of a harmonious pattern emerging from •a careful examination of natural features, including susceptibility to natural disasters and socioeconomic activities;

141PLANNING AND DEVELOPMENT OF THE NATIONAL CAPITAL REGION OF DELHI
Proposing the development of metro and regional centres as powerful growth nodes to attract •major activities;Providing regional transport linkages and a mass-commuter system;•Constructing peripheral expressways and orbital rail corridors around Delhi;•Developing core urban infrastructure (transport, power, water supply, sewerage, drainage, •etc.) in NCR towns;Developing the region’s economy through Model Industrial Estates, Special Economic Zones, •etc., outside NCT-Delhi;Developing critical project plans, which are integral elements of the development vision.•
Most of the major policies of the RP-2021 are to be implemented through their elaboration in the subregional plans and/or district plans and/or master/development plans to be prepared by the constituent states of the NCR. The sectoral projects are to be implemented by the constituent state governments or their departments/agencies/local bodies, as phased out in the RP-2021. The total fund requirement for the sectoral development projected in the RP-2021 is 372,342 crores (at 2001 prices). This does not include the cost of three dams proposed to be constructed in the upper reaches of the Himalayas and regional drainage system. It also does not include the cost of land development, which is self-sustaining.
Box 1: Salient Features of the RP-2021 for the NCR
Promotion of an economic base in the identified major settlements to absorb the economic •development impulse of Delhi, an efficient transport network, the development of physical infrastructure, rational land-use pattern, improved environment and quality of lifeHighway corridor zone, proposed with a minimum width of 500 m, on either side of ROW •of National HighwaysHi-tech industries to be encouraged in Delhi•Wholesale markets in Delhi to meet local needs only•New office spaces to be avoided in new community/district/subcity centres•Industrial Estates/Special Economic Zones to be developed outside Delhi, in the NCR•Uniform taxation in the NCR to encourage the free flow of goods and economic •developmentBetter-integrated connectivity and accessibility in the region through the development of •Peripheral Expressways and Regional Rapid Transit SystemUnrestricted movement of buses, taxis and autorickshaws in the NCR•Rail link between Rewari–Bhiwadi and Rohtak–Hansi proposed•Focused policies proposed to fill the demand–supply gap in the power sector•Non-conventional energy resources to be promoted•Integrated regional water-supply scheme to be prepared after creating the blueprint for •water resources in the regionAt least two to five percent groundwater rechargeable area identified in the plan to be •protectedRecycling and reusing of wastewater for non-drinking purposes to be promoted•
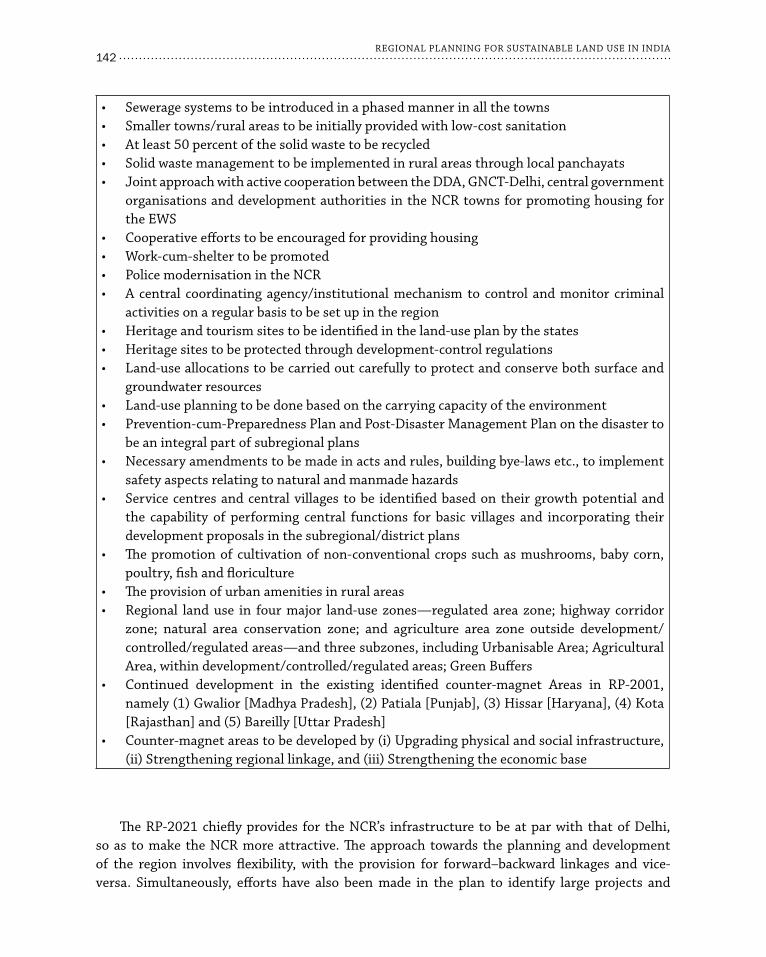
142REGIONAL PLANNING FOR SUSTAINABLE LAND USE IN INDIA
Sewerage systems to be introduced in a phased manner in all the towns•Smaller towns/rural areas to be initially provided with low-cost sanitation•At least 50 percent of the solid waste to be recycled•Solid waste management to be implemented in rural areas through local panchayats•Joint approach with active cooperation between the DDA, GNCT-Delhi, central government •organisations and development authorities in the NCR towns for promoting housing for the EWSCooperative efforts to be encouraged for providing housing•Work-cum-shelter to be promoted•Police modernisation in the NCR•A central coordinating agency/institutional mechanism to control and monitor criminal •activities on a regular basis to be set up in the regionHeritage and tourism sites to be identified in the land-use plan by the states•Heritage sites to be protected through development-control regulations•Land-use allocations to be carried out carefully to protect and conserve both surface and •groundwater resourcesLand-use planning to be done based on the carrying capacity of the environment•Prevention-cum-Preparedness Plan and Post-Disaster Management Plan on the disaster to •be an integral part of subregional plansNecessary amendments to be made in acts and rules, building bye-laws etc., to implement •safety aspects relating to natural and manmade hazardsService centres and central villages to be identified based on their growth potential and •the capability of performing central functions for basic villages and incorporating their development proposals in the subregional/district plansThe promotion of cultivation of non-conventional crops such as mushrooms, baby corn, •poultry, fish and floricultureThe provision of urban amenities in rural areas•Regional land use in four major land-use zones—regulated area zone; highway corridor •zone; natural area conservation zone; and agriculture area zone outside development/controlled/regulated areas—and three subzones, including Urbanisable Area; Agricultural Area, within development/controlled/regulated areas; Green BuffersContinued development in the existing identified counter-magnet Areas in RP-2001, •namely (1) Gwalior [Madhya Pradesh], (2) Patiala [Punjab], (3) Hissar [Haryana], (4) Kota [Rajasthan] and (5) Bareilly [Uttar Pradesh]Counter-magnet areas to be developed by (i) Upgrading physical and social infrastructure, •(ii) Strengthening regional linkage, and (iii) Strengthening the economic base
The RP-2021 chiefly provides for the NCR’s infrastructure to be at par with that of Delhi, so as to make the NCR more attractive. The approach towards the planning and development of the region involves flexibility, with the provision for forward–backward linkages and vice-versa. Simultaneously, efforts have also been made in the plan to identify large projects and

143PLANNING AND DEVELOPMENT OF THE NATIONAL CAPITAL REGION OF DELHI
their funding pattern. Additionally, detailed elaborations have been made on the phasing of the implementation of major and important policies for various aspects/sectors, dovetailing them with the five-year national plans. Attempts have also been made to identify the agencies)/organisations/departments responsible for implementing these policies at the centre and state levels. Some of the other new features/policies of the RP-2021 are given in Box 2.
Box 2: New Features/Policies in the RP-2021 for the NCR
Creating a New Policy Zone/highway corridor zone for planned development along the •identified highway corridorsImproving the hierarchy of settlement pattern by formulating a six-tier system for balanced •development and identifying metro and regional centresCreating a strategy for settlement system in the NCR by identifying new townships as •nodes along the key transport corridors, proposed expressways, orbital rail corridors and other suitable locations on virgin landGiving due recognition to the SEZ and their development through FDI•Setting up of integrated freight complexes at the intersection of important network •corridors to enable the dispersal of wholesale distributive trades to the NCR townsAppreciating and understanding the importance of the informal sector•Creating an affordable and robust mass-commuter system•Improving linkages and connectivity, both at inter- and intra-level, through surface, rail •and air modeCreating the Unified Metropolitan Transport Authority for the NCR•Creating public transport systems in towns with populations of more than five lakhs•Second-level islanding for the NCR in the Islanding Scheme for regular availability of power •and load managementPromoting non-conventional energy resources to meet the power demand•Creating a blueprint for water resources in NCR•Earmarking at least two to five percent areas under water bodies (natural as well as •manmade) in the distribution of land usesConserving and protecting groundwater recharging areas•Creating a dual line distribution system: one for drinking water and the other for non-•drinking water/recycled and treated wastewater to reuse the treated wastewater.Adopting a decentralised solid waste management plan, aiming for zero wastage and 100 •percent recycling of waste, and incorporating innovative technologies for waste disposalAdopting an integrated regional drainage plan at the regional level and drainage master •plans at the district levelAdopting an integrated water resource management approach for the region, for optimum •water-resources utilisation and demand management, including the demand for irrigation, drinking water and industryPromoting modern technologies for irrigation•Recognising slum and encroachment as urban growth and development problems and •addressing the matter through affordable housing

144REGIONAL PLANNING FOR SUSTAINABLE LAND USE IN INDIA
‘Holding areas’ for temporary settlement of migratory influx for a specified period of time, •enabling them to economically and physically integrate with the formally developed areasAdopting a joint-venture approach amongst the development bodies to provide housing •for allEnsuring that norms and standards for social infrastructure have uniformity and balanced •availability of facilitiesSetting up central coordinating agency/institutional mechanisms, with similar police/•administrative systems (including uniform laws wherever required), to control and monitor criminal activities in the regionProtecting natural and manmade heritage in the region•Recognising tourism as a source of employment•Creating tourism circuits covering tourism, leisure, cultural and heritage sites•Analysing land suitability for land-use allocations to protect environmentally sensitive •areasAdding a chapter on disaster management (for the first time)•Incorporating district plans in subregional plans for parallel development in rural and •urban areas of the NCRPreparing rural development programmes to restrict migration from the villages to the •neighbouring towns and industrial areas as much as possibleProviding urban amenities/facilities in rural areas, such as housing, better sanitation, water •supply, communication system and social infrastructure, to improve the quality of life in rural areasReviewing the counter-magnet area policy•Adding new land-use zones, namely, highway corridor zones and natural area conservation •zonesSetting up a regional development authority for regulation and monitoring of planning and •development at subregional levels
Results of Implementation of the Regional Plan
Planning and development of the NCR is a long-drawn process. Considering the vast geographical area and meagre resources available, the implementation of the plan has yielded several positive results, due to the contributions and efforts of the NCR Planning Board, with its regular interventions as well as the efforts made by its constituent states and participating central ministries. The achievements, while small in absolute terms, contribute to the overall development of the region. Some of the major achievements are listed below:
The population growth rate of Delhi decreased from 51.45 percent (1981–91) to 47.02 percent •(1991–2001) for the first time since Independence. It further came down to 21.2 percent during 2001–11 (See Figure 3).

145PLANNING AND DEVELOPMENT OF THE NATIONAL CAPITAL REGION OF DELHI
The growth of population in Delhi declined from 44.3 lakh during 1991–2001 to 29.37 lakh during 2001–11 (See Table 7).
Delhi has witnessed a high rate of in-migration, though there has been a decline in the percentage share of net migrants in the decadal growth of population in NCT-Delhi, from 44.19 percent in 1971–81 to 39.82 percent in 1991–2001 (See Table 7). Census data on migration for 2001–11 is still awaited.
The decadal growth of population in Delhi was 21.54 lakhs during 1971–81, 32 lakhs during 1981–91, 44.30 lakhs during 1991–2001 and 29.4 lakhs during 2001–11 (See Table 7). Of this increase of 44.30 lakh in the population of Delhi during 1991–2001, 22.22 lakh was due to in-
Figure 3: decadal Growth Rates in the NCR
Source: Census of India, 1971–2011.
Table 7: Population Growth and Migration to the NCTd
Year 1981 1991 2001 2011Population (lakhs) 62.20 94.20 138.50 167.87Decadal Growth Rate (%) 53.00 51.45 47.03 21.20Increase in Population (lakhs) 21.54 32.00 44.30 29.37Component of Migrants (lakhs) a) In-migrants 12.30 15.87 22.22* N.A.b) Out-migrants 2.78 2.82 4.58 N.A.c) Net-migrants 9.52 13.05 17.64 –d) Percentage share of net-migrants 44.19 40.78 39.82 –
Source: Census of India.Note: *includes migrants from outside India.

146REGIONAL PLANNING FOR SUSTAINABLE LAND USE IN INDIA
migrants, whereas the total increase of population during 2001–11 was 29.37 lakhs. Out-migrants also increased from 2.78 lakhs during 1971–81 to 4.58 lakhs in during 1991–2001. Net migrants to Delhi were 17.62 lakh during 1991–2001, and this component was about 40 percent of the total increase in population. Migration data for 2001–11 is still awaited from the Census of India. However, development trends on the ground are encouraging.
While the urban population of other subregions in the NCR accounts only for the population within the municipal boundaries of respective towns, the urban population has also grown in the development areas of development authorities such as Gurugram, Faridabad and Ghaziabad. These areas form the part of rural areas outside municipal limits. Figure 3 shows the decline in the urban population growth rate in other subregions of the NCR during 2001–11.
Further examination of the migration data under “reasons of migration” indicates that about •31 percent migrated to Delhi for employment during 1981–91 and about 37.6 percent during 1991–2001. Another reason for a large component of migrants was “family movement to Delhi.” It was 41.45 percent during 1981–91 and 36.80 percent during 1991–2001. The third most-significant reason for migration, in both the decades, was marriage (See Table 8).
To provide employment in the NCR outside Delhi, several industrial estates/infrastructure have been developed by the NCR-participating states to create more jobs outside Delhi. Some of the industrial estates are located in Manesar, Gurgaon, Sonepat, Panipat, Bawal, Bhiwadi, Shahjahanpur, Neemrana, Behror, NOIDA and Greater Noida.
The NCR-participating states developed several residential sectors in their respective subregions, to meet the growing housing demand. An analysis to assess the demand–supply
2 “Data Highlights: Migration Tables (D1, D2 and D3),” Census of India, 2001; NCR Planning Board Act, 1985; Regional Plan, 2001 and 2021; Census of India 1971, 1981, 1991, 2001 and 2011; The Constitution Seventy-fourth Amendment Act, 1992 on Municipalities; Rajeev Malhotra, “Initiatives for Affordable Housing in National Capital Region,” Shelter (ISSN 2347–4912), April 2016.
Table 8: Migrants classified by Reasons for Migration
Reasons % Migrants
1981–91 1991–2001
Employment 31.29 37.6
Business 4.07 0.5
Education 2.28 2.7
Family moved 41.45 36.8
Marriage 15.62 13.8
Natural calamities 0.13 –
Others 5.16 6.3
Moved after birth – 2.4
Source: Census of India, 2001.2

147PLANNING AND DEVELOPMENT OF THE NATIONAL CAPITAL REGION OF DELHI
gap in housing for the NCR was carried out in the paper “Initiatives for Affordable Housing in National Capital Region” published in Shelter, April 2016, issue by HUDCO and based on Census data. The analysis showed that there are about 8.73 million households in the NCR, while the number of Census houses is 12.40 million. This indicates that the quantum of Census houses is more than the households (ratio, 1:1.42), but in reality, only 8.52 million (i.e. 68.8 percent) houses are primarily used for residential purpose. Out of the total Census houses, 89.5 percent were occupied and the remaining 10.5 percent were vacant (See Table 9).
Improvement in basic urban infrastructure, such as drinking-water supply, sewerage and •sewage treatment and power supply is contributing to the growth of the NCR outside Delhi. The NCRPB financed 299 projects—estimated cost of about INR 29,000 crores—to improve the infrastructure in the region (See Table 10).
Under Section 8 (e) of the NCRPB Act, 1985, the Board can select and approve comprehensive projects, call for priority development and provide such assistance for the implementation of those projects. The sectors covered are:
Water Supply, Sewerage and STP, SWM and Drainage•Transport Sector: Roads, ROBs, Flyovers, Metro Rail, etc.•Social Infrastructure: Education and Health Sectors•Power Sector: Generation, Transmission and Distribution•Land Development: Residential, Industrial and Institutional•
The NCRPB providesd loan assistance of up to 75 percent of the project cost for a tenor of 10 years, with two years of moratorium. The present interest rate varies between seven percent and 8.5 percent per annum, with a rebate of 0.25 percent on regular repayments. It also provides grants up to 15 percent of the sanctioned project cost for water-supply and sanitation projects on completion, subject to the fulfilment of the terms and conditions laid down by the NCRPB. See Table 10 for the status of the projects financed until December 2018.
NCR-participating states prepared master/development plans for 47 towns/cities, for the •planned development of the region. Master/development plans for many other towns/cities are at different stages of preparation.
Table 9: Subregion-wise Number of Census Houses and their Occupancy
Subregion No. of Census Houses Vacant Census Houses and %
Occupied Census Houses and %
NCT-Delhi 4,605,555 (100%) 512,691 (11.1%) 4,092,864 (88.9%)
Haryana 3,077,746 (100%) 320,333 (10.4%) 2,757,413 (89.6%)
Rajasthan 995,261 (100%) 84,473 (8.5%) 910,788 (91.5%)
UP 3,701,439 (100%) 380,509 (10.3%) 3,320,930 (89.7%)
NCR 12,380,001 (100%) 1,298,006 (10.5%) 11,081,995 (89.5%)
Source: Census of India, 2011 and author’s analysis.

148REGIONAL PLANNING FOR SUSTAINABLE LAND USE IN INDIA
The NCRPB has carried out several studies to look at the current status of various infrastructures •available in the region and policy measures required to further enhance these during the implementation of a regional plan. The studies carried out include “Economic Profile of NCR,” “Micro and Household Enterprises in NCR,” “Health Infrastructure in NCR,” “Integrated Water Resource Management in NCR,” and “Integrated Transport Plan for NCR.” Functional plans for transport, groundwater recharge, economic development and drainage in •the NCR were prepared to guide the states. The “Functional Plan on Transport” helped identify some of the major transport projects, which were implemented/are being implemented by the concerned agencies/departments. It also helped identify bottlenecks in the transport network and suggested measures for improvement.One of the projects identified is the “Regional Rapid Transport System” (RRTS) for which the •company “NCR Transport Corporation” (NCRTC) was incorporated on 21 August 2013 for designing, developing, implementing, financing, operating and maintaining the RRTS in the NCR. The NCRTC started its operations in 2015–16. Draft DPRs of the three RRTS corridors [Delhi–Ghaziabad–Meerut (90 km), Delhi–Sonepat–Panipat (110 km) and Delhi–Gurugram–Rewari–Alwar (180 km)] were prepared by NCRPB, and DPRs have now been finalised by the NCRTC for implementation. Work on the Delhi–Meerut corridor is ongoing.
The RP-2021 and the Functional Plan for Transport for NCR-2032 proposed several projects related to the road network, for upgradation as well as the construction of several expressways within the region. Some road projects that had been implemented and commissioned by the concerned agencies are:a) Upgradation of the national highways (NH) converging at Delhi (NH1, NH2, NH8, NH10,
NH24 and NH58) by NHAIb) Widening and improvement of road networks in NCR-SH, MDRs and ODRs by the NCR-
participating statesc) Eastern Peripheral Expressway (eastern part of the Peripheral Expressway around Delhi),
constructed and commissioned by the NHAI d) Western Peripheral Expressway (western part of the Peripheral Expressway around Delhi,
popularly known as the KMP Expressway), constructed and commissioned by the Government of Haryana
e) Delhi–Meerut Expressway, partly constructed and commissioned by the NHAI and remaining work is in progress
Table 10: Achievements, Project Financing by the NCRPB (in INR Crores)
Project Status No. of Projects Estimated Cost Loan Sanctioned Loan Released
Ongoing 49 12,378 6,196 2,391
Completed 250 16,909 7,324 6,481
Total 299 29,287 13,520 8,872
Source: NCRPB Website (Up to December 2018).

149PLANNING AND DEVELOPMENT OF THE NATIONAL CAPITAL REGION OF DELHI
The Metro rail has been extended to Central NCR (CNCR) towns, viz. Noida, Gurgaon, •Ghaziabad, Faridabad and Bahadurgarh. The Rapid Metro is operational in Gurgaon. Extension of the Metro from Noida to Greater Noida is in progress.The NCRPB facilitated the signing of the Reciprocal Common Transport Agreement (RCTA) •for “Contract Carriage” by participating states of the NCR in October 2008, which was notified on 14 October 2008 by all the states. The RCTA for “Stage Carriage” was signed later in 2009–10. This facilitated seamless travel in the NCR. Under this, about 12,000 NCR Taxis, 10,000 autorickshaws and 7,500 buses are operational. The Contract Carriage Agreement was recently renewed.
Issues and Challenges
The planning and implementation of the Regional Plan has faced several challenges, despite the many successes of its policies and proposals.
Multistate Region: The NCR is a multistate region. It is one of the largest interstate rural–urban region, not only in the country but also in the world. The complexity in the dynamism of the region is exacerbated by its vast size and its spread over four states. The NCRPB is an interstate statutory body, established under the NCRPB Act, 1985.
The participating states implement the RP based on their own priorities, despite the NCRPB being chaired by the Union Minister for Urban Development with chief ministers of the participating states, in addition to other members.
Integration of the District Plans with the RP (74th Amendment): The RP for the NCR is required to be implemented by the participating states/Delhi UT, while schemes falling under the central sector are to be implemented by the concerned central ministries. The review of the RP 2001 carried out in the year 1999 for the existing planning and implementation arrangements showed varied patterns in the constituent states of the NCR. None of the existing arrangement was found to be fully compatible to fulfill the needs of taking up the balanced and integrated development of the concerned subregions at the field level, which could encompass both the rural and urban areas.
The provisions made in the 74th Constitutional Amendment provides for an appropriate mechanism, wherein the District Planning Committee will consolidate the plans prepared by the panchayats and the municipalities in the district to prepare a Draft Development Plan for the entire district. Similarly, the Metropolitan Planning Committee will prepare a Draft Development Plan for the metropolitan area as a whole. The provision to prepare the Plans for the district/metropolitan areas is under the overall framework and programmes of the RP, and the proposals in these district/metropolitan area plans should be in accordance with the policies and proposals of the RP. Thus, the preparation of the development plan/metropolitan development plan, its integration with the district plans, and the integration of all such district plans in each subregion of the NCR will help finalise a subregional plan for the relevant participating state. Therefore, a subregional plan will be the mosaic of all the district plans, which in turn are mosaic of the master/development plans of the urban areas (city/metropolitan area) and the rural area development plans. This will ultimately help in the integrated development of the entire subregion of each

150REGIONAL PLANNING FOR SUSTAINABLE LAND USE IN INDIA
participating state, including the rural areas, and will honour the provision of the Constitution in this regard.
In this context, it is also important to set up a suitable organisation at the subregional level, such as a “subregional area development authority” or any other suitable agency, to oversee and coordinate the implementation of the policies and proposals of the subregional plan as well as district plans, as per the objectives of the RP, and which will have jurisdiction in the entire subregion. This agency can undertake all the development work in the subregion and can also help bring uniformity in the development. However, this must be agreed upon by the constituent states.
Rural Development: It is crucial to develop rural areas and create more jobs within the region. There is a need to prepare rural development plans/programmes and to incorporate them in respective district plans, for the preparation of integrated district development plans. Agro-based industries must be promoted in rural areas to facilitate employment generation. This will help in arresting migration from these areas. Settlement hierarchy for rural areas must also be recognised. It is imperative to prioritise the physical and social infrastructure development in the NCR villages under various programmes of Rural Development Ministry. Providing all kind of urban infrastructures in rural areas will improve the quality of life in the villages. Existing developmental/job creation policies/schemes of the central government and state governments must be dovetailed with the RP policies and implemented expeditiously in the NCR.
To manage the unauthorised conversion of rural land use to other uses and to control the large-scale urban-based activities in rural areas, it is essential to notify the entire rural area in the NCR as one unified planning area under a common legislation. The existing town planning acts of the constituent states are not comprehensive enough to enable effective land-use control in the rural areas. Vast parts of the NCR territory are outside the designated “controlled areas,” and it is essential to bring them under control through appropriate modifications in the existing acts and enabling laws. Statutory provisions in the town planning acts and the NCRPB Act will help designate the entire subregion as “controlled area” in each constituent state and set up appropriate subregional level planning and development mechanisms to exercise land use and development control.
The Planning of Delhi as an Integral part of the CNCR: Delhi is expected to be urbanised by 2021, and the problem it faces is to accommodate and manage the anticipated future growth of population. The city can either use the remaining land area or create more housing through redevelopment. The limited land area primarily arises from the restrictions imposed by the political/geographical boundaries of the NCT, whereas the CNCR—although an integral part, both physically and functionally, of Delhi’s urban agglomeration—straddles the adjacent states with their own respective government’s perceptions and priorities, which may not necessarily be in consonance with Delhi’s development policies and strategies.
Eco-sensitive Planning: The development of the towns in the region receives induced development of industries and urban estates, resulting in environmental degradation. In the process, ecologically fragile areas such as rivers, lakes, village ponds, wetlands, forest covers/green areas and the rich

151PLANNING AND DEVELOPMENT OF THE NATIONAL CAPITAL REGION OF DELHI
biodiversity become soft targets. To protect the environment, all the policies in the perspective plans must address ‘sustainable development’ based on natural-resource management. Is an “environmental management plan” for the region required or should all the major urban development projects be subjected to Environment Impact Assessment (EIA)? In both cases, the participating states feel that the policies of the RP hamper the development of their respective states. However, to protect the environment and the sustainable development of the region, the Environment (Protection) Act, 1986 and RP must be honoured.
Harmonious Development and the Control of Land Use: As per the provisions of the NCRPB Act, 1985, the directive is to prepare the Plan for the development of the NCR and for creating harmonised policies for the control of land use and the development of infrastructure. The Act provides for preparation of subregional plans, functional plans and project plans within the policy framework of the RP. However, it does not touch upon the preparation of master/development plans, which are the actual instruments on the ground for the control of land use. The constituent states must ensure the incorporation of the RP policies and proposals in the master/development plans. Section 29 provides that in case of the violation of the RP, financial assistance to the concerned state government or UT can be withheld. As the NCRPB provides financial assistance in the form of interest-bearing loan, this provision fails to have the necessary impact.
Integrated Water Management: Water is an essential component in every aspect of life and must be valued and safeguarded. The NCR is a water-scarce region but can have sufficient water if its water resources are conserved and managed properly. This is essential for the sustainable development of the region.
The NCR is endowed with four perennial rivers, namely, the Yamuna, the Hindon and the Kali passing through it, and the Ganga skirting its eastern boundary. The main sources of water supply in the region are surface and groundwater (e.g. rivers, canals, tubewells, hand pumps and open wells). While the UP subregion has abundant groundwater, the area west of the Yamuna—comprising the districts of Gurgaon, Rohtak, Sonepat, Jhajjar and most part of Faridabad district in Haryana, Alwar in Rajasthan and large part of NCT-Delhi—has insufficient groundwater, which is often brackish in quality, rendering it unpalatable for consumption. Delhi gets its water mostly from the Yamuna and Western Yamuna canal and partly from the Ranney wells and tubewells in the Yamuna belt and the Upper Ganga canal system. There is a wide demand–supply gap of water in the NCR and the problem becomes acute in dry summer months.
An analysis carried out for Delhi in the “RP-2021” for drinking water, with regard to the availability of water from all known sources, indicates that total available potable water is 3,800 MLD, and it will only be able to sustain a population of 180 lakh people. To meet the demand for more population, at least 50 percent of the water supplied must be recycled. This projection is based on the 225 LPCD rate of water supply and the 15 percent of unaccounted for water (losses). Other towns in the NCR will also move in the same direction, unless some concrete measures are taken by adopting the policies laid down in the RP.
Subsequent to the preparation of the RP-2021, a detailed study on “Integrated Water Resources Management in NCR” was carried out, which made several recommendations with regard to water uses in the region. However, it is a big challenge to manage water resources, as

152REGIONAL PLANNING FOR SUSTAINABLE LAND USE IN INDIA
river water is shared amongst all the riparian states, based on an MoU signed by them in 1996.
Aspirations of the NCR-Participating States to Add More Districts in the NCR: The NCRPB has been receiving requests from the states to add their additional districts in the NCR, citing various reasons. As per the provisions of Section 2 (f) of NCRPB Act, 1985, the central government, with the consent of governments of the concerned NCR-participating states and in consultation with the NCRPB, may, through notification in the official Gazette, add or exclude any area from the schedule of the NCR.
In light of the above provisions of the Act, GoI vide notification dated 24 November 2015 included Bhiwani, Mahendragarh, Jind and Karnal districts of Haryana in the Haryana subregion, Bharatpur district of Rajasthan in the Rajasthan subregion, and Muzzaffarnagar district of UP in the UP subregion of the NCR. Vide notification dated 16 April 2018 included Shamli district of UP in the UP subregion of the NCR.
The total area of the NCR is 55,084 sq. km, with a population of 58.18 million after the notification dated 16 April 2018. It includes 23 districts from three NCR-participating states and the entire NCT-Delhi (See Table 11). Figure 4 shows the extent of the NCR constituent area as per the RP-2021 and the area after all the notifications until 16 April 2018.
Figure 4: Constituent Area of NCR RP-2021 v/s 16 April 2018 Notification
As per the RP-2021 As per All Notificatons upto 16 April 2018
Source: www.ncrpb.nic.in. as on 10 November 2018.
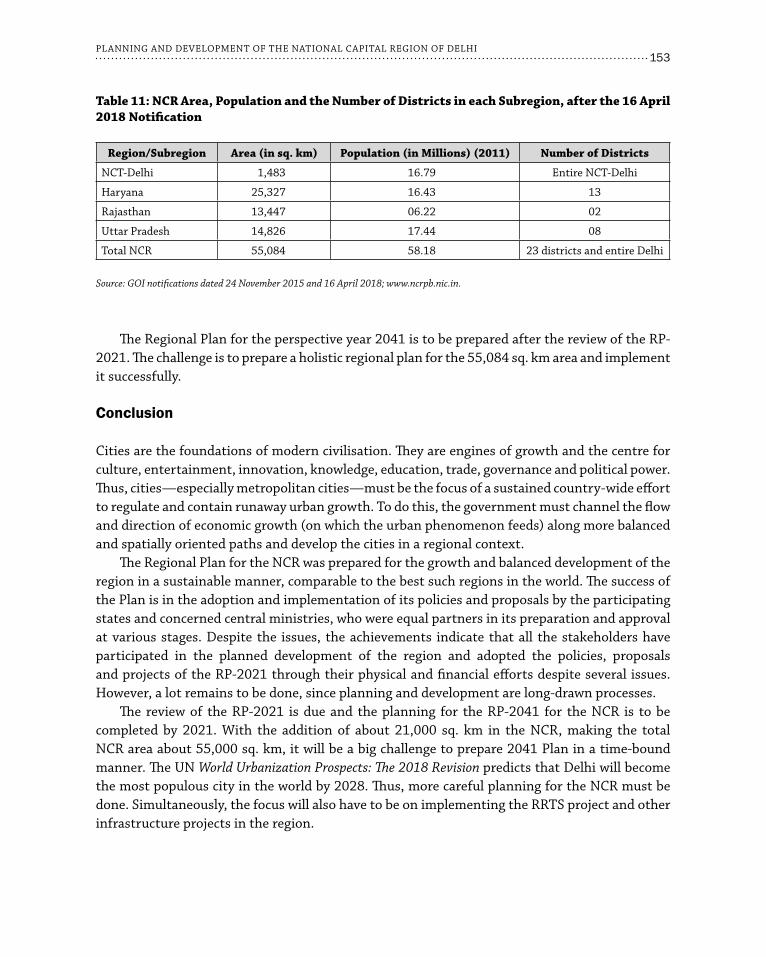
153PLANNING AND DEVELOPMENT OF THE NATIONAL CAPITAL REGION OF DELHI
The Regional Plan for the perspective year 2041 is to be prepared after the review of the RP-2021. The challenge is to prepare a holistic regional plan for the 55,084 sq. km area and implement it successfully.
Conclusion
Cities are the foundations of modern civilisation. They are engines of growth and the centre for culture, entertainment, innovation, knowledge, education, trade, governance and political power. Thus, cities—especially metropolitan cities—must be the focus of a sustained country-wide effort to regulate and contain runaway urban growth. To do this, the government must channel the flow and direction of economic growth (on which the urban phenomenon feeds) along more balanced and spatially oriented paths and develop the cities in a regional context.
The Regional Plan for the NCR was prepared for the growth and balanced development of the region in a sustainable manner, comparable to the best such regions in the world. The success of the Plan is in the adoption and implementation of its policies and proposals by the participating states and concerned central ministries, who were equal partners in its preparation and approval at various stages. Despite the issues, the achievements indicate that all the stakeholders have participated in the planned development of the region and adopted the policies, proposals and projects of the RP-2021 through their physical and financial efforts despite several issues. However, a lot remains to be done, since planning and development are long-drawn processes.
The review of the RP-2021 is due and the planning for the RP-2041 for the NCR is to be completed by 2021. With the addition of about 21,000 sq. km in the NCR, making the total NCR area about 55,000 sq. km, it will be a big challenge to prepare 2041 Plan in a time-bound manner. The UN World Urbanization Prospects: The 2018 Revision predicts that Delhi will become the most populous city in the world by 2028. Thus, more careful planning for the NCR must be done. Simultaneously, the focus will also have to be on implementing the RRTS project and other infrastructure projects in the region.
Table 11: NCR Area, Population and the Number of districts in each Subregion, after the 16 April 2018 Notification
Region/Subregion Area (in sq. km) Population (in Millions) (2011) Number of districts
NCT-Delhi 1,483 16.79 Entire NCT-Delhi
Haryana 25,327 16.43 13
Rajasthan 13,447 06.22 02
Uttar Pradesh 14,826 17.44 08
Total NCR 55,084 58.18 23 districts and entire Delhi
Source: GOI notifications dated 24 November 2015 and 16 April 2018; www.ncrpb.nic.in.
Abstract
Regional planning in Goa was initiated in the early 1980s under the statutory provisions of the Town and Country Planning Act. The plan was translated into subregional level land-use maps at 1:25000 scale, which has been used as an instrument for land use control. The 1992 Constitutional amendment that empowered local bodies with planning functions changed the dimensions of urban and regional planning. Goa has succeeded in introducing a multi-level stakeholder consultative process and a green approach in planning. This chapter examines the Regional Plan for Goa-2021 as a result of a comprehensive and participatory approach in regional planning.
Introduction
Goa was one of the first states in India to have a regional plan coupled with a land use plan for 2001 that covered the whole state. The plan was prepared under the Goa Town and Country Planning Act (GTCPA), 1974 and was in force until 2010. The regional plans are prepared under a statutory provision of the Town and Country Planning Act, 1974. The Regional Plan for Goa 2001 is unique as it included a land use/surface utilisation map for the state. The plan was further segregated to taluka-level plans of 1:25,000 scale. These plans have worked to manage land use in Goa in the last 25 years.
The introduction of the 73rd and 74th Constitutional Amendments have brought a new dimension to the planning scenario in the country. The amendments gave more powers to the local government bodies, including aspects of planning; this made the process more important at the grassroots. In preparing the Regional Plan for Goa - 2021 (RPG-21),1 greater public participation was solicited in resource mapping as well as in detailed planning at the grassroots. RPG-21 has also tried to map all the conservable land resources and creating a category of eco-sensitive zones in the regional plan which is treated as conservable land masses.
12Environmentally Sustainable and Participatory
Regional Planning in India: The Goa Modeli
S. T. Puttaraju and Deepika Chauhan
i This chapter has been reproduced in part from the Regional Plan for Goa - 2021.1 Regional Plan of Goa 2021, Notified in the year 2010–11.

155ENVIRONMENTALLY SUSTAINABLE AND PARTICIPATORY REGIONAL PLANNING IN INDIA
A regional plan is required to guide the appropriate use of land as accessed by people on a continuing basis, but on the principle of “opportunities within identified beneficial constraints”. As the economic benefits to stakeholders is a major concern of any planning, the plans shall have flexibility to accommodate the fast growing and changing economic scenario in the region. More importantly, a regional plan shall ensure all the constituent urban and rural settlements and other critical sectors that are truly integrated and fleshed out and projected through a series of related implementable plans, through a participatory process. This not only critically accepts government-approved sectoral programmes and plans but also the down-top settlement-level livelihood programmes and plans.
The Regional Plan for Goa -2021 laid down the following objectives:To make Goa more vibrant and prosperous.•To create a Goa that has greater economic prosperity.•To protect Goa’s endangered and fragile ecosystems.•To encourage greater public participation in the planning process.•
To achieve these objectives, inputs were obtained from the general public as well as government agencies, corporations, various citizen groups and research organisations. This allowed for the identification of the most crucial issues that confront the planners, in general, and the public of Goa in particular who have much at stake in the plans.
Current Issues in Goa
1. Goa’s limited land resources are experiencing enormous pressures, not only as a result of the natural growth of its population but also because of speculation. These pressures are causing changes in the character of Goa’s settlements, especially its villages. There is a growing incidence of farmers converting their land for urban real estate purposes. To arrest this alarming pattern, there is an imperative to review the agriculture sector and make it more viable.
2. Two of Goa’s major economic activities—mining and tourism—need to be reviewed by the government. The increase in mining activities over the decade 2001-2011 intensified the socio-environmental problems such as environmental degradation, loss of agriculture lands, and air and water pollution. Most of the mining activities are located in the fragile western ghats region which is rich in flora and fauna. Tourism, meanwhile, is leading to other environmental problems which the coastal belt is unable to cope with. The tourism activities are mostly concentrated in four coastal talukas. They have put enormous pressure on infrastructure such as roads, water and sanitation.
3. There is a need for affordable housing. As prices of houses rise (seemingly due to the insatiable demand for ‘second homes’ coming from the urban affluent from the rest of India), even modest accommodation is fast going out of reach for the average Goan. This is deeply resented – particularly since most of these second homes remain unoccupied for most of the year.
4. Basic services (public transport, sanitation, health, and education) need to be upgraded. The state receives tourists nearly four or five times the population of the state—and this influx has various negative socio-economic impacts on the local population.
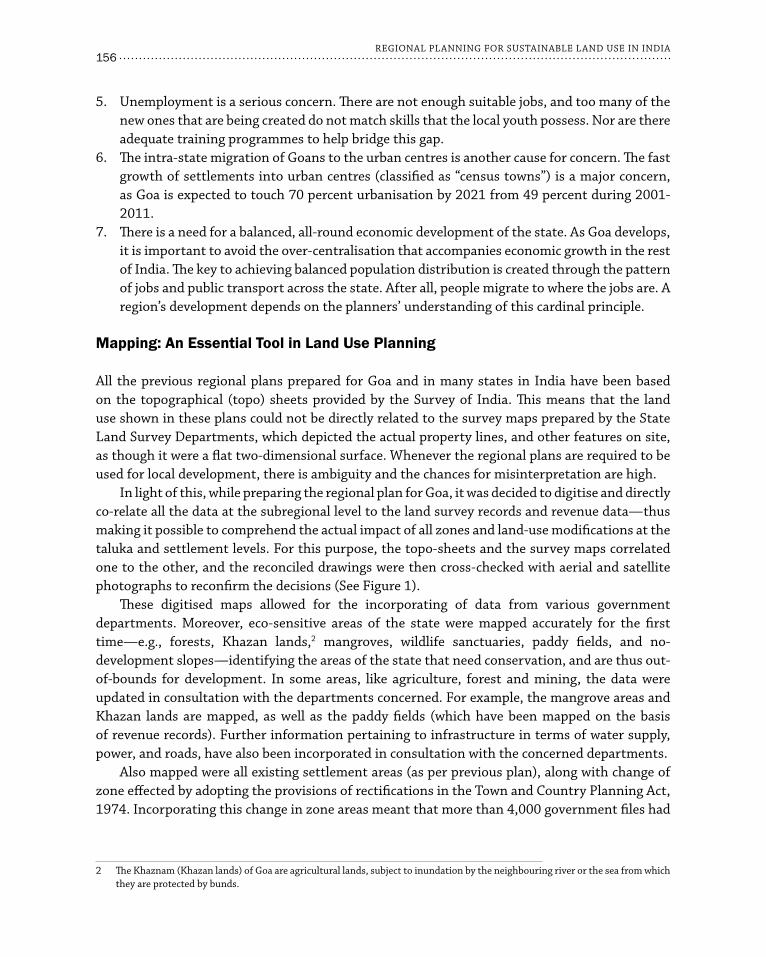
156REGIONAL PLANNING FOR SUSTAINABLE LAND USE IN INDIA
5. Unemployment is a serious concern. There are not enough suitable jobs, and too many of the new ones that are being created do not match skills that the local youth possess. Nor are there adequate training programmes to help bridge this gap.
6. The intra-state migration of Goans to the urban centres is another cause for concern. The fast growth of settlements into urban centres (classified as “census towns”) is a major concern, as Goa is expected to touch 70 percent urbanisation by 2021 from 49 percent during 2001-2011.
7. There is a need for a balanced, all-round economic development of the state. As Goa develops, it is important to avoid the over-centralisation that accompanies economic growth in the rest of India. The key to achieving balanced population distribution is created through the pattern of jobs and public transport across the state. After all, people migrate to where the jobs are. A region’s development depends on the planners’ understanding of this cardinal principle.
Mapping: An Essential Tool in Land Use Planning
All the previous regional plans prepared for Goa and in many states in India have been based on the topographical (topo) sheets provided by the Survey of India. This means that the land use shown in these plans could not be directly related to the survey maps prepared by the State Land Survey Departments, which depicted the actual property lines, and other features on site, as though it were a flat two-dimensional surface. Whenever the regional plans are required to be used for local development, there is ambiguity and the chances for misinterpretation are high.
In light of this, while preparing the regional plan for Goa, it was decided to digitise and directly co-relate all the data at the subregional level to the land survey records and revenue data—thus making it possible to comprehend the actual impact of all zones and land-use modifications at the taluka and settlement levels. For this purpose, the topo-sheets and the survey maps correlated one to the other, and the reconciled drawings were then cross-checked with aerial and satellite photographs to reconfirm the decisions (See Figure 1).
These digitised maps allowed for the incorporating of data from various government departments. Moreover, eco-sensitive areas of the state were mapped accurately for the first time—e.g., forests, Khazan lands,2 mangroves, wildlife sanctuaries, paddy fields, and no-development slopes—identifying the areas of the state that need conservation, and are thus out-of-bounds for development. In some areas, like agriculture, forest and mining, the data were updated in consultation with the departments concerned. For example, the mangrove areas and Khazan lands are mapped, as well as the paddy fields (which have been mapped on the basis of revenue records). Further information pertaining to infrastructure in terms of water supply, power, and roads, have also been incorporated in consultation with the concerned departments.
Also mapped were all existing settlement areas (as per previous plan), along with change of zone effected by adopting the provisions of rectifications in the Town and Country Planning Act, 1974. Incorporating this change in zone areas meant that more than 4,000 government files had
2 The Khaznam (Khazan lands) of Goa are agricultural lands, subject to inundation by the neighbouring river or the sea from which they are protected by bunds.

157ENVIRONMENTALLY SUSTAINABLE AND PARTICIPATORY REGIONAL PLANNING IN INDIA
to be located, the findings noted, and the changes entered into the digitised land-use maps. This was a herculean task—and from these experiences, it is clear that Goa needs to strengthen data collection at all levels. As mapping contributes to transparency, all further efforts and follow-ups should be accessible in the public domain.
Though the planning exercise is executed to the best of the ability of planners, there could be still issues that necessitate ground surveys and verification at the local level. These plans therefore need to be referred to the stakeholders (public) with the request that they now be further checked, the data verified and the discrepancies pointed out, so as to incorporate them into the final Regional Plan.
Eco-Sensitive Zones
Goa is part of the ecosystem of the Western Ghats and is considered a “Bio-Diversity Hot Spot”.3 To protect Goa’s endangered and fragile ecosystems from further damage, the first step the team has undertaken is to identify the areas of great ecological importance that should not, under any
Figure 1: Basic data required for Mapping
Note: Above figure shows four images of a section of Reis Magos area.Source: Regional Plan for Goa, 2021.
3 Western Ghats, also known as Sahyadri, is a mountain range in a stretch of 1,600 km parallel to the western coast of the Indian peninsula. It traverses the states of Kerala, Tamil Nadu, Karnataka, Goa, Maharashtra and Gujarat.
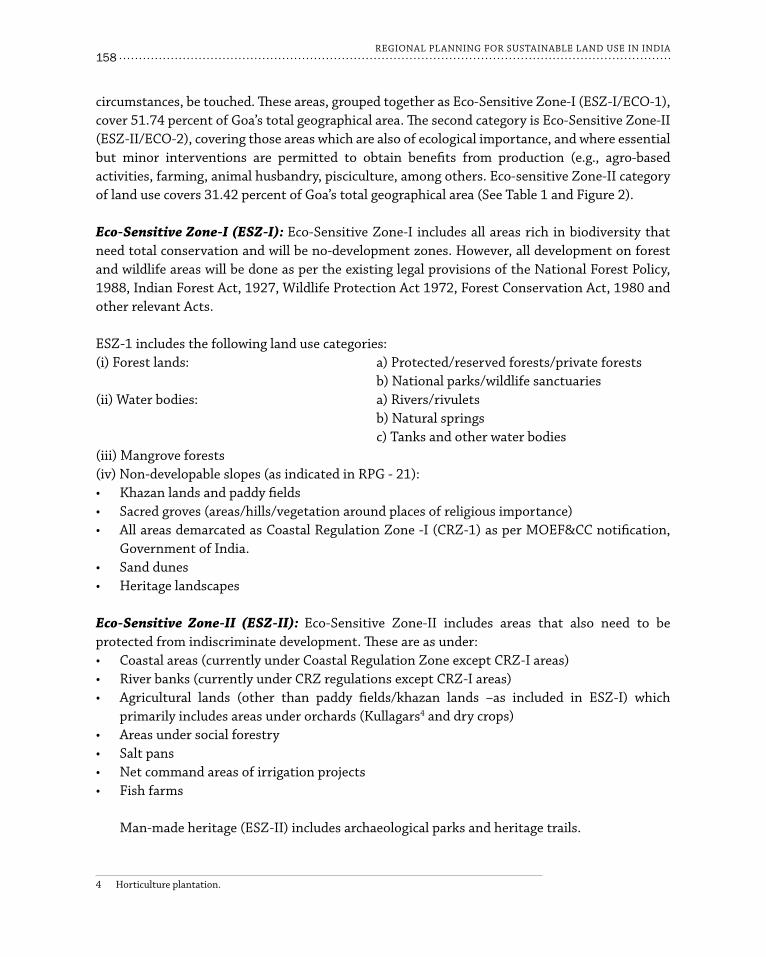
158REGIONAL PLANNING FOR SUSTAINABLE LAND USE IN INDIA
circumstances, be touched. These areas, grouped together as Eco-Sensitive Zone-I (ESZ-I/ECO-1), cover 51.74 percent of Goa’s total geographical area. The second category is Eco-Sensitive Zone-II (ESZ-II/ECO-2), covering those areas which are also of ecological importance, and where essential but minor interventions are permitted to obtain benefits from production (e.g., agro-based activities, farming, animal husbandry, pisciculture, among others. Eco-sensitive Zone-II category of land use covers 31.42 percent of Goa’s total geographical area (See Table 1 and Figure 2).
Eco-Sensitive Zone-I (ESZ-I): Eco-Sensitive Zone-I includes all areas rich in biodiversity that need total conservation and will be no-development zones. However, all development on forest and wildlife areas will be done as per the existing legal provisions of the National Forest Policy, 1988, Indian Forest Act, 1927, Wildlife Protection Act 1972, Forest Conservation Act, 1980 and other relevant Acts.
ESZ-1 includes the following land use categories:(i) Forest lands: a) Protected/reserved forests/private forests b) National parks/wildlife sanctuaries(ii) Water bodies: a) Rivers/rivulets b) Natural springs c) Tanks and other water bodies(iii) Mangrove forests(iv) Non-developable slopes (as indicated in RPG - 21):
Khazan lands and paddy fields•Sacred groves (areas/hills/vegetation around places of religious importance)•All areas demarcated as Coastal Regulation Zone -I (CRZ-1) as per MOEF&CC notification, •Government of India.Sand dunes•Heritage landscapes •
Eco-Sensitive Zone-II (ESZ-II): Eco-Sensitive Zone-II includes areas that also need to be protected from indiscriminate development. These are as under:
Coastal areas (currently under Coastal Regulation Zone except CRZ-I areas)•River banks (currently under CRZ regulations except CRZ-I areas)•Agricultural lands (other than paddy fields/khazan lands –as included in ESZ-I) which •primarily includes areas under orchards (Kullagars4 and dry crops)Areas under social forestry •Salt pans•Net command areas of irrigation projects•Fish farms•
Man-made heritage (ESZ-II) includes archaeological parks and heritage trails.
4 Horticulture plantation.
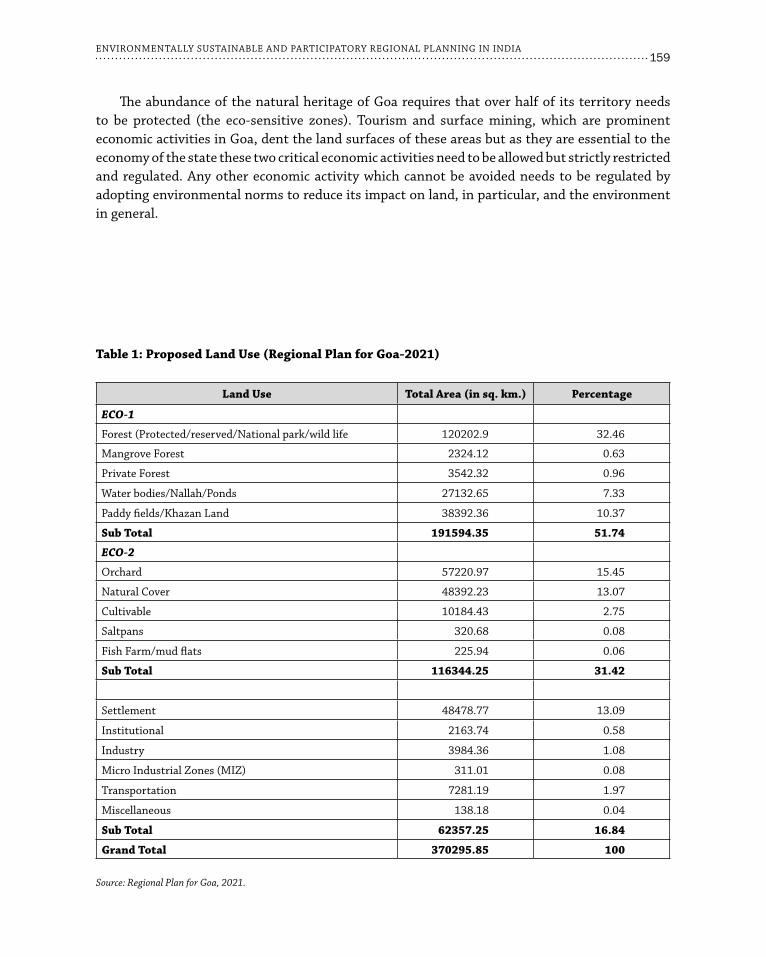
159ENVIRONMENTALLY SUSTAINABLE AND PARTICIPATORY REGIONAL PLANNING IN INDIA
The abundance of the natural heritage of Goa requires that over half of its territory needs to be protected (the eco-sensitive zones). Tourism and surface mining, which are prominent economic activities in Goa, dent the land surfaces of these areas but as they are essential to the economy of the state these two critical economic activities need to be allowed but strictly restricted and regulated. Any other economic activity which cannot be avoided needs to be regulated by adopting environmental norms to reduce its impact on land, in particular, and the environment in general.
Table 1: Proposed Land Use (Regional Plan for Goa-2021)
Land Use Total Area (in sq. km.) Percentage
ECO-1
Forest (Protected/reserved/National park/wild life 120202.9 32.46
Mangrove Forest 2324.12 0.63
Private Forest 3542.32 0.96
Water bodies/Nallah/Ponds 27132.65 7.33
Paddy fields/Khazan Land 38392.36 10.37
Sub Total 191594.35 51.74
ECO-2
Orchard 57220.97 15.45
Natural Cover 48392.23 13.07
Cultivable 10184.43 2.75
Saltpans 320.68 0.08
Fish Farm/mud flats 225.94 0.06
Sub Total 116344.25 31.42
Settlement 48478.77 13.09
Institutional 2163.74 0.58
Industry 3984.36 1.08
Micro Industrial Zones (MIZ) 311.01 0.08
Transportation 7281.19 1.97
Miscellaneous 138.18 0.04
Sub Total 62357.25 16.84
Grand Total 370295.85 100
Source: Regional Plan for Goa, 2021.

160REGIONAL PLANNING FOR SUSTAINABLE LAND USE IN INDIA
Economic Sectors and Land Use
The following is the breakdown of the contribution of various economic sectors to Goa’s Gross State Domestic Product (GSDP) in 2016-17 (see Figure 3):
primary sector (agriculture, animal husbandry, forestry, fisheries and mining) contributed •9.26 percent to the GSDP; secondary sector (manufacturing, construction, electricity, gas and water supply) - 55.18 •percent; tertiary sector (trade, hotels, restaurants, transport, communication, finance and real estate •and other services) - 35.56 percent.5
Figure 2: Eco-Sensitive Zones of Goa
Source: Regional Plan for Goa, 2021.
5 Economic Survey 2017–18, Directorate of Planning, Statistics and Evaluation, Government of Goa.

161ENVIRONMENTALLY SUSTAINABLE AND PARTICIPATORY REGIONAL PLANNING IN INDIA
9%
55%
36% Primary Sector
Secondary Sector
Tertiary Sector
(37%)
(5.21 %)
However, in terms of land use, the economic generating land uses in the secondary and tertiary sector occupy very little land, mainly within or near settlements and industrial estates. For instance, as per the Economic Survey 2017-18, the primary sector contributes 9.26 percent to the state’s GSDP even as the agriculture sector occupies more than 37 percent of geographical area. The secondary sector, i.e., industries and transport put together contributes more than 55 percent to the GSDP as it occupies 5.21 percent of land area.
Public Participation: A Precursor to application of Constitutional Provisions
The grassroots consultation processes advocated in the amendments carried out to the Constitution of India in 1992-93 (under 73rd & 74th amendments) were integrated into the preparation of Regional Plan for Goa-2021. This will go a long way in reversing the top-down decision-making approach of planning in the country. However, vested interests can muddle the process from many different points: they can come from the highest levels or lower ones. The participatory process seeks to ensure that the plans are not influenced by these vested interests, and will result in a genuine peoples’ plan. RPG-2021 has set up an explicit and transparent procedure that is clearly structured and involves the people of Goa. It is under the scrutiny of the media and the public at all times.
The Process: The basic requirements in implementing the participatory process is to have suitable and readable maps and plans. It is therefore necessary to adopt a framework of plans with suitable scales. To begin with, RPG-2021consists of the following framework of plans:
Figure 3: Sector-Wise Contribution to GSdP
Note: *Figures in bracket indicate the percentage of geographical area occupied /utilised by respective sector.

162REGIONAL PLANNING FOR SUSTAINABLE LAND USE IN INDIA
One Regional Plan (state): scale 1:100,000Two District-level Plans: scale 1:50,000Twelve Taluka Plans: scale 1:25,000Hundred Eighty Five Village Panchayat Plans: scale 1:5,000Nine Municipal Town Plans: scale 1:5,000
This process for preparing the final RPG-2021 and the settlement plans consisted of two inter linked stages:
Stage One - Distribution of planning kit to the local bodies: To involve the local bodies and the general public in the planning process, it is necessary to develop required tools such as readable plans, explanatory notes, questionnaires, land use interpretations, detailed procedure to be followed, and schedules of meetings and interactions. It is necessary to display state-level regional plan, district-level plan, taluka-level plan, and the land use plan of each local body (at a scale of 1:5,000) showing the proposed land use and the plan proposals.
The next step is to ascertain the needs and aims of the people in that settlement with regard to the key parameters of basic services (electricity, roads, and water supply, among others), as well as health and education and other livelihood needs. In addition, the views of the people from each settlement were obtained on whether they wish to increase or decrease the land use areas, the floor area ratio (FAR), and densities shown in the draft regional plans. This information is required to be co-related and incorporated into the final version of the Regional Plan.
The entire report of Regional Plan is required to be uploaded to the government website and one hard copy of the report is sent to each local body as part of the “planning kit”.
Stage Two - The proposed settlement plans are formulated. Since the time involved in developing these settlement plans might vary considerably (depending on the size of each settlement and the kind of issues involved), this process should start as soon as the presentation to the public of the framework plans is completed. Each proposed settlement plan must be developed in close consultation with the inhabitants of that settlement—specifying the roads, electricity, water, sewerage and other services lines required, as well as health, education and other community facilities. It should also specify which parcel of land is to be developed, and at what density. In other words, it is a plan made by the people for the village in which they live.
The merging of all proposed settlement-level plans is required to be done first in the taluka-level plan (prepared at a scale of 1:25,000). This should then be incorporated into the district-level plan (at a scale of 1:50,000) and thereafter in the state-level regional plan. The involvement of district planning committees, wherever applicable, shall be made mandatory.
The Participatory Process as Implemented - The mechanism for implementing the “participatory planning process” put in place by the government of Goa to achieve the greater involvement of people in its planning exercise is detailed below.
Step 1 - Constitution of State Level Committee (SLC) (core committee): The SLC is headed by the Chief Minister/Minister for Town and Country Planning and Chief Town Planner of the state as

163ENVIRONMENTALLY SUSTAINABLE AND PARTICIPATORY REGIONAL PLANNING IN INDIA
its member and convener. The other members are Director of Panchayat, Director of Municipal Administration, technical experts both from the government as well as professionals. A Regional Plan Division is created in Town and Country Planning Department (TCPD) to assist the SLC and its in-charge being a member of State Level Committee. The SLC is empowered to:
Oversee the process of public participation, coordinate with taluka-level technical team •(TLTT) for better interaction with village panchayats and municipalities.Explain the revised regional plan for Goa-2021 and its features to TLTT. •Prepare a questionnaire and a list of what parameters the comments/suggestions shall be •sought. Issue necessary orders and directions as may be necessary.•Collect the suggestions from TLTT and forward these to the TCP Board.•
Step 2 - Constitution of Taluka Level Technical Team (TLTT): This sub-regional committee is headed by the town planner at the taluka level from the Town and Country Planning Department. The other members are Block Development Officer, Assistant Engineer, Health Officer, Representative of Goa Institute for Rural Development Agency, and Deputy Director of Panchayat. A town planner of Regional Plan Division is also represented at TLTTs. The following are the functions of TLTT:
Comprehend the revised regional plan for Goa-2021 of the respective taluka•Take the plan to the respective taluka headquarters and further to the respective village •panchayat and municipalities, under its jurisdictionArrange for a venue where taluka-level plan and its respective village panchayat plans/•municipalities will be displayed. Arrange meetings at the taluka level, of the respective village panchayat and municipalities and explain the plan to them.Assist the village panchayat and municipalities by visiting the village panchayat/municipalities •as and when necessary and oversee the public participation process.Visit the village panchayat and municipalities in a phased manner at a mutually convenient •time.Collect the suggestions from all village panchayat and municipalities, classify them as per •categories and submit to state level committeeDistribute participatory process kits to the panchayat. •
Listed below are the roles of Taluka Level Technical Team (TLTT) after the village panchayat (VP)/municipal council (MC) submits the plan and inputs:
Merge all the VP/MC plans inputs comments to taluka-level plans.•Take assistance of Regional Plan Division (core committee) TCPD.•Submit all the taluka-level plans and inputs along with one copy of the settlement-level plan •to the DPCs for approval and further submission to TCPB/CTP.Simultaneously submit one set of plans to CTP.•
Participatory Process Kit: The State Level Committee prepared a “planning kit” consisting of the following items to distribute through taluka level technical team of each taluka to the respective local bodies coming under their jurisdiction:
Regional Plan for Goa -2021 report (hard copy of policy document)•
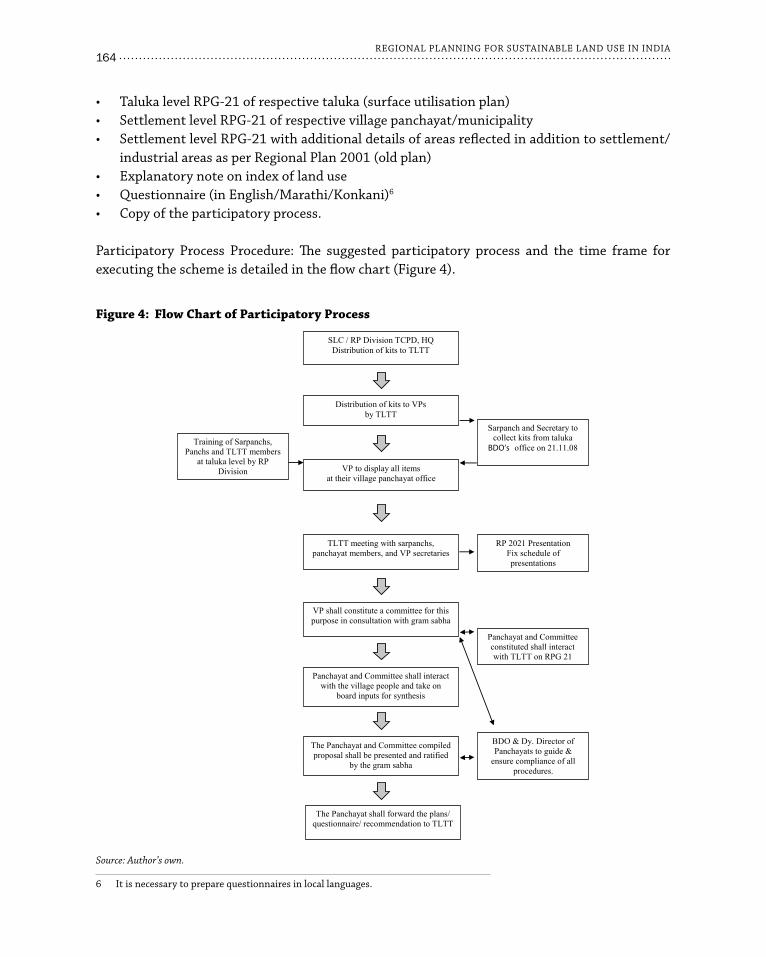
164REGIONAL PLANNING FOR SUSTAINABLE LAND USE IN INDIA
Taluka level RPG-21 of respective taluka (surface utilisation plan)•Settlement level RPG-21 of respective village panchayat/municipality•Settlement level RPG-21 with additional details of areas reflected in addition to settlement/•industrial areas as per Regional Plan 2001 (old plan)Explanatory note on index of land use•Questionnaire (in English/Marathi/Konkani)• 6
Copy of the participatory process.•
Participatory Process Procedure: The suggested participatory process and the time frame for executing the scheme is detailed in the flow chart (Figure 4).
Figure 4: Flow Chart of Participatory Process
Source: Author’s own.
6 It is necessary to prepare questionnaires in local languages.
SLC / RP Division TCPD, HQ Distribution of kits to TLTT
Distribution of kits to VPsby TLTT
VP to display all items at their village panchayat office
TLTT meeting with sarpanchs,panchayat members, and VP secretaries
VP shall constitute a committee for this purpose in consultation with gram sabha
Panchayat and Committee shall interact with the village people and take on
board inputs for synthesis
The Panchayat and Committee compiled proposal shall be presented and ratified
by the gram sabha
The Panchayat shall forward the plans/ questionnaire/ recommendation to TLTT
Sarpanch and Secretary to collect kits from taluka
BDO’s office on 21.11.08
RP 2021 Presentation Fix schedule of presentations
Panchayat and Committee constituted shall interact with TLTT on RPG 21
BDO & Dy. Director of Panchayats to guide &
ensure compliance of all procedures.
Training of Sarpanchs, Panchs and TLTT members
at taluka level by RP Division

165ENVIRONMENTALLY SUSTAINABLE AND PARTICIPATORY REGIONAL PLANNING IN INDIA
The entire process takes six to 10 months (including interactions and holding of gram sabhas) depending on the size of the planning area and the number of local bodies.The following are the roles of the Village Panchayat and Municipal Council:
Display all items provided in the kit in their jurisdiction.•Formulate committees of gram sabha representatives and ward committees.•Identify technical resource persons residing in the village and seek their services in assisting •the team.Ensure adequate representation of SC/ST/OBC persons including women in the committee.•Ensure that adequate number of questionnaires are photocopied and kept in the VP or •distributed to people.Keep a register for the names, addresses and signatures of people to whom the questionnaire •is issued.Questionnaire shall be issued to any of the residents who possess voting card/ration card/•passport/driving licence, other IDs, indicating the address in that VP area/municipality area.VP shall ensure the safety of the kit.•VP shall render all help to and also take all necessary assistance from TLTT and RP Division •of TCPD for any clarifications.VP shall collect/receive the questionnaire.•VP/Committee shall submit a final questionnaire compiled after taking conclusion and •recommendation based on the majority view on each issue, duly stamped and signed. Take resolutions to adopt all the suggestions/proposals included in the plan.•Submit all the plans/suggestions/recommendations/comments to TLTT, duly signed by •Panchayat.
The functions of the local body and the planning Committee elected by the Gram Sabha is mentioned below.
Mark all the roads in the villages up to six metres (existing).•Mark all proposed roads to link all areas/wards (proposed) •Any other resources/services to be identified as detailed in the questionnaire •Mark any missing water bodies, nallahs, heritage sites•Mark any missing settlement areas, industrial areas, etc. existing on the ground or approvals •granted as per lawMark existing market area of the village•Mark playgrounds, schools, hospitals, bus stand/clinics/colleges (existing/proposed), and •religious buildings, etc. Carve out the overlapping slopes on settlement areas after visiting the sites•Locate garbage disposal sites.•
Conclusion
In the process of formulating regional plans, it is necessary to have clear-cut objectives and to review existing plans, if any. It is necessary to focus on the current issues involving the
166REGIONAL PLANNING FOR SUSTAINABLE LAND USE IN INDIA
environment, economic development, settlement patterns and other essential elements of socio-economic development.
The success of any plan depends primarily on effective mapping tools; the maps and scale to be adopted shall be appropriate and people-friendly. The people should feel that they “own” the plans.
An analysis of socio-economic sectors in most of the regions is to be carried out, taking into consideration the objective of sustainable development which would be focused on land use policy, settlement policy and industrial policy. However, care needs to be taken to ensure the sustainable environment policy and application of eco-sensitive approach in planning has to be meshed with other policies. Failing which, the development and the environmental protection would not go hand in hand.
It is expected that all plans are for the welfare of the people. In a democracy, it is essential to involve the general public and gauge their pulse before taking up the plans for drafting. It calls for a sustained participatory approach in planning. The various Town and Country Planning Acts in the country provide for notification of all the plans and policies for the general public to obtain their inputs. Whereas, it is a known fact that the process prescribed in the current Acts does not provide adequate participatory procedures. In case of Regional plan for Goa the basic principle of 73rd & 74th constitutional Amendment Act, 1992 was adopted by invoking Goa Panchayat Raj Act, 1997-98 during the participatory process.
For an effective participatory process in planning, it is necessary to put an administrative setup exclusively for handling this participatory process. It is necessary to have a high-level coordination committee headed by suitable decision-making authorities followed by the district level committees, sub-regional level committees and local body committees. It is also necessary to involve land use departments, NGOs and the media, which can all play a role in assimilating the inputs from the people. These inputs need to be analysed. Only those suggestions which are in the greater public interest and pass the eco-sensitive approach shall be incorporated in the final regional plan.
The model followed by Goa is reflected in URDPFI guidelines issued by Town and Country Planning Organisation, Government of India. For the benefit of the other states, however, the Goa model may require suitable modifications to adopt depending on the requirements and priorities of respective states or regions.
All the plans need to be hosted on government websites. There is also a need to create a facilitation centre to continue the interaction with the local bodies and citizens. In Goa, the plans are also hosted on touch-screen kiosks, which can be accessed by citizens without any need for human interface.

Abstract
To sustain India’s current economic growth, the Government of India is encouraging regional-level, large-scale infrastructure development projects, such as the Sagarmala. The spurt in such regional infrastructure projects reflects the need for a multiscalar spatial planning framework in India to address potential regional imbalances and maintain ecological sustainability. Currently, despite the country’s economic growth and urbanisation, its overall spatial planning framework has not evolved. As part of the GIZ-supported Land-Use Planning and Management project, an intensive studio exercise was undertaken in the Ganjam district of Odisha. This chapter argues that existing approaches towards district planning do not sufficiently emphasise spatial and land-use aspects. District spatial planning can promote an overall culture of spatial planning in India. However, mainstreaming will require sustained efforts to increase awareness, codes of practices and capacity building.
Introduction
In the last decade, a majority of the global population have become predominantly urban. The economic links between the core and the periphery are now so close that one cannot succeed without the other, and thus, they are perceived and behave as a single entity.1 The cities of India are at the forefront of this global change.2
India is the largest democracy and one of the fastest-growing countries in the world. It is home to about 1.25 billion people, spread over 3.2 million sq.km, with a density of approximately 391 inhabitants per sq. km. The rate of urbanisation is much higher in India than in many other countries, having increased from 28.5 percent in 2001 to over 31 percent in 2011.3 According to the
13Mainstreaming District Spatial Planning in India: Lessons from the Studio on Participatory District Planning in Ganjam, Odisha
Saswat Bandyopadhyay and Prasenjit Shukla
1 UN-Habitat, GIZ, Unpacking Metropolitan Governance for Sustainable Development (Bonn and Eschborn: Deutsche Gesellschaft für Internationale Zusammenarbeit (GIZ) GmbH, 2015), 13.
2 Deyan Sudjic, Urban India: Understanding the Maximum City (Berlin: Urban Age, 2008), 4.3 As per Census 2011.

168REGIONAL PLANNING FOR SUSTAINABLE LAND USE IN INDIA
World Bank, India’s annual urban population growth was 2.3 percent in 2017. The UN estimates India’s urban dwellers to increase by another 416 million by 2050. Several urban agglomerations (or clusters of cities) have developed as a result of urbanisation. In the last decade, the number of mega-sized urban clusters (with over 50 lakh people) has remained almost constant while the number of smaller urban clusters have increased rapidly (See Figure 1).
This rapid growth in population makes it difficult to ensure the effective delivery of basic services and infrastructure, resulting in a “messy and hidden” urbanisation.4 For several major Indian agglomerations, rapid growth in the peripheral areas has been accompanied by stagnation at the core, as the current land-management policies limit the extent to which land can be used for industry, commerce and housing.5 While the cities are increasing in number, one out of every three persons lives below the poverty line and two-thirds of the people live in unplanned settlements and slums.
The progress of cities is inevitable, as they are the engine of national growth, adding value to rural produce, serving regional markets and attracting national and international investments.6
Figure 1: Number of Urban Agglomerations with Varying Populations (2005–15)
Source: The Hindu Data Team, 2018.
4 “South Asia Not Taking Full Economic Advantage of Urbanization,” Press Release, World Bank, 2015, http://www.worldbank.org/en/news/press-release/2015/09/24/south-asia-not-taking-full-economic-advantage-urbanization.
5 Nandita Roy, “Indian Cities Can Take More Advantage of Urbanization for Economic Growth,” World Bank, http://www.worldbank.org/en/news/press-release/2015/09/24/indian-cities-can-take-more-advantage-urbanization-for-economic-growth.
6 A.K. Jain, “Urban Governance: Challenges and Opportunities,” HUDCO Shelter 15 (2014): 39–40.
169MAINSTREAMING DISTRICT SPATIAL PLANNING IN INDIA
Thus, there is a need for integrated policies to improve the lives of urban and rural dwellers and firm up the linkages between urban and rural areas, building on their existing economic, social and environmental ties.7 This needs an appropriate plan that takes into account local needs while ensuring compliance with economic policies and democratic decentralisation.
District Planning in India
District planning in India is crucial for consolidating the various plans of panchayats and municipalities and making an integrated plan within districts. While decentralised planning is an old concept, in practice, district planning remains restricted to some pilot cases or specific areas of special interests.
In the initial stages of decentralised planning, District Development Councils (DDC) were constituted in each district to prepare plans. However, most of them failed to mainstream the local planning exercises and conduct a multistakeholder exercise at the district level. Though many states have formulated District Planning Committees (DPCs), they are not compatible with Constitutional provisions. Further complicating matters is the lack of regular meetings of the DPCs. They also do not have a clear awareness of their roles and responsibilities.8
Some scholars such as Mahi Pal observe that, despite multiple attempts to formulate district planning, India struggles to operationalise it due to a lack of people’s institutions.9 Another obstacle is the resistance to intersectoral coordination as it challenges the status quo. For example, the planning process of central schemes such as NREGA, HRIDAY and AMRUT, wherever undertaken, is often independent of annual planning at panchayat or municipal levels.10
District Planning Committee
The formulation of the 73rd and 74th Amendments to the Constitution—mandating the establishment of panchayats at the district, intermediate and village levels—is a reversal of the previously centralised approach to district planning. Moreover, Article 243 ZD of the 74th Constitutional Amendment Act mandates the establishment of a DPC to consolidate plans prepared by panchayats and municipalities in the district into the Draft District Plan.
The Amendments also establish the overarching responsibility of the central government, i.e. to ensure the full implementation of the Constitution and empower panchayats and municipalities as institutions of local self-governance. The central government’s interest in strengthening local governments stems from the widespread need for institutional changes to enable and sustain greater access to basic local services, as well as the considerable investments it currently makes in local service delivery functions, through centrally sponsored schemes. The establishment of
7 United Nations, World Urbanization Prospects: The 2018 Revision, Population Division of UN Department of Economic and Social Affairs, https://population.un.org/wup/Publications/Files/WUP2018-KeyFacts.pdf.
8 PRIA, “An Agenda for NITI Aayog: Revitalizing District Planning Committees,” https://www.pria.org/featuredstory-an-agenda-for-niti-aayog-revitalising-district-planning-committees-44-1.
9 Mahi Pal, “Decentralised Planning and Panchayati Raj,” Economic and Political Weekly 36, 12 (2001): 1002–005.10 PRIA, op. cit.
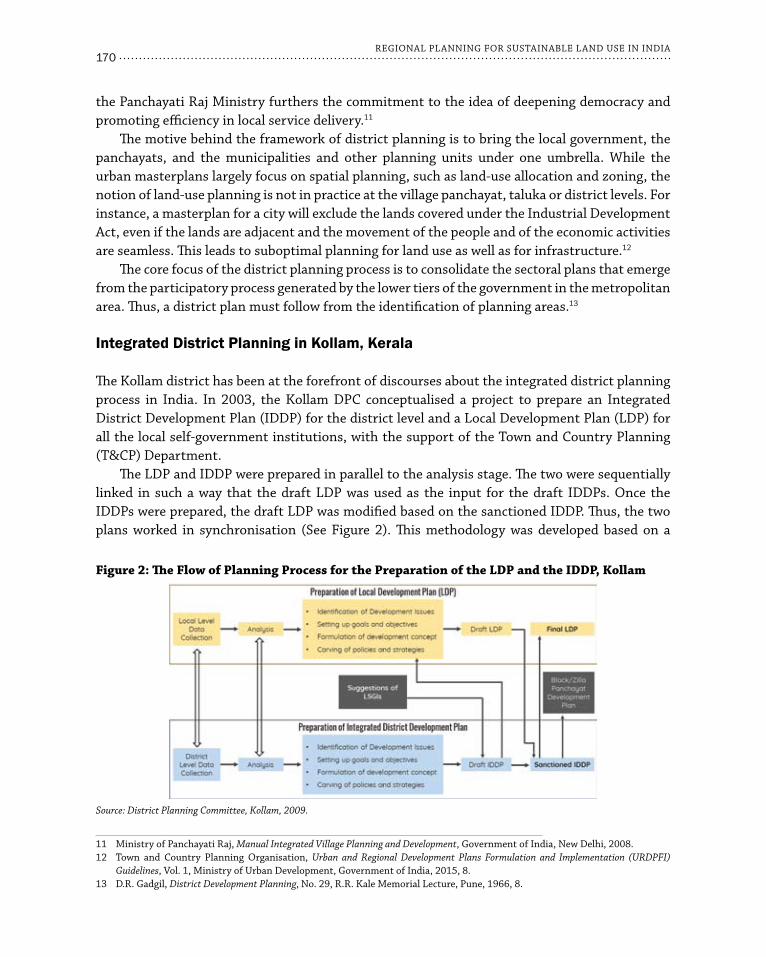
170REGIONAL PLANNING FOR SUSTAINABLE LAND USE IN INDIA
the Panchayati Raj Ministry furthers the commitment to the idea of deepening democracy and promoting efficiency in local service delivery.11
The motive behind the framework of district planning is to bring the local government, the panchayats, and the municipalities and other planning units under one umbrella. While the urban masterplans largely focus on spatial planning, such as land-use allocation and zoning, the notion of land-use planning is not in practice at the village panchayat, taluka or district levels. For instance, a masterplan for a city will exclude the lands covered under the Industrial Development Act, even if the lands are adjacent and the movement of the people and of the economic activities are seamless. This leads to suboptimal planning for land use as well as for infrastructure.12
The core focus of the district planning process is to consolidate the sectoral plans that emerge from the participatory process generated by the lower tiers of the government in the metropolitan area. Thus, a district plan must follow from the identification of planning areas.13
Integrated District Planning in Kollam, Kerala
The Kollam district has been at the forefront of discourses about the integrated district planning process in India. In 2003, the Kollam DPC conceptualised a project to prepare an Integrated District Development Plan (IDDP) for the district level and a Local Development Plan (LDP) for all the local self-government institutions, with the support of the Town and Country Planning (T&CP) Department.
The LDP and IDDP were prepared in parallel to the analysis stage. The two were sequentially linked in such a way that the draft LDP was used as the input for the draft IDDPs. Once the IDDPs were prepared, the draft LDP was modified based on the sanctioned IDDP. Thus, the two plans worked in synchronisation (See Figure 2). This methodology was developed based on a
Figure 2: The Flow of Planning Process for the Preparation of the LdP and the IddP, Kollam
Source: District Planning Committee, Kollam, 2009.
11 Ministry of Panchayati Raj, Manual Integrated Village Planning and Development, Government of India, New Delhi, 2008.12 Town and Country Planning Organisation, Urban and Regional Development Plans Formulation and Implementation (URDPFI)
Guidelines, Vol. 1, Ministry of Urban Development, Government of India, 2015, 8.13 D.R. Gadgil, District Development Planning, No. 29, R.R. Kale Memorial Lecture, Pune, 1966, 8.

171MAINSTREAMING DISTRICT SPATIAL PLANNING IN INDIA
combination of the top-down and the grassroots approaches, i.e. the policies and strategies flow downwards, while plans, programmes and projects are conceived and implemented at the grassroots level to achieve the desired spatial pattern at higher levels.14
The process also involved consultations and training of multiple stakeholders, such as DPC members, LSGIs members and NGOs at the gram panchayat level. The funding pattern adopted for the Kollam project was based on a decentralised planning system. The project initiated by the Kollam DPC was conceived as a joint project of all the LSGIs of the district. Thus, the LSGIs allocated funds for the project from their 10th and 11th five-year plan allocation.
The apex body for the preparation of the development plan is the DPC constituted under the 74th Constitutional Amendment Act, with the Department of T&CP acting as a nodal agency. On the other hand, for the preparation of LDP, the apex body is the gram panchayat committee or the municipal council.15
The Kollam District Development Plan focuses on long-term issues such as district-level policies, settlement patterns, integrated development of urban and rural areas and, most importantly, a long-term perspective of regional infrastructure. An argument for greater devolution can be made based on the Kollam’s case, which demonstrates that the transfer of funds, functions and functionaries is the key to successful decentralisation. Local bodies must be seen as institutions of self-governance, not as “delivery mechanisms.” Thus, top-down decentralisation must converge with bottom-up decentralisation by forging links between local bodies and informal associations and user groups.16
The Kollam District Development Plan has certain limitations in the area of land use or spatial planning. The “district plan” mainly involves overlaying of administrative boundaries of various key government stakeholders at the district level.
Spatial Planning in Germany
Spatial planning in a federal country such as Germany can be seen as the distribution of competencies from the national to the local level. The approach to spatial planning in Germany is not confined to land-use planning and covers all spatially relevant interests, functions, programmes and projects. The distribution of powers and principles amongst the levels of government are distinctly observable:
The promotion of economically, ecologically and socially sustainable distribution of functions •can be seen at the national level, including infrastructure projects of national importance. The states participate in the coordination and approval of public and private infrastructure •of spatial relevance. There are two types of land-use plans prepared at the local level. The preparatory land-use plan •(“Flächen nutzungsplan,” scale 1:5,000 to 1:15,000) constitutes a framework instrument,
14 Department of Town and Country Planning, Methodology of Preparation of LDPs and IDDP, Vol. 3, District Planning Committee, Thiruvananthapuram, Kollam, 2009, 3.
15 Ibid., 4.16 Human Development Resource Centre, “Decentralisation in India: Challenges & Opportunities,” Discussion Paper Series-1,
United Nations Development Programme, New Delhi, 2000, 2.
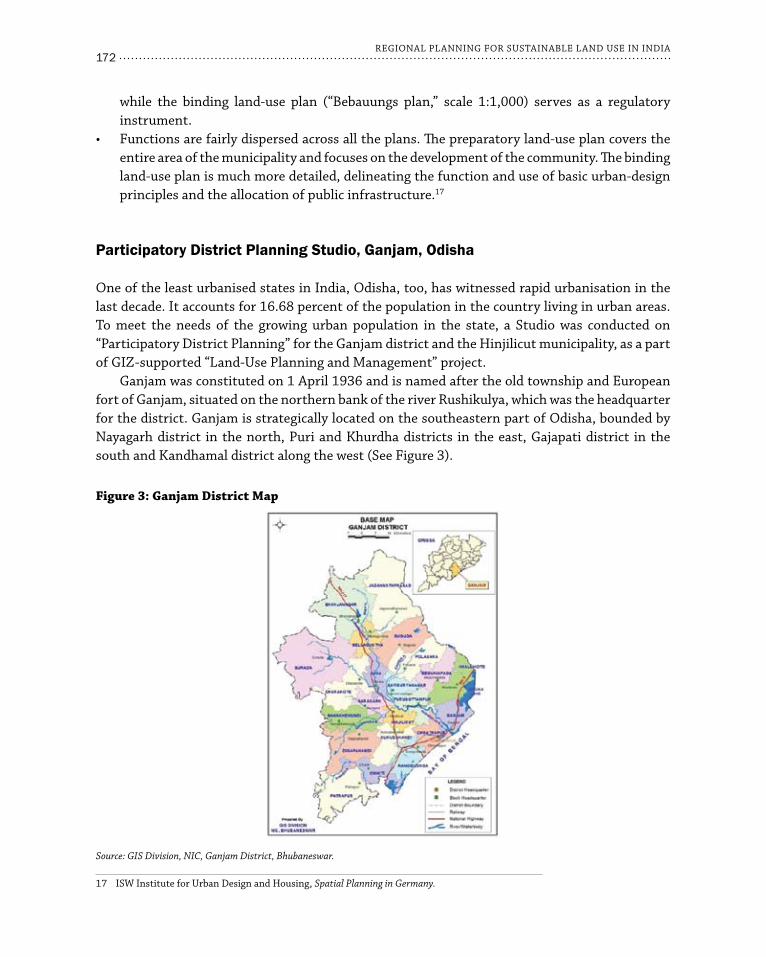
172REGIONAL PLANNING FOR SUSTAINABLE LAND USE IN INDIA
while the binding land-use plan (“Bebauungs plan,” scale 1:1,000) serves as a regulatory instrument.Functions are fairly dispersed across all the plans. The preparatory land-use plan covers the •entire area of the municipality and focuses on the development of the community. The binding land-use plan is much more detailed, delineating the function and use of basic urban-design principles and the allocation of public infrastructure.17
Participatory District Planning Studio, Ganjam, Odisha
One of the least urbanised states in India, Odisha, too, has witnessed rapid urbanisation in the last decade. It accounts for 16.68 percent of the population in the country living in urban areas. To meet the needs of the growing urban population in the state, a Studio was conducted on “Participatory District Planning” for the Ganjam district and the Hinjilicut municipality, as a part of GIZ-supported “Land-Use Planning and Management” project.
Ganjam was constituted on 1 April 1936 and is named after the old township and European fort of Ganjam, situated on the northern bank of the river Rushikulya, which was the headquarter for the district. Ganjam is strategically located on the southeastern part of Odisha, bounded by Nayagarh district in the north, Puri and Khurdha districts in the east, Gajapati district in the south and Kandhamal district along the west (See Figure 3).
17 ISW Institute for Urban Design and Housing, Spatial Planning in Germany.
Figure 3: Ganjam district Map
Source: GIS Division, NIC, Ganjam District, Bhubaneswar.
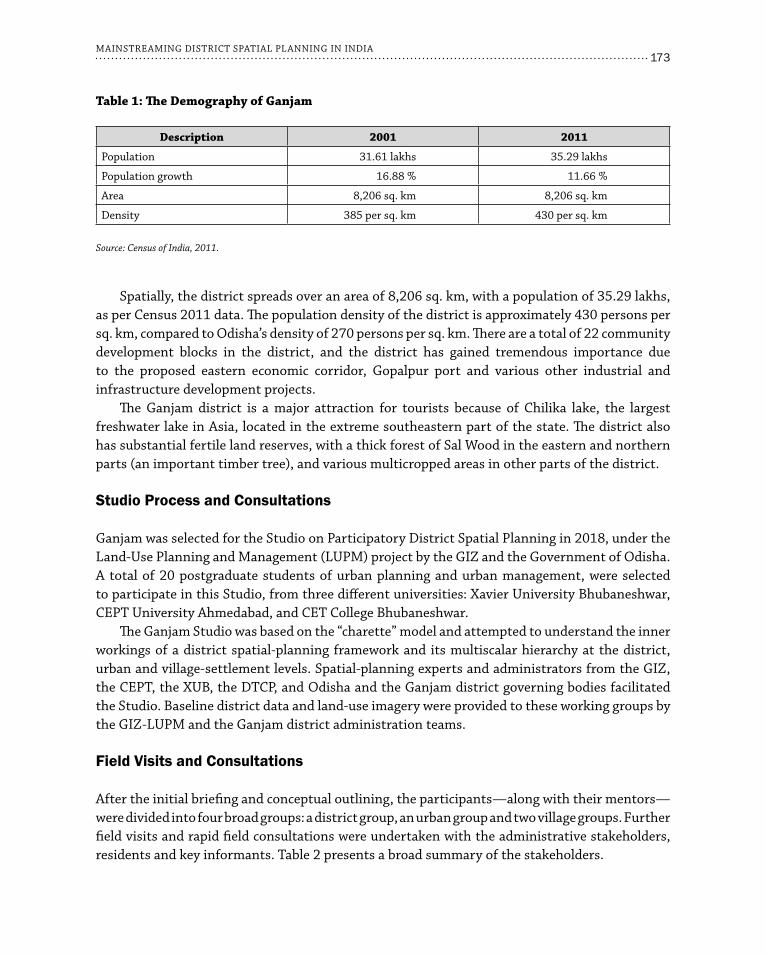
173MAINSTREAMING DISTRICT SPATIAL PLANNING IN INDIA
Spatially, the district spreads over an area of 8,206 sq. km, with a population of 35.29 lakhs, as per Census 2011 data. The population density of the district is approximately 430 persons per sq. km, compared to Odisha’s density of 270 persons per sq. km. There are a total of 22 community development blocks in the district, and the district has gained tremendous importance due to the proposed eastern economic corridor, Gopalpur port and various other industrial and infrastructure development projects.
The Ganjam district is a major attraction for tourists because of Chilika lake, the largest freshwater lake in Asia, located in the extreme southeastern part of the state. The district also has substantial fertile land reserves, with a thick forest of Sal Wood in the eastern and northern parts (an important timber tree), and various multicropped areas in other parts of the district.
Studio Process and Consultations
Ganjam was selected for the Studio on Participatory District Spatial Planning in 2018, under the Land-Use Planning and Management (LUPM) project by the GIZ and the Government of Odisha. A total of 20 postgraduate students of urban planning and urban management, were selected to participate in this Studio, from three different universities: Xavier University Bhubaneshwar, CEPT University Ahmedabad, and CET College Bhubaneshwar.
The Ganjam Studio was based on the “charette” model and attempted to understand the inner workings of a district spatial-planning framework and its multiscalar hierarchy at the district, urban and village-settlement levels. Spatial-planning experts and administrators from the GIZ, the CEPT, the XUB, the DTCP, and Odisha and the Ganjam district governing bodies facilitated the Studio. Baseline district data and land-use imagery were provided to these working groups by the GIZ-LUPM and the Ganjam district administration teams.
Field Visits and Consultations
After the initial briefing and conceptual outlining, the participants—along with their mentors—were divided into four broad groups: a district group, an urban group and two village groups. Further field visits and rapid field consultations were undertaken with the administrative stakeholders, residents and key informants. Table 2 presents a broad summary of the stakeholders.
Table 1: The demography of Ganjam
description 2001 2011
Population 31.61 lakhs 35.29 lakhs
Population growth 16.88 % 11.66 %
Area 8,206 sq. km 8,206 sq. km
Density 385 per sq. km 430 per sq. km
Source: Census of India, 2011.

174REGIONAL PLANNING FOR SUSTAINABLE LAND USE IN INDIA
The Studio attempted to collate information from diverse stakeholders, located at various spatial hierarchies and made an attempt to visualise them on land-use basemaps. The land-use basemaps were first developed using secondary data and open-source remote sensing images.18 The maps were then updated based on the discussions with the respective government agencies, municipalities and sectoral departments. The ongoing and future proposals were marked spatially on the maps, which was followed by rapid ground truthing and SWOT analysis.
18 These were developed at the district level, the municipality level (Hinjilicut), and at the village level (villages Sompur and Sikri).
Table 2: List of Stakeholders Consulted in the Ganjam district
district Hinjilicut City Village Sompur Village Sikri
District Magistrate Chairman Sarpanch Sarpanch
District Planningand Monitoring Unit
Executive Officer Revenue Inspector Revenue Inspector
TehsildarElected representatives at the panchayat level
Elected representatives at the panchayat level
Block development officer Local enterprise owners Local enterprise owners
Key informants Residents Residents Residents
Source: GIZ, Studio on Participatory District Planning, 2018.
Figure 4: discussion with the Officials, Stakeholders and Villagers
Source: GIZ, Studio on Participatory District Planning, 2018.
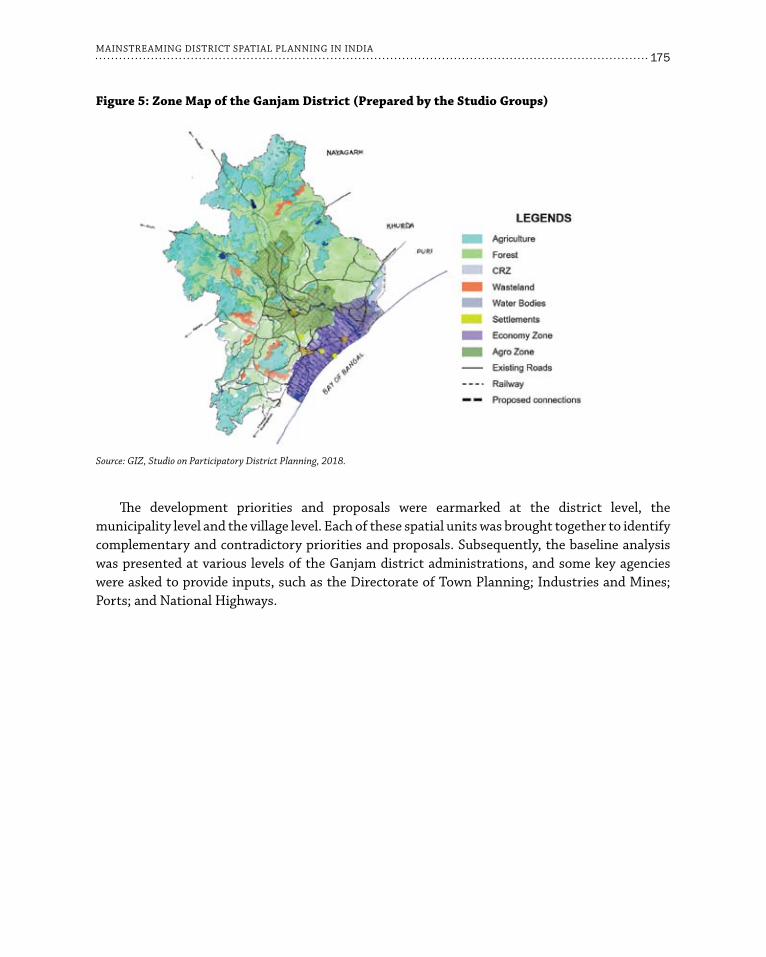
175MAINSTREAMING DISTRICT SPATIAL PLANNING IN INDIA
The development priorities and proposals were earmarked at the district level, the municipality level and the village level. Each of these spatial units was brought together to identify complementary and contradictory priorities and proposals. Subsequently, the baseline analysis was presented at various levels of the Ganjam district administrations, and some key agencies were asked to provide inputs, such as the Directorate of Town Planning; Industries and Mines; Ports; and National Highways.
Figure 5: Zone Map of the Ganjam district (Prepared by the Studio Groups)
Source: GIZ, Studio on Participatory District Planning, 2018.

176REGIONAL PLANNING FOR SUSTAINABLE LAND USE IN INDIA
Figure 6: Existing and Proposed Land-Use Map of Hinjilicut Municipality
Source: GIZ, Studio on Participatory District Planning, 2018.
Key Conceptual Challenges
The working groups faced several challenges during their visits and analyses (See Table 3). The Ganjam Studio was greatly limited by its scope, time and resources. However, the week-
long workshop brought to the forefront some important conceptual and methodological features and limitations of the inner workings of the ‘district spatial planning’ process in India, as well as possible solutions and plans of action.
The culture of spatial planning at all three levels is low. Most sectoral agencies function •with tabular statistical data, and in some cases, administrative boundary maps are used for visualisation.The Hinjilicut Municipality masterplan had not yet been updated to reflect recent developments •and spatial changes. The process to update it was underway during the Studio and further details were not available.
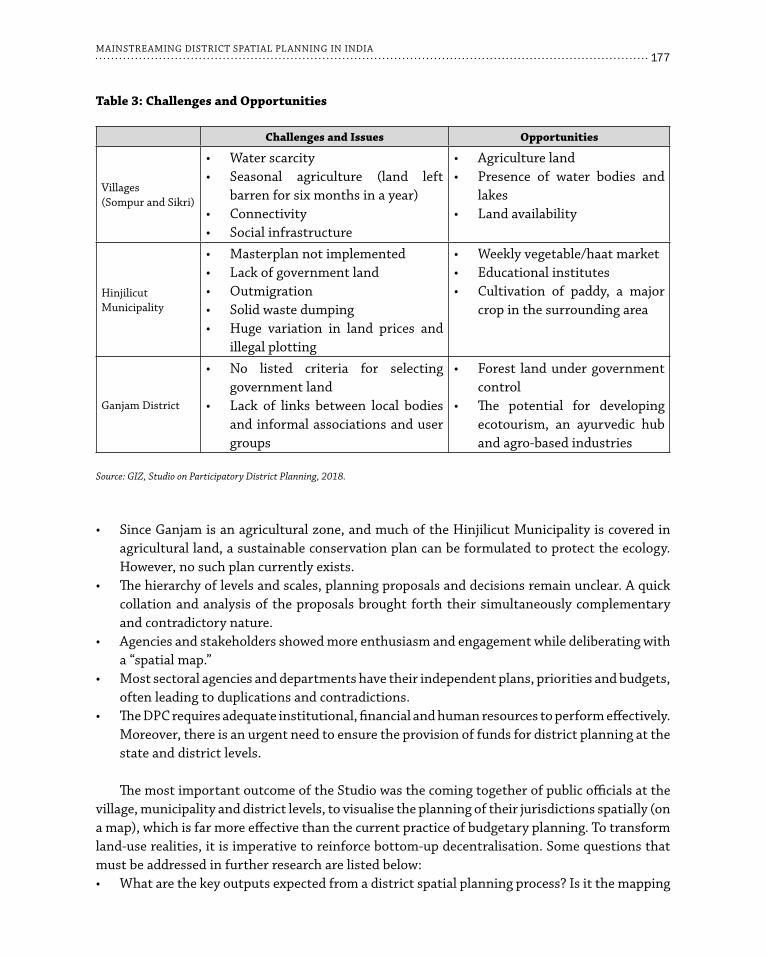
177MAINSTREAMING DISTRICT SPATIAL PLANNING IN INDIA
Since Ganjam is an agricultural zone, and much of the Hinjilicut Municipality is covered in •agricultural land, a sustainable conservation plan can be formulated to protect the ecology. However, no such plan currently exists.The hierarchy of levels and scales, planning proposals and decisions remain unclear. A quick •collation and analysis of the proposals brought forth their simultaneously complementary and contradictory nature. Agencies and stakeholders showed more enthusiasm and engagement while deliberating with •a “spatial map.”Most sectoral agencies and departments have their independent plans, priorities and budgets, •often leading to duplications and contradictions.The DPC requires adequate institutional, financial and human resources to perform effectively. •Moreover, there is an urgent need to ensure the provision of funds for district planning at the state and district levels.
The most important outcome of the Studio was the coming together of public officials at the village, municipality and district levels, to visualise the planning of their jurisdictions spatially (on a map), which is far more effective than the current practice of budgetary planning. To transform land-use realities, it is imperative to reinforce bottom-up decentralisation. Some questions that must be addressed in further research are listed below:
What are the key outputs expected from a district spatial planning process? Is it the mapping •
Table 3: Challenges and Opportunities
Challenges and Issues Opportunities
Villages(Sompur and Sikri)
Water scarcity•Seasonal agriculture (land left •barren for six months in a year)Connectivity•Social infrastructure•
Agriculture land•Presence of water bodies and •lakesLand availability •
Hinjilicut Municipality
Masterplan not implemented•Lack of government land•Outmigration•Solid waste dumping•Huge variation in land prices and •illegal plotting
Weekly vegetable/haat market•Educational institutes•Cultivation of paddy, a major •crop in the surrounding area
Ganjam District
No listed criteria for selecting •government land Lack of links between local bodies •and informal associations and user groups
Forest land under government •controlThe potential for developing •ecotourism, an ayurvedic hub and agro-based industries
Source: GIZ, Studio on Participatory District Planning, 2018.

178REGIONAL PLANNING FOR SUSTAINABLE LAND USE IN INDIA
and visualisation of collated sectoral data? What is the specific role of the ‘district spatial planning agency’ or the ‘district planner’: that •of a maker or a facilitator?Which is better: detailed cadastre- (or ‘record of rights’) based district planning or •administrative boundary-based strategic planning?What are the limits of the district-planning process?•Is it possible to use ‘district spatial planning’ as a tool to transform the culture of planning at •various administrative unit levels?
Conclusion
The week-long Studio at Ganjam provided valuable insights about the inner workings of district planning processes, its key stakeholders and how such a spatial-planning process can meaningfully aid decision-making processes at various levels within a district. The Studio also brought forth a few critical and conceptual debates related to the district spatial planning framework and its scope.
This chapter argues that existing approaches towards district planning do not sufficiently emphasise spatial and land-use aspects, and the much-needed culture of spatial data usage is mostly limited to the urban areas.
The Studio showed that spatial planning at the district level offers a good platform for multistakeholder agencies and citizens to deliberate and negotiate on the development proposals at various scales. It also observed a higher degree of engagement while discussing the district planning proposals on a map, instead of traditional table-based formats.
While framing the policies for district planning, India can learn from Germany’s model of including landscape plans and natural features in the land-use plan at the local level. In 1993, during its unification, Germany made provisions for stronger private engagement in statutory planning in response to the need for faster preparation of binding land-use plans. Private engagement allows developers to prepare project-specific binding land-use plans, which offer greater flexibility to include detailed agreements between the municipality and the developer regarding the characteristics of the project and the sharing of development costs. If India implements this model, the scale of provision of private engagement in statutory planning must be discussed in an Indian context.
The framework of a district spatial plan is still evolving in India, and the culture of spatial planning in most district-level agencies are at their nascent stages. ‘District spatial planning’ in the country can help build the culture of spatial planning. However, several fundamental issues must first be addressed, including the purpose of such a plan, its expected outcomes, the role of the nodal agency, and the plan’s limitations. Mainstreaming the process will require sustained efforts at various levels in terms of awareness, codes of practices and capacity-building.

179
About the Editors and Authors
EditorsRumi Aijaz, Senior Fellow, Observer Research Foundation, New Delhi
Felix Knopf, Adviser, Land Use Planning and Management, Deutsche Gesellschaft für Internationale Zusammenarbeit (GIZ), New Delhi
Contributing AuthorsSabiha BAIG, Ph. D. Research Scholar, Centre for the Study of Regional Development,
Jawaharlal Nehru University, New Delhi
Saswat BANDYOPADHYAY, Professor, CEPT University, Ahmedabad
Tathagata CHATTERJI, Professor, Xavier Centre for Urban Management and Governance, Xavier University Bhubaneswar, Harirajpur, District Puri, Odisha
Deepika CHAUHAN, Regional Planner
Sugato DUTT, Land Use Division, Tamil Nadu State Planning Commission, Chennai
Ashok D. HANJAGI, Professor, Department of Geography and Geoinformatics, Bangalore University
Rajeev MALHOTRA, Chief Regional Planner (Retired), National Capital Region Planning Board, New Delhi
Anjali Karol MOHAN, Consulting Urban and Regional Planner, Visiting Faculty, NLSUI, IIITB and TLI, Bangalore
Aparna PHADKE, Assistant Professor, Department of Geography, University of Mumbai
S. T. PUTTARAJU, Chief Town Planner (Land Use), Town and Country Planning Department, Government of Goa
V. Srinivasa RAO, Associate Professor, Centre for Regional Studies, School of Social Sciences, University of Hyderabad, Hyderabad
Benjamin L. SAITLUANGA, Assistant Professor, Department of Geography and Resource Management, Mizoram University, Aizawl
Prasenjit SHUKLA, Associate, Darashaw & Company Private Limited, Chennai
Vinita YADAV, Professor and Head of Department, Department of Regional Planning, School of Planning and Architecture, New Delhi


Land surface is under various natural geographical features. All human activities also
occur over the land surface. Since land is the basis for many things and is needed for
various purposes, it is essential that the surface is optimally utilised. The increasing
pressure on land due to high demand and inefficiencies in land use planning and
management by the state is adversely affecting the environment and society.
This publication aims to build knowledge of the best ways to utilise land through spatial
planning on a broader scale, i.e., district or region. It comprises twelve chapters written
by Indian scholars and professionals, who describe the role regional spatial planning
can play in overcoming India’s social, economic, environmental, and infrastructure
challenges. The contributing authors discuss various issues of regional significance,
and offer ideas to overcome the problems.
The editors conclude that regional plans should be prepared based on a thorough
understanding of regional issues, and even the best-designed regional plans will be
difficult to implement unless the responsible agencies at the state and local levels are
prepared to handle their tasks professionally.