regional energy implementation plan - · pdf fileregional energy implementation plan ......
TRANSCRIPT

REGIONAL ENERGY
IMPLEMENTATION
PLAN A Pathway to Achieving Vermont’s Energy Goals
DRAFT 10/5/16
Funded by the Vermont Department of Public Service, VTrans and
the Two Rivers-Ottauquechee Regional Commission

Draft 10/5/16
2 | P a g e
Acknowledgements
Authors: Chris Sargent, AICP
Dee Gish
Direction and review during this project was provided by the TRORC Regional
Energy Plan Committee, including:
Mark Bannon, Braintree
Don Bourdon, Woodstock
Steve Campbell, Strafford
Bill Edgerton, Stockbridge
Nancy Jones, Bradford
Nancy Malmquist, West Fairlee
Sally Miller, Sustainable Woodstock
Sarah Brock, Vital Communities
Bob Walker, Thetford
Timeline: This represents the second full draft of the TRORC Energy
Implementation Plan. Comments from the Vermont Department of Public
Service (DPS), and the attendees of our public comment forums (held on
September 27th, 29th and October 5th, 2016) have been incorporated. The Final
draft will be submitted to the DPS no later than February 1, 2017. Please note
that as of the publication of this draft, several of the appendices are still under
development.
Draft 10/5/16
3 | P a g e
Table of Contents
1. Introduction .......................................................................................................................................... 6
Background ............................................................................................................................................... 6
DPS/RPC Project .................................................................................................................................... 6
Summary of Data Collection and Analysis ............................................................................................ 7
Data ....................................................................................................................................................... 8
Key Issues .................................................................................................................................................. 9
Environmental Protection ..................................................................................................................... 9
Energy Security ..................................................................................................................................... 9
Economic Needs and Opportunities ................................................................................................... 10
The Growing Importance of Electricity ............................................................................................... 11
Plan Focus ........................................................................................................................................... 11
Life of the Plan .................................................................................................................................... 12
2. Thermal Efficiency and Alternative Heating Systems ......................................................................... 13
Background ........................................................................................................................................ 13
New Construction ............................................................................................................................... 14
How We Heat ...................................................................................................................................... 14
Thermal Energy Challenges ..................................................................................................................... 15
Aging Building Stock ............................................................................................................................ 15
Cost of Improvements......................................................................................................................... 16
Lags in deploying Energy Efficiency Standards ................................................................................... 16
Inadequate Understanding of Programs, Costs and Methods ........................................................... 17
Thermal Energy Strategies ...................................................................................................................... 17
Support Increased Funding ................................................................................................................. 17
Support the implementation of the Vermont Energy Code Compliance Plan and increased Energy
Efficiency Standards ............................................................................................................................ 18
Provide Outreach, Coordination and Education ................................................................................. 18
Thermal Energy Goals, Strategies and Actions ....................................................................................... 19
3. Transportation System Changes and Land Use Strategies.................................................................. 22
Transportation and Land Use Challenges ............................................................................................... 23
Traditional Patterns of Development ................................................................................................. 23
Lack of Available Public Transit ........................................................................................................... 24

Draft 10/5/16
4 | P a g e
Insufficient Land for Commuter Lots .................................................................................................. 24
Lack of EV Charging Station Infrastructure ......................................................................................... 25
Development Progresses without Adequate Consideration of Public Transit or Energy Efficient
Transportation Methods ..................................................................................................................... 26
Transportation and Land Use Strategies ................................................................................................. 26
Support Smart Growth Planning ......................................................................................................... 26
Encourage Higher Density in Less Rural Areas .................................................................................... 27
Encourage Employers to Support Reduced VMT ................................................................................ 27
Support Increased Consideration for Public Transit and Electric Vehicles in Local and State Permit
Reviews ............................................................................................................................................... 27
Support the Development of Alternative Forms of Public Transit ..................................................... 27
Increase funding for Public Transit Initiatives and Investments ......................................................... 28
Transportation Goals, Strategies and Actions ........................................................................................ 28
4. Energy Conservation, Efficiency of Delivery and End Use .................................................................. 31
Background ......................................................................................................................................... 31
Demand-Side Management ................................................................................................................ 31
Conservation & Efficiency ................................................................................................................... 32
Challenges ............................................................................................................................................... 32
Electricity will make up a larger part of our energy future ................................................................. 32
Power Distribution System is not designed for distributed generation ............................................. 32
Regional and Municipal Planning does an inadequate job with regard to renewable energy
generation ........................................................................................................................................... 33
Inadequate Understanding of programs, costs and methods ............................................................ 33
Behavioral patterns do not reflect a need for energy conservation .................................................. 33
Renewable Energy Credits Can Be Sold Out of State .......................................................................... 34
Electricity Strategies................................................................................................................................ 35
Improve Demand-Side Management .................................................................................................. 35
Promote Behavioral Change to Encourage Conservation ................................................................... 35
Encourage the Development and Use of Storage Technology ........................................................... 35
Focus Grid Improvements on System Stability, Reliability and Affordability ..................................... 35
Retire more Renewable Energy Credits in State ................................................................................. 35
Increase the Number of Renewable Energy Generation Facilities ..................................................... 36
Embrace Enhanced Energy Planning as defined in Act 174 ................................................................ 36
Electricity Goals, Strategies and Actions ................................................................................................. 36

Draft 10/5/16
5 | P a g e
5. Renewable Energy Generation ........................................................................................................... 38
Renewable Energy in the TRORC Region ............................................................................................ 38
Solar .................................................................................................................................................... 38
Wind .................................................................................................................................................... 40
Hydro ................................................................................................................................................... 41
Biomass ............................................................................................................................................... 41
Certificate of Public Good (CPG) ......................................................................................................... 43
Challenges ............................................................................................................................................... 43
Solar Siting .......................................................................................................................................... 43
Wind Siting .......................................................................................................................................... 44
Hydro Siting ......................................................................................................................................... 44
CPG Process is Complicated ................................................................................................................ 44
Unclear Regulatory Guidance ............................................................................................................. 45
Solutions ................................................................................................................................................. 45
Improve Regional and Municipal Energy Planning for Renewable Energy ......................................... 45
Support Legislative Changes that Reward Good Planning .................................................................. 46
Renewable Energy Generation Goals, Strategies and Actions ............................................................... 46
6. Commercial-Scale Renewable Energy Facility Siting Guide ................................................................ 48
Background ......................................................................................................................................... 48
Barriers to Good Planning ................................................................................................................... 49
Important Considerations ................................................................................................................... 49
How to Effectively Plan for Renewable Energy Generation Facilities..................................................... 51
Consider CEP Generation Targets ....................................................................................................... 51
Utilize Available Map Data .................................................................................................................. 51
Identify Preferred Locations ............................................................................................................... 51
Identify Significant Natural, Cultural, Historic or Scenic Resources ................................................... 52
Involve the Public ................................................................................................................................ 53
Find a Balance ..................................................................................................................................... 53
Bring it together .................................................................................................................................. 53
7. Appendices .......................................................................................................................................... 54
Draft 10/5/16
6 | P a g e
1. Introduction
Background In 2011, the State of Vermont released a significantly revised Comprehensive Energy Plan (CEP). By law, the CEP is intended to address Vermont’s energy future for electricity, thermal energy, transportation and land use. The 2011 Plan represented a substantial change in approach to energy in Vermont, by setting a very significant set of goals for the state, most notably: to transition the state’s energy use from 75% fossil fuels to 90% renewable. While the 2011 Plan included many goals and policies intended to reach the proposed goals, many of the Plan’s suggested actions were preliminary in nature, directing the state to “investigate” or “explore” potential strategies. The 2011 Plan acknowledged the nexus between reductions in statewide energy use and land use, by setting a goal to “coordinate energy and land use planning.”1 The challenge with such a comprehensive plan is determining the best path to implementation. Since 2011, a significant amount of study and analysis has been done to further inform the question of “how” to achieve the goals of the CEP. Beginning in 2013, the Public Service Department (DPS) conducted the Total Energy Study (TES), which reviewed the technologies and policies that might achieve Vermont’s greenhouse gas and renewable energy goals. The 2016 revision of the Comprehensive Energy Plan further refined the goals, policies and strategies of the 2011 CEP. Between revisions, progress has indeed been made toward addressing “how” to achieve the goals, but it is recognized that to do so will require “significant changes in energy policy, fuel supply, infrastructure and technology.”2
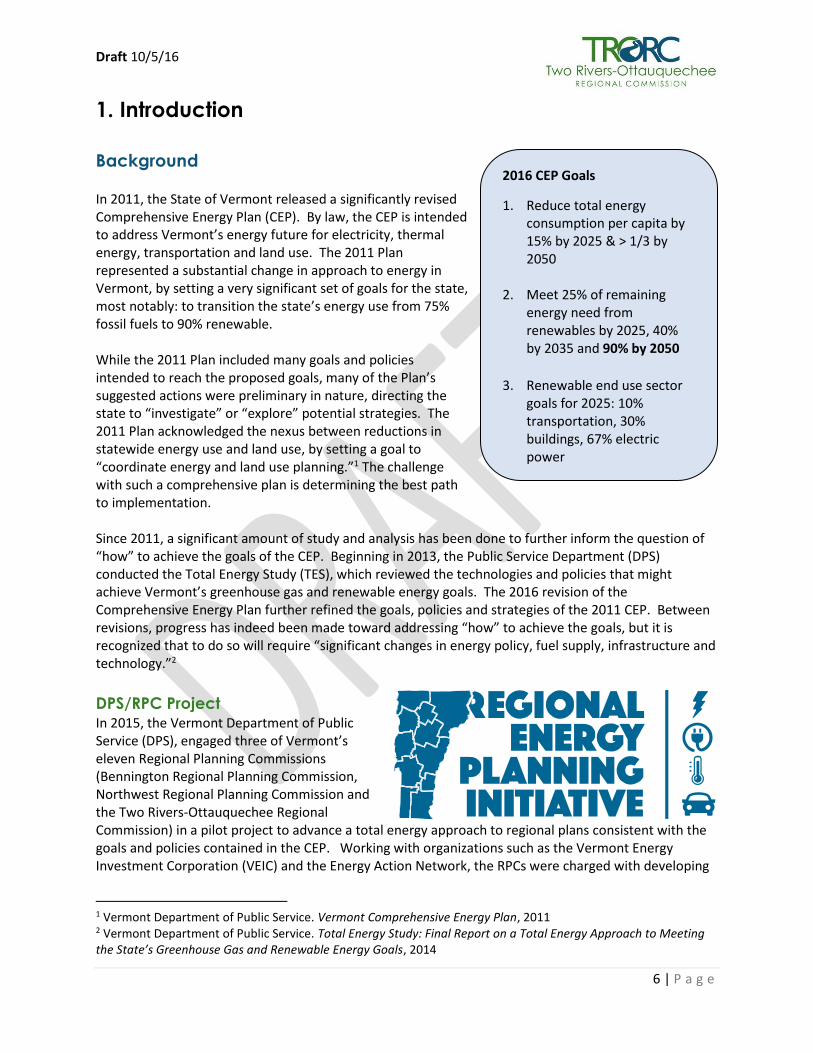
DPS/RPC Project In 2015, the Vermont Department of Public Service (DPS), engaged three of Vermont’s eleven Regional Planning Commissions (Bennington Regional Planning Commission, Northwest Regional Planning Commission and the Two Rivers-Ottauquechee Regional Commission) in a pilot project to advance a total energy approach to regional plans consistent with the goals and policies contained in the CEP. Working with organizations such as the Vermont Energy Investment Corporation (VEIC) and the Energy Action Network, the RPCs were charged with developing
1 Vermont Department of Public Service. Vermont Comprehensive Energy Plan, 2011 2 Vermont Department of Public Service. Total Energy Study: Final Report on a Total Energy Approach to Meeting the State’s Greenhouse Gas and Renewable Energy Goals, 2014
2016 CEP Goals
1. Reduce total energy consumption per capita by 15% by 2025 & > 1/3 by 2050
2. Meet 25% of remaining energy need from renewables by 2025, 40% by 2035 and 90% by 2050
3. Renewable end use sector goals for 2025: 10% transportation, 30% buildings, 67% electric power

Draft 10/5/16
7 | P a g e
a model pathway to 90% renewable energy within their respective regions, identifying regional goals and actions relating to heating, transportation and electric power. These plans would also include a mapping component which identifies areas suitable to different kinds of renewable energy generation.
Summary of Data Collection and Analysis The Total Energy Study (TES) provided the basis for the data modeling that was used in this Plan. The TES initially proposed three possible models as part of their review:
Business as Usual – This model was calibrated to mimic Vermont’s current energy policy, serving to act as a baseline and to show the results of no significant policy changes. While the total amount of energy use in VT would decrease slightly by 2050, it would not meet the state’s energy goals.
Carbon Tax Shift – This model tested the implementation of a revenue-neutral tax on greenhouse gasses emitted from energy resources across all sectors, offset by a corresponding tax reduction or rebate in other areas of the economy. Due to its direct focus on carbon reduction, the carbon tax shift scenarios were able to meet statewide greenhouse gas emission goals, but were not able to achieve the 90% renewable by 2050 target.
Total Renewable and Energy Efficiency Standards (TREES) – This model allocates shares of total energy consumption derived from either renewable energy or improved efficiency over a specified period of time. The TREES policy was ultimately able to meet the 2050 renewable energy goal and was determined to far exceed the 2050 carbon reduction goal.
For the purposes of this project, the Vermont Energy Investment Corp adapted
the Total Energy Study’s TREES scenarios (for more information, see Appendix
A). Using this scenario, VEIC created and revised a model of the demand and
supply of total energy in Vermont. Historic information was primarily drawn
from the Public Service Department’s Utility Facts 2013 and Energy
Information Administration (EIA) data. Projections came from the Total Energy
Study (TES), the utilities’ Committed Supply, and stakeholder input. Assumptions and specific data
sources include:
The population is assumed to grow at 0.35% per year.3 People per house are assumed to
decrease from 2.4 in 2010 to 2.17 in 2050. This supplies the number of households used in the
model as the basic unit for residential energy consumption.
The commercial demand driver was area of commercial buildings. Commercial building data and
projections were extracted from inputs in the TES.
Industrial energy use was entered as the actual totals for each energy type, without a driver
specified in the model.
Transportation energy use is based on projections of vehicle miles traveled (VMT). VMT peaked
in 2006 and has since declined slightly. Given this, and Vermont’s efforts to concentrate
development and to support alternatives to single occupant vehicles, VMT is assumed in the
model to remain flat while population and economic activity grow slightly. VMT county totals
are supplied from the Vermont Agency of Transportation (VTrans).
3 Jones, Ken, and Lilly Schwarz, Vermont Population Projections-2010-2030, August, 2013. http://dail.vermont.gov/dail-publications/publications-general-reports/vt-population-projections-2010-2030.
Draft 10/5/16
8 | P a g e
There will be reductions in energy use due to changes in technology, including building shell and
device efficiency improvements.
Using these data and related
assumptions, VEIC conducted an
analysis using the Long Range Energy
Planning System (LEAP). Designed by
the Stockholm Environment Institute,
LEAP is a software tool for energy
policy analysis and climate change
mitigation assessment. Intended as a
medium- to long-term modeling tool,
LEAP was chosen for data assessment
in relation to the goals of the CEP. The
LEAP model is based primarily on
energy demand.
The final outcome of VEIC’s efforts is
one scenario by which the state, on a
regional level, could achieve the goals
of the Comprehensive Energy Plan.
This data provides the basis for the
strategies described in this Plan.
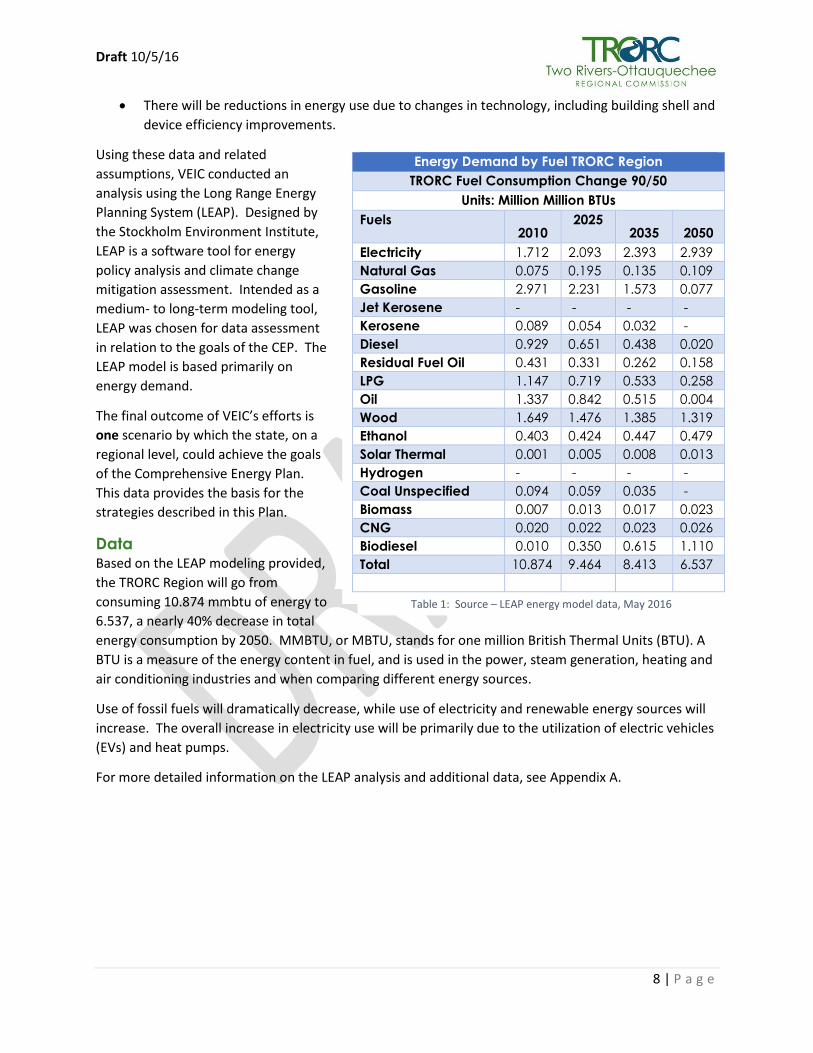
Data Based on the LEAP modeling provided,
the TRORC Region will go from
consuming 10.874 mmbtu of energy to
6.537, a nearly 40% decrease in total
energy consumption by 2050. MMBTU, or MBTU, stands for one million British Thermal Units (BTU). A
BTU is a measure of the energy content in fuel, and is used in the power, steam generation, heating and
air conditioning industries and when comparing different energy sources.
Use of fossil fuels will dramatically decrease, while use of electricity and renewable energy sources will
increase. The overall increase in electricity use will be primarily due to the utilization of electric vehicles
(EVs) and heat pumps.
For more detailed information on the LEAP analysis and additional data, see Appendix A.
Energy Demand by Fuel TRORC Region
TRORC Fuel Consumption Change 90/50
Units: Million Million BTUs
Fuels 2010
2025 2035 2050
Electricity 1.712 2.093 2.393 2.939
Natural Gas 0.075 0.195 0.135 0.109
Gasoline 2.971 2.231 1.573 0.077
Jet Kerosene - - - -
Kerosene 0.089 0.054 0.032 -
Diesel 0.929 0.651 0.438 0.020
Residual Fuel Oil 0.431 0.331 0.262 0.158
LPG 1.147 0.719 0.533 0.258
Oil 1.337 0.842 0.515 0.004
Wood 1.649 1.476 1.385 1.319
Ethanol 0.403 0.424 0.447 0.479
Solar Thermal 0.001 0.005 0.008 0.013
Hydrogen - - - -
Coal Unspecified 0.094 0.059 0.035 -
Biomass 0.007 0.013 0.017 0.023
CNG 0.020 0.022 0.023 0.026
Biodiesel 0.010 0.350 0.615 1.110
Total 10.874 9.464 8.413 6.537
Table 1: Source – LEAP energy model data, May 2016

Draft 10/5/16
9 | P a g e
Key Issues
While the energy goals established in statute and further refined in the VT Comprehensive Energy Plan
provide this plan with clear and specific guidance as to “where we need to go” as a region to improve
our energy future, it is more important to understand why these goals were created. The “why” behind
the goals (and the development of this Plan) can be explained by looking at three different motivations
that are important regionally and statewide: environmental protection, energy security, and economic
needs and opportunities.
Environmental Protection Our reliance on fossil fuels over the past two centuries has had a profound and enduring impact on air
quality, water quality, and climate. The impacts on climate, the global warming that has resulted from
the rapid release of billions of tons of carbon that had been locked in solid and liquid fossil fuels, has
been well-documented. The worldwide impacts of climate change—destruction of ecosystems, sea level
rise that threatens millions of homes, farms, and businesses, greater frequency and intensity of drought
and severe storms—already are being observed and every effort needs to be made, locally and globally,
to limit future damage and adapt to a changing reality. In Vermont (and in the Region), climate change
has the potential to alter the composition of our forests, affect the viability of the tourism economy, and
result in more damaging tropical storms, floods, and other severe events.
Other forms of pollution from fossil fuel combustion (e.g., smog, acid rain) also damage natural
ecosystems, adversely affect human health, and cause economic damage. If the region’s energy does
not come from clean renewable energy sources, it is coming from fossil fuel combustion or nuclear, that
pose risks and causes environmental damage where the fuel is mined and processed as well as where it
is used to generate electricity. Although local energy generation siting concerns are real and are
addressed in Sections 5 and 6 of this Plan, the environmental impacts of obtaining electricity from wind
turbines on a Vermont ridgeline or from solar panels along a Vermont roadway should be considered in
the context of the impacts of strip mining, wholesale removal of mountains, hydraulic fracturing, and
acid runoff from coal mining in other states.
Environmental protection and a desire to reduce Vermont’s impact on climate change was the impetus
for the development of the Vermont Comprehensive Energy Plan. These targets are fundamentally
designed to reduce our contribution to greenhouse gas emissions.
Energy Security The TRORC Region, like Vermont, is reliant upon other states and countries for much of our energy
needs. Our region’s dependence on fossil fuels is significant. The primary use of these fuels is for space
heating, transportation and generation of electricity (although Vermont obtains a significant share of its
electricity from hydroelectric and nuclear facilities and relatively little from coal powered generators).
According to the US Energy Information Administration, nearly 3/5 of all Vermont households use fuel
oil. In the TRORC Region, roughly 13,000 households rely on oil for heating4, which means a substantial
portion of the Region is subject to the price and availability instabilities of a reliance on oil. Of the total
885 million dollars spent on residential energy in the state of Vermont, just over 50% ($445.8 million)
4 U.S. Energy Information Administration, 2014

Draft 10/5/16
10 | P a g e
were spent on fuel oil, kerosene or light propane gas.5 Vermont’s economic system is so closely tied to
the availability of fossil fuels that even modest price increases can lead to a slowdown in economic
growth and monetary instability. This can have unanticipated adverse impacts at the Regional,
municipal, and residential level. For example, increasing fuel prices make it more expensive for a town
government to provide traditional public services and maintain existing facilities. Or, rising prices can
make it difficult for residents to heat their homes and put enough food on the table (the price and
availability of food is usually influenced by fuel prices).
Where the Region’s energy is generated is also a concern. Vermont currently obtains much of its
electricity from hydroelectric facilities located out of state, primarily Quebec. While these sources of
electricity currently provide the region with low-cost, renewable generation, the prospective
construction of high capacity transmission lines from Quebec to southern New England may create
increased competition for electricity between Vermont with other states that are seeking electricity
from renewable sources. Reducing the Region’s reliance on imported energy, or at least maintaining the
same amount of electrical use from sources located outside Vermont, will certainly make the state and
region more energy secure, especially in a future where electricity demand is anticipated to almost
double by 2050 as the use of fossil fuels is significantly decreased.
It is possible to have a state and region that is more self-reliant for its energy needs. By utilizing the
resources that exist in-state and in-region, long term security concerns about energy supply and energy
costs can be decreased.
Economic Needs and Opportunities Our modern economy and lifestyle has been made possible through the use of vast amounts of solar energy stored as fossil fuels. Because a majority of the most readily extractable energy from these sources has been consumed in just over 100 years, and the cost and difficulty of obtaining these resources will increase over time, we will have to adapt our economy and lifestyle in a manner that relies on energy conservation and use of renewable sources of energy. These changes actually represent extraordinary opportunities for economic growth and prosperity if quick and decisive action is taken. Vermont spends over $2.7 billion and the TRORC Region approximately $160 million on energy each year, with the vast majority of those dollars exported to out-of-state. This Plan, like Vermont’s 2016 Comprehensive Energy Plan, states that overall energy consumption will need to decline by about one-third by 2050 to meet our energy goals. That reduction can be accomplished through changes in land use patterns and the transportation system (reducing the need for driving and by introducing more energy-efficient vehicle technologies), through extensive building weatherization and use of more efficient heating and cooling systems, and through continued efforts at energy conservation. Those changes will reduce the outflow of money from the region and state, so that millions of dollars of additional wealth will be retained annually to circulate in local economies, supporting employment, social services, and improving the quality of life of the resident population. Moreover, the changes needed to reduce our energy demand and to produce local renewable energy offer a wide array of business and employment opportunities.
5 U.S. Energy Information Administration, 2014

Draft 10/5/16
11 | P a g e
Weatherization of buildings, installation and servicing of new heating systems, procurement and delivery of alternative fuels such as wood pellets and cord wood, and construction and servicing local renewable energy generation facilities offer new jobs and business development opportunities as well as opportunities for existing fossil fuel based businesses to diversify using their existing capacity and customer networks. Economic growth in the renewable energy sector has been robust over the past five years. Statewide, there has been a roughly 20% growth in clean energy employment sectors overall6. In 2016, 6% of Vermont’s total jobs were in the clean energy sector.
The Growing Importance of Electricity Electricity is an essential part of our everyday lives and is critical to the vitality of the regional economy. Vermont receives its electricity primarily from imported sources since the closing of the Vermont Yankee nuclear power plant. Much of this imported electricity derives from renewable hydroelectricity generated in Canada, with the balance from a mix of generating facilities in the northeast and from a growing supply of small and medium sized renewable (hydro, wind, solar, and biomass) in-state sources. The demand for electricity across residential, commercial, and industrial sectors grew rapidly during the second half of the 20th century, but has leveled off in recent years. It is apparent that a variety of aggressive energy conservation programs implemented through the state’s energy efficiency utility, Efficiency Vermont, contributed to slowing the growth of electric demand. The need for conservation and efficiency improvements in the use of electricity will continue, and be amplified by the likelihood that demand for electricity is expected to increase steadily once again as the energy it carries replaces fossil fuels for transportation, mechanical, and space-heating needs. Electricity provides the most viable path toward meeting the state’s energy goals in several key areas. Electrification of the passenger vehicle fleet, for example, will dramatically reduce energy use in the transportation sector through use of more efficient drive systems, and the energy that is used can be obtained from renewable sources. Similarly, the easiest transformation in space heating of existing residential buildings often is to weatherize the structure and install highly efficient (electrically driven) air source heat pumps. To accommodate the projected 70% increase in statewide demand (by 2050) for electricity resulting from these changes is to increase imports of renewably generated electricity and significantly expand in-state generation from renewable sources while continuing to pursue conservation and efficiency improvements.
Plan Focus In order to implement the state’s energy targets, to achieve the significant reductions outlined by the
LEAP scenario, and to address the key issues identified above, this Plan will focus on strategies in four
areas of energy transformation.
Thermal Efficiency and Alternative Heating Systems – Due to the age of Vermont’s housing
stock (see Chapter 2, Thermal Energy Challenges), potential gains from improvements to the
thermal efficiency of our homes and businesses are substantial. Eighty percent of residential
energy use is dedicated to space heating and domestic hot water.
Transportation System Changes and Land Use Strategies – Vermont, because of its rural nature,
is very vehicle-reliant. The pattern of development that has been cultivated since the
6 BW Research Partnership, Vermont Clean Energy 2016 Industry Report

Draft 10/5/16
12 | P a g e
development of the automobile has resulted in a significant portion of our overall energy use
(34%) being dedicated to transportation. While the use of electric vehicles will help meet the
goals of the CEP, we will also need to reevaluate where we live and work in order to reduce
travel.
Energy Conservation and Efficiency of Delivery and End Use – Demand-Side Management is the
best and lowest-cost option to meet expected demand. Encouraging the installation of energy
efficient devices or equipment that will perform work using less energy is essential to reducing
our overall energy use. Proper load management can also help reduce demand during peak
hours. Demand response techniques can include time of use rates, smart rates and energy use
feedback. Changing our individual energy use behavior to embrace conservation is an important
component of meeting the goals of the CEP.
Mapping Energy Generation Resources and Constraints – Energy generated by renewable
resources is the cornerstone of the CEP. In order to achieve 90% renewable by 2050, we will
need to identify where the potential for renewable energy generation exists and balance the
need for increased capacity with Vermont’s landscape and the desires of our communities.
Life of the Plan As with all policy documents, this Regional Energy Implementation Plan will require review and revision
over time. It is important to recognize that there will be new data, new technological advances and
possible changes in state and Federal energy policy that will need to be considered and incorporated
into the Plan. With each action item that is completed, there will likely be more that should be included
as we continue to work toward the goals of the CEP at the regional level.
The primary purpose of this Plan is to identify possible paths to implementing the state’s
Comprehensive Energy Plan at the regional level. Should the goals of the CEP change, this Plan will
likewise need to be changed.

Draft 10/5/16
13 | P a g e
2. Thermal Efficiency and Alternative Heating Systems7
Background According to the 2016 Comprehensive Energy Plan, 28% of
energy demand in Vermont is associated with heating fuels.
The reliance on heating from non-renewable sources (fuel oil,
natural gas and propane) creates a challenge for Vermonters
that extends beyond energy issues. Residents who are
considered “low-income” find it challenging to stay
comfortable in their own homes due to fuel costs. In 2010,
Vermont ranked 44th out of 50 states for energy affordability.8
In 2010, low-income Vermonters spent an average of $1,870
more per family, per year, on energy bills than is considered
affordable.9
The 2013 Thermal Efficiency Task Force’s Report to the General Assembly, notes that “Investing in
thermal efficiency improvements – primarily air sealing, insulation, and heating system replacements –
can dramatically reduce heating energy use in a building. At current fuel prices, thermal efficiency
investments in a home can bring savings of approximately $1,000 per year over the lifetime of the
investment. The value of these savings increases as fuel prices rise.”10 Converting to more efficient
heating and improving thermal efficiency, will have the effect of reducing financial impacts on low-
income communities and moving the Region toward 90% renewable energy by 2050.
The CEP supports Vermont’s thermal efficiency goals, which were established in 2007 and 2008 under
Act 92 (10 V.S.A. § 581):
Improve 20% of housing by 2017 (more than 60,000 units), and improve 25% of housing by 2020
(about 80,000 units).
Reduce fuel needs by 25% in building units served.
Reduce fossil fuel consumption across all buildings by 0.5% per year, leading to reductions of 6%
by 2017 and 10% by 2025.
Save $1.5 billion on fuel bills through improvements installed between 2008 and 2017.
The CEP promotes efficiency and conservation as top priorities in all energy sectors. In 2011 it
recommended creating a whole-buildings efficiency road map—including program delivery, consumer
7 Much of the content in this chapter was originally introduced in the 2015 East Central Vermont: What We Want plan. 8 Marianne Tyrell, Rebecca Wigg, and Colin Hagan. Financing Residential Energy Efficiently in Vermont, Institute for Energy and the Environment, Vermont Law School, July 2011 9 Thermal Efficiency Task Force, A Report to the Vermont General Assembly: Meeting the Thermal Efficiency Goals for Vermont Buildings, 2013 10 Ibid.
“Vermont is the second
most petroleum
dependent state in the
country due to its high use
of heating oil.”
Northeast Biomass Thermal Working Group

Draft 10/5/16
14 | P a g e
outreach, funding and finance mechanisms, and progress metrics—
by the end of 2012.11 This goal was not met, but the state has made
some progress on energy efficiency improvements. Retrofit
investments in thermal energy efficiency by Efficiency Vermont and
Vermont Gas have reduced energy demand in about 6,700 homes,
and investments in thermal efficiency for low-income households
eligible for weatherization assistance have reached more than
10,700 homes since 2008, equivalent to roughly $10 million in
annual savings.12 However, the current pace of weatherization
improvements will fail to meet the state’s goals.
New Construction New buildings will need to be built to a significantly higher standard
than is provided for by the State’s Residential and Commercial
Building Energy Code. Net zero constructed buildings are highly
efficient, save 30–45% on overall energy costs in comparison with
standard buildings.13 Efficiency Vermont’s 2015 Net Zero Energy
Feasibility Study, determined that that new construction of
residential and office net zero energy buildings is a cost effective
investment. These buildings cost less to own and operate than code buildings from the first year into the
long term. 14
How We Heat In addition to thermal efficiency improvements, the CEP is seeking
a statewide change in how we heat our buildings. This approach
will focus primarily on the installation of cold-climate heat pumps
which consume far less energy than electric resistance, propane,
or oil heating systems. In order to contribute to the state’s heat
pump installation target (35,000 installed statewide), a total of
3,47615 will need to be installed in the TRORC Region. Because
cold-climate heat pumps are inadequate during extreme sub-zero
days (-20 degrees F), homes will require a secondary heat source –
preferably one that utilizes some form of woody biomass (wood,
wood chip, wood pellet). Also worth considering are geothermal
or “ground source” heat pumps. These systems are substantially
more expensive than cold-climate heat pumps, but can result in
11 Vermont Public Service Department. “Facts, Analysis, and Recommendations.” Comprehensive Energy Plan 2011. Volume 2. (December 2011). 12 Riley Allen, Thermal Efficiency for Low-Income Households in Vermont: Economic Performance, Energy Justice and the Public Interest, RAP Energy Solutions, 2015 13 Efficiency Vermont, 2016 14 Efficiency Vermont, Net Zero Energy Feasibility Study, 2015 15 Heat pump installation targets for the Region were determined based on the percentage of Vermont’s total housing units that are located in the TRORC Region (over 9%).
Whole Building Approach
A whole building approach
looks at a building as a
system, and recognizes the
interaction of all its
components. Currently,
comprehensive state-funded
electric efficiency programs
are delivered through the
state energy efficiency
utilities, which are Efficiency
Vermont (EVT), Burlington
Electric Department (BED),
and Vermont Gas Systems
(VGS). (2016 CEP)
What is Net Zero?
A net zero energy building is
one that is optimally efficient
and, over the course of a
year, generates energy on-
site, using clean renewable
resources, in a quantity
equal to or greater than the
total amount of energy
consumed onsite.
Draft 10/5/16
15 | P a g e
significant energy savings. They are better suited to new development than retrofitting into existing
buildings due to the technology’s requirements.
While cold-climate and geothermal heat pumps will work for residences, they cannot adequately meet
the demands of some large industrial and commercial users. Thus, the CEP has recognized the need to
identify locations for district heating and combined heat and power.
There are barriers to reaching the CEP’s thermal efficiency goals. The purpose of this plan element is to
identify these barriers, and to provide solutions through policy and action steps that will effectively
remove these barriers when properly implemented.
Thermal Energy Challenges
Aging Building Stock Residential houses constitute the majority of
Vermont’s built environment. Residential energy
represents 30% of Vermont’s total energy
consumption (second only to transportation), with
heating being the largest energy consumer.16
Vermont’s climate demands heating. In Orange
and Windsor counties, 47% of homes were built
before 1970.17 These older homes were
constructed before high energy costs made
energy conservation practices a priority in the
built environment. As a result, a substantial
number of homes utilize wasteful amounts of
energy and are expensive to maintain. According
to the Massachusetts Zero Net Energy Buildings
Task Force: “With buildings contributing close to
40 percent of greenhouse gas emissions18 and
consuming 40 percent of energy in the United
States, energy efficiency and renewable energy
technologies must become central to the way we
16 U.S. Energy Information Administration. Vermont Profile Overview. Independent Statistics & Analysis. (July 2012). 17 Leslie Black-Plumeau and Maura Collins, Housing needs in East Central Vermont, Vermont Housing and Finance Agency, (October 2013) 18 Greenhouse gases help capture and maintain the temperature of the Earth’s surface. They include water vapor, carbon dioxide, methane, nitrous oxide, and a variety of manufactured chemicals. Some are emitted from natural sources; others are a result of human activities. Over the past several decades, rising concentrations of greenhouse gases have been detected in the Earth’s atmosphere, which leads to an increase in the average temperature of the Earth’s surface.
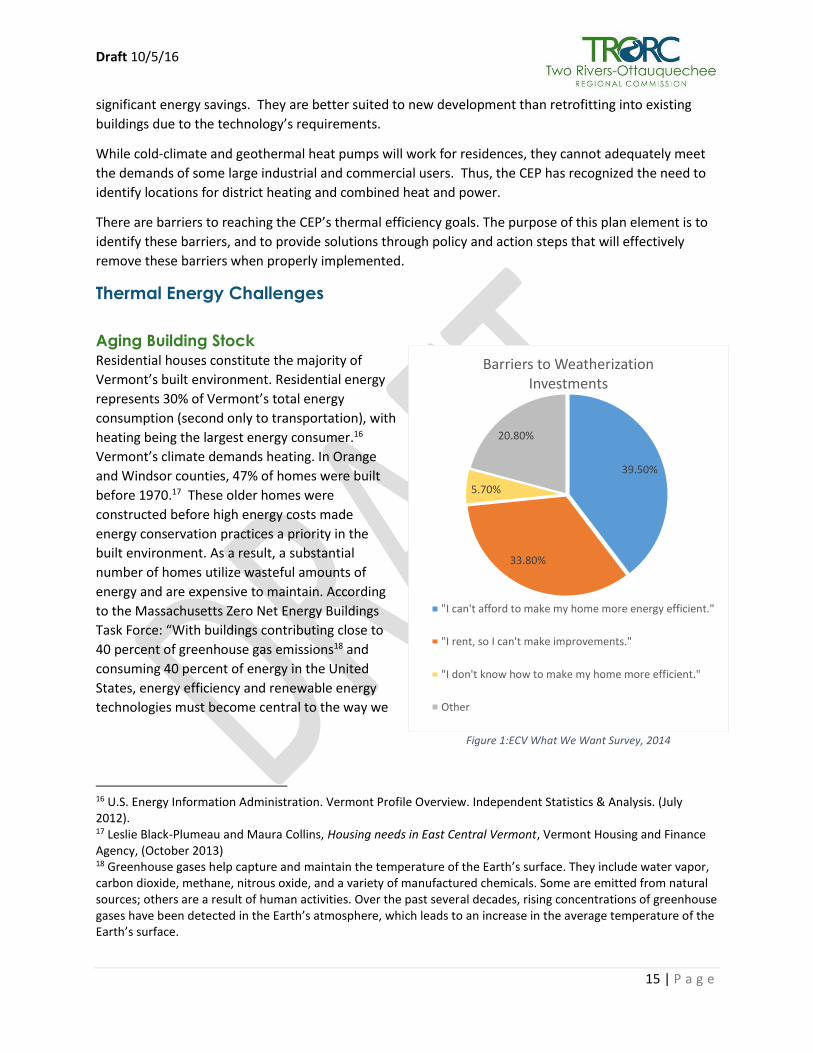
39.50%
33.80%
5.70%
20.80%
Barriers to Weatherization Investments
"I can't afford to make my home more energy efficient."
"I rent, so I can't make improvements."
"I don't know how to make my home more efficient."
Other
Figure 1:ECV What We Want Survey, 2014

Draft 10/5/16
16 | P a g e
design and build.”19
In the TRORC Region, it is estimated that only 4.58% of houses built before 2000 have been weatherized.
To achieve the state’s goal of 25% of homes, a total of 6,477 of the region’s housing units will need to be
weatherized by 2020.
Larger Homes By and large, new homes have grown in size over the past 40 years. In 1973, the average home in the
Northeast was roughly 1700 square feet. In 2014, the size of homes in the Northeast had increased by
60% to 2600 square feet.20 While homes are generally more efficient than in the past, more square
footage requires more heating.
Cost of Improvements The up-front cost of energy efficiency improvements and building-scale renewable energy generation
remains a challenge. Despite the demonstrated long-term savings benefits, the capital needed to
significantly reduce energy consumption and add renewables can be a significant barrier to
implementation. When surveyed as part of the East Central Vermont Sustainability Project, 39.5% of
those who responded indicated that they could not afford to make their home more energy efficient.
Another 33.8% were unable to make energy efficiency improvements because they rent instead of own.
This is an issue for all homeowners, but especially for low- and moderate-income homeowners, since
cost is a social equity issue that transcends the spectrum of energy use. At the commercial and public
sector levels, capital and operating budgets are often set independently of each other. There is no
opportunity to use the savings from operations to defray capital investments, thus removing the
incentive to implement energy improvements.
Lags in deploying Energy Efficiency Standards The owners of the region’s buildings (both new and old structures) must be guided toward the goal of
net zero energy use. The state code is modeled after the International Energy Conservation Code
(IECC)21 for both commercial and residential buildings. Vermont was the first state to adopt the IECC
2015, in March 2015, but the state has often found it problematic to immediately adopt the new energy
codes because the U.S. Department of Energy often lags in completing the necessary support software
upgrades for programs contractors use to track energy improvements. Net zero energy use cannot be
achieved using current efficiency standards.
The system Vermont uses to track adherence to the Residential Building Energy Standards is a challenge.
Currently, there are no state code officials or state permits for energy efficiency. Energy efficiency is
self-certified by the building contractor, with a requirement that a completed certificate be submitted to
the municipality in which they are building. However, many communities are unaware of this
requirement and have no way to track the submission of certificates. Towns with local code officials
may enforce energy efficiency codes and towns with Certificate of Occupancy (COO) requirements must
19 Massachusetts Zero Net Energy Buildings Task Force. Getting to Zero: Final Report of the Massachusetts Zero Net Energy Buildings Task Force. (March 11, 2009). 20 U.S. Census Bureau 21 Introduced in 1998, the IECC addresses energy efficiency on several fronts including cost savings, reduced energy usage, conservation of natural resources, and the impact of energy usage on the environment.

Draft 10/5/16
17 | P a g e
receive an Energy Code certificate before issuing the COO. Nearly two thirds of TRORCs communities
(19) have zoning bylaws, but just under half (9) of them require a COO.
To move toward net zero energy use in the built environment, the code must be substantially improved
and enforced and contractors and owners must be educated about the code’s existence and purpose.
Inadequate Understanding of Programs, Costs and Methods When surveyed as part of the East Central Vermont Sustainability Project, just over 50% of the respondents indicated that their house was energy efficient. Vermont has an extensive network of organizations with significant experience in energy efficiency services and programs, and this expertise puts our region in a good position to improve thermal efficiency and reduce building energy consumption. This provider diversity can also be a challenge to the average homeowner, who may feel overwhelmed by the multitude of options. Likewise, service providers may find it challenging to know what assistance, incentives or programs are available, and their customers may not know who to contact to take advantage of them. Every improvement project is different. It can be challenging for the layperson to incorporate renewable energy and energy efficiency since these services are generally not offered by the same companies. In addition, poorly prioritized improvements can result in unnecessary expenditures. The prioritization of investments is vital to ensuring where residents can get the best return on their investments. Heat pumps can initially be more expensive than conventional furnaces to install, but can lead to a significant reduction in use of heating fuels, particularly when paired with wood heat. Installing a heat pump without adequately weatherizing the shell of a home, however, may yield a net loss. Weatherization should always be completed prior to, or in tandem with, the installation of a more efficient heating system.
Thermal Energy Strategies
Support Increased Funding With cost being a significant barrier to the implementation of thermal efficiency and renewable energy improvements, it will be essential that programs that provide funding and financing are encouraged to grow. In particular, programs providing assistance to middle and low-income households must increase in funding. Current financing programs include:
1. Vermont’s Heat Saver Loan: http://heatsaverloan.vermont.gov/
2. Property Assessed Clean Energy (PACE) - available for towns that have adopted a PACE district. Repayment of PACE financing is tied to the property, not to the owner.
3. Neigborworks of Western Vermont Energy Loan: https://www.nwwvt.org/energy-loan/
4. Vermont State Employees Credit Union VGreen Energy Savings Solutions loans: https://www.vsecu.com/energy-savings/about/about-vgreen/what-is-vgreen
Tier 3 Utility Requirements
(Act 56)
Utilities are required to
reduce fossil fuel
consumption as a
percentage of their retail
electric sales. Eligible
projects include heat pumps,
weatherization and the
installation of electric vehicle
infrastructure.
Draft 10/5/16
18 | P a g e
5. Vermont Economic Development Authority offers energy loans to commercial enterprises http://www.veda.org/financing-options/vermont-commercial-financing/commercial-energy-loan-program/ and small business http://www.veda.org/financing-options/vermont-commercial-financing/small-business-energy-loan-program/
These financing programs offer key features such as: great interest rates and terms, flexible terms, and ease of application. The loans can also be combined with Efficiency Vermont incentives. While fuel assistance programs are essential, increased funding to Vermont’s Weatherization Assistance Program (WAP) is needed. Projects such as the Vermont Fuel Efficiency Partnership which provides “deep-energy” retrofits in multi-family buildings whose tenants are income-eligible for the WAP must be encouraged and supported. Fuel distributors must be encouraged to become Energy Service Providers, expanding what they offer so that more homes can be weatherized and energy efficiency increased. TRORC can support these programs and initiatives by communicating directly with energy providers, state agencies and the legislature. We can provide input on state level initiatives and we can, if the opportunity presents itself, pursue federal funding to support these programs within our region.
Support the implementation of the Vermont Energy Code Compliance Plan and
increased Energy Efficiency Standards The DPS has outlined a pathway to increased energy code compliance in a Plan developed in 2012. The state needs to follow this plan. Concurrently, the state needs to continue to move quickly to adopt the International Energy Conservation Code as it is updated, for both commercial and residential buildings. Standards for achieving net-zero design must be incorporated. Some regional builders such as Prudent Living’s Southscape community (http://southscapewilder.com/) and VERMOD (http://vermodhomes.com/) are currently constructing net zero possible homes. TRORC can assist communities with continued outreach regarding code compliance. We can also support the DPS as they move forward on adoption of more energy efficient codes.
Provide Outreach, Coordination and Education TRORC can provide education and outreach to our communities, and support other statewide programs for weatherization and thermal efficiency. TRORC can promote the work of community action agencies and energy service providers. As a regional entity that works with municipalities, TRORC has a broad network of state and local connections. If adequate funding was available, TRORC could develop a staff position that would focus specifically on energy assistance, education and outreach. Without duplicating existing services, such as those that Efficiency Vermont and GMP offer, a TRORC Energy Planner could act as a clearinghouse of energy information for our communities. Through education and outreach at the municipal level, TRORC could ensure that our residents were aware of the opportunities available to them. We could work closely with active municipal Energy Committees and Energy Coordinators to continually update them on new programs, policies or financing mechanisms for weatherization assistance or alternative heating improvements. Ideally, a Regional Energy Planner would have a basis of knowledge grounded in implementation, so that this staff person would have experience directly related to the installation and implementation of
Draft 10/5/16
19 | P a g e
thermal efficiency and renewable energy improvements. This skillset would be particularly valuable in working with builders and energy service providers to help educate them about their customer’s needs, but would also provide homeowners with an independent voice that would help them understand weatherization and other energy efficiency options. Acting as a bridge between state-level service providers, contractors and municipal organizations, TRORC would effectively move the region toward meeting the CEPs goals relating to Thermal Efficiency.
Thermal Energy Goals, Strategies and Actions
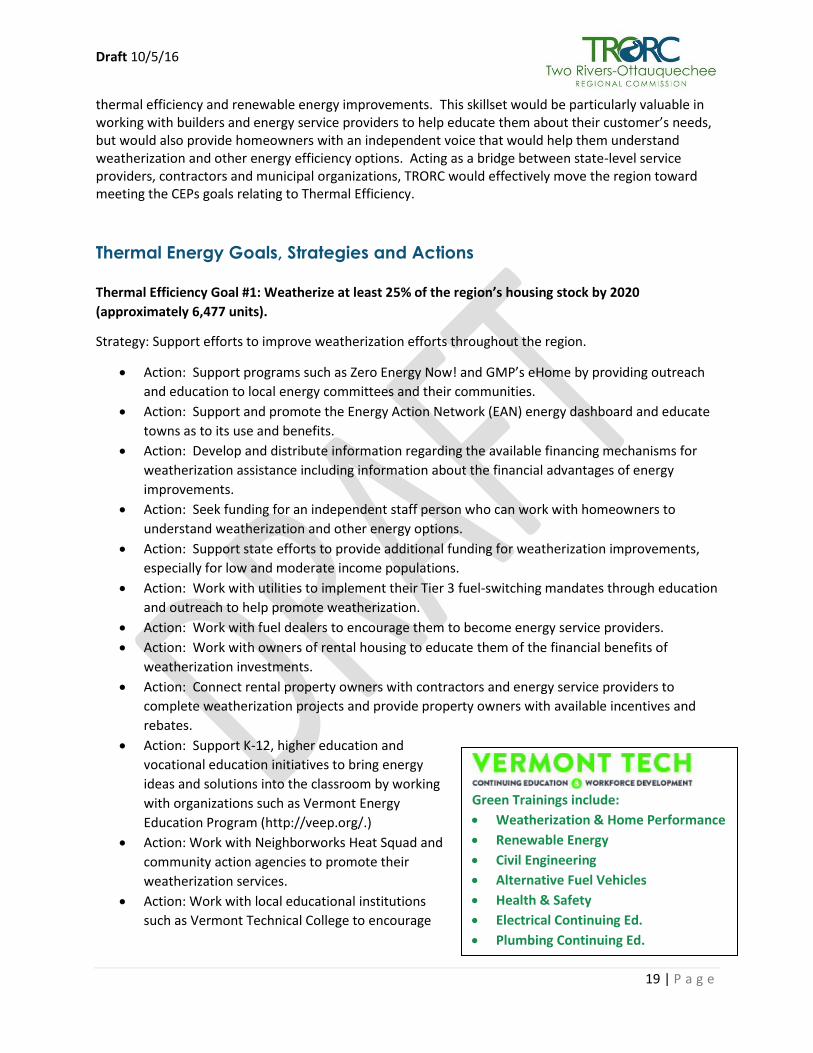
Thermal Efficiency Goal #1: Weatherize at least 25% of the region’s housing stock by 2020
(approximately 6,477 units).
Strategy: Support efforts to improve weatherization efforts throughout the region.
Action: Support programs such as Zero Energy Now! and GMP’s eHome by providing outreach
and education to local energy committees and their communities.
Action: Support and promote the Energy Action Network (EAN) energy dashboard and educate
towns as to its use and benefits.
Action: Develop and distribute information regarding the available financing mechanisms for
weatherization assistance including information about the financial advantages of energy
improvements.
Action: Seek funding for an independent staff person who can work with homeowners to
understand weatherization and other energy options.
Action: Support state efforts to provide additional funding for weatherization improvements,
especially for low and moderate income populations.
Action: Work with utilities to implement their Tier 3 fuel-switching mandates through education
and outreach to help promote weatherization.
Action: Work with fuel dealers to encourage them to become energy service providers.
Action: Work with owners of rental housing to educate them of the financial benefits of
weatherization investments.
Action: Connect rental property owners with contractors and energy service providers to
complete weatherization projects and provide property owners with available incentives and
rebates.
Action: Support K-12, higher education and
vocational education initiatives to bring energy
ideas and solutions into the classroom by working
with organizations such as Vermont Energy
Education Program (http://veep.org/.)
Action: Work with Neighborworks Heat Squad and
community action agencies to promote their
weatherization services.
Action: Work with local educational institutions
such as Vermont Technical College to encourage
Green Trainings include:
Weatherization & Home Performance
Renewable Energy
Civil Engineering
Alternative Fuel Vehicles
Health & Safety
Electrical Continuing Ed.
Plumbing Continuing Ed.

Draft 10/5/16
20 | P a g e
continued technical training related to energy efficiency improvements.
Thermal Efficiency Goal#2: 30% of new buildings built to net zero by 2020, 100% by 2030.
Strategy: Support net zero energy construction throughout the region.
Action: Support Net-Zero building programs by providing outreach and education to local
energy committees and their communities.
Action: Provide outreach to towns and contractors on the use and enforcement of residential
and commercial building energy standards for all new construction.
Action: Support statewide efforts to increase energy efficiency code standards and statewide
energy code enforcement by communicating regional concerns about enforcement with the
legislature, and encouraging communities that have zoning to include a Certificate of Occupancy
when they revise their regulations if they do not already have one. Provide outreach to
communities with a COO to ensure that they are tracking submission of the RBES certificate.
Thermal Efficiency Goal #3: Install 3,500 efficient22 cold climate heat pumps by 2050.
Strategy: Support a regional shift away from fossil fuel as a source of heat.
Action: Partner with Efficiency Vermont, Green Mountain Power and others to identify and
promote cold climate heat pumps. Develop outreach materials and public meetings.
Action: Seek incentive funding through Renewable Energy Standards Act “Tier 3” resources.
Action: Coordinate all outreach efforts with fuel dealers and electrical contractors (potentially
creating opportunities for electrical contractors to work with fuel dealers).
Action: Provide communities with an analysis of potential areas that are suitable for ground
source heat pumps when data is available.
Action: Provide information to builders and developers regarding the benefits of geothermal
systems (including heat pumps).
Thermal Efficiency Goal #4: Increase the use of efficient wood heat.
Strategy: Support the adoption of efficient wood and biomass heating systems for new construction, as
replacements for fossil fuel furnaces and backup heat systems for heat pumps.
Action: Conduct outreach and education by coordinating with vendors and contractors to hold
informational public forums.
Action: Encourage state policy to increase incentives and rebates for efficient wood heat
equipment, through communication with the Legislature.
Action: Provide outreach and education to communities to ensure they are aware of existing
incentives and rebates.
Action: Identify potential users of district heating and wood heating systems: schools, college
campuses, apartment complexes, shopping centers, industrial parks and village centers.
Action: Provide guidance to communities seeking to develop district heating systems.
22 All heat pumps for this goal must be identified as “qualifying models” by Efficiency Vermont though their rebate program.

Draft 10/5/16
21 | P a g e
Action: Conduct outreach efforts to public and non-profit entities and housing organizations to
provide information on biomass options.
Action: Partner with project developers to promote the possibility of combined heat and power
and district heating options.

Draft 10/5/16
22 | P a g e
3. Transportation System Changes and Land Use Strategies
Vermont is one of 17 U.S. states that consumes more
energy for transportation than any other sector.23 The
transportation sector is responsible for 37% of the total
energy consumed in Vermont,24 powered mostly from
gasoline (76%) and diesel (20%).25 To reach state
energy goals, Vermonters will need to shift away from
petroleum to electricity and biofuels. While
transportation fuel switching is vital to reaching state
energy and greenhouse gas reduction goals, it is also
important to recognize that land use choices are
inextricably linked to our transportation system.
Vermonters tend to travel farther from their homes to
employment, services, and shops than do other
Americans.
The CEP seeks to reduce Vermont’s total transportation
energy use by 20% from 2015 levels by 2025. In the TRORC Region, the following targets would apply:
Hold statewide Vehicle Miles Traveled (VMT) per capita levels to 2011 (11,402 VMT per capita).
26
Reduce the number of single occupancy vehicle (SOV) trips by 20% by 2030. (75% of vehicle
trips in TRORC Region are SOV).
Triple the number of state park and ride spaces.27 (TRORC has a total of 18 state and municipal
park and rides, totaling 558 spaces).
Increase public transit ridership by 110% to 1.9 million trips annually. Currently, Stagecoach and
Advance Transit together count for 950,000 trips annually.
Quadruple Vermont based passenger rail trips annually.28
10% of vehicles are Electric Vehicles (EVs) by 2025.
The 2015 Vermont Transportation Energy Profile notes that “progress toward achieving the CEP
objective is likely to lag in the early years due to the necessity of upfront investments and the slow pace
of behavior change. Progress may be particularly slow for metrics related to the vehicle fleet since cars
and trucks typically have a long operating life. Thus, cases where the state is currently lagging in
achieving a particular objective should not be taken to mean that the objective cannot be achieved.” In
fact, the state is currently exceeding targets relating to VMT (2014 per capita VMT was 11,356, which is
23 U.S. Energy Information Agency (EIA), 2015 24 Vermont Agency of Transportation, The Vermont Transportation Energy Profile, 2015 25 Ibid. 26 2016 CEP, p.140 27 2016 CEP, p.140 28 We have no data on how many passenger rail trips occur annually in the TRORC region.
Commercial, 19%
Industrial, 12%
Residential, 32%
Transportation, 37%
Figure 2 Vermont Energy Consumption, 2013 (U.S. EIA)
Commercial, 19%
Industrial, 12%
Residential, 32%
Transportation37%

Draft 10/5/16
23 | P a g e
below the 2011 baseline of 11,402). However, on all other
CEP transportation targets the state lags behind.
To achieve these transportation energy goals, the Region’s
transportation would need to become more efficient through
fuel switching and an increase in the utilization of electric
vehicles. Additionally, our pattern of land use and related
travel would need to change to reduce daily trips.
Transportation and Land Use Challenges
Traditional Patterns of Development The traditional Vermont landscape is defined by densely populated villages and downtowns, surrounded by open countryside. This pattern, which is recognized and supported in Vermont’s statutory planning goals, is also the key reason why transportation uses the largest portion of our energy. Where we live, work, go to school, shop, utilize services and recreate determines how far we drive. Much of Vermont’s appeal to homeowners is the ability to own a house in the country, as reflected in our current settlement pattern. While many communities have small villages or downtowns, residential development in our towns is mostly located outside of these areas on rural roads. Rural roads (Class 3 and Class 4) make up a majority (67%) of roads in the TRORC region. The choice to live in a rural setting leads to longer commutes for work, shopping and services. The rural nature of our region also means that there are limited locations for key centers of employment. Businesses commonly locate closer to larger centers of population, more robust municipal services and fast and easy transportation routes. Out of the 30 towns in the TRORC Region, only seven could be considered centers of employment. These are29: Bethel, Bradford, Hartford, Norwich, Randolph, Royalton and Woodstock. Further, a significant number of those who live in Orange and Windsor counties work outside of the region in the Hanover/Lebanon, NH or Montpelier, VT areas. A large portion of the TRORC Region is outside of these centers of employment. This dispersed pattern of development is further
29 Note that the towns included in Figure 3 include several towns outside of the TRORC Region.
“Individuals travel
behaviors (where, how and
how often they travel) are
a key determinant of the
total energy consumed
within the transportation
sector.”
The Vermont Transportation Energy Profile, 2015
Figure 3: Job Centers in the East Central Vermont Region (ECV: What We Want, 2015)
Draft 10/5/16
24 | P a g e
encouraged by the way we regulate development locally. Many communities allow village-scale densities (one to two acre) in all locations, including the more rural areas. If this pattern of development persists, these communities could be forced to build new roads in rural areas to serve new development, resulting in undue costs to taxpayers for road maintenance and increasing VMT.
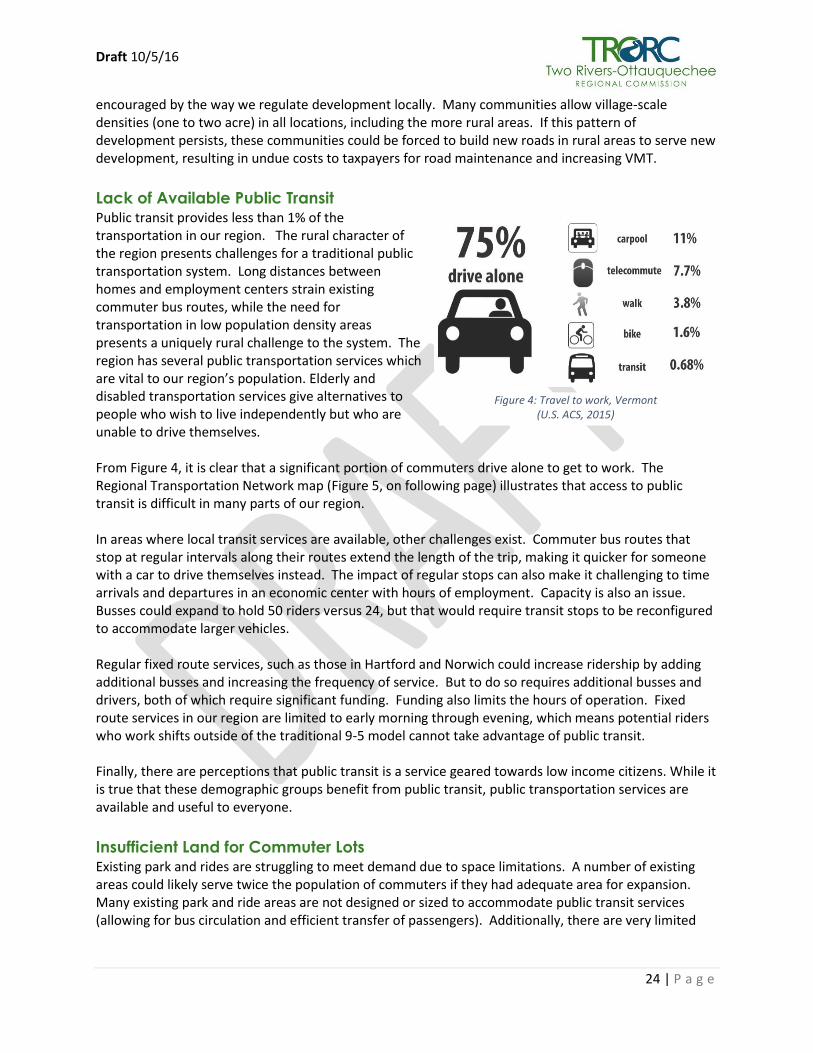
Lack of Available Public Transit Public transit provides less than 1% of the transportation in our region. The rural character of the region presents challenges for a traditional public transportation system. Long distances between homes and employment centers strain existing commuter bus routes, while the need for transportation in low population density areas presents a uniquely rural challenge to the system. The region has several public transportation services which are vital to our region’s population. Elderly and disabled transportation services give alternatives to people who wish to live independently but who are unable to drive themselves. From Figure 4, it is clear that a significant portion of commuters drive alone to get to work. The Regional Transportation Network map (Figure 5, on following page) illustrates that access to public transit is difficult in many parts of our region. In areas where local transit services are available, other challenges exist. Commuter bus routes that stop at regular intervals along their routes extend the length of the trip, making it quicker for someone with a car to drive themselves instead. The impact of regular stops can also make it challenging to time arrivals and departures in an economic center with hours of employment. Capacity is also an issue. Busses could expand to hold 50 riders versus 24, but that would require transit stops to be reconfigured to accommodate larger vehicles. Regular fixed route services, such as those in Hartford and Norwich could increase ridership by adding additional busses and increasing the frequency of service. But to do so requires additional busses and drivers, both of which require significant funding. Funding also limits the hours of operation. Fixed route services in our region are limited to early morning through evening, which means potential riders who work shifts outside of the traditional 9-5 model cannot take advantage of public transit. Finally, there are perceptions that public transit is a service geared towards low income citizens. While it is true that these demographic groups benefit from public transit, public transportation services are available and useful to everyone.
Insufficient Land for Commuter Lots Existing park and rides are struggling to meet demand due to space limitations. A number of existing areas could likely serve twice the population of commuters if they had adequate area for expansion. Many existing park and ride areas are not designed or sized to accommodate public transit services (allowing for bus circulation and efficient transfer of passengers). Additionally, there are very limited
Figure 4: Travel to work, Vermont (U.S. ACS, 2015)
Draft 10/5/16
25 | P a g e
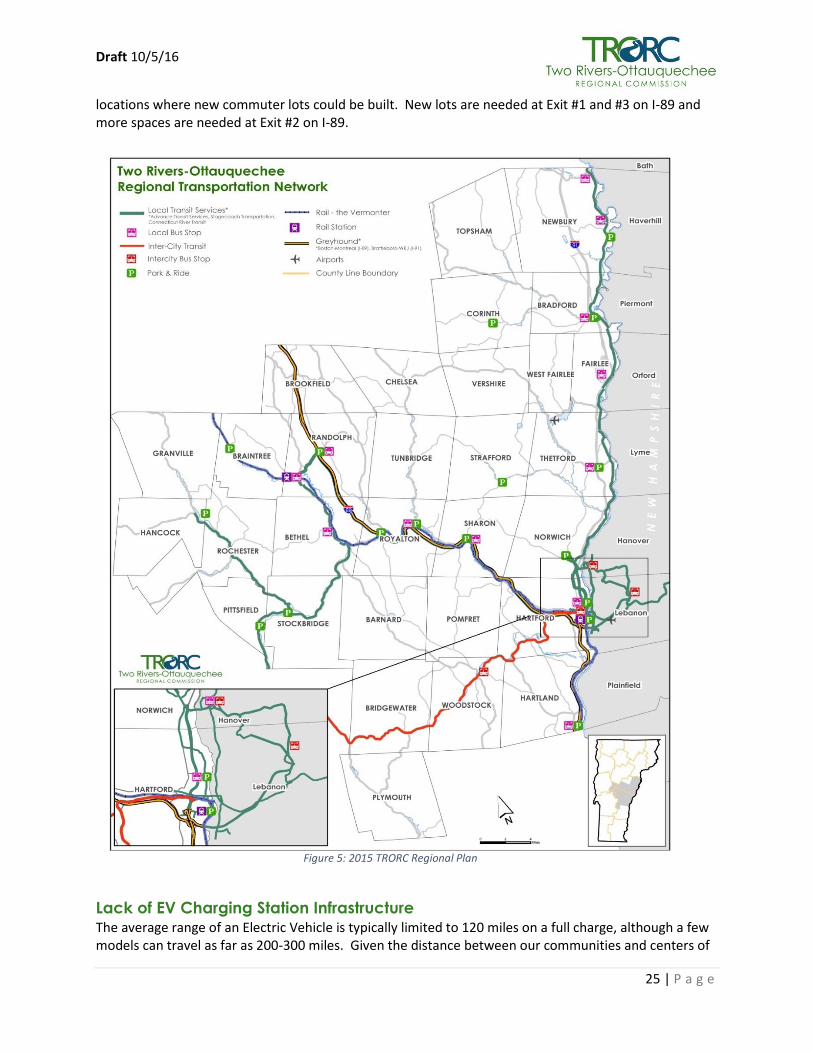
locations where new commuter lots could be built. New lots are needed at Exit #1 and #3 on I-89 and more spaces are needed at Exit #2 on I-89.
Lack of EV Charging Station Infrastructure The average range of an Electric Vehicle is typically limited to 120 miles on a full charge, although a few models can travel as far as 200-300 miles. Given the distance between our communities and centers of
Figure 5: 2015 TRORC Regional Plan

Draft 10/5/16
26 | P a g e
employment, it is essential that the ability to recharge EVs is readily available to the EV owner. There are currently only six locations with public EV charging stations in the TRORC region.
Development Progresses without Adequate Consideration of Public Transit or
Energy Efficient Transportation Methods Developments that occur in areas that are either right on or nearby a public transit route are sometimes planned without considering this service. If not considered during the planning stage, it is difficult to integrate public transit services into completed site plans. Likewise, the location of residential subdivisions away from a transit line can limit public access. Diverting an existing route to a new location is expensive and can have negative impacts on existing services. Act 250 considers public transit as part of Criterion 5 (Transportation), but, at the local level, integration of public transit services into the development review process is less common. It is not yet common that public transit agencies are involved in the beginning of the planning or conceptual design process. This means that design standards for bus pull-offs, sufficient stopping distances/sight lines, bus shelter amenities, bike racks, and sidewalks are not included as part of the permitting process.
Transportation and Land Use Strategies
Support Smart Growth Planning In order to achieve the CEP’s goals, transportation energy use cannot be ignored as we strive to create more energy-efficient buildings. Essentially, “location matters!” The region should embrace smart growth which, if properly implemented, “can help communities balance competing demands by supporting the rural landscape, helping existing places thrive, and creating great new places.”30 Embracing smart growth reduces energy use, leading to cost savings for both households and
30 Smart Growth America. “What is ‘smart growth’?” (2010).
Poorly Planned Public Transit Example
This bus turnout is part of an expansion
of a State office facility in Hartford.
Because public transit authorities were
not consulted during the design phase,
the facilities designed to accommodate a
bus stop are inadequate.
The busses on this route are 8ft wide and
need at least 11ft of area to safely allow
for passengers to enter and exit the bus.
Additionally, in this example, the tapered
bus stop will not accommodate the
length of the bus. Had public transit
authorities been involved in the early
stages of planning, this issue would not
have developed.
Draft 10/5/16
27 | P a g e
municipalities, while creating vibrant communities and taking pressure off our natural resources. Development that is more effectively directed within and adjacent to historic downtowns, villages, and neighborhoods will reduce the need for motorized transportation. In 2006, via Act 183, Vermont codified its own detailed guiding principles for local and regional land use decisions based upon the smart growth principles. Although communities are not required to plan, those that do are encouraged to uphold planning and development goals that reinforce smart growth principles, such as Complete Streets. Complete Streets focus on multi-modal transportation, public transit and pedestrian travel. Encouraging economic development initiatives that keep individuals working in their home communities, rather than commuting to work, such as “maker” or “coworking” spaces and expanded high speed internet can also have an impact on Vehicle Miles Traveled. Likewise, communities can support infill development and concentrated commercial and institutional activities in our villages and downtowns.
Encourage Higher Density in Less Rural Areas In order to reduce Vehicle Miles Traveled, communities will need to continue to encourage higher density development, particularly housing, within their villages and downtowns. In turn, they will need to reduce density in more rural areas. Communities with village scale density (2 acres or less) in rural areas that are not served by existing major roads should seek to reduce density, thus discouraging the proliferation of residential development in areas that require driving.
Encourage Employers to Support Reduced VMT Local employers have a role in reducing vehicles miles travelled. On average, Vermonters drive 15 miles to work each way. Assuming a telecommuter works one day a week from home, with two weeks of annual vacation time, telecommuting could decrease round trip commuter travel by roughly 1,500 miles per year per commuter. If telecommuting is not practical due to lack of adequate internet access or because of a specific business model, employers can encourage carpooling, cycling, or the use of public transportation. For example, Dartmouth College provides a van service for employees in Bradford, Chelsea and Vershire. GW Plastics is working on a van service to Royalton from Barre. State employees can catch a van from Randolph to the National Life building in Montpelier. Area employers including King Arthur Flour, Vital Communities, Hypertherm and RSG, Inc. provide monetary incentives for employees to carpool or take public transit.
Support Increased Consideration for Public Transit and Electric Vehicles in Local
and State Permit Reviews Clear policy at the Regional level will ensure that under Act 250, public transit and electric vehicles are given adequate consideration. Large scale commercial and residential developments need to consider their relationship with public transit in terms of where they are located and the infrastructure they provide for employees who want to use it. Likewise, developers can include EV charging stations in their plans.
Support the Development of Alternative Forms of Public Transit In addition to traditional public transit models, growth in forms of transit driven by technology (such as Uber) should be encouraged.

Draft 10/5/16
28 | P a g e
Increase funding for Public Transit Initiatives and
Investments Adding additional busses along existing commuter routes would allow transit providers to expand their hours and capture riders who work outside of traditional 9-5 business hours. Larger busses located along transit routes would allow for more riders.
Support the Development of intermodal transit
facilities The development of several intermodal transit facilities that would allow commuters to connect with mass transit including trains and busses, could improve regional access to public transit and reduce VMT overall.
Transportation Goals, Strategies and Actions
Transportation Goal #1: Hold statewide VMT per capita to 2011 levels (11,402 VMT per capita).
Strategy: Reduce vehicle miles traveled by supporting efforts to provide the Region with opportunities
to work closer to home and by requiring public transit opportunities for large scale development.
Action: Encourage communities to develop bylaws that allow for the development of
“makerspaces”31 as a way to reduce VMT. Revise the TRORC Regional Plan to include support
for makerspaces in villages and downtowns.
Action: Support continued expansion of high speed internet to allow for telecommuting.
Action: Partner with employers to invest in workplace incentives for carpooling, cycling, public
transportation use and telecommuting.
Action: Modify the Regional Plan to include specific language that requires developments that
have a substantial regional impact under Act 250 to include regional transit infrastructure.
Consultation with transit providers may be required.
Action: Modify the TRORC Regional Plan to require a transit stop for all residential and large
commercial land developments subject to Act 250 if there is not currently a stop within 1/8 mile.
Action: Support new bike/pedestrian projects in the region.
Action: Revise the Regional Plan to more clearly support the goal of densely populated villages
and urban centers surrounded by open countryside. This will include identifying areas where
high density development, such as is common in Villages and urban centers, is less appropriate.
Action: Work with groups such as the Vermont Bicycle and Pedestrian Coalition (VBPC), Local
Motion and the Green Mountain Bicycle Club to educate and encourage safe bicycling as a
transportation alternative in the region.
31 A “makerspace” is a physical location where people gather to share resources and knowledge, work on projects, network, and build. Makerspaces provide tools and space in a community environment—a library, community center, private organization, or campus.
“The Advance Transit
Green route recently
added a second bus to
the route reducing from a
one-hour service to a thirty-
minute service - the
ridership more than
doubled.”
Rita Seto, AICP Senior Transportation Planner

Draft 10/5/16
29 | P a g e
Transportation Goal #2: Reduce the number of single occupancy vehicle trips by 20% by 2030, through
carpooling and public transit.
Strategy: Support programs and planning initiatives that will reduce single occupancy trips throughout
the Region.
Action: Support community car sharing by promoting programs such as Go Vermont and
CarShare Vermont.
Action: Provide technical assistance to communities interested in implementing Complete
Streets to increase density and mixed uses in compact settlements and to foster transit-oriented
development along major roads in rural areas.
Action: Continue to identify locations for additional park and rides (state and municipal).
Action: Continue to prioritize efforts to expand existing park and ride infrastructure.
Action: Support the development of intermodal transit facilities within the region to allow
underserved areas access to multiple forms of transportation.
Action: Continue to support local transit providers through technical assistance.
Action: Increase coordination between TRORC, VTrans and local transit providers to ensure a
seamless regional transit system.
Action: Investigate the feasibility of commuter rail along the I-91 corridor.
Action: Work with communities to incorporate the principles of Smart Growth into their
municipal plans and bylaws and to support creative economic development concepts that allow
residents to live and work in their communities.
Transportation Goal #3: Increase percentage of electric vehicles in the Region.
Strategy: Ensure that land use policy and regulation are designed to encourage daily use of EVs.
Action: Modify Regional Plan to require EV charging stations for developments over a certain
size.
Action: Modify the TRORC Regional Plan with language that that requires EV parking spots and
infrastructure for all commercial, industrial and multi-family development subject to Act 250.
Action: Encourage state policy changes to offer state buyer incentives for EVs.
Action: Promote and share information provided by Drive Electric Vermont including their video
highlighting the costs and benefits of EVs.
Action: Consider other EVs as part of the Plan such as light-duty and heavy-duty trucks, bicycles
and motorcycles.
Action: Encourage municipalities to take advantage of Village Designation Electric Vehicle
Charging Station grants.
Transportation Goal #4: Increase the use of sustainable biofuels.
Strategy: Support investment and development of sustainable biofuels.
Action: Support and promote the Vermont Bioenergy Initiative in cooperation with the VT
Sustainable Job Fund’s Bioenergy Initiative by modifying the TRORC Regional Plan to address on-
farm biofuel production under Act 250.

Draft 10/5/16
30 | P a g e
Action: Identify locations for alternative fuel stations in the Region and modify the Regional Plan
to include them as allowed uses in appropriate locations.
Action: Support efforts to switch municipal medium and heavy duty vehicles to biodiesel blends.

Draft 10/5/16
31 | P a g e
4. Energy Conservation, Efficiency of Delivery and End Use
Figure 6 – Using the LEAP model overall energy demand decreases, electricity demand increases.
Background The CEP recognizes the significant economic and environmental benefits of energy efficiency,
conservation, and renewable energy sources, while seeking diverse sources of electricity production,
ensuring grid reliability, and maintaining lowest-cost integrated resource planning principles. Since
2005, electricity consumption in Vermont has declined and retail electric rates in Vermont are the
second lowest in New England.
The data modeling used to create the scenario that this Plan uses to achieve the goals of the CEP
projects a 40% decrease in overall energy use in the TRORC region. However, the significant reduction
in fossil fuels as part of our energy production portfolio ultimately requires an increase in our
dependence on electricity. As is shown in the graphic above, following the LEAP model developed for
this Plan, one possible path for the Region to achieve 90% by 2050 includes increasing electric demand
by 71.6% (from 2010 levels) to offset decreases in fossil fuel use. This may be achieved primarily with
the utilization of new electric technologies, such as cold climate heat pumps and electric vehicles that
rely on electricity. This fundamental change in the type of energy we use will require substantial
changes at the utility scale.
Demand-Side Management Demand-Side Management is the best and lowest-cost option to meet expected demand. Encouraging
the installation of energy efficient devices or equipment that will perform work using less energy and
improving building shells to reduce the need for building heat is essential to reducing our overall energy

Draft 10/5/16
32 | P a g e
use (see How We Heat, Chapter 2). Additionally, proper load management can help reduce demand
during peak hours. Demand response techniques can include time of use rates, smart rates and energy
use feedback. But even with fully implemented demand-side management, fuel-switching will require
new sources of renewable energy.
Conservation & Efficiency New technology, demand-side management and renewable generation alone will not be sufficient to
achieve the state’s energy goals. Gains in efficiency can be made through appliance standards, building
energy codes, customer economic decisions, and some are made possible through publicly funded
programs. In order to achieve the state’s energy goals people will have to alter their behavior patterns,
using electric appliances, lighting, and heating with greater thought given to limiting energy use. Large-
scale energy savings can be achieved by effectively encouraging many people to make small individual
changes such as turning down thermostats, air drying clothes and turning off lights and electronic
devices when not in use.
It is important to recognize that from a regional standpoint, TRORC can only indirectly implement many
of the strategies related to electricity. Many of the components that are needed to implement this
section of the Plan require direct action from utilities, energy generators and the state and federal
government and buy-in from our communities.
Challenges
Electricity will make up a larger part of our energy future As indicated earlier in this chapter, Vermont will need to significantly increase the amount of electricity available statewide in order to offset the impacts of fuel switching. While energy efficiency and conservation will help reduce the amount of electricity needed, meeting the goals of the CEP will mean that in the TRORC region, we will go from using 1.7 MMBTU of electricity to nearly 3 MMBTU. Because 90% of our energy must be from renewable energy, new renewable energy generation facilities will need to be built throughout our region, which will create another set of challenges.
Power Distribution System is not designed for distributed generation The Vermont electric grid was developed to function as an importer of electricity. As with the rest of the United States, Vermont depends on a small number of centralized power plants, the vast majority of which are located outside of the state. This classic model of energy distribution has a number of significant disadvantages due to inefficiencies and power loss over lengthy transmission lines. Our existing grid is not fully capable of allowing the placement of small renewable energy generation facilities in every community in our region. In the GMP region, for example, parts of Hartford, Hartland, Sharon and Strafford have poor circuit ratings (see figure 7).32 In addition, energy supply (generation) and loads (end uses) must be instantaneously kept in balance, even as customers change their end uses or renewable energy facilities respond to changes in generation cycle. If the Region is going to transition to 90% renewable energy (with much of it produced in-state), power companies and VELCO will need to increase the pace of system-wide upgrades. This will include line upgrades and, once the technology
32 Green Mountain Power, 2015 http://gmp.maps.arcgis.com/apps/Viewer/index.html?appid=546100cc60c34e8eb659023ea8ae03f3

Draft 10/5/16
33 | P a g e
becomes readily available, the provision of storage technologies such as Tesla’s new Powerwall battery system.
Regional and Municipal Planning does an
inadequate job with regard to renewable
energy generation While Regional and Municipal plans are required by statute to include an energy chapter which includes a “a statement of policy on the development of renewable energy resources,”33 most plans do not go beyond indicating “support” for renewable generation. This lack of clear language makes it challenging for developers to determine what locations in a community that are suitable for development would be well received by residents. Additionally, local and regional plans do not provide significant actions to be taken to further the goals of the CEP. With the passage of Act 174 in 2016, there is an opportunity for Regional and Municipal energy planning to take a step forward.
Inadequate Understanding of programs,
costs and methods As noted in Section 2, Vermont has an extensive network of entities with significant experience in energy efficiency and renewable energy generation services and programs. But, the plethora of options is often overwhelming, leading homeowners to be slow at implementing and combining energy efficiency improvements or renewable generation systems.
Behavioral patterns do not reflect a need for energy conservation Much of what we do depends, in one form or another, on energy. Where we live and work, how we get from place to place, how we design, build and heat our houses, and how we use our land are all patterns of behavior. Behaviors are controlled by social norms to a large extent.34 Current social norms do not favor energy conservation, tending toward a more consumptive model. Education sustained over time will have an impact on behavior.
33 V.S.A. Title 24, Chapter 117, §4382(9) 34 Shove, E.,2003, 'Converging conventions of comfort, cleanliness and convenience.' In: Journal of Consumer Policy, Vol. 26, No. 4, 12.2003, p. 395–418.
Good
Average
Poor
Figure 7: This map indicates a significant gap in the quality of existing infrastructure. (Source: GMP, 2016)
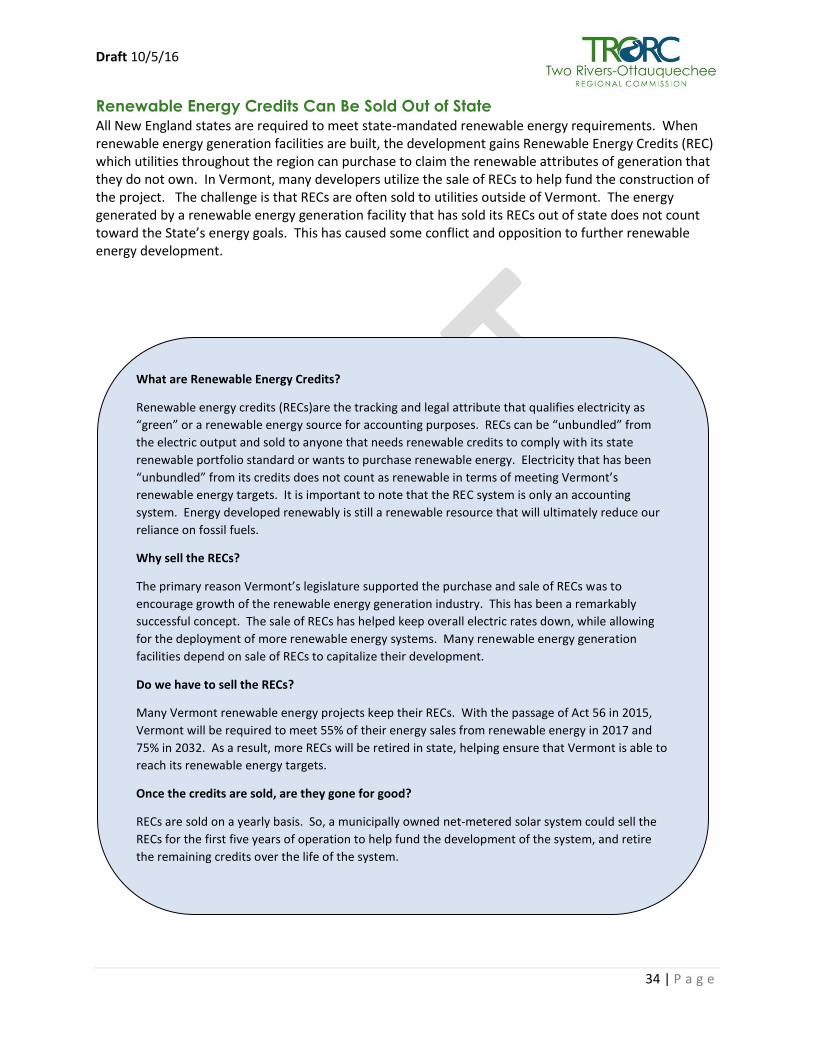
Draft 10/5/16
34 | P a g e
Renewable Energy Credits Can Be Sold Out of State All New England states are required to meet state-mandated renewable energy requirements. When renewable energy generation facilities are built, the development gains Renewable Energy Credits (REC) which utilities throughout the region can purchase to claim the renewable attributes of generation that they do not own. In Vermont, many developers utilize the sale of RECs to help fund the construction of the project. The challenge is that RECs are often sold to utilities outside of Vermont. The energy generated by a renewable energy generation facility that has sold its RECs out of state does not count toward the State’s energy goals. This has caused some conflict and opposition to further renewable energy development.
What are Renewable Energy Credits?
Renewable energy credits (RECs)are the tracking and legal attribute that qualifies electricity as
“green” or a renewable energy source for accounting purposes. RECs can be “unbundled” from
the electric output and sold to anyone that needs renewable credits to comply with its state
renewable portfolio standard or wants to purchase renewable energy. Electricity that has been
“unbundled” from its credits does not count as renewable in terms of meeting Vermont’s
renewable energy targets. It is important to note that the REC system is only an accounting
system. Energy developed renewably is still a renewable resource that will ultimately reduce our
reliance on fossil fuels.
Why sell the RECs?
The primary reason Vermont’s legislature supported the purchase and sale of RECs was to
encourage growth of the renewable energy generation industry. This has been a remarkably
successful concept. The sale of RECs has helped keep overall electric rates down, while allowing
for the deployment of more renewable energy systems. Many renewable energy generation
facilities depend on sale of RECs to capitalize their development.
Do we have to sell the RECs?
Many Vermont renewable energy projects keep their RECs. With the passage of Act 56 in 2015,
Vermont will be required to meet 55% of their energy sales from renewable energy in 2017 and
75% in 2032. As a result, more RECs will be retired in state, helping ensure that Vermont is able to
reach its renewable energy targets.
Once the credits are sold, are they gone for good?
RECs are sold on a yearly basis. So, a municipally owned net-metered solar system could sell the
RECs for the first five years of operation to help fund the development of the system, and retire
the remaining credits over the life of the system.
Draft 10/5/16
35 | P a g e
Electricity Strategies
Improve Demand-Side Management In addition to energy efficiency improvements to reduce heating and cooling costs in our homes and transitioning to electric vehicles, there are other techniques that can be used to reduce energy use. Utilities can install Advanced Meter Infrastructure (AMI), which increases system reliability and load management capabilities with two-way communications technology. AMI includes smart meters to enable utilities and customers to track and manage the flow of energy more efficiently, curb peak demand, lower energy bills and integrate renewable energy sources and storage to the grid. AMI data and Smart Meter technology can allow utilities to implement Smart Rates, which vary the price of electricity to accurately reflect the cost of electricity. Lower rates for low demand and higher rates during peak. This can help influence customers to change their electricity consumption patterns in response to changes in energy price over time or to incentivize payments designed to induce lower electricity use during peak.
Promote Behavioral Change to Encourage Conservation Programs such as The 10% Challenge, Go VT and Button Up! are designed to educate people on ways they can change their behavior to reduce energy consumption and greenhouse gas emissions. If provided with well thought out and well organized materials, local energy committees can successfully implement programs like these at the local level. Additionally, as mentioned above, properly designed Smart Rates can either encourage or discourage usage at certain times of the day, for example, which in turn affects resource development and utilization choices. Small changes in routine, such as shifting power-hungry activities to “off-peak” hours in the morning or evening can help ease the load on the Region's power grid.
Encourage the Development and Use of Storage Technology Electrical Storage can closely align customer loads with periods of lower electric demand, store solar electricity to use during peaks or provide some back-up during power outages. Using storage can help reduce electrical demand peaks across the network, making it more reliable.
Focus Grid Improvements on System Stability, Reliability and Affordability Green Mountain Power covers a majority of the TRORC Region. The utility is constantly striving to improve existing infrastructure. Improvements to existing facilities are often subject to Act 250 review, which the Regional Commission reviews as part of their technical assistance program. The CEP desires a significant portion of Vermont’s energy to be produced near where it is consumed by many coordinated actions by distributed energy users, rather than through singular central control.35
Retire more Renewable Energy Credits in State Changes in legislation have made it possible to retire RECs in-state, thus allowing us to further increase our renewable energy portfolio. Act 56, which was passed in 2015, has increased the number of RECs that need to be retired in state.36 Efforts to increase that cap or encourage their retirement in-state,
35 Department of Public Service, Comprehensive Energy Plan, 2015 36 Act 56 requires 1% of Tier 2 electric power to be from distributed generators (< 5MW) supporting VT electric grid in 2017 to 10% in 2032.
Draft 10/5/16
36 | P a g e
should continue in order to ensure that the goals of the CEP are reached.
Increase the Number of Renewable Energy Generation Facilities To accommodate the increase in use of electricity due to fuel switching, electric vehicles, etc., the Region will need to encourage the development of new renewable energy generation facilities that retire their RECs in state. In order to ensure that facilities are developed, the Regional Commission and its municipalities will need to clearly identify areas where they are appropriate.
Embrace Enhanced Energy Planning as defined in Act 174 Act 174 was passed in an effort to support energy planning and the development of renewable energy. The Act creates an optional level “enhanced energy planning” that would include policies relating to energy conservation, efficiency and the development and siting of renewable energy resources, including an identification of where they are and are not appropriate. The TRORC Regional Plan will be revised to incorporate Enhanced Energy Planning.
Electricity Goals, Strategies and Actions
Electricity Goal #1: Meet 25% of remaining energy need from renewables by 2025, 40% by 2035 and
90% by 2050. Meet end-use sector goal of 67% renewable electric by 2025.
Strategy: Support the continued development of renewable energy generation that counts toward the
goals of the CEP.
Action: Encourage communities and residents to identify areas with the potential for renewable
energy generation.
Action: Provide education and outreach to municipalities on energy generation.
Action: Develop easy to understand materials about the state’s energy goals and how they
interact with local and regional planning.
Action: Advocate for continued incentives that lead to the retirement of Renewable Energy
Credits in-state so that the Region can accurately track progress toward the goals of the CEP.
Action: Support the implementation of smart rates.
Action: Revise the Regional Plan to meet the standards set forth in Act 174 for Enhanced Energy
Planning.
Electricity Goal #2: Use Demand-Side Management to manage the expected electric energy demand
increase of 72% by 2050 in the TRORC region.
Strategy: Educate our communities about the programs and tools available to further reduce energy
demand.
Action: Promote Efficiency Vermont and other incentive programs to reduce electric energy use
and encourage the use of devices and equipment that perform work using less energy input
than otherwise necessary, such as Energy Star appliances.
Action: Encourage state policy to adopt energy storage mandates and incentive programs.
Draft 10/5/16
37 | P a g e
Action: Promote the use of programs such as eHome and Zero Energy Now!, in conjunction with
Green Mountain Power and the Building Performance Professionals Association of Vermont
(BPPA-VT), through outreach and education.
Action: Work with BPPA-VT to encourage HVAC and weatherization providers to join the
organization to provide holistic energy advice to the Region.
Action: Support and provide outreach for Energy Action Network’s Community Energy
Dashboard and Efficiency Vermont’s customer engagement web portal and home energy
reports.
Action: Support efforts to develop programs that encourage energy conservation through
behavioral change by advocating for a roll-out of smart rates in the region through work with
local energy committees and education and outreach.
Action: Provide support for grid improvements that will allow improved renewable energy
generation facility coverage in our region by actively participating in the Act 250 and Section 248
review process.

Draft 10/5/16
38 | P a g e
5. Renewable Energy Generation
The State’s goal of 90% renewable energy by 2050 represents a substantial shift from our current
renewable energy portfolio. Renewable portfolio standards are state or local level policies that mandate
all or certain types of electricity producers to supply a minimum share of their electricity from
designated renewable resources.
Sixty of Vermont’s electricity currently comes from renewable sources, a majority of which is
hydropower generated by Hydro Quebec. Vermont currently has no large-scale centralized electricity
generation. To reach the state’s renewable energy generation targets, more generation will need to be
developed (with RECs retired in state).
Renewable Energy in the TRORC Region The TRORC Region currently hosts 64MW of renewable energy capacity, the bulk of which comes from
existing hydroelectric sites. All existing or permitted generation capacity as of 2015 was factored into
the LEAP modeling used as part of the RPC Energy Project.
In the 2015 DPS-RPC Energy Project, one
possible pathway to reaching the state’s
energy goals was developed using the LEAP
model’s demand-based figures. Based on
this particular model, the TRORC region
would need to accommodate 16 MW of
new wind, 8 MW of new hydro and 139
MW of new solar in order to adequately
contribute to the goal of 90% renewable by
2050. When factoring in local potential for
generation, the targets are higher (165
MW solar and 32 MW wind).
It is important to recognize that the model developed and utilized in this Energy Implementation Plan is
one path to reach the state’s energy goals. The targets specified in Table 2 are not to be considered
hard targets, but are instead intended to provide the region with an idea of how much renewable
energy might need to be generated in order to play a role in achieving 90% renewable by 2050. These
targets should be used by communities as they formulate their own plans and policies with regard to
renewable energy generation, particular those communities seeking to meet the Enhanced Energy
Planning standards of Act 174.
Solar Solar is the most viable source of renewable energy generation in the TRORC region due to the nature of
our topography and land cover. Based on GIS mapping analysis, there are roughly 27,000 acres of land
Year
Electricity Consumption (1000 GWh)
New Wind (MW)
New Hydro (MW)
New Solar (MW)
2010 487 - - -
2025 599 4 2 38
2035 687 16 4 78
2050 847 16 8 139
Table 2: Projected new renewable by source to meet 90% renewable by 2050 goals. (Source: LEAP Model)
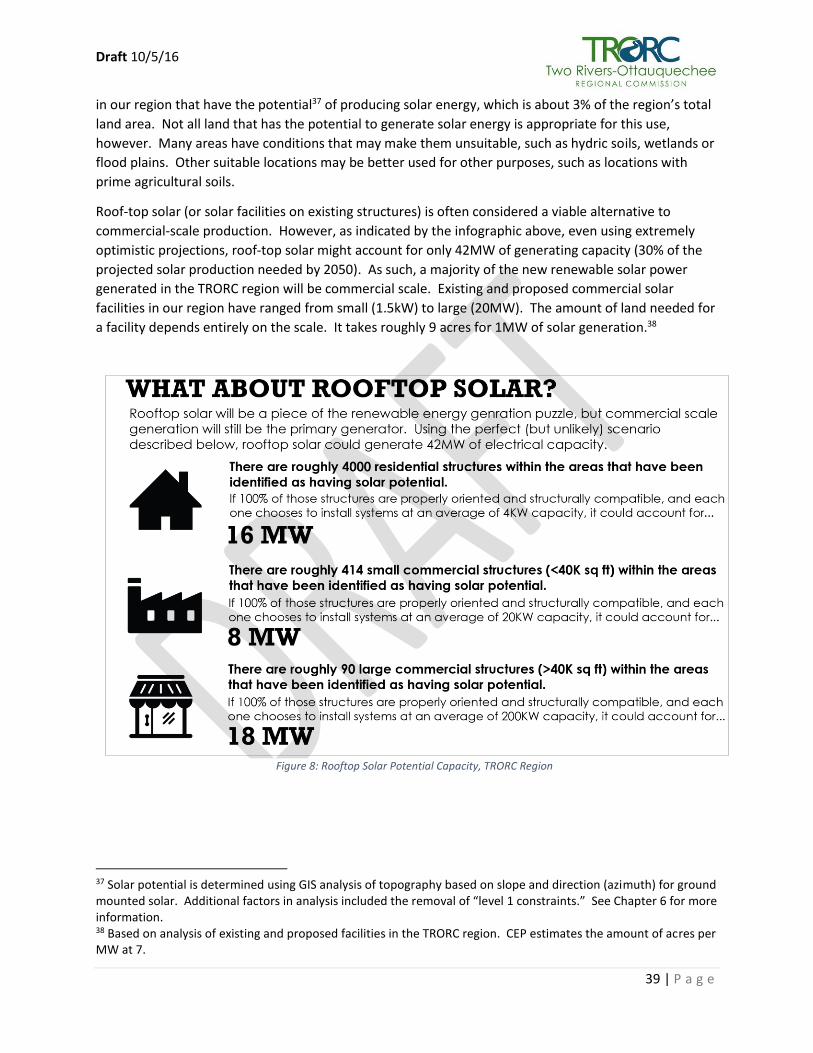
Draft 10/5/16
39 | P a g e
in our region that have the potential37 of producing solar energy, which is about 3% of the region’s total
land area. Not all land that has the potential to generate solar energy is appropriate for this use,
however. Many areas have conditions that may make them unsuitable, such as hydric soils, wetlands or
flood plains. Other suitable locations may be better used for other purposes, such as locations with
prime agricultural soils.
Roof-top solar (or solar facilities on existing structures) is often considered a viable alternative to
commercial-scale production. However, as indicated by the infographic above, even using extremely
optimistic projections, roof-top solar might account for only 42MW of generating capacity (30% of the
projected solar production needed by 2050). As such, a majority of the new renewable solar power
generated in the TRORC region will be commercial scale. Existing and proposed commercial solar
facilities in our region have ranged from small (1.5kW) to large (20MW). The amount of land needed for
a facility depends entirely on the scale. It takes roughly 9 acres for 1MW of solar generation.38
37 Solar potential is determined using GIS analysis of topography based on slope and direction (azimuth) for ground mounted solar. Additional factors in analysis included the removal of “level 1 constraints.” See Chapter 6 for more information. 38 Based on analysis of existing and proposed facilities in the TRORC region. CEP estimates the amount of acres per MW at 7.
Figure 8: Rooftop Solar Potential Capacity, TRORC Region

Draft 10/5/16
40 | P a g e
Wind Wind energy generation has several advantages over solar. Wind turbines have a more significant
amount of “up-time” in terms of generated energy because they can operate 24 hours a day.
Additionally, they are able to produce energy during the winter, when sunlight is less available for solar
production. But, because of the need for constant wind speed, these commercial scale wind energy
generation facilities generally require areas with elevated topography (where wind speeds are generally
higher). Only 20% of the TRORC region has topography that can offer potential for wind speeds that
make commercial-scale wind energy generation39 cost-effective. On average, out of the 30 towns in the
TRORC region, only about 16% of the land in each community is elevated enough to offer significant
potential for commercial-scale wind. But, it is possible to generate energy in areas with lower wind
speed. These are more practical on the individual scale, rather than commercial scale.
As with solar, not all land that has the potential to generate wind energy is appropriate for that use. A
majority of the areas of high elevation in our region are extremely rural, providing habitat to a broad
range of plant and animal communities. These areas can be challenging to access and difficult to permit,
making them less profitable for the developer.
39 Digitally modeled wind speed (based on topography) analyzed at 3 hub heights.
Not All Generation is Equal
In some communities, there may be a preference for one kind of renewable energy
generation vs. another. The target information provided as part of the LEAP model
specifies targets for solar, wind and hydro generation. It is possible (but not simple)
to “swap” one generation type for another (for example, a town could decrease the
amount of solar in a community in favor of more wind).
It is important to recognize the different types of renewable energy are not equal,
and each have a different “capacity factor” (actual output over time). For example, a
solar system with a capacity of 100 megawatts, won't produce energy at that level all
the time because the sun is not available for 24 hours a day, 365 days a year. Solar
in Vermont is generally considered to have a capacity factor of 15%. Wind
generation in VT, on the other hand, has a capacity factor of roughly 25-30%, because
winds are more constant. This means that if a community was determined to reduce
the number of wind towers needed to reach the goals of the CEP, significantly more
solar would be needed to make up the lost capacity.

Draft 10/5/16
41 | P a g e
Hydro Hydroelectric energy generation is one of the lowest-cost, steady power producers available to the
TRORC region. There are currently twelve hydroelectric facilities in operation in the TRORC region,
which account for 51,840 kW of existing capacity.
The pathway developed by the LEAP model includes a suggested allocation of 8GW of additional
hydroelectric capacity in the TRORC Region. Recognizing that the development of new, commercial-
scale hydroelectric facilities is unlikely, gains in hydroelectric energy generation will be made by
upgrading and improving existing infrastructure including dams that are not currently outfitted for
hydro. There are 35 existing dams in the TRORC Region that have the potential to generate
hydroelectric power40. However, these facilities only have the estimated capacity of 2,700 kW.
It is hoped that through advanced operational controls, more efficient equipment and/or conservation
flow turbines, additional energy can be generated at existing facilities within our region.
Biomass Biomass generally consists of woody and non-woody solid biomass, and is most commonly used in
heating, although it can be used to produce electricity and transportation fuel as well. An estimated
37% of Vermont households heat at least in part with firewood or wood pellets.41 Larger facilities use
wood chips or pellets for heating as well, including schools and institutional facilities. The TRORC Region
is home to only one biomass related electricity generator, the Vermont Technical College Community
Anaerobic Digester. Using manure and food wastes, the facility harnesses biogasses through anaerobic
digestion to fuel a generator that generates power. The system has a capacity of 375 kW of electrical
40 Data (L. Barg, The Undeveloped Hydroelectric Potential of Vermont, 2007) used includes existing dams with low-to high hazard risk. Existing structures identified as having “significant hazard potential” were not included. 41 Department of Public Service, Comprehensive Energy Plan, 2016
Town Type Utility Capacity kW
Annual kWh
Owner Stream/River
Bethel GNM GMP 330 12000000 Bethel Mills Third Branch, White River
Newbury GRD GMP 970 33000000 Boltonville Hydro Wells River
Newbury GRD GMP 270 1096000 GMP Wells River
Newbury GRD GMP 5 23000 Sardnar Thanhuser Halls Brook
Bradford GRD GMP 1500 4335000 GMP Waits River
Hartford GRD GMP 37400 148850000 TransCanada Connecticut River
Hartford GRD GMP 3790 6904000 GMP Ottauquechee River
Hartford GRD GMP 645 2780000 Simon Pearce Glass Ottauquechee River
Hartland GRD GMP 4000 12100000 North Hartland, LLC Ottauquechee River
Hartland GRD GMP 2180 5834000 GMP Ottauquechee River
Hartland GRD GMP 250 800000 Jay Boeri Lulls Brook
Woodstock GRD GMP 500 1429000 GMP Ottauquechee River Table 3: Existing Hydro Generation Facilities, TRORC Region 2015
GNM = Group Net Metered, GRD = Grid, GMP = Green Mountain Power
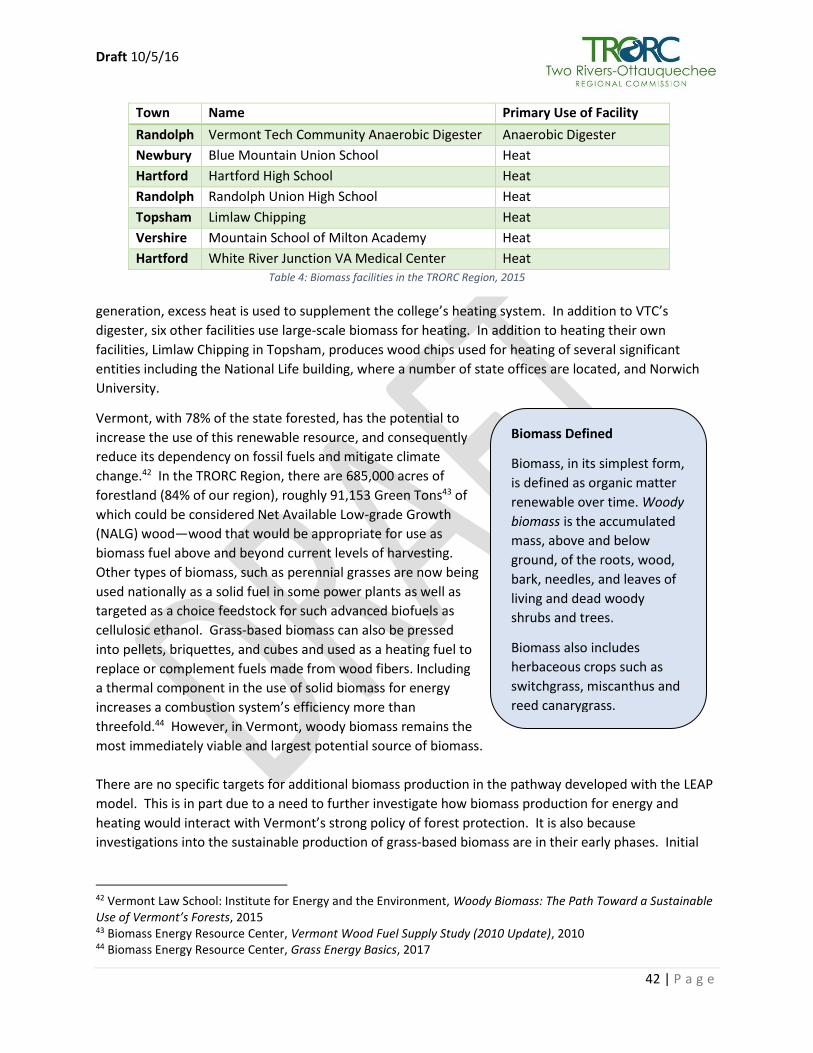
Draft 10/5/16
42 | P a g e
generation, excess heat is used to supplement the college’s heating system. In addition to VTC’s
digester, six other facilities use large-scale biomass for heating. In addition to heating their own
facilities, Limlaw Chipping in Topsham, produces wood chips used for heating of several significant
entities including the National Life building, where a number of state offices are located, and Norwich
University.
Vermont, with 78% of the state forested, has the potential to
increase the use of this renewable resource, and consequently
reduce its dependency on fossil fuels and mitigate climate
change.42 In the TRORC Region, there are 685,000 acres of
forestland (84% of our region), roughly 91,153 Green Tons43 of
which could be considered Net Available Low-grade Growth
(NALG) wood—wood that would be appropriate for use as
biomass fuel above and beyond current levels of harvesting.
Other types of biomass, such as perennial grasses are now being
used nationally as a solid fuel in some power plants as well as
targeted as a choice feedstock for such advanced biofuels as
cellulosic ethanol. Grass-based biomass can also be pressed
into pellets, briquettes, and cubes and used as a heating fuel to
replace or complement fuels made from wood fibers. Including
a thermal component in the use of solid biomass for energy
increases a combustion system’s efficiency more than
threefold.44 However, in Vermont, woody biomass remains the
most immediately viable and largest potential source of biomass.
There are no specific targets for additional biomass production in the pathway developed with the LEAP
model. This is in part due to a need to further investigate how biomass production for energy and
heating would interact with Vermont’s strong policy of forest protection. It is also because
investigations into the sustainable production of grass-based biomass are in their early phases. Initial
42 Vermont Law School: Institute for Energy and the Environment, Woody Biomass: The Path Toward a Sustainable Use of Vermont’s Forests, 2015 43 Biomass Energy Resource Center, Vermont Wood Fuel Supply Study (2010 Update), 2010 44 Biomass Energy Resource Center, Grass Energy Basics, 2017
Biomass Defined
Biomass, in its simplest form,
is defined as organic matter
renewable over time. Woody
biomass is the accumulated
mass, above and below
ground, of the roots, wood,
bark, needles, and leaves of
living and dead woody
shrubs and trees.
Biomass also includes
herbaceous crops such as
switchgrass, miscanthus and
reed canarygrass.
Town Name Primary Use of Facility
Randolph Vermont Tech Community Anaerobic Digester Anaerobic Digester
Newbury Blue Mountain Union School Heat
Hartford Hartford High School Heat
Randolph Randolph Union High School Heat
Topsham Limlaw Chipping Heat
Vershire Mountain School of Milton Academy Heat
Hartford White River Junction VA Medical Center Heat Table 4: Biomass facilities in the TRORC Region, 2015
Draft 10/5/16
43 | P a g e
studies indicate that it is possible for Vermont to produce grass-based biomass for energy generation
only at a small scale in part due to the lack of available farmland.
Despite the lack of specific targets for the development of biomass, this Plan (and the LEAP model)
recognizes that utilization of woody biomass, particularly for heating, will need to be a significant part of
the pathway to achieving the state’s energy goals.
Certificate of Public Good (CPG) Any new renewable energy generation facility that is connected to the grid, must apply for a certificate
of public good. As part of this process, the Public Service Board must find that:
The Project must not unduly interfere with the orderly development of the region, with due
consideration having been given to the recommendations of the municipal and regional
planning commissions, the recommendations of the municipal legislative bodies, and the land
conservation measures contained in the plan of any affected municipality.
The Project must meet a need for present and future demand for services. The Project will not
have an adverse impact on system stability and reliability.
The Project will not have an undue adverse impact on aesthetics, historic sites, air and water
purity, the natural environment, the use of natural resources, and public health and safety, with
due consideration having been given to the criteria specified in 10 V.S.A. §§14724a(d) and
6086(a)(1) through (8) and (9)(K) and greenhouse impacts.
State agencies, municipalities and the regional planning commissions are considered parties by right, in
a Section 248 proceeding. Although the CPG process includes elements of review that are similar to Act
250, it is a very different process. Any facility that applies for a CPG is exempt from consideration under
a municipality’s zoning regulations. With the ratification of Act 174 in 2016, the Legislature has provided
communities and regional planning commissions with an opportunity to have their approved municipal
plans receive greater weight under Section 248.
Challenges
Biomass Proper forest management is essential to sustainable woody biomass production. Much of the land
enrolled in the Current Use program in the TRORC Region is forested, and as such a forest management
plan is required. Most forest management plans are designed to encourage the growth of higher quality
wood which will yield a higher harvested value for the landowner. As a result, the bulk of what loggers
harvest out of these areas is lower quality wood.
While in many instances, the thicker “bowl wood” (stem of the tree, with no brush), can be used for
boiler chipping; the tops and branches of the trees are utilized primarily in generation plants such as the
power stations in Ryegate and Burlington. The challenge is that these two facilities, the only biomass
generation plants in Vermont, cannot utilize all of the low-quality product harvested out of our forests.
Attempts to develop new biomass energy generation facilities have taken place in the TRORC region, the
most recent of which was considered in Randolph. However, due to significant local resistance to these
Draft 10/5/16
44 | P a g e
facilities none have been built. The efficiency of large-scale biomass electricity generation facilities
remains a barrier as well. A highly efficient gasification biomass system loses roughly 60% of energy as
heat, generating only 40% as electricity.
Solar Siting Significant growth in the solar energy production sector in Vermont has sometimes led to a backlash against proposed facilities. The primary concern is one of aesthetics. For some, it is challenging to reconcile the appearance of a solar farm against the traditional rural character of the region. Residents may also perceive a loss of property value when a solar facility locates near their home, although there is no hard data available to support this perception. Also of concern are the natural resource implications of solar farms. Often these facilities are proposed in areas that are being used for agricultural purposes on valuable prime agricultural soils. While it is possible to conduct some forms of farming on land occupied by a solar system (such as small ruminant grazing – see Appendix E), most agricultural uses become impractical. For those farmers that lease land for feed production, the removal of actively used farmland from the pool of available land has the potential to negatively impact their operation.
Wind Siting Wind energy generation, although not as prolific as solar, also has opposition due to aesthetic and noise impacts. Because these facilities locate on ridgelines in order to maximize production, they are visible from a much greater distance than solar. Additionally, residents who neighbor a wind facility may experience negative effects from the noise and flicker of the spinning turbines45. Large scale wind energy facilities can have environmental impacts as well. Much of the land on our ridges is undeveloped, making it prime wildlife habitat. The installation of wind energy generation facilities and the infrastructure needed to maintain them (roads), leads to the fragmentation of continuous blocks of forestland, which can disrupt migration patterns for wildlife.
Hydro Siting As discussed earlier in this section, LEAP modeling suggests that that additional hydro capacity can be achieved by retrofitting existing dams. However, out of the total facilities with the potential to generate hydropower, 22 have been identified as having a “significant hazard potential.” The development of new hydroelectric projects is challenging. New hydro projects must seek permitting from the Federal government, which can be time consuming and intensive. Any development in our waterways requires a strict analysis of potential environmental impacts.
CPG Process is Complicated For many communities, the process of intervening in a CPG can be expensive, difficult and time consuming.46 The highly technical and legal nature of the CPG process can make it challenging for
45 Jeffery, Roy MD FCFP , Carmen Krogh, Brett Horner, Adverse health effects of Industrial Wind Turbines, Canadian Family Physician, 2013 46 Solar Siting Task Force Report, 2015

Draft 10/5/16
45 | P a g e
municipal officials to understand how to actively and effectively participate in the process. In the case of smaller solar energy generation facilities (<15kW) which are subject to an expedited CPG process, municipalities have no voice at all.
Unclear Regulatory Guidance Communities that have attempted to address renewable energy siting in their Municipal Plans have found the PSB’s decision making process unclear, due to the challenge of understanding what “due consideration” is. In cases such as PSB Docket #3188 (Cold River), the PSB provided confusing comments, indicating that “the Rutland Town Plan does not contain any written standard to preserve the scenic beauty of the proposed project site.” The decision discounted Rutland’s solar siting setback standards as “too specific” and bordering on zoning, which is not considered as part of the CPG process. While it is fair to say that Rutland’s approach may have not been well executed and ultimately had additional flaws that contributed to the PSB’s decision, the lack of clear guidance as to how communities can plan for renewable energy generation is a significant issue for our communities. In Dockett#8302 (Apple Hill), the PSB rejected a petition for a certificate of public good in Bennington, VT. The primary reason for the denial was based on the PSB’s determination that the proposed solar facility “violated a clear, written community standard” in the Bennington Town Plan as is defined under the Quechee Test47. The PSB explained that in order to be considered a clear, written community standard, it must be “intended to preserve the aesthetics or scenic beauty of the area” where the proposed project would be located and must apply to specific resources in the proposed project area. A clear written community standard must be more than simply “general in nature” and do more than seek “to promote good stewardship of scenic resources without identifying specific actionable standards.”
While some have seen this as a step in the right direction in terms of clarifying how the PSB makes decisions, some planners remain somewhat surprised that the language in the Bennington plan was deemed to meet the “clear written standard” test.
Solutions
Support Sustainable Biomass Generation With the closing of gasification facilities in Maine, the local market for low-grade wood has been
significantly impacted. By supporting and encouraging the development of sustainable biomass systems
in the region, TRORC can add another component of energy production in the Region and support the
sustainable forestry economy. Any new facilities should be located in areas where the significant waste
heat from electricity production can be utilized through district heating and cooling (through heat
pumps) or industrial applications.
Improve Regional and Municipal Energy Planning for Renewable Energy As long as the goals of the CEP remain a part of state policy and if Regional Planning Commissions and municipalities wish to play a part in achieving those goals, TRORC and municipalities should take an active role in energy planning. By utilizing available energy data produced by the Regional Commission and other organizations, municipalities can identify where renewable energy generation facilities are
47 Act 250’s Criterion 8 addresses aesthetic impact within the parameters of the so-called Quechee Analysis, which was established to provide a consistent and defensible method for evaluating the aesthetic impacts of projects undergoing Act 250 review.

Draft 10/5/16
46 | P a g e
preferred, and at what scale is most appropriate for reaching the goals of the CEP. In addition, Towns can provide specific standards that will help protect significant natural or scenic areas in accordance with the vision of the community.
Support Legislative Changes that Reward
Good Planning In the 2015 Solar Siting Task Force report, the Task Force indicated that it “seeks to strengthen the contribution that town and regional planning will make to the siting of solar generation contemplated in the state’s Comprehensive Energy Plan. Accomplishing this requires both effective regional and local planning for solar generation and the effective consideration of the guidance such planning offers in the Section 248 regulatory process...” Recognizing that this goal should apply to all forms of renewable energy, Act 174 (see sidebar) gives communities who take the time to consider their role in reaching the goals of the CEP more significant consideration under the Section 248 process. Good energy planning should continue to be recognized as requiring some level of GIS energy data analysis, the identification of areas where renewable energy generation is appropriate and the inclusion of language which provides clear, written standards for review under Section 248.
Renewable Energy Generation Goals,
Strategies and Actions
Goal #1: Meet 25% of remaining energy need from renewables by 2025, 40% by 2035 and 90% by
2050. Meet end-use sector goal of 67% renewable electricity by 2025.
Strategy: Support the continued development of renewable energy generation that counts toward the
goals of the CEP.
Action: Encourage communities to identify areas with the potential for renewable energy
generation.
Action: Provide education and outreach to municipalities on energy generation and siting.
Action: Develop easy to understand materials about the state’s energy goals and how they
interact with local and regional planning.
Goal #2: Increase the amount of renewable energy generated in the TRORC region to 163 MW by
2050.
Action: Develop a Renewable Energy Siting guide and maps and work with communities to
identify areas where renewable energy generation is appropriate and preferred.
Action: Identify locations within the region that are ideal locations for renewable energy
generation based on suitability of location and generation capability.
Act 174
Described as “an act relating to
improving the siting of energy
projects,” Act 174 seeks to improve the
integration of planning for energy and
land use, including creating an option
under which municipalities and
regional planning commissions may
engage in “enhanced energy planning”
that results in greater weight to their
plans in the energy siting process
before the PSB.
The Act also makes various
amendments to the siting process and
creates a pilot project that creates
incentives for renewable energy
projects located in “preferred
locations” as defined by the Act.

Draft 10/5/16
47 | P a g e
Action: Support and encourage state efforts to provide stable and predictable renewable
energy policy incentives including net metering and standard offer.
Action: Advocate for a stronger regional role in the PSB permitting process.
Actions: Continue to support efforts at the legislative level to strengthen the capacity of regional
planning commissions and municipalities to plan for renewable energy generation and provide
that information to the PSB and DPS in a manner that will be meaningful in the §248 CPG
process.
Actions: Identify areas where biomass energy generation facilities might be appropriate, and
support efforts to develop new facilities.

Draft 10/5/16
48 | P a g e
6. Commercial-Scale Renewable Energy Facility Siting
Guide
Background The growth of the renewable energy generation
industry in Vermont over the last five years has
been remarkable. As a measure of current growth
of commercial solar development in Vermont for
example, it took Green Mountain Power (GMP)
from 2008-2014 to hit a net metering cap of 4% of
peak load, and less than two years to reach the
increased cap of 15%.48 The proliferation of
commercial wind energy generation in Vermont has
been decidedly slower, primarily due to the costs of
development and the complicated permitting
requirements associated with it. Hydro
development has dropped off significantly since the
early 1990s, due to a number of factors including
the loss of economic incentives and stricter
permitting requirements.”49
The State of Vermont has spent a number of years
analyzing the issues relating to energy siting. In
2012, Governor Shumlin formed the Energy
Generation Siting Policy Commission. The Siting
Commission was tasked with developing
recommendations and guidance on best practices for the siting approval of large-scale renewable
energy generation projects (those projects that exceed the net metering threshold at the time), and for
public representation in the siting process. Ultimately, one of the key components of the Siting
Commission’s final report was an “increased emphasis on planning.”50
In 2015, in response to the rapid growth of solar development, the legislature created the Solar Siting
Task Force. In their report to the legislature in 2016, the Solar Siting Task Force echoed the
recommendations of the Siting Commission, acknowledging that “effective planning has the potential to
shape the municipal, regional and state energy future.”51
As this Regional Energy Plan has been developed, there are efforts underway at the legislative level to
provide more specific guidance for the regional and municipal energy planning. This guide is intended to
provide communities with the background, data and suggested approaches needed to effectively
48 Department of Public Service, Comprehensive Energy Plan, 2016 49 Ibid. 50 Energy Generation Siting Policy Commission, Siting Electric Generation in Vermont: Analysis and Recommendations, April 2013 51 Solar Siting Task Force, Solar Siting Task Force Report, January 22, 2016.
More Than Just Siting
This section is specifically focused on
the siting of renewable energy
facilities. Communities who are
seeking “Enhanced Energy Planning”
certification will need to consider
where to encourage and discourage
renewable energy generation facilities
as part of this certification.
It is important to remember, however,
that there is much more to meeting
the goals of the CEP than renewable
energy siting. Energy conservation and
efficiency are still essential
components to this process. Improved
weatherization, transportation and
land use policy will be but a few of the
parts of the puzzle.

Draft 10/5/16
49 | P a g e
address the impacts of renewable energy generation facilities while working toward the goals of the
Vermont Comprehensive Energy Plan.
Barriers to Good Planning Reports from the Siting Commission and the Solar Siting Task Force indicate that energy planning needs
to be improved at the regional and municipal level.
Unclear Guidance – As discussed in Section 5, Communities that have attempted to address
renewable energy siting in their Municipal Plans have found the PSB’s decision making process
confusing, due to the challenge of defining “due consideration”.
Planning is Not Mandatory – Land use planning is optional for municipalities unless a
community wants to adopt zoning or subdivision regulations.52 Even for those communities that
do have a Plan, it is not required that the Plan be consistent with the state’s planning goals
(Section 4302). While communities that have a Plan must address energy, and must have
policies that support renewable energy generation, there is no requirement that there be an in
depth analysis of potential locations for new facilities.
Difficulty Reconciling Renewable Energy Generation with Aesthetic and Natural Resource
Impacts – Many communities have grown resistant to the development of commercial-scale
renewable energy generation facilities because they feel that these facilities break with the
distinct rural character of their communities or negatively impact natural resources. While
renewable energy is by and large supported by Vermonters,53 the “not in my back yard”
phenomenon is not uncommon when a facility is proposed.
Important Considerations Before a community begins to plan for renewable energy generation facilities, it is essential to recognize
several things:
Consider “Enhanced Energy Planning”54 – Act 174 establishes rules that provide communities
with the opportunity to have their plans receive greater consideration (referred to as
“substantial deference”) under Section 248. Through the standards set by the Department of
Public Service, the Regional Commission is authorized to review municipal plans (when
requested) to determine if the state’s “Enhanced Energy Planning” standards are met. While
the specific criteria required for this certificate will not be made available by the Department of
Public Service until November of 2016, we know that communities will need to identify areas
where it is appropriate to develop renewable energy generation facilities and where it is not,
and why.
52 V.S.A.Title 24, §4381 - 53 Vermont Public Radio, VPR Poll, 2016 – 70% indicated support for a “large solar array” in their community. 56% indicated support for large wind power turbines in their community. 54 NOTE: This language reflects standards that will be released in November of 2016.

Draft 10/5/16
50 | P a g e
Completely prohibiting renewable energy generation facilities from your community, is
unlikely to be considered “in the public good.” –The primary purpose of the Section 248
process is to determine whether a proposed renewable energy generation facility successfully
meets the criteria required to determine that it is “in the public good.” Over the past several
years, statute has been revised to give communities a more significant voice in this process.
But, in the case of a Municipal Plan that attempts to outright prohibit (or has the effect of
prohibiting) renewable energy generation completely, will be seen by the Public Service Board
running counter to the “public good” concept.
Plans need firm language, and clear, written standards – General plan language that speaks of
protecting viewsheds or scenic areas is not useful to the PSB. Communities must use strict
language like “shall” and “must” to make it clear that a provision is mandatory. There must also
be clear standards that apply to all development within a specific area. Protected areas must be
clearly identified – you cannot say “all roads are scenic,” but instead must say something like
“The North Road is considered a scenic resource due to its open view of the eastern slope of the
Green Mountains.” Specificity with regard to what you are protecting, why you are protecting it
and where it is, is essential. For example:
o Bad Example: “Multi-family housing is discouraged in Rural Areas.” Not specific
enough.
o Good Example: “The location of multi-family housing in Rural Areas is not compatible
with this Plan.” This is a clear standard.
Define your Land Use Areas Clearly - In addition to judicious use of “shall” and “must,”
communities must carefully define land use areas in the Plan. This means having a clear
purpose statement, a clearly defined area that is tied into the purpose statement (usually
addressed in the map, with related narrative) and standards under which land should be
developed to achieve the purpose.
Identify Where Renewable Energy Generation is Preferred - Indicating good locations for
renewable energy generation that are clearly supported by the policies of the Plan is important.
Such an approach would clearly be consistent with legislative intent to encourage renewable
energy generation. By identifying where the preferred locations are or developing standards for
what constitutes a preferred site and why they are preferred, towns are providing clear
guidance to developers and the Public Service Board. Direct public support for preferred
locations as outlined in the municipal plan, will be appealing to developers.
Communicate with Developers – Most renewable energy generation developers are interested
in working with communities to ensure that their development is well-received.

Draft 10/5/16
51 | P a g e
How to Effectively Plan for Renewable
Energy Generation Facilities
Consider CEP Generation Targets The process should begin with an understanding of how your
community can work toward the goals of the CEP. Through
modeling and data analysis, TRORC has developed renewable
energy capacity targets that can be used to reach the goals of
the CEP (Appendix C). Communities should review this
information as a starting point to determine how much
renewable energy generation should occur in their
community to achieve the 90/50 goal.
It is important to understand that these targets are not exact.
The LEAP model is based primarily on demand. If population
is incorporated into the consideration, the targets will
increase. The recommended approach is to utilize a target
range for your community.
Utilize Available Map Data TRORC has generated map data that indicates where energy
generation potential exists for solar, wind and hydro55. This
data should be the starting point for the identification of
where renewable energy generation should be located within
your community.
Communities should review the Level 1 and 2 constraints (see
sidebar). If there are other constraints that your community
feels should be included, or should be reclassified (for
example, some communities may not view deeryards as a
Level 2 constraint), TRORC may be able to assist with map
revisions provided there is adequate funding available for the
service.56
Identify Preferred Locations The maps included as part of this guide were developed at the
regional scale. As such, they do not include preferred
locations. Communities should use their local knowledge to
55 A map of biomass land cover is included as well, but it is not a representation of potential beyond identifying what could be harvested for biomass energy production. 56 If funding through TRORC is unavailable, a Municipal Planning Grant could be used to fund this process.
Map Constraints (Level 1 & 2)
This data has been designed to
exclude certain areas based on
specific constraints (referred to
as Level 1 constraints). Level one
constraints include floodways and
river corridors, federal wilderness
area, rare and irreplaceable
natural areas, vernal pools and
class one and two wetlands. Any
area with potential for energy
generation that has a level one
constraint, has been removed
from the map layer.
Other areas that have generation
potential, but require
consideration in relation to their
natural resources, are identified
as Level 2 constraints. These
areas include agricultural and
hydric soils, conserved lands,
special flood hazard areas, deer
wintering areas and class 3
wetlands.
Areas with level two constraints
appear on the maps, but are not
identified as “Prime” areas (for
the purposes of this project,
“prime” is used to describe an
area of renewable energy
generation potential that is
unencumbered by either Level 1
or Level 2 constraints).

Draft 10/5/16
52 | P a g e
identify preferred areas first. They can include preferred locations as legislated in Act 174:
New or existing structures
Parking lot canopies
Previously developed tracts
Brownfields57
Sanitary landfills58
Existing dams
Disturbed portions of gravel pits59 or quarries
Sites listed on the National Priorities List (NPL)
Other considerations when identifying preferred areas within your community include existing
infrastructure. For example, an area with immediate access to three-phase power or an upland area
with existing road access may be more desirable than an area without.
Identify Significant Natural, Cultural, Historic or Scenic Resources Municipal plans are required to include “a statement of policies on the preservation of scenic and
historic features and resources.” If your Plan does not include an adequate inventory of these locations,
it will be important to identify them in the context of areas with the potential for renewable energy
generation. Such an inventory should include:
Historic sites, structures, districts, cultural landscapes
Archeological resources
Scenic viewsheds, ridgelines, specific road corridors; designated scenic byways
Places that have special meaning to the community
Areas with significant natural resources
It will be very important to identify exact locations as part of this plan. In past decisions of the PSB
relating to renewable energy generation facilities, it has been made clear that generalizations will not
carry weight with the Board. Protected areas must be clearly identified – a Plan cannot say “all roads
are scenic,” but instead must say something like “The North Road is considered a scenic resource due to
its open view of the eastern slope of the Green Mountains.” Specificity with regard to what are you are
protecting is essential.
Additionally, it will be important to describe why these areas are significant, whether because of the
presence of a known endangered species, or because the bulk of the community uses an area for
outdoor recreation. Documentation of the resource’s importance is necessary to developing a good
energy plan.
57 As certified by the Secretary of Natural Resources as defined under 10 V.S.A. §6602 58 As certified by the Secretary of Natural Resources as defined under 10 V.S.A. §6602 59 Provided that all activities pertaining to site reclamation required by law or by permit are satisfied before installation.

Draft 10/5/16
53 | P a g e
Involve the Public All good planning processes require public input beyond the
public hearings required by statute for Municipal Plans. Engaging
the public in discussions about potential changes to the Town
Plan early and often is strongly suggested as part of this guide.
Communities should consider:
Outreach: Place regular articles in the town newsletter or
local paper of record to give updates on what issues or
potential changes to the Plan are being discussed.
Collect Public Input: The best plans utilize multiple
methods to collect public input. Methods include (but
are not limited to):
o Written or online surveys
o Live surveys
o Public forums
o Coffee table discussion groups
o Targeted presentations
Present Proposals: As you work through the process, be
sure to keep the public involved. Multiple presentations
at varying intervals will keep people informed and allow
you to receive valuable input. This may allow you to
better refine your energy plan into something that
adequately reflects the community’s vision while still
working toward the goals of the CEP.
Find a Balance The state’s energy goals are written into statute, and it is a
requirement of statute that municipalities include policies on
renewable energy generation (as well as energy conservation).
Ideally, communities will see the positive benefits of working
towards the state’s energy goals, but it is important to strike a
balance between those goals and a community’s vision for the
future.
Bring it together Using map data and guidance from the public, your community
can write an energy plan that specifically addresses issues
relating to renewable energy generation. It can reflect the vision of your community and provide
adequate opportunity for growth of renewable energy generation that will reach the regional and state
targets.
Important things to consider
when soliciting input
Surveys – Written surveys must
be crafted so that they are easily
understood. Additionally, the
method of distribution must be
carefully considered so as to have
a maximum rate of return.
Online Surveys – Not all residents
have access to or are comfortable
using the internet. Online
surveys should never be the
primary method of data
collection.
Public Forums – Need to be well
organized and well run. Including
food as part of the program
(particularly for an evening
forum) can help increase
attendance.
Localized or “Coffee Table”
discussion groups – Bringing the
conversation to a specific part of
your community, particularly one
that has a particularized interest
in proposed changes can be
beneficial.
Targeted presentations – There
are many community groups that
can provide an excellent audience
and valuable input into your
process. This could include
church groups, local business
organizations, etc.

Draft 10/5/16
54 | P a g e
7. Appendices
Appendix A: LEAP System Modeling methodology and data report
Appendix B: Energy maps and mapping methodology
Appendix C: Regional Renewable Energy Generation Targets by Town
Appendix D: Renewable facility siting draft language, TRORC (Pending DPS Standards)
Appendix E: Solar siting and Agriculture, TRORC, UVM Center for Sustainable Agriculture (Pending)