regional economic scorecard - wilmington...
TRANSCRIPT
Produced for the community by:
Cape Fear FutureAn initiative of the Wilmington Chamber of Commerce
WILMINGTONREGIONAL ECONOMIC
SCORECARD|
||
||
||
||
||
|
| | | | | | | | | | | | | | | | | | | | | | | | | | | | ||
||
||
||
|| |2015

Building Regional ProsperityDuring the severe recession that began in 2008, our Region suffered major
job losses. The recovery which began mid-year 2009 differed from previous
recoveries, with job creation being especially weak. As we monitored those losses
and the anemic recovery, we looked to other regions to learn how they measured
their economic growth and development. Many produce regional scorecards
in order to assess themselves without bias, and our Cape Fear Future board
determined that it was time for our Region to evaluate itself in the same fashion.
This 2015 Regional Economic Scorecard is intended to provide our Region’s
business, governmental, community and academic leaders with objective data for
use in addressing our top development opportunities and challenges.
Our Scorecard will be published annually, so that we may measure our
progress in the key areas of economic development outcomes, human
capital, innovation and entrepreneurship and quality of place. The research,
conducted by Dr. Adam Jones and UNCW’s Swain Center, reflects data
collected from New Hanover, Pender and Brunswick counties.
Our task team selected our “comparative” cities based on population size
as well as a diverse mix of economic assets comparable to our Region.
Charleston and Raleigh were selected as “aspirational” cities – that is, cities
which are not strictly comparable but are well known to people in our Region
and have had recent success in economic development.
How Do We Define the “Wilmington Region?”Historically, the Wilmington MSA has been comprised of New Hanover,
Pender, and Brunswick Counties. In 2012, the federal Office of Management &
Budget removed Brunswick County from the Wilmington MSA and realigned
it as part of the Myrtle Beach MSA. Nonetheless, for purposes of this
Scorecard, it was determined that, where feasible, Brunswick County should
be included in the Wilmington Region’s data. Much of the data reported in
this Scorecard is available on a county level and aggregated to the three-
county “Wilmington Region.” However, Gross Regional Product, a major
economic indicator, is only available at an MSA level. Brunswick County’s
contribution to the Wilmington Region’s GRP was determined through
estimation. In instances where data is reported only on an MSA level and
no estimation has been made for Brunswick County, the two-county (New
Hanover and Pender) data is indicated by the notation “Wilmington MSA.”
Key TakeawaysThe Wilmington Region is exhibiting relatively moderate economic growth, but
has transformational opportunities in entrepreneurship and innovation. Our
quality of place has attracted a talented workforce, despite relatively low annual
pay and slow per capita income growth. Wilmington has enjoyed a reasonably
diverse economy with strong sectors in pharmaceuticals/CROs, healthcare, retail,
and film, although generally our traded sector lags that of our comparative peers.
1. Employment: Our economy is growing in absolute terms, but adjusted for
population growth, the level of economic activity is relatively steady.
2. Large Business v. Small Business: The data show that the Wilmington
Region’s small business sector is very strong. While this indicates a
positive entrepreneurial environment, it also reflects a relative lack of
traded-sector businesses which tend to pay higher wages and grow
regional wealth.
3. Entrepreneurship: The Region has good entrepreneurial growth,
supported organically by the community and by UNCW’s CIE, tech
transfer at UNCW, and privately-owned incubators. However, the data
suggests a lack of growth in small business and an emphasis on the
service and non-traded sectors.
4. Film Industry: This desirable, traded-sector industry is at risk to be lost to
other states which use enhanced tools to attract productions.
2 | Wilmington Regional Economic Scorecard
Introduction
“Developing goals that will enable economic progress can’t be
accomplished without having a baseline of where our Region
stands, especially against peer cities that compete with us
for skilled workers, new business, and the entrepreneurs and
mobile workforce that are driving the new world economy.
This economic scorecard will be a valuable tool in establishing
a clear focus on our Region’s challenges and opportunities,
and, more importantly, can help develop a concerted effort
between our economic development organizations and
leaders to address our needs. Tracking progress on an annual
basis will keep us centered and focused on improving the key
areas that will lead to long-term economic prosperity.”
Michele HolbrookPlant Manager, Corning Incorporated

How to Read the DataThe report examines many indicators of regional economic competitiveness.
Each indicator is compared to the national average. For example, an index of
110 for our Region means that our Region is performing 10% above the U.S.
average. Likewise, an index of 90 means our Region is performing 10% below
the U.S. average.
The report follows the Model for Economic Prosperity Pyramid developed
by Clemson University professors David Barkley and Mark Henry, which
illustrates the building blocks of economic success. The 2015 Regional
Economic Scorecard assesses the economic development outcomes and
competitiveness inputs from the top and bottom of the pyramid model.
Because of the time lag in data availability, this 2015 report highlights data
captured from 2010-2014.
Wilmington Regional Economic Scorecard | 3
Our Comparative Locations
Model for Economic ProsperityEconomic Development Outcome• Economic Output
• Employment
• Earnings & Income
Environment for Development• Industrial Composition
• Physical Infrastructure
• Social, Cultural &
Institutional Environment
Competitiveness Inputs• Human Capital
• Innovative Activity
• Entrepreneurial Environment
• Quality of Place
A task force of business and community leaders selected seven metropolitan areas based on population and
a mix of economic assets comparable to the Wilmington Region. Charleston and Raleigh were selected as
aspirational cities due to their exceptional growth and ability to maintain quality of place.
AspirationalComparative
Asheville, NChigher education, healthcare, arts and culture, tourism, and entrepreneurial environment
Chattanooga, TNhigher education, tourism,
historic, redeveloped riverfront, and arts and culture
Myrtle Beach, SCtourism and entertainment
Roanoke, VAhealthcare, tech research and
higher education
Savannah, GAseaport, working river, military,
creative economy, tourism industry, and coastal location
Pensacola, FLtourism, arts and culture,
business growth, seaport, and coastal location
Mobile, ALseaport, transportation, coastal
location, manufacturing, and foreign investment presence
Charleston, SCtourism, strong manufacturing
base, seaport, higher education, coastal, and working river
Raleigh, NChigher education, technology,
pharmaceutical, and telecommunications
4 | Wilmington Regional Economic Scorecard
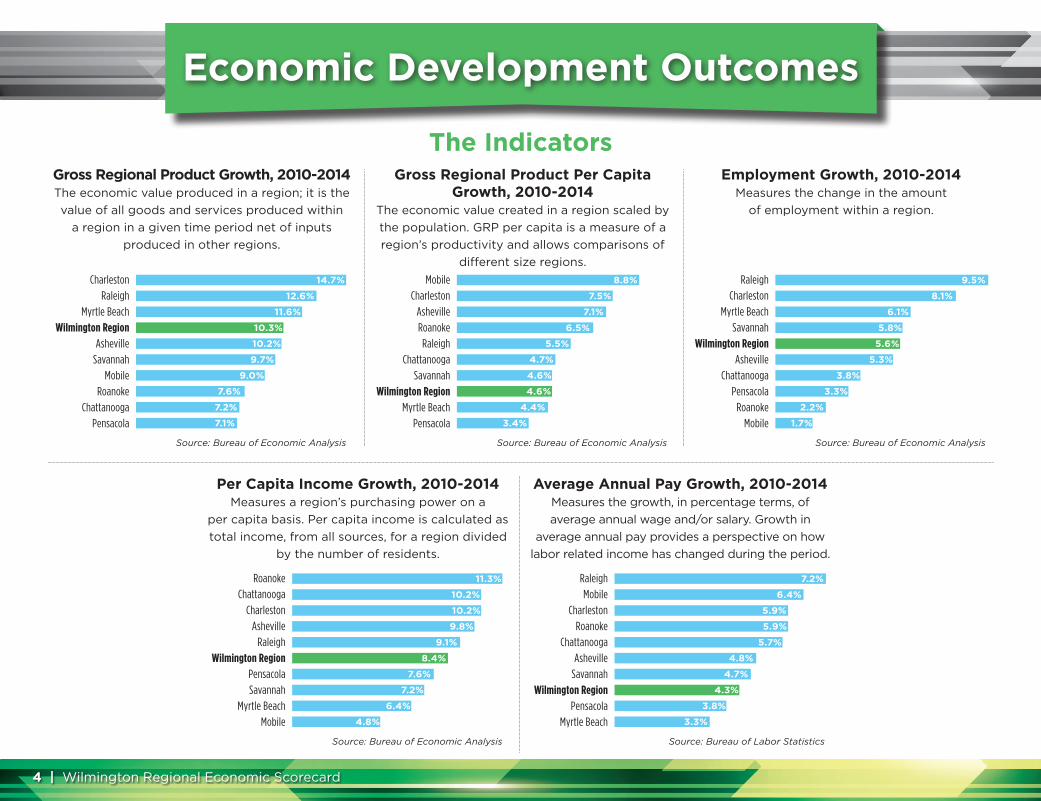
Economic Development Outcomes
The IndicatorsGross Regional Product Growth, 2010-2014The economic value produced in a region; it is the
value of all goods and services produced within
a region in a given time period net of inputs
produced in other regions.
Gross Regional Product Per Capita Growth, 2010-2014
The economic value created in a region scaled by
the population. GRP per capita is a measure of a
region’s productivity and allows comparisons of
different size regions.
Employment Growth, 2010-2014Measures the change in the amount
of employment within a region.
Average Annual Pay Growth, 2010-2014Measures the growth, in percentage terms, of
average annual wage and/or salary. Growth in
average annual pay provides a perspective on how
labor related income has changed during the period.
Per Capita Income Growth, 2010-2014Measures a region’s purchasing power on a
per capita basis. Per capita income is calculated as
total income, from all sources, for a region divided
by the number of residents.
Charleston
Raleigh
Myrtle Beach
Wilmington RegionAsheville
Savannah
Mobile
Roanoke
Chattanooga
Pensacola
Raleigh
Charleston
Myrtle Beach
Savannah
Wilmington RegionAsheville
Chattanooga
Pensacola
Roanoke
Mobile
Raleigh
Mobile
Charleston
Roanoke
Chattanooga
Asheville
Savannah
Wilmington RegionPensacola
Myrtle Beach
Roanoke
Chattanooga
Charleston
Asheville
Raleigh
Wilmington RegionPensacola
Savannah
Myrtle Beach
Mobile
14.7%
12.6%
11.6%
10.3%
10.2%
9.7%
9.0%
7.6%
7.2%
7.1%
8.8%
7.5%
7.1%
6.5%
5.5%
4.7%
4.6%
4.6%
4.4%
3.4%
Source: Bureau of Economic Analysis Source: Bureau of Economic Analysis Source: Bureau of Economic Analysis
Source: Bureau of Economic Analysis
Mobile
Charleston
Asheville
Roanoke
Raleigh
Chattanooga
Savannah
Wilmington RegionMyrtle Beach
Pensacola
9.5%
8.1%
6.1%
5.8%
5.6%
5.3%
3.8%
3.3%
2.2%
1.7%
11.3%
10.2%
10.2%
9.8%
9.1%
8.4%
7.6%
7.2%
6.4%
4.8%
7.2%
6.4%
5.9%
5.9%
5.7%
4.8%
4.7%
4.3%
3.8%
3.3%
Source: Bureau of Labor Statistics
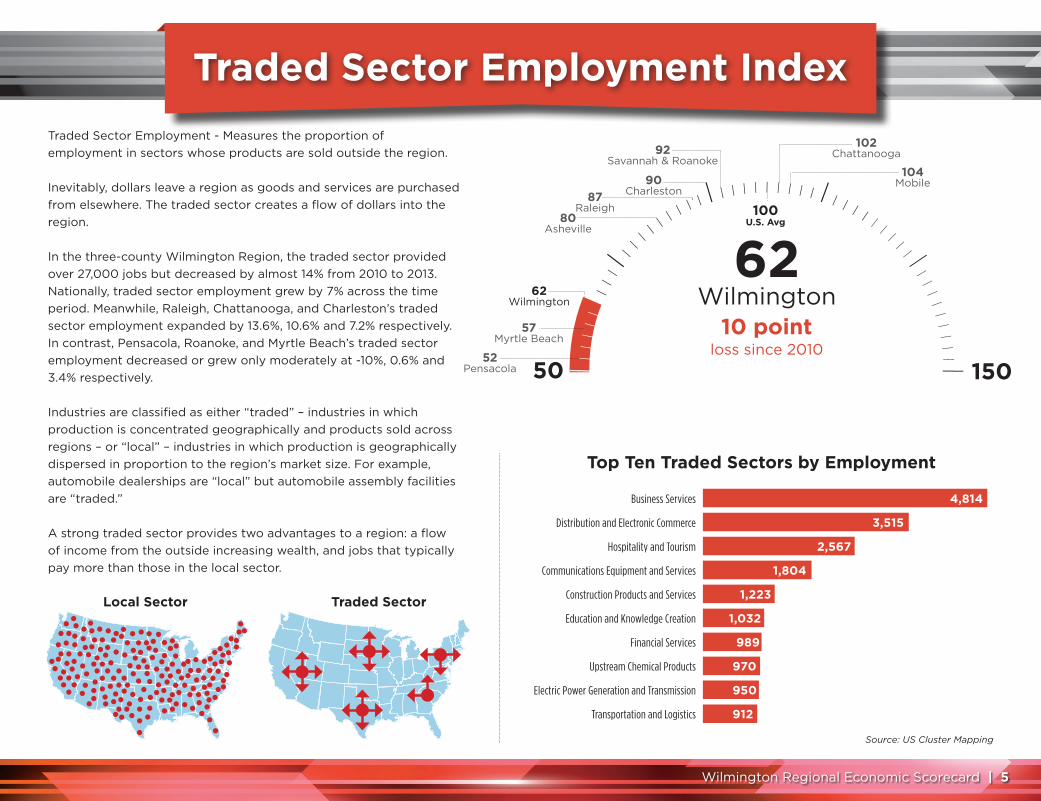
Traded Sector Employment - Measures the proportion of
employment in sectors whose products are sold outside the region.
Inevitably, dollars leave a region as goods and services are purchased
from elsewhere. The traded sector creates a flow of dollars into the
region.
In the three-county Wilmington Region, the traded sector provided
over 27,000 jobs but decreased by almost 14% from 2010 to 2013.
Nationally, traded sector employment grew by 7% across the time
period. Meanwhile, Raleigh, Chattanooga, and Charleston’s traded
sector employment expanded by 13.6%, 10.6% and 7.2% respectively.
In contrast, Pensacola, Roanoke, and Myrtle Beach’s traded sector
employment decreased or grew only moderately at -10%, 0.6% and
3.4% respectively.
Industries are classified as either “traded” – industries in which
production is concentrated geographically and products sold across
regions – or “local” – industries in which production is geographically
dispersed in proportion to the region’s market size. For example,
automobile dealerships are “local” but automobile assembly facilities
are “traded.”
A strong traded sector provides two advantages to a region: a flow
of income from the outside increasing wealth, and jobs that typically
pay more than those in the local sector.
Traded Sector Employment Index
Wilmington Regional Economic Scorecard | 5
| |||||
|||| |
|
||| |
| || | | | | | | | | | | | | | | | | |
|
|| |
||||||||| |
57Myrtle Beach
52Pensacola
92Savannah & Roanoke
80Asheville
50 150
90Charleston87
Raleigh 100U.S. Avg
62Wilmington
10 pointloss since 2010
104Mobile
102Chattanooga
Top Ten Traded Sectors by Employment
Business Services
Distribution and Electronic Commerce
Hospitality and Tourism
Communications Equipment and Services
Construction Products and Services
Education and Knowledge Creation
Financial Services
Upstream Chemical Products
Electric Power Generation and Transmission
Transportation and Logistics
Source: US Cluster Mapping
Local Sector Traded Sector
4,814
3,515
2,567
1,804
1,223
1,032
989
970
950
912
62 Wilmington
| |||||||||| |
|
||| |
| || | | | | | | | | | | | | | |
| ||
|| |
||||||||| |
81Myrtle Beach
109Wilmington
1 pointgain since 201075 125
89Mobile
92Pensacola
94Chattanooga
98Savannah
118Raleigh
109Wilmington
100Asheville
100U.S. Avg
104Charleston & Roanoke
6 | Wilmington Regional Economic Scorecard
Our Region’s long-term success and global
competitiveness depends on our ability to produce,
attract and retain talent. A skilled workforce is crucial to
the success of existing businesses and will attract new
employers in our target industries.
The more talented the workforce, the better businesses
can address new opportunities and overcome negative
challenges, such as the recent recession. Positive changes
in the Human Capital Index should directly correlate with
positive changes in the Innovation Index.
Today’s workforce is more mobile than in the past, and Gen Xers and Millennials
are more apt to choose where they want to live first while finding employment
second. Quality of place is helping our Region attract
talent, as is the presence of strong industry sectors
in pharmaceuticals/CROs, healthcare and education.
Wilmington’s film industry has also had a notable influence
over recent years.
The Wilmington Region’s educational attainment
fares well against all cities studied, and an exceptional
percentage of knowledge workers shows that quality of
place is having a positive influence on talent attraction.
Opportunities to further engage these talented workers
exist, and could increase Wilmington’s Innovative Activity and Entrepreneurial
Environment Indexes through the creation of startups, products and needed
jobs.
Human Capital Index
125
Wilmington Regional Economic Scorecard | 7
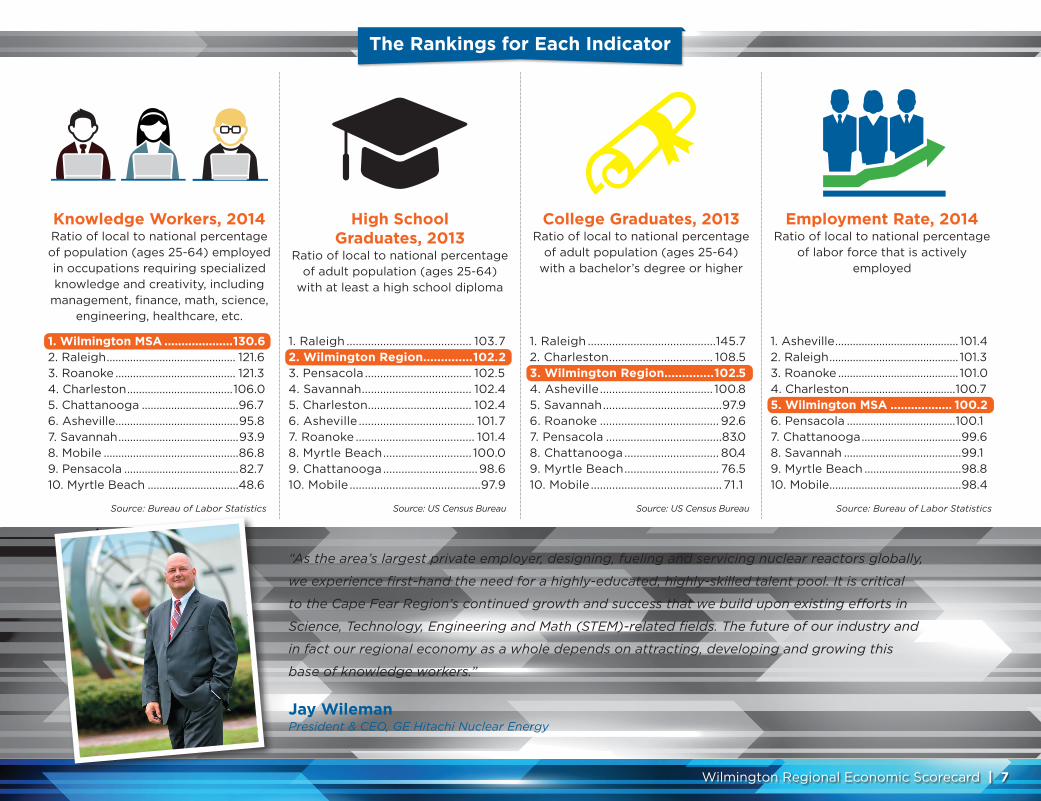
Knowledge Workers, 2014Ratio of local to national percentage of population (ages 25-64) employed in occupations requiring specialized knowledge and creativity, including
management, finance, math, science, engineering, healthcare, etc.
High School Graduates, 2013
Ratio of local to national percentage of adult population (ages 25-64)
with at least a high school diploma
“As the area’s largest private employer, designing, fueling and servicing nuclear reactors globally,
we experience first-hand the need for a highly-educated, highly-skilled talent pool. It is critical
to the Cape Fear Region’s continued growth and success that we build upon existing efforts in
Science, Technology, Engineering and Math (STEM)-related fields. The future of our industry and
in fact our regional economy as a whole depends on attracting, developing and growing this
base of knowledge workers.”
Jay WilemanPresident & CEO, GE Hitachi Nuclear Energy
College Graduates, 2013Ratio of local to national percentage
of adult population (ages 25-64) with a bachelor’s degree or higher
Employment Rate, 2014Ratio of local to national percentage
of labor force that is actively employed
1. Wilmington MSA ....................130.62. Raleigh ............................................ 121.63. Roanoke ......................................... 121.34. Charleston ....................................106.05. Chattanooga .................................96.76. Asheville ..........................................95.87. Savannah .........................................93.98. Mobile ..............................................86.89. Pensacola .......................................82.710. Myrtle Beach ...............................48.6
1. Raleigh ......................................... 103.72. Wilmington Region ..............102.23. Pensacola ................................... 102.54. Savannah .................................... 102.45. Charleston .................................. 102.46. Asheville ...................................... 101.77. Roanoke ....................................... 101.48. Myrtle Beach ............................. 100.09. Chattanooga ...............................98.610. Mobile ...........................................97.9
1. Raleigh ..........................................145.72. Charleston .................................. 108.53. Wilmington Region ..............102.54. Asheville ..................................... 100.85. Savannah .......................................97.96. Roanoke ....................................... 92.67. Pensacola ......................................83.08. Chattanooga ............................... 80.49. Myrtle Beach ............................... 76.510. Mobile ........................................... 71.1
1. Asheville .......................................... 101.42. Raleigh ............................................ 101.33. Roanoke ......................................... 101.04. Charleston ....................................100.75. Wilmington MSA .................. 100.26. Pensacola .....................................100.17. Chattanooga ..................................99.68. Savannah ........................................99.19. Myrtle Beach .................................98.810. Mobile .............................................98.4
The Rankings for Each Indicator
Source: Bureau of Labor Statistics Source: US Census Bureau Source: US Census Bureau Source: Bureau of Labor Statistics

| |||||||||| |
|
||| |
| || | | | | | | | | | | | | | | | | |
|
|| |
||||||||| |
10Myrtle Beach
19Savannah
22Asheville
0 200
84Charleston
30Mobile
41Pensacola
53Wilmington
189Raleigh
100U.S. Avg
28Chattanooga & Roanoke
8 | Wilmington Regional Economic Scorecard
Innovation is critical to developing a region’s
competitive advantage. An environment that generates
new ideas, products and processes encourages
the creation of new businesses, provides growth
opportunities for existing businesses, and encourages
relocation of cutting-edge businesses. The result is often
new, higher-wage jobs for area residents.
Positive changes in our Innovative Activity Index will be
fueled by graduating, retaining and attracting talent with
needed workforce skills, particularly knowledge and STEM workers.
There is a staggering disparity within the peer and aspirational cities in the
Innovative Activity data sets, with ranges as broad as 0 to 233. Overall the
Wilmington Region does well against its peer cities, leading in nearly every
area. Despite losing ground against the national average
since 2010, Wilmington still shows good employment
levels in technical positions, moderate activity in issuance
of patents, and reasonably strong performance in
the ratio of local to national science-related graduate
students.
In Raleigh’s rankings, influence of North Carolina
State University and some from the Research Triangle Park
(RTP)* is present in the contrast in both patents issued
and NIH/NSF/NEA funding. It should be noted that the NIH/NSF/NEA funding
figures are based on only one year of data, thereby creating the potential that
one large grant could skew the outcomes and create large fluctuations on
an annual basis. NC State University factors prominently in Raleigh’s ratio of
science-related graduate students.
* RTP is divided between Wake and Durham MSAs.
Innovative Activity Index
53Wilmington
18 pointloss since 2010

Wilmington Regional Economic Scorecard | 9
Employment in Technical Positions, 2014
Ratio of local to national percentage of employment in computer, science,
and engineering occupations
NIH/NSF/NEA Funding, 2014
Ratio of local to national funding from NIH, NSF, and NEA per local job
“The Innovative Activity Index represents a critical component in regional economic analysis.
The report provides entrepreneurs and investors with much-needed information about the area’s
capacity to support innovation. Empowered by the report’s results, regional leaders are better
positioned to make data-driven decisions about our vision and goals for increasing economic
growth across Southeastern North Carolina.”
Jose V. “Zito” SartarelliChancellor, University of North Carolina Wilmington
Patents Issued, 2013Ratio of local to national, number of patents issued in an area, per 10,000
workers
Science Related Graduate Students, 2013
Ratio of local to national graduate students in health science, science,
and engineering per 10,000 residents
1. Raleigh ............................................ 152.32. Charleston ...................................... 97.83. Wilmington Region ................ 73.44. Roanoke ..........................................66.65. Chattanooga .................................63.26. Pensacola ...................................... 60.57. Mobile ...............................................59.88. Savannah ........................................59.09. Asheville ..........................................45.410. Myrtle Beach ...............................22.4
1. Charleston ..................................... 186.22. Raleigh .............................................83.23. Mobile ..............................................43.14. Wilmington Region .................. 6.15. Roanoke ............................................4.96. Chattanooga ................................... 2.37. Asheville ............................................ 2.18. Savannah ........................................... 1.89. Pensacola .........................................0.510. Myrtle Beach .................................0.0
1. Raleigh ........................................... 263.62. Wilmington Region ................ 43.23. Roanoke ..........................................38.54. Asheville ......................................... 37.0 5. Charleston .......................................31.36. Pensacola .......................................22.37. Chattanooga ...................................21.08. Mobile ...............................................19.59. Myrtle Beach .................................. 17.610. Savannah ........................................ 12.3
1. Raleigh .........................................234.02. Wilmington Region ............... 85.93. Pensacola ..................................... 79.24. Charleston ................................... 35.65. Chattanooga ................................ 21.86. Asheville ......................................... 0.07. Roanoke .......................................... 0.08. Savannah ........................................ 0.09. Myrtle Beach ................................. 0.010. Mobile ............................................ 0.0
The Rankings for Each Indicator
Source: Bureau of Labor Statistics Source: NIH, NSF, NEA, Bureau of Economic Analysis Source: U.S. Patent & Trademark Office, Bureau of Economic Analysis
Source: NSF Survey of Graduate Students and Postdocs in Science and Engineering
$

| |||||||||| |
|
||| |
| || | | | | | | | | | | | | | |
| ||
|| |
||||||||| |75 125
87Mobile
92Asheville
84Pensacola
94Myrtle Beach
78Savannah
82Chattanooga & Roanoke
105Charleston
108Wilmington100
U.S. Avg
104Raleigh
10 | Wilmington Regional Economic Scorecard
Entrepreneurs flourish in a supportive environment,
adding to a region’s new business creation and growth.
An unfavorable climate may drive away startups, leading
them to seek more hospitable communities.
Growth of small businesses – in particular the Business
Services Sector – is dependent on the continued
growth of the Region’s GRP and economic engines
of growth, including (but not limited to) the industry
clusters identified in the Garner Report: life/marine
sciences research and development, high-value office operations, precision
manufacturing, and aircraft assembly, modification and maintenance.
The Wilmington Region’s first-place ranking in Entrepreneurial Environment,
slightly above even the aspirational cities of Charleston and Raleigh, is likely
cause for both celebration and concern. While there is clearly a growing and
desirable base of entrepreneurial activity with the ability to grow into larger
businesses providing well-paying jobs, too many of our area’s entrepreneurial
ventures are service-based, will never grow beyond a
handful of employees, and don’t add significantly to the
tax base. The data suggests what many have seen as a
core problem for some time - people wishing to stay in
the area are often unable to find suitable employment, so
they are forced to create their own jobs.
Nonetheless, entrepreneurial spirit is a positive asset for
our Region, and organizations like the UNCW Center
for Innovation & Entrepreneurship, the Small Business
Technology Development Center, UNCW’s CREST Research Park, and
privately owned entities like Castle Branch’s tekMountain incubator and
Elite Innovations’ Makerspace are providing valuable support for start-ups,
with the goal of helping them grow into larger ventures. Supporting and
expanding our Region’s innovation assets should yield positive results. A
notable example is the community’s support for Cucalorus Connect, a 3-day
conference on capital, entrepreneurship, innovation and entertainment with a
focus on the intersection between business and creativity.
Entrepreneurial Environment Index
108Wilmington
3 pointloss since 2010

Wilmington Regional Economic Scorecard | 11
Concentration of Small to Mid-size Businesses, 2013Small to mid-size firms per 1,000
employees relative to national ratio
Total Establishments, 2013Total establishments per 1,000
employees relative to national ratio
“Entrepreneurism lives in the heart of all good communities across America and while it
may seem like a trend in some communities, it has been commonplace for Wilmington.
Our community, for the last few years, has redefined itself and turned our sign around to
OPEN for Businesses. Funds are available, talent is building, tech is alive and the pockets
of entrepreneurs are spreading from river to ocean. It’s exciting to watch and even more
exciting to be a part of the build.”
Shaun OlsenPresident, CLOUDWYZE, INC
Proprietor’s Income Share, 2013
Business owner’s income as a percentage of total income for the area relative to national percentage
Business Services, 2013Percentage of business services
employment to total employment relative to national percentage
1. Wilmington Region .............. 137.52. Myrtle Beach ..............................136.73. Asheville ......................................123.84. Pensacola .....................................118.95. Charleston .................................. 108.66. Raleigh ........................................ 103.77. Savannah .................................... 100.68. Roanoke........................................94.19. Mobile ............................................. 91.610. Chattanooga ............................. 83.7
1. Wilmington Region .............. 137.32. Myrtle Beach ..............................136.53. Asheville ......................................123.74. Pensacola .....................................118.75. Charleston .................................. 108.56. Raleigh ........................................ 103.77. Savannah .................................... 100.58. Roanoke........................................94.19. Mobile ............................................. 91.710. Chattanooga ............................. 83.8
1.Charleston ....................................... 121.12. Wilmington Region ................112.73. Chattanooga ...............................109.64. Raleigh .......................................... 103.85. Mobile ..............................................93.16. Asheville ..........................................83.27. Myrtle Beach ..................................76.98. Roanoke ...........................................61.49. Savannah ....................................... 60.010. Pensacola ......................................35.5
1. Raleigh ......................................... 106.42. Charleston ....................................80.43. Roanoke ........................................ 76.74. Mobile ........................................... 72.75. Pensacola ..................................... 63.56. Chattanooga ................................ 51.97. Savannah ......................................50.38. Wilmington Region............... 43.09. Asheville ....................................... 36.310. Myrtle Beach ............................. 24.5
The Rankings for Each Indicator
Source: US Census Bureau Source: US Census Bureau Source: Bureau of Economic Analysis Source: US Cluster Mapping

| |||||||||| |
|
||| |
| || | | | | | | | | | | | | | | | | |
|| |
||||||||| |50 150
91Pensacola
134Asheville
120Roanoake124
Wilmington
104Charleston
107Raleigh & Myrtle Beach
92Mobile
93Chattanooga
100Savannah
100U.S. Avg
124WilmingtonNo change
since 2010
12 | Wilmington Regional Economic Scorecard
Global competition has made attracting and retaining
a talented workforce one of the most critical issues in
economic development. Highly educated workers aren’t
bound by location. Strong demand for their skills allows
flexibility in where they choose to live and work to a
greater extent than any other time in history.
One of the Wilmington Region’s biggest assets is quality
of place, including its beaches, riverfront, the largest
historic district in the state, and an enviable climate. Wilmington also
scores very well on less subjective factors such as culture and recreation,
healthcare access, and air quality. The relatively high percentage of healthcare
practitioners per capita is likely influenced by the attraction of quality of place
in luring medical professionals to the area, although our Region’s growing
retiree demographic is also likely a driver of the healthcare sector.
Measuring a community’s arts and entertainment assets using NAICS Code
71 captures not only traditional urban arts and entertainment activity,
but other elements as well, such as tourist-oriented
entertainment and the movie, television and film
industry. Myrtle Beach’s focus on creating a vacation
destination accounts for its high ranking in arts and
entertainment employment. The Wilmington Region’s
strength in this category is likely due to the influence
of our tourism industry as well as our historically robust
film industry. The extent to which the recent changes
to our state’s film incentives program and increased
competition from other states negatively affect the Wilmington Region’s
arts and entertainment employment remains to be seen.
Although an informal poll of Wilmington drivers might not support this
conclusion, the data shows that our Region’s rush-hour travel time ranks
in the middle of the pack relative to our comparative cities. However,
foreseeable growth in the Region, especially in Brunswick County, remains a
concern, and rush-hour travel times will likely suffer in the mid- to long-term
without additional investments in our regional transportation infrastructure.
Quality of Place Index

Wilmington Regional Economic Scorecard | 13
Culture and Recreation, 2013
Percent of employment in the arts, entertainment, and recreation
(NAICS 71) relative to national percentage
Healthcare Access, 2013Number of healthcare practitioner and technical positions per capita
relative to national average
“Our quality of place is crucial as we compete with other regions for the same
skilled workforce. Wilmington continues to be an attractive option for retirees.
Over 50% of the residents in our senior living communities in-migrated from
outside this area. Attracting and retaining a talented workforce is more
difficult. Highly-educated workers and retirees come here for the same
reasons, not just our mild climate and beaches, but also the artistic, cultural,
and historical offerings. These assets, along with high quality hospitals and
overall healthcare services, also drive more medical professionals to the area.
Maintaining our transportation infrastructure is an obstacle we face as our
Region grows. Short commutes between moderately priced housing and
employment centers are crucial for young professionals and the long-term
growth of the entire workforce.”
Will PurvisChief Development Officer, Liberty Healthcare Management, Inc.
Crime Rate, 2012Violent crimes per capita relative to
national crime rate (higher number means less crime)
Rush Hour Travel Times, 2013
Average commute time of workers leaving home between 6:00-8:30 AM
relative to national average (higher number means less travel time)
Air Quality, 2013Percentage of days with air quality
measured as “good” relative to national average.
1. Myrtle Beach ...............................193.22. Asheville ......................................142.23. Wilmington Region ..............130.74. Raleigh ......................................... 110.45. Charleston ....................................98.66. Pensacola ..................................... 92.67. Savannah .......................................87.48. Chattanooga ............................... 72.49. Roanoke........................................69.010. Mobile .......................................... 58.0
1. Roanoke .........................................160.02. Wilmington MSA ....................143.13. Asheville ....................................... 137.44. Charleston ................................... 125.95. Chattanooga ................................123.16. Mobile .............................................110.87. Savannah ...................................... 102.28. Pensacola ......................................96.79. Raleigh ...........................................88.910. Myrtle Beach ..............................52.4
1. Asheville, NC ............................... 173.72. Raleigh, NC .................................158.03. Roanoke, VA ...............................153.04. Wilmington Region ............. 127.35. Savannah, GA .............................118.96. Charleston, SC ............................ 93.77. Myrtle Beach, SC .........................77.28. Chattanooga, TN ....................... 76.09. Mobile, AL .................................... 70.610. Pensacola, FL ............................66.6
1. Wilmington Region ............. 104.92. Mobile .......................................... 104.93. Roanoke ........................................99.94. Myrtle Beach ...............................99.05. Charleston ....................................98.06. Asheville .......................................96.67. Pensacola ..................................... 89.38. Savannah ......................................84.69. Chattanooga ............................... 79.710. Raleigh .........................................77.0
1. Asheville ........................................119.12. Roanoke ........................................118.03. Myrtle Beach ...............................115.44. Mobile ...........................................113.35. Wilmington Region...............113.06. Chattanooga ...............................112.17. Pensacola .................................... 110.48. Savannah .................................... 109.29. Charleston ................................. 102.910. Raleigh ...................................... 100.9
The Rankings for Each Indicator
Source: Bureau of Economic Analysis Source: Bureau of Labor Statistics Source: Federal Bureau of Investigation/ICPSR Source: US Census Bureau
Source: US Environmental Protection Agency
TICKET

14 | Wilmington Regional Economic Scorecard
About the Wilmington Chamber of CommerceThe Wilmington Chamber of Commerce is the
largest membership-based business association
in Southeastern North Carolina. Our mission
is to ensure economic prosperity throughout
the Region. This is accomplished by creating a
diverse organization that serves as a strong voice
for businesses in the Greater Wilmington area;
offering unique membership benefits, services
and education; and challenging government
officials to address long-term community and
business interests. Our mission is enhanced through proactive leadership and
partnerships throughout our Region.
Despite governmental chartering, the Wilmington Chamber is not a
governmental entity. Instead, the Chamber has a long tradition of activity
in North Carolina as a membership-based, nonprofit organization of diverse
membership. Members and volunteers share the goals of improving the
economy and enhancing the overall quality of life in our community by
harnessing the collective vision and power of local business.
About Cape Fear Future The Chamber’s flagship initiative, Cape Fear
Future (CFF), began as an idea developed at
the Wilmington Chamber of Commerce Board
of Directors 2006 Retreat to further develop
the Cape Fear region’s knowledge sector economy to promote economic
development and ensure the future prosperity of the Region. The effort is
helping the Region keep stride with globalization and remain competitive with
other cities vying for skilled workers. The world has witnessed the impact that
the knowledge sector has had on economic growth through the development
of new businesses, business models, and technological innovation.
Priority areas for CFF include:
• Quality of Life: improve area amenities to attract and retain knowledge
sector workers, and design and develop strategies and plans aimed at
improving the special characteristics of Wilmington’s quality of place;
• Entrepreneurship: help foster job creation through support of UNCW’s
Center for Innovation and Entrepreneurship; and
• Education & Workforce Development: improve K-12 education with STEM
(science, technology, engineering, mathematics) integration to better
prepare and equip our future workforce.
Recent CFF initiatives have included:
• Starting the STEM program Project Lead The Way at Trask Middle School
and funding the program for 6th, 7th and 8th grade classes;
• Providing substantial funding for UNCW’s Center for Innovation and
Entrepreneurship;
• Advocating for additional open space and a signature park in downtown
that helped lead to the expansion and revitalization of Riverfront Park and
the purchase of new park space adjacent to the Wilmington Convention
Center;
• Hosting the Crime Hurts Kids…and Business event to fund the Youth
Enrichment Zone Summer Initiative aimed at reducing summer learning
loss in at-risk youth;
• Partnering with UNCW on creation of a new website that lists area STEM
resources; and
• Creation of this Economic Scorecard to provide our Region’s business,
governmental, community and academic leaders with unbiased data to
help focus a collective effort to address our challenges and highlight
strengths.
“The importance of attracting and
keeping talented folks in Wilmington
cannot be understated. We need the
next generation of workers prepared
for a high-tech work environment, and
investments to that end will reap huge
rewards for the businesses in our area.
It is investments like these that have
benefitted Live Oak, and supported
our rapid growth, as they say ‘a rising
tide floats all boats.’ From the UNCW
Cameron School of Business, to many
other professional development
programs, our community is up for the
challenge of meeting these demands.”
Chip MahanChairman & CEO, Live Oak Bank
Wilmington Regional Economic Scorecard | 15
Cape Fear Future Board of DirectorsHal Kitchin, McGuireWoods LLP, Chairman
Charlie Mattox, BB&T
Chris Boney, LS3P Associates LTD
Connie Majure-Rhett, Wilmington Chamber of Commerce
John Gizdic, New Hanover Regional Medical Center
Mitch Lamm, First Citizens Bank & Trust
Rickey Godwin, McGladrey LLP
Rob Kaiser, Greater Wilmington Business Journal
Regional Economic Scorecard Task TeamHal Kitchin, McGuireWoods LLP
John Nelms, Duke Energy
Glenn Harbeck, City of Wilmington
Beth Schrader, New Hanover County
Robin Spinks, Greenfield Development
Dean Robert Burrus, UNCW Cameron School of Business
Dr. Thomas Porter, UNCW Cameron School of Business
Dr. Adam Jones, UNCW Cameron School of Business
Ryan C. Beckner, UNCW Intern
Designed and published by SC Biz News
www.scbiznews.com | 843.849.3143

Produced for the community by:
Cape Fear FutureAn initiative of the Wilmington Chamber of Commerce
One Estell Lee Place | Wilmington, NC 28401
910.762.2611 | www.wilmingtonchamber.org
View the Economic Scorecard online at www.wilmingtonchamber.org