regional economic growth based on tourism, tax policy, and
TRANSCRIPT

Jurnal Ekonomi dan Bisnis, Volume 24 No. 2 October 2021, 211 - 236
Journal homepage: www.ejournal.uksw.edu/jeb
ISSN 1979-6471 E-ISSN 2528-0147
*Corresponding Author
Regional economic growth based on tourism, tax policy, and budget
aspects
Dani Rahman Hakima*, Siti Ratna Sari Dewib a Faculty of Economic, Universitas Pamulang, Tangerang, Indonesia; [email protected]* b Faculty of Economic, Universias Pamulang, Tangerang, Indonesia; [email protected]
A R T I C L E I N F O
Article History:
Received 10-28-2020
Revised 04-16-2021
Accepted 06-15-2021
Kata Kunci:
Kebijakan anggaran, PAD,
pariwisata, pertumbuhan
ekonomi, perpajakan
Keywords:
Budget policy, growth, taxation,
regional income
A B S T R A K
Penelitian ini bertujuan untuk menganalisis determinan
pertumbuhan ekonomi dan pendapatan asli daerah (PAD)
berdasarkan aspek pariwisata, kebijakan perpajakan and anggaran
di Kabupaten Kuningan. Penelitian ini menggunakan data bulanan
dari tahun 2015-2019 dengan total 60 observasi. Dengan
menggunakan analisis structural equation modeling partial least
square (SEM-PLS), penelitian ini menemukan bahwa pariwisata,
kebijakan perpajakan, dan kebijakan anggaran berpengaruh
langsung terhadap pertumbuhan ekonomi. Meski demikian, PAD
tidak terbukti dapat mempengaruhi pertumbuhan ekonomi. Selain
itu, PAD juga tidak memiliki peran mediasi pengaruh tidak
langsung pariwisata dan kebijakan perpajakan terhadap
pertumbuhan ekonomi. Di sisi lain, kebijakan anggaran tidak
terbukti dapat memoderasi pengaruh PAD terhadap pertumbuhan
ekonomi. Penelitian ini juga membuktikan bahwa kebijakan
perpajakan yang direfleksikan melalui sistem pemungutan pajak
berbasis online and anggaran peningkatan pajak daerah
berpengaruh positif terhadap PAD, sedangkan pariwisata tidak
dapat mempengaruhi PAD. Implikasi penelitian ini adalah perlunya
pemerintah daerah untuk fokus dalam memaksimalkan pariwisata
dengan mengarahkan investasi, anggaran, dan kebijakan untuk
membangun sektor pendukungnya.
A B S T R A C T
This study analyzes the determinants of regional economic growth
and local government revenue (PAD) based on tourism, taxation,
and budget policies in Kuningan District. This study uses the
monthly data from 2015-2019 with 60 numbers of observations in
total. Using the structural equation modeling partial least square
(SEM-PLS), this study found that tourism, taxation, and budget

212 Regional economic growth based on tourism….(Hakim, Dewi)
policies directly affected regional economic growth. Neither does
PAD affect regional economic growth nor mediate the indirect
effect of tourism and taxation policies on economic growth. On the
other hand, the budget policy can not moderate the influence of PAD
on economic growth. This study also proves that the taxation policy
reflected by the online-based tax collection system and the local tax
increase budget positively affects PAD, while tourism can not affect
it. This study implies that the local government of Kuningan need
to focus on maximizing tourism sectors by directing the investment,
budgets, and policies to develop its supporting industries.
INTRODUCTION
Studying economic growth is still important in the development of economics
research (Ucak, 2015), not only in country level, but also in regional level. The
presence of Covid-19 pandemic urges the regional government to work even harder to
recover their regional economy condition due to the impact of the pandemic.
Therefore, regional government needs to set relevant policies to maintain the regional
economy condition and people's purchasing power.
One of the strategies to improve the regional economic condition is increasing
the economic growth and one of the factors for increasing it is Local Regional Revenue
(PAD). Barimbing & Karmini (2015); Mawarni et al. (2013); Putri (2015); Rori et al.
(2016) empirically found that PAD influenced the regional economic growth, which
tends to strengthen the relevance of fiscal decentralization theory from Tiebout (1961).
In practice, the fiscal decentralization theory has become a concept of regional
accountability for its revenues and spending (Yushkov, 2015). However, fiscal
decentralization is inverted U shape towards economic growth (Sun et al., 2017).
Another theory that is often used to explain the determinants of regional
economic growth is the theory of regional economic development. Stimson et al (2018)
explained that the theory of regional economic development was the application of
economic processes and the availability of resources to produce sustainable
development and economic benefits for an area in the form of values, business,
residents, and tourists. In this case, the theory of regional economic development can
be used as a basis for the importance of tourism aspects for regional economic growth.
The more tourists come to the area, the higher the tourism activities which increase the
area’s economic growth. Jin (2011) revealed that tourism can boost the economic
growth.
However, some studies related to the influence of PAD and tourism on
economic growth are lack of consistency. Suwandika & Yasa (2015) and Anwar et al.
(2016) failed to find a positive effect of PAD on regional economic growth. Likewise,

Jurnal Ekonomi dan Bisnis, Volume 24 No. 2 October 2021, 211 - 236 213
studies on the effect of tourism on economic growth are still ecperiencing different
outcomes (Sokhanvar, 2019). On that basis, it is necessary to determinants of factors
that can affect regional economic growth. This study aims to re-analyze the
determinants of PAD and economic growth based on tourism aspects, taxation
policies, and budgets in a structural equation model in Kuningan District.
Kuningan District was chosen as the research object because it has adequate
tourism potential. It has cool air and natural beauty for tourism site that makes it
comfortable to be visited by tourists. The determination of Kuningan District as an
ecotourism by the Government of West Java proves the magnitude of this tourism
potential. Kuningan District has 23 natural tourism sites, culture and history tourism
site (Dinas Pariwisata dan Kebudayaan Provinsi Jawa Barat, 2021). Furthermore,
Cibuntu Kuningan as a Tourists Village was one of the 5 best tourist villages in
ASEAN countries in 2016 and the second best tourist village in Indonesia based on
Community Based Tourism (CBT) in 2017 (Kompas, 2020). Nevertheless, this
tourism potential is classified as not optimum because it is not followed by high PAD.
The targeted PAD of Kuningan in 2017 was 413 billion rupiahs, but the realization
was only 384 billion Rupiah or 14,6% of Kuningan Total Regional Revenue of 2.6
trillion rupiahs (Pemerintah Kabupaten Kuningan, 2018).
As the results, the infrastructure, other capital, education, and health
expenditures become relatively limited. Based on the Constitution, the portion of
education and health expenditure should be 20 percent and 10 percent of the Local
Expenditure Budget (APBD), respectively. Then, 20 percent of General Allocation
Fund (DAU) should be used for infrastructure development. However, low realization
of PAD makes the Kuningan District Government less flexible in enforcing its budget
policies. Therefore, it is important for Kuningan District to increase its PAD, so that
the main development goals can be supported by its budget policies.
Until now, the economy condition of Kuningan District tends to be worrying.
Its Regional Gross Domestic Product (PDRB) in 2019 was only 16,890 trillion rupiahs
or 1.1 percent of East Java PDRB which reached 1.491,705 trillion rupiahs. This low
PDRB put Kuningan Districts as the second poorest area in West Java Province (Badan
Pusat Statistik Provinsi Jawa Barat, 2020). Based on that condition, the results of this
research are expected to be a positive input for the Kuningan District Government in
optimizing the economic growth and setting relevant development policies.

214 Regional economic growth based on tourism….(Hakim, Dewi)
LITERATURE REVIEW AND HYPOTHESIS DEVELOPMENT
Tourism, Local Regional Revenue (PAD), and Regional Economic Growth
PAD optimization was the key of increasing the economic growth (Gunantara
& Dwirandra, 2014). High PAD could improve the government expenditure as one of
the important factors that was proven to increase the economic growth (Yasin, 2003).
A theory that could be used as the basis for the influence of PAD on economic growth
was fiscal decentralization from Tiebout (1961). Gemmell et al. (2013) research
explained that income decentralization was associated with higher income. Some
studies, Barimbing & Karmini (2015); Kusumawati & Wiksuana (2018); Maryati
(2010); Mawarni et al. (2013); Rori et al. (2016); Saraswati & Ramantha (2018);
Setiyawati & Hamzah (2007) could prove that PAD had a positive effect on regional
economic growth. Based on that, the first hypothesis in this study is:
H1: Local Regional Revenue positively influences the regional economic
growth.
PAD can be influenced by trourism sector, the higher the intensity of tourism
in an area will produce local tax in the form of taxes on hotels and restaurants. Based
on the theory of regional economic development, one of the economic benefits that
could be generated from the availibity of regional resources was value added, business
expansion, population and new comers. (Stimson et al., 2002). Tourists in this context
can be seen as the effect of tourism on an area which will flow additional resources to
the area. Therefore, an area that has tourism potential should be able to maximize this
potential. Moreover, a number of studies including those from Kristiana et al. (2020);
Tendean et al. (2014) succeeded in roving the positive influence of tourism on PAD.
Hence, the hypothesis that is also built in this study is:
H2: Tourism positivelty affects the Local Regional Revenue (PAD).
Tourism was considered as one of the economic engines that played a role in
the economy of various countries in the world (Seghir et al., 2015). Areas that have
tourism potential can be an important capital to increase their economic growth. Based
on the theory of development, there are 2 approaches that can be used to improve
regional economy, namely the corporate centre approach and the alternative approach.
The first approach relies on the industrial and real estate sectors, while the second
approach focuses more on encouraging activity-based economic development to
stimulate the local economy, including tourism activites. This means that tourism can
generate economic growth from transactions between local residents and tourists.

Jurnal Ekonomi dan Bisnis, Volume 24 No. 2 October 2021, 211 - 236 215
The studies that had succeeded in proving the positive influence of tourism on
economic growth were Amnar et al. (2017); Brida et al. (2020); Chulaphan &
Barahona (2018); Jin (2011); Paci & Marrocu (2014); Sequeira & Nunes (2008).
Relying on the theory of regional economic development and these empirical findings,
the third hypothesis in this study is:
H3: Tourism sector has a direct effect on regional economic growth.
Nevertheless, according to Antonakakis et al (2015), the relationship between
tourism growth and economic growth is unstable from time to time because it is
influenced by economic phenomena such as crisis, pandemic and others. Tugcu (2014)
states that the causal relationship between tourism and economic growth is not absolute
but is determined by specific tourism indicators owned b the country of tourism area.
Studies that could not prove the influence of tourism on economic growth were Croes
et al. (2018); Fahimi et al. (2018); Webster & Ivanov (2014). These studies reveal that
the competitiveness of destinations and the tourism contribution do not significantly
affect economic growth.
No matter how good the destionation of potential tourism attraction, it will not
turn it into an economic benefit for the local community if the attraction does not have
an advantage. In addition, the magnitude of tourism activity in an area which does not
increase the PAD represents a nonoptimal economic benefit. On that basis, the
hypothesis that is also formed from this study is:
H4: The Local Regional Revenue (PAD) plays a role in mediating the indirect
effect of tourism on regional economic growth.
The Relationship Between Regional Tax Policy, PAD, and Regional Economic
Growth.
When compared to other PAD components, local taxes tend to be more
maximized. Both in terms of regulation and potential, local taxes are relatively clear
and measurable. Maximizing local tax revenues can be one of the effective efforts in
increasing PAD. Studies by Asteria (2015); Sunanto (2015) proved that local taxes had
a positive effect on PAD. However, not all elements of local taxes were significant.
Wulandari & Iryanie (2016) stated that only hotel, restaurant, billboards, and public
street lighting (PJU) taxes proved to significantly affect PAD, while other local taxes
such as entertainment and parking taxes did not affect PAD.
Efforts to optimize local taxes are part of local taxation policies. Based on the
theory of fiscal decetralizaion, the existence of freedom for pe ople to manage their

216 Regional economic growth based on tourism….(Hakim, Dewi)
own income makes them free to regulate tax policies or the efforts made by local
governments to increase or control tax revenues. Extensification, inrensification, tax
increase budget, collection systems, rewards, and tax penalties are part of the regional
tax policy. Tax policy affects tax revenue because tax revenue itself was proven to be
influenced by hotel and restaurant taxpayer compliance (Gani, 2016), tax collection
system (Novitaningsih et al., 2019), as well as tax intensification and extensification
(Rahmi, 2013), to giving rewards for those who were obedient in paying taxes.
(Iskandar & Andriani, 2017; Sarlina et al., 2019). On that basis, the fifth hypothesis in
this study is:
H5: Local tax policies have a positive effect on PAD.
Pan & Ngo (2016) examined the regional economic growth using an
endogenous theory approach. The regional economic growth based on the endogenous
theory was determined by international economic integration, human resource factors,
and government policies. Therefore, regional taxation policies are also considered able
to affect the regional economic growth. Relevant local tax policies can optimize local
tax revenues so that they have an impact on economic growth. As studies by Dewi &
Budhi (2018); Saragih (2018); Sihaloho (2020); Sunarto & Sunyoto (2016) that tax
revenue could affect economic growth. Therefore, the sixth hyppotesis in this study is:
H6: Local tax policies have a direct effect on regional economic growth.
If the local taxation policy implementation does not affect PAD, then its effect
on economic growth also tends to be suboptimal. Research by Arin et al (2019)
explained that it was necessary to adjust tax policy with income to produce optimal
economic growth. By assuming local taxation policies can affect PAD, the sevents
hypothesis built in this study is:
H7: PAD plays a role in mediating the indirect effect of taxation policies on
regional economic growth.
The Relationship Between Budget Policies and Regional Economic Growth
Pan & Ngo (2016) mentioned that one of factors which determined regional
development performance, based on Romer (1986)’s endogenous theory was
government policies. Government policy in the context of regional development was
a political policy that created economic advantages with several activities including
capital investment projects and the establishment of special economic zones. Based on
Jurnal Ekonomi dan Bisnis, Volume 24 No. 2 October 2021, 211 - 236 217
this, the regional budget policy for regioal development in the context of increasing
the size of the economy is related to capital expenditure and increasing regional
potential.
According to research Arin et al. (2019) that several budget policies variabels
had a close relationship with economic growth in the near and medium erm. Some of
these budget policies were capital expenditures, education expenditures, to
development priority program expenditures. The Keynessian economic growth theory
of the Harrod-Donmar model stated that the dynamics of income was determined by
the accumulation of non-productive consumption and investment which consisted of
the accumulation of basic production assets (Tarasova & Tarasov, 2018). On that basis,
based on the Harrod-Domar theory, government capital expenditures can affect
economic growth. Research by Waryanto (2017); Yuliana (2014) has proven
empirically that capital expenditures can affect economic growth. Therefore, the eighth
hypothesis built in this studi is:
H8: Budget policies affect the economic growth.
The magnitude of tourism potential, taxation policies and PAD in an area needs
to be supported by appropriate budget policies. The budget policy in this context
supports the capital expenditure sector, and the regional potential development budget.
Even based on Linawati & Suhardi (2018) the influence on economic growth needed
to be moderated by budget policy. Therefore, the following hypothesis is built:
H9: Budget policy plays a role in strengthening the influence of PAD on
economic growth.
RESEARCH METODS
This study uses monthly data from 2014 to 2019 with a total of 60 obervations,
which are analyzed using the Structural Equation Modeling Partial Least Square
(SEM-PLS) method. Operationalization of variables in this study are as follows:

218 Regional economic growth based on tourism….(Hakim, Dewi)
Table 1
Operationalization of Variables
Variable Label Definition Item Source
Regional
Economic Growth
PE Increase in total income of per
capita income in an area
determined by maximizing the
use of prodaction factors such as
land, labor, and capital
(Mukhopadhyay, 2020).
PDRB (Regional Gross
Domestic Product)
based on base year
2010 (Hotman &
Adolf, 2013; Jaya &
Dwirandra, 2014;
Rahman & Chamelia,
2015).
Statistics
Central Bureau
of Indonesia
Local
Government
Revenue
PAD Regional revenues from sources
that exist within the region itself
and are collected based on
applicable regulations (Halim &
Kusufi, 2007).
PD (Local Tax), RD
(Local Retribution),
LPAD (Other Local
Government Revenue),
and HPKDP (Separated
Regional Assets
Management)
Kuningan
District
Regional
Revenue
Agency
Tax Policies KP Efforts related to increasing
local tax revenues and
regulations regarding the
application of tariffs.
APP (Regional
Revenue Icnrease
Program Budget), and
PO (Online Tax
Collecting System)
(Hotman & Adolf,
2013; Rahayu, 2010)
Tourism PAR Activities of traveling and living
in a place other than their place
of origin for leisure, business, or
other purposes for a period of
not more than 1 year.
Kunjungan Hotel,
Rumah Makan, and
Destinasi Wisata
(Sowwam et al., 2018)
Kuningan
District Office
of Youth,
Sports, and
Tourism
Budget Policies KA Regional budget allocation
policies to realize the programs
that have been arranged.
BM (Capital
Expenditure), and AP
(Tourism Budget)
Kuningan
District
Regional
Secretariat
There are 3 reasons behind the analysis of this study using SEM-PLS. First, the
data in this study tend to be small (60 observations) so it would be more appropriate
to use SEM-PLS (Wong, 2013). Second, this study prioritizes its predictive ability, so
it would be more appropriate to use the SEM-PLS model (Hair et al., 2012). Third,
this study uses more than 1 dependent variable and quite a lot of independent variables.
In addition, the SEM-PLS analysis was chosen in this study based on several
advantages it has. Some of these advantages are its ability to model multiple dependent
variables, tend to be able to handle multicollinearity, are free to the possibility of data
interference, and have adequate predictive abilities (Garson, 2018).
The latent variables in this study are determined through the following
equation:
LV = w1 ∗ MV1 + w2 ∗ MV2 + . . . + wn ∗ MVn .......................................................... 1

Jurnal Ekonomi dan Bisnis, Volume 24 No. 2 October 2021, 211 - 236 219
Where LV as latent variable, MV as manifest variable or indicator of the latent variable
after standardization with [(Xi – Mean) / Standard Dev]. Then, w is outer weights
where i = 1, 2, …. n.
Furthermore, as referred by Hair et al. (2018) the general equation that depicts
the relationship between latent variables and their indicators is as follows:
𝑥 = 𝑙 ∗ 𝑦 + ⅇ ........................................................................................................................ 2
Where x indicates the indicator, y is the latent variable, l is the loading factor
that shows the magnitude of the relationship between the indicator and its construct.
Meanwhile, e, indicates the random error of construct measurement. There are 5 latent
variables in this study which will be tested for validity and construct reliability. The
construct validity test is carried out by looking at the average variance extracted (AVE)
value, while the reliability can be known from the composite reliability value (Garson,
2018). Referring to Ghozali (2016) if the AVE value is more than 0.7 then the construct
is valid, then if the composite reliability is greater than 0.7 then the construct is reliable
(Henseler et al., 2012). If the construct is invalid or unreliable, it will be repaired by
eliminating the indicator that gets the smallest loading factor value.
After all constructs are declared valid and reliable, the goodness of fit test of
the research model will be carried out by reviewing the R2 value from the PLS SEM
analysis that has been carried out. According to Chin (1998), if the R2 value is between
0.19 to 0.32, then the model relationship is weak. If the value is between 0.33 to 0.66
then the relationship is moderate, whereas if it is above 0.67 then it shows a strong
relationship. The model proposed in this study is as follows:
PAD = β1PAR + β2KP + e ............................................................................................ 3
PE = β3PAR + β4KP + β5PAD + β6KA + e ............................................................. 4
RESULTS AND DISCUSSION
The results of descriptive statistical analysis in this study are as follows:
220 Regional economic growth based on tourism….(Hakim, Dewi)
Table 2
Descriptive Analysis Results
Mean Median Max Min Std Dev Obs
PAD 29.413 23.404 155.190 11.739 27.221 60
PD 6.463 6.525 11.349 2.562 2.119 60
RD 3.499 3.252 10.190 954 1.811 60
HKPD 488 100 3.449 0.000 956 60
LPAD 18.962 12.119 144.351 4.597 26.767 60
PO 3.185 3.902 4.816 0.000 1.688 60
APP 226 236.157 355.991 2.177 95 60
RM 108.140 91.276 223.230 41.989 50 60
HTL 27.178 23.595 207.173 10.931 25 60
DP 170.780 130.978 891.563 30.570 131 60
BM 21.928 23.765 31.764 11.268 6.348 60
AP 523 433 961 35 257 60
PDRB 1.245.042 1.238.661 1.446.742 1.069.454 111.906 60
Notes: The units used are millions of rupiahs, except for units for RM, HTL, and DP using the original
numbers
Source: data processed by researchers
The PAD value is obtained from the sum of PD, RD, HKPD, and LPAD. The
average PAD that Kuningan gets per month and PDRB is 29 billion rupiahs and 1,2
trillion rupiahs, respectively, which means that PAD contributes 2.4 percent to PDRB.
This condition shows that there are a lot of opportunities for Kuningan District to
increase its PAD. The local tax (PD) that Kuningan collects per month is 6.5 billion
rupiah with taxes collected through the online system (PO) of 3.19 billion rupiah. It
means that the participation of local taxpayers in online collection system reaches
49%.
The average budget for increasing the tourism aspect per month is 523 million
rupiah. When compared with local tax revenues of 6.5 billion, the contribution to the
use of the tourism budget is only 8%. It means that a better strategy and
implementation is needed in the preparation of tourism improvement programs. Based
on Table 2, it can also be seen that the average monthly hotel visits in Kuningan are
27,178 for the last 5 years. 108,140 restaurant visits, and 170,781 visitors to tourist
attractions per month.
Construction of Valid and Reliable Test
The resulst of Construction of Valid and Reliable Test can be seen from the
table as follows:

Jurnal Ekonomi dan Bisnis, Volume 24 No. 2 October 2021, 211 - 236 221
Table 3
Frist Construction of Valid and Reliable Test Result
Variable Composite
Reliability
Decisions
CR > 0,7
Average
Variance
Extracted (AVE)
Decisions
AVE > 0,5
KA 0.119 Unreliable 0.709 Valid
KP 0.921 Reliable 0.854 Valid
PAD 0.448 Unreliable 0.301 Not Valid
PAR 0.751 Reliable 0.515 Valid
PE 1.000 Reliable 1.000 Valid
Source: data processed by researchers
Based on Table 3, there are variables that are not valid and reliable. The
following is an overview of the initial model that was tested for validity and reliability:
Figure 1
Initial Research Model Before Improvement Model
Notes: There are 3 different types of values from the model in figure 1 above. First, the number on the
line connecting the blue circle to the yellow box is the outer weight or loading which shows the
indicator's ability to reflect the lantent variable (its construct). Second, the number that is interconnected
between latent variables is the path coefficient of the original sample value (not the result of
bootstrapping). This figure shows the magnitude of the relationship between latent variables. Third, the
white-printed numbers in the PAD and Economic Growth variables are the coefficients of determination
(R-square) of each model.
The procedure to fix Not Valid and Reliable variables is to remove several

222 Regional economic growth based on tourism….(Hakim, Dewi)
indicator items that get the lowest loading value until the variable becomes valid. The
result is as follows:
Tabel 4
Validity and Reliability Test Results After Repair
Variabel Composite
Reliability
Decisions
CR > 0,7
Average Variance
Extracted (AVE)
Decisions
AVE > 0,5
KA 1.000 Reliable 1.000 Valid
KP 0.922 Reliable 0.855 Valid
PAD 1.000 Reliable 1.000 Valid
PAR 0.758 Reliable 0.523 Valid
PE 1.000 Reliable 1.000 Valid
Source: data processed by researchers
After improvements have been made and all constructs are declared valid and
reliable, the final structural model in this study is as follows:
Figure 2
Research Final Model After Improvement
Notes: The figures in Figure 2 have the same interpretation as Figure 1. However, in Figure 2 several
indicators are missing. For example, the PAD variable can only be reflected by the Local Tax indicator
because the existence of other indicators such as those at the beginning of the model (figure 1) did not
pass the validity test. The variable that reads Mod_effect PAD_Keb_Agg is not a latent variable, but
rather as a moderating budget policy in strengthening or weakening the influence of PAD on Economic
Growth.
Based on Figure 2, it can be seen the magnitude of the influence in the construct
and in the structural model of this study. The most influential indicator or manifest

Jurnal Ekonomi dan Bisnis, Volume 24 No. 2 October 2021, 211 - 236 223
variable for the tourism construct is restaurant visits. Tax policy is more influenced by
the online-based tax collection system. In the PAD construct, the only valid indicator
that reflects PAD is local taxes. It means that the contribution of other PAD indicators
can be said to be less consistent. As for the budget policy construct, only tourism
budget indicators can reflect it in this structural model.
Inner Model Test
The inner model test in this study was conducted to determine the goodness of
fit of the research model. The test uses the R-square value from the results of research
data analysis. There are two structural models built in this research, namely the
structural model of PAD and economic growth as follows:
Table 4
Inner Model Test Results
Model Variable R Square Relationship
1 PAD 0.187 Weak
2 PE 0.982 Strong
Source: Data processed by researchers
Based on the table above, the relationship between tourism variables and tax
policy on PAD is weak. The variance that occurs in the PAD variable is influenced by
18.7% of the variance in the tourism sector and tax policy. While the structural model
of economic growth shows a strong relationship.
Hypotheses Testing Results
Hypothesis testing in this study can be seen from the table as follows:
Table 5
Hypotheses Testing Results
Number
of
Hipotesis
The Effect Between
Variables
Original
Sample
(O)
Standard
Deviation
(STDEV)
T Statistics
(|O/STDEV|)
P
Values Remark
1 PAD → PE 0,035 0,022 1,607 0,109 Rejected
2 PAR → PAD -0,028 0,112 0,254 0,800 Rejected
3 PAR → PE 0,099 0,030 3,357 0,001** Accepted
4 PAR → PAD → PE -0,001 0,005 0,217 0,828 Rejected
5 KP → PAD 0,441 0,103 4,263 0,000* Accepted
6 KP → PE 0,326 0,035 9,382 0,000* Accepted
7 KP → PAD -> PE 0,016 0,012 1,291 0,197 Rejected
8 KA → PE 0,676 0,047 14,506 0,000* Accepted
9 Mod_Effect_PAD_KA → PE 0,020 0,017 1,188 0,236 Rejected
Notes: *significant at 1%, **significant at 5%
Source: data processed by researchers
224 Regional economic growth based on tourism….(Hakim, Dewi)
Based on Table 5, 4 of 9 hypoteses are accepted while the remaining 5
hypotheses are rejected. The decision to accept or reject the hypothesis is based on the
p-values from the results of the SEM analysis. If the value is less than the significant
level of 0.05 then the hypothesis is accepted, but if it is more than the significant level
of 0.05 then the hypothesis is rejected. Based on Table 5, the structural equations in
this study are as follows:
PAD = −0,028 PAR + 0,441 KP + 0,215 ....................................................................... 5
PE = 0,099 PAR + 0,326 KP + 0,035 PAD + 0,676 KA + 0,134 .............................. 6
The Effect of PAD on Economic Growth
This study cannot prove the influence of PAD on regional economic growth.
These results are not in accorandance with the results of research from Barimbing &
Karmini (2015); Kusumawati & Wiksuana (2018); Maryati (2010); Mawarni et al.
(2013); Rori et al. (2016); Saraswati & Ramantha (2018); Setiyawati & Hamzah
(2007). When viewed from its contribution to the APBD, Kuningan's PAD is classified
as exceedingly small. This condition seems to be the main cause of the insignificant
influence of PAD on Kuningan's economic growth.
The results of this study tend to be inconsistent with the theory of fiscal
decentralization, that revenue autonomy should affect economic growth, because it
allows regions to be responsible for their own income and expenditure (Yushkov,
2015). However, the ineffectiveness of PAD on economic growth is one of the classic
problems of fiscal decentralization. In this context, fiscal decentralization tends to
increase the fiscal gap between regions (Kee, 2004). In addition, according to Kee
(2004) local governments also often lack a good public management system to support
them in choosing the right taxation policies and budgets. This study is in line with the
results of Anwar et al. (2016); Suwandika & Yasa (2015) which also cannot prove a
positive influence of PAD on regional economic growth.
The Effect of Tourism on PAD
This study does not prove the significant influence of the tourism sector on
PAD. This result is not in line with previous research from Kristiana et al. (2020);
Tendean et al. (2014). However, this result is in line with the research of Purwanti
(2014); Sugara & Winarso (2013) that tourism does not significantly affect PAD. The
main causes of tourism not affecting PAD are the lack of innovation, inadequate
infrastructure in the tourism sector, and the ineffectiveness of tourism tax revenues.
The studies that have succeeded in proving the influence of tourism on PAD tend to
be carried out in areas with adequate tourism infrastructure. For example, in Bali (Sari,

Jurnal Ekonomi dan Bisnis, Volume 24 No. 2 October 2021, 211 - 236 225
2014) and in Central Lombok (Rois & Fadliyanti, 2017).
This study tends to be in line with the results of the study Sabrina &
Mudzhalifah (2018) which states that the number of tourists can actually not affect
PAD. The findings in this study have implications for the importance of exploring and
maximizing PAD from the tourism aspect. Without being supported by adequate
facilities and infrastructure, tourism cannot maximally increase PAD. Investment
needs to be directed towards the tourism sector to produce superior infrastructure and
tourist destinations. As the opinion of Aratuo & Etienne (2019) that investments made
for the tourism sector needs to be made for a long-term vision.
The Direct Effect of Tourism on Economic Growth
This study succeeded in proving the direct influence of tourism on economic
growth. These results are in accordance with the regional development theory that the
regional economy is determined by economic processes and the availability of
resources in the form of values, businesses, residents, and tourists (Stimson et al.,
2002). The quantity of tourists to an area according to this theory is considered capable
of increasing the resulting economic output. These results tend to be in line with
research from Amnar et al. (2017); Brida et al. (2020); Chulaphan & Barahona (2018);
Jin (2011); Paci & Marrocu (2014); Sequeira & Nunes (2008) that tourism is proven
to affect economic growth.
When reviewing its economic condition, Kuningan District is an area with a
more dominant contribution from the agricultural sector to its economic growth. As a
result, employment opportunities tend to be limited so that many Kuningan residents
choose to migrate outside the city. Therefore, the tourism sector can be one of the
mainstays to support the economy. Referring to the theory of regional economic
development, the potential of the region in the form of tourism needs to be maximized.
One of them is by providing infrastructure and supporting industries. Without being
supported by adequate infrastructure, tourism cannot contribute to PAD. In other
words, the Kuningan District government has not been able to maximally convert the
tourism sector into income for the region.
The Role of PAD in Mediating the Indirect Effect of Tourism on Economic
Growth
This study cannot prove the mediating role of PAD in the interaction of the
indirect influence of tourism on economic growth. One of the reasons for this condition
is that Kuningan's revenue has not been maximized. Therefore, the effect of tourism is
felt directly through the increasing of income of residents surround the tourism area.
It means that the magnitude of tourism potential is not compensated by the amount of
PAD. When viewed from the magnitude of its influence, restaurant visits are more

226 Regional economic growth based on tourism….(Hakim, Dewi)
dominant in shaping the tourism construct.
Not many visitors or tourists who come to Kuningan stay at the hotel. In fact,
the tax from the hotel is the greater contribution to PAD revenue. These findings imply
that the relationship between tourism and economic growth is a direct causal effect for
regions with relatively low PAD. Efforts are needed to maximize the tourism sector so
that it can contribute more to PAD revenue.
The Influence of Regional Tax Policy on PAD
The results of this study prove that tax policy has a positive effect on PAD.
Better and more efficient regional taxation policies are associated with the increase in
PAD. The results of this study are in line with previous research from Gani (2016);
Iskandar & Andriani (2017); Novitaningsih et al. (2019); Rahmi (2013); Sarlina et al.
(2019) that efforts which are part of tax policy have proven to have a significant effect
on increasing PAD.
When viewed from the aspect of its contribution, the online-based local tax
collection system significantly affects PAD. Although less than 50% of taxpayers
already use the online system, it is sufficient to trigger an increase in PAD. On that
basis, more maximum efforts are needed in increasing taxpayer participation to take
advantage of this online-based collection system. Another benefit of the existence of
this system is efficiency.
The Effect of Tax Policy on Regional Economic Growth
Tax policy in this study is proven to affect economic growth. These results
strengthen the theory of endogenous growth that government policies tend to affect
economic growth. The results of this study are also in line with research conducted by
Dewi & Budhi (2018); Saragih (2018); Sihaloho (2020); Sunarto & Sunyoto (2016).
When compared between PAD revenue and PDRB of 2.4 percent, there is still a lot of
potential revenue that can be maximized by local governments.
However, local governments cannot be too aggressive in seeking taxes. A
balance is needed between the tax rates applied and the prevailing economic
conditions. This is because there is an inverted u shape relationship between taxes and
economic growth. If the tariff is too high and too aggressive, it can actually damage
the regional economy itself.
The Role of PAD in Mediating the Indirect Effect of Tax Policy on Economic
Growth
Another result obtained from this study is that PAD has no significant role in
mediating the indirect effect of tax policy on economic growth. This means that
taxation policies are implemented not only to increase income, but also to stabilize the
Jurnal Ekonomi dan Bisnis, Volume 24 No. 2 October 2021, 211 - 236 227
regional economy. The effect of taxation policy on economic growth is direct, so even
though it is not balanced with high PAD, tax policy can still affect economic growth.
The Effect of Budget Policy on Economic Growth
The budget policy in this study is proven to affect economic growth. This result
is in line with the research of Arin et al. (2019) that several budget policy variables
have a close relationship with economic growth in the short and medium term. If local
governments support tourism development by increasing tourism budgets and building
tourism supporting infrastructure, more optimal economic growth can be achieved.
The endogenous theories of Romer (1986) serta Harrod-Domar cenderung relevan
dengan kondisi ini.
The Role of Budget Policy in Moderating the Effect of PAD on Economic Growth
This study finds that budget policies cannot moderate the effect of PAD on
economic growth. This result is not in accordance with research from Linawati &
Suhardi (2018) which states that the influence of PAD on economic growth needed to
be moderated by budget policy. When viewed from the aspect of magnitude, both PAD
and budget policies, reflected through the tourism budget and capital expenditures, in
Kuningan Regency tend to be minimal. This condition is the main reason for the
rejection of this moderation hypothesis.
Robustness Checks
For robustness chechs, this study also estimates the research model using
ordinary least squares (OLS) based regression analysis. The following is the model
that was tested using regression:
PAD = α1 + β1HTL + β2DP + β3RM + β4PO + β5APP + ⅇ ............................................... 7
PDRB = α2 + β6HTL + β7DP + β8RM + β9PO + β10APP + β12PAD + β13BM + β14AP + ⅇ ........................................................................................................................ 8
The results of the regression test can be seen from the table as follows:
228 Regional economic growth based on tourism….(Hakim, Dewi)
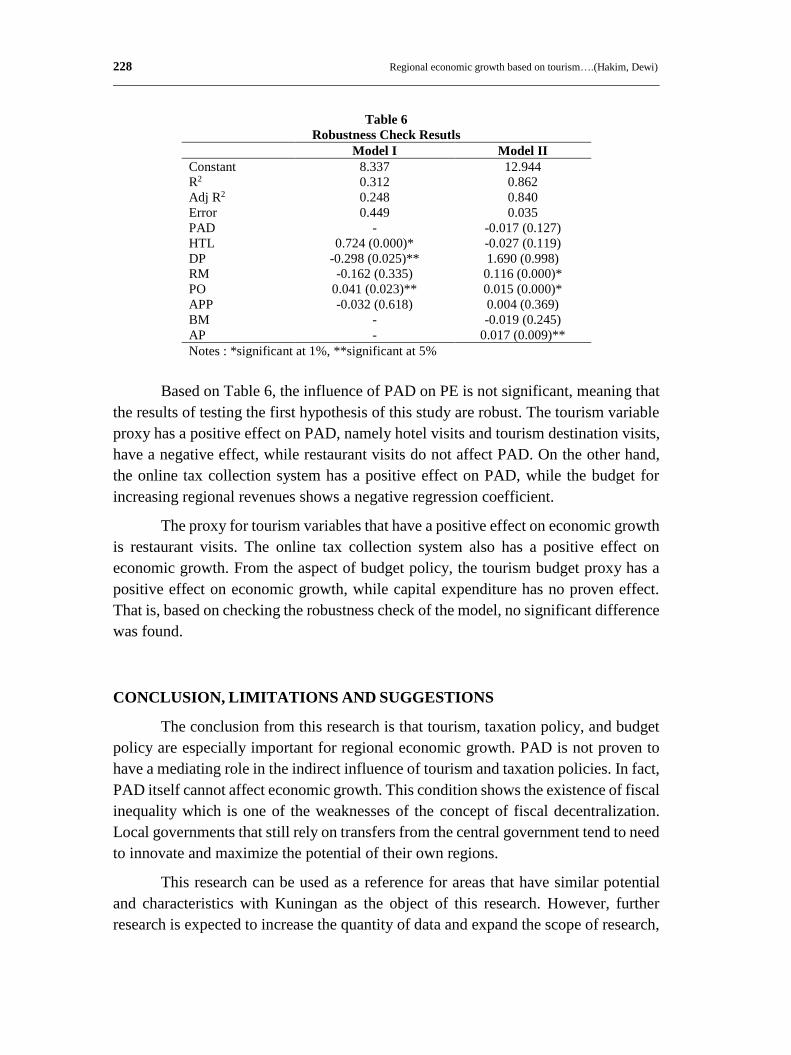
Table 6
Robustness Check Resutls
Model I Model II
Constant 8.337 12.944
R2 0.312 0.862
Adj R2 0.248 0.840
Error 0.449 0.035
PAD - -0.017 (0.127)
HTL 0.724 (0.000)* -0.027 (0.119)
DP -0.298 (0.025)** 1.690 (0.998)
RM -0.162 (0.335) 0.116 (0.000)*
PO 0.041 (0.023)** 0.015 (0.000)*
APP -0.032 (0.618) 0.004 (0.369)
BM - -0.019 (0.245)
AP - 0.017 (0.009)**
Notes : *significant at 1%, **significant at 5%
Based on Table 6, the influence of PAD on PE is not significant, meaning that
the results of testing the first hypothesis of this study are robust. The tourism variable
proxy has a positive effect on PAD, namely hotel visits and tourism destination visits,
have a negative effect, while restaurant visits do not affect PAD. On the other hand,
the online tax collection system has a positive effect on PAD, while the budget for
increasing regional revenues shows a negative regression coefficient.
The proxy for tourism variables that have a positive effect on economic growth
is restaurant visits. The online tax collection system also has a positive effect on
economic growth. From the aspect of budget policy, the tourism budget proxy has a
positive effect on economic growth, while capital expenditure has no proven effect.
That is, based on checking the robustness check of the model, no significant difference
was found.
CONCLUSION, LIMITATIONS AND SUGGESTIONS
The conclusion from this research is that tourism, taxation policy, and budget
policy are especially important for regional economic growth. PAD is not proven to
have a mediating role in the indirect influence of tourism and taxation policies. In fact,
PAD itself cannot affect economic growth. This condition shows the existence of fiscal
inequality which is one of the weaknesses of the concept of fiscal decentralization.
Local governments that still rely on transfers from the central government tend to need
to innovate and maximize the potential of their own regions.
This research can be used as a reference for areas that have similar potential
and characteristics with Kuningan as the object of this research. However, further
research is expected to increase the quantity of data and expand the scope of research,
Jurnal Ekonomi dan Bisnis, Volume 24 No. 2 October 2021, 211 - 236 229
for example at the provincial and even national levels. Further research is also expected
to include other external variables that are predicted to have an influence on economic
growth in the structural model. Among these variables are foreign investment,
inflation, agriculture, to human resources.
For the local government of Kuningan District, it is expected to have a clear
development focus by utilizing and exploring the potential of the region to the
maximum. Primarily, Kuningan must focus on maximizing the tourism potential
supported by the right budget policies. Local governments are also expected to direct
investment to build supporting industries for the tourism sector and continue to
innovate, so that tourism attractiveness can be increased.
BIBLIOGRAPHY
Amnar, S., Sahid, M., & Syechalad, M. N. (2017). Pengaruh pariwisata terhadap
pertumbuhan ekonomi di Kota Sabang. Jurnal Ekonomi Dan Kebijakan Publik
Indonesia, 4(1), 13–22.
Antonakakis, N., Dragouni, M., & Filis, G. (2015). How strong is the linkage between
tourism and economic growth in Europe? Economic Modelling, 44, 142–155.
https://doi.org/10.1016/j.econmod.2014.10.018
Anwar, M. L., Palar, S. W., & Sumual, J. I. (2016). Pengaruh DAU, DAK, PAD
terhadap pertumbuhan ekonomi dan kemiskinan (Kota Manado tahun 2001-
2013). Jurnal Berkala Ilmiah Efisiensi, 16(2), 218–232.
Aratuo, D. N., & Etienne, X. L. (2019). Industry level analysis of tourism-economic
growth in the United States. Tourism Management, 70(May 2018), 333–340.
https://doi.org/10.1016/j.tourman.2018.09.004
Arin, K. P., Braunfels, E., & Doppelhofer, G. (2019). Revisiting the growth effects of
fiscal policy: A Bayesian model averaging approach. Journal of
Macroeconomics, 62(May 2018), 103158.
https://doi.org/10.1016/j.jmacro.2019.103158
Asteria, B. (2015). Analisis pengaruh penerimaan pajak daerah dan retribusi daerah
terhadap Pendapatan Asli Daerah kabupaten/kota di Jawa Tengah. Jurnal Riset
Manajemen Sekolah Tinggi Ilmu Ekonomi Widya Wiwaha Program Magister
Manajemen, 2(1), 51–61.
Badan Pusat Statistik Provinsi Jawa Barat. (2020). Persentase penduduk miskin
(Persen), 2018 - 2020. Data Series Subyek Kemiskinan.
https://jabar.bps.go.id/indicator/23/51/1/persentase-penduduk-miskin.html

230 Regional economic growth based on tourism….(Hakim, Dewi)
Barimbing, Y., & Karmini, N. (2015). Pengaruh PAD, tenaga kerja, dan investasi
terhadap pertumbuhan ekonomi di Provinsi Bali. E-Jurnal Ekonomi
Pembangunan Universitas Udayana, 4(5), 434–450.
Brida, J. G., Matesanz Gómez, D., & Segarra, V. (2020). On the empirical relationship
between tourism and economic growth. Tourism Management, 81(January), 1–
11. https://doi.org/10.1016/j.tourman.2020.104131
Chin, W. W. (1998). Commentary: Issues and opinion on Structural Equation
Modeling. MIS Quarterly, 22(1), 7–16.
Chulaphan, W., & Barahona, J. F. (2018). Contribution of disaggregated tourism on
Thailand’s economic growth. Kasetsart Journal of Social Sciences, 39(3),
401–406. https://doi.org/10.1016/j.kjss.2017.07.012
Croes, R., Ridderstaat, J., & van Niekerk, M. (2018). Connecting quality of life,
tourism specialization, and economic growth in small island destinations: The
case of Malta. Tourism Management, 65, 212–223.
https://doi.org/10.1016/j.tourman.2017.10.010
Dewi, J. K., & Budhi, M. K. S. (2018). Analisis pengaruh pajak daerah, retribusi
daerah terhadap tenaga kerja dan pertumbuhan ekonomi di Kota Palangka Raya
Provinsi Kalimantan Tengah. E-Jurnal Ekonomi Dan Bisnis Universitas
Udayana, 7, 1695–1722. https://doi.org/10.24843/EEB.2018.v07.i06.p08
Dinas Pariwisata dan Kebudayaan Provinsi Jawa Barat. (2021). Jumlah objek wisata
Kabupaten Kuningan. Dinas Pariwisata Dan Kebudayaan Provinsi Jawa Barat.
Fahimi, A., Akadiri, S. Saint, Seraj, M., & Akadiri, A. C. (2018). Testing the role of
tourism and human capital development in economic growth. A panel causality
study of micro states. Tourism Management Perspectives, 28(July), 62–70.
https://doi.org/10.1016/j.tmp.2018.08.004
Gani, A. I. A. A. (2016). Pengaruh kepatuhan wajib pajak hotel dan restoran terhadap
penerimaan pajak daerah (Studi pada Dinas Pendapatan Daerah Kota Malang).
Jurnal Mahasiswa Perpajakan, 8(1), 1–7.
Garson, G. D. (2018). Partial Least Squares: Regression & Structural Equation
Models. In Multi-Label Dimensionality Reduction.
https://doi.org/10.1201/b16017-6
Gemmell, N., Kneller, R., & Sanz, I. (2013). Fiscal decentralization and economic
growth: Spending versus revenue decentralization. Economic Inquiry, 51(4),
1915–1931. https://doi.org/10.1111/j.1465-7295.2012.00508.x
Ghozali, I. (2016). Aplikasi analisis multivariate dengan program IBM SPSS 21:
Jurnal Ekonomi dan Bisnis, Volume 24 No. 2 October 2021, 211 - 236 231
Update PLS regresi (7th ed.). Badan Penerbit Universitas Diponegoro.
Gunantara, P. C., & Dwirandra, A. A. N. . (2014). Pengaruh Pendapatan Asli Daerah
dan Dana Alokasi Umum pada pertumbuhan ekonomi dengan belanja modal
sebagai variabel pemoderasi di Bali. Akuntansi Universitas Udayana, 3, 529–
546.
Hair, J. F., Sarstedt, M., Pieper, T. M., & Ringle, C. M. (2012). The use of Partial Least
Squares Structural Equation Modeling in strategic management research: A
review of past practices and recommendations for future applications. Long
Range Planning, 45(5–6), 320–340. https://doi.org/10.1016/j.lrp.2012.09.008
Hair, J. F., Sarstedt, M., Ringle, C. M., & Gudergan, S. P. (2018). Advanced issues in
Partial Least Squares SEM. Sage Publications, Inc.
Halim, A., & Kusufi, M. S. (2007). Akuntansi sektor publik: Akuntansi keuangan
daerah. Salemba Empat.
Henseler, J., Ringle, C. M., & Sarstedt, M. (2012). Using partial least squares path
modeling in advertising research: Basic concepts and recent issues. In
Handbook of research on international advertising. Edward Elgar Publishing.
Hotman, J., & Adolf, H. (2013). Analisis Dampak Pajak Daerah Terhadap
Pertumbuhan Ekonomi (Studi Kasus Di Provinsi Jawa Tengah). Repository
Universitas Terbuka.
Iskandar, N., & Andriani, A. F. (2017). Pengaruh reward, pemeriksaan pajak, dan
penalti terhadap peningkatan kepatuhan wajib pajak orang pribadi di
Indonesia. Info Artha, 3, 124–137. https://doi.org/10.31092/jia.v3i0.47
Jaya, I., & Dwirandra, A. (2014). Pengaruh pendapatan asli daerah pada belanja modal
dengan pertumbuhan ekonomi sebagai variabel pemoderasi. E-Jurnal
Akuntansi Universitas Udayana, 7(1), 79–92.
Jin, J. C. (2011). The effects of tourism on economic growth in Hong Kong. Cornell
Hospitality Quarterly, 52(3), 333–340.
https://doi.org/10.1177/1938965510394169
Kee, J. E. (2004). Fiscal decentralization: Theory as reform. In A. Khan & W. B.
Hildreth (Eds.), Financial Management Theory in the Public Sector (Issue
September, pp. 253–286). Preager Publishers.
Kompas. (2020). Mengenal desa wisata Cibuntu yang jadi juara tingkat ASEAN.
Travel Kompas.
https://travel.kompas.com/read/2020/10/20/172000227/mengenal-desa-
wisatacibuntu-yang-jadi-juara-tingkat-asean
232 Regional economic growth based on tourism….(Hakim, Dewi)
Kristiana, Y., Pramono, R., Nathalia, T. C., & Goeltom, V. A. H. (2020). Tourism and
original local government revenue in Indonesia tourism provinces: The Java
Island experience. Systematic Reviews in Pharmacy, 11(9), 745–750.
https://doi.org/10.31838/srp.2020.9.105
Kusumawati, L., & Wiksuana, I. G. B. (2018). Pengaruh pendapatan daerah terhadap
pertumbuhan ekonomi di wilayah Sarbagita Provinsi Bali. E-Jurnal
Manajemen Unud, 7(5), 2592–2620.
https://doi.org/https://doi10.24843/EJMUNUD.2018.v7.i05.p12 ISSN
Linawati, & Suhardi. (2018). Kemandirian dan efektivitas keuangan daerah terhadap
pertumbuhan ekonomi di moderasi alokasi belanja modal. Jurnal Ekuivalensi,
3(2), 19–28.
Maharani, M. (2011). Pengaruh pertumbuhan ekonomi, pendapatan asli daerah
(PAD), dan dana alokasi umum (DAU) terhadap belanja modal. Universitas
Negeri Semarang.
Maryati, U. (2010). Pengaruh pendapatan asli daerah (PAD), dana alokasi umum
(DAU) dan dana alokasi khusus (OAK) terhadap pertumbuhan ekonomi: Studi
kasus Sumatera Barat. Jurnal Akuntansi & Manajemen, 5(2), 68–84.
Mawarni, Darwanis, & Abdullah, S. (2013). Pengaruh pendapatan asli daerah dan dana
alokasi umum terhadap belanja modal serta dampaknya terhadap pertumbuhan
ekonomi daerah (Studi pada Kabupaten dan Kota di Aceh). Jurnal
Administrasi Akuntansi: Pascasarjana Universitas Syiah Kuala, 2(2), 80–90.
Mukhopadhyay, S. (2020). Regional Development Models. In International
Encyclopedia of Human Geography (2nd ed., Vol. 9, pp. 281–295). Elsevier.
https://doi.org/10.1016/B978-0-08-102295-5.10119-2
Novitaningsih, R., Diana, N., & Afifudin, A. (2019). Pengaruh sistem pemungutan
pajak, pemeriksaan pajak, penagihan pajak terhadap tingkat penerimaan pajak.
Jurnal Ilmiah Riset Akuntansi, 8(1), 1–13.
Paci, R., & Marrocu, E. (2014). Tourism and regional growth in Europe. Papers in
Regional Science, 93(S1), S25–S50. https://doi.org/10.1111/pirs.12085
Pan, W. H., & Ngo, X. T. (2016). Endogenous growth theory and regional
performance: The moderating effects of special economic zones. Communist
and Post-Communist Studies, 49(2), 113–122.
https://doi.org/10.1016/j.postcomstud.2016.04.005
Pemerintah Kabupaten Kuningan. (2018). Laporan realisasi anggaran Kabupaten
Kuningan 2017. In Transparansi Pengelolaan Anggaran Daerah.

Jurnal Ekonomi dan Bisnis, Volume 24 No. 2 October 2021, 211 - 236 233
https://www.kuningankab.go.id/sites/default/files/file-
halaman/laporanrealisasi-anggraran-kab-kuningan-2017.pdf
Purwanti, N. D. (2014). Pengaruh jumlah kunjungan wisatawan terhadap pendapatan
asli daerah Kabupaten Mojokerto tahun 2006-2013. Jurnal Pendidikan
Ekonomi (JUPE), 2(3), 1–12. https://doi.org/10.26740/jupe.v2n3.p1.12p
Putri, Z. E. (2015). Analisis pengaruh pendapatan asli daerah (PAD), dana alokasi
umum (DAU) dan inflasi terhadap pertumbuhan ekonomi di kabupaten/kota
Provinsi Jawa Tengah. Esensi: Jurnal Bisnis Dan Manajemen, 5(2), 173–186.
https://doi.org/10.15408/ess.v5i2.2340
Rahayu, S. K. (2010). Perpajakan Indonesia: Konsep dan aspek formal. Graha Ilmu.
Rahman, Y. A., & Chamelia, A. L. (2015). Faktor-faktor yang mempengaruhi PDRB
kabupaten/kota Jawa Tengah tahun 2008-2012. JEJAK: Jurnal Ekonomi Dan
Kebijakan, 8(1), 88–99. https://doi.org/10.15294/jejak.v8i1.3857
Rahmi, A. (2013). Pengaruh intensifikasi dan ekstensifikasi terhadap peningkatan
pendapatan asli daerah guna mewujudkan kemandirian keuangan daerah (Studi
empiris pada pemerintah Kota Padang). Jurnal Akuntansi, 1(3), 1–26.
Rois, I., & Fadliyanti, L. (2017). Dampak pengembangan pariwisata terhadap
pendapatan asli daerah (PAD) di Kabupaten Lombok Tengah, Nusa Tenggara
Barat tahun 2002-2016. Journal of Economics and Business, 3(2), 79–88.
https://doi.org/10.29303/ekonobis.v3i2.8
Romer, P. M. (1986). Increasing returns and long-run growth. Journal of Political
Economy, 94(5), 1002–1037.
Rori, C. F., Luntungan, A. Y., & Niode, A. O. (2016). Analisis pengaruh pendapatan
asli daerah (PAD) terhadap pertumbuhan ekonomi di Provinsi Sulawesi Utara
tahun 2001-2013. Jurnal Berkala Ilmiah Efisiensi, 16(2), 243–254.
Sabrina, N., & Mudzhalifah, I. (2018). Pengaruh jumlah objek wisata, jumlah
wisatawan dan tingkat hunian hotel terhadap pendapatan asli daerah dengan
penerimaan sektor pariwisata sebagai variabel moderating pada Dinas
Pariwisata Kota Palembang. Balance: Jurnal Akuntansi Dan Bisnis, 3(2), 464.
https://doi.org/10.32502/jab.v3i2.1449
Saragih, A. H. (2018). Pengaruh penerimaan pajak terhadap pertumbuhan ekonomi di
Indonesia. Jurnal Sikap, 3(1), 17–27.
Saraswati, I. A., & Ramantha, I. W. (2018). Pengaruh pendapatan asli daerah terhadap
pertumbuhan ekonomi dengan belanja modal dan investasi swasta sebagai
pemoderasi. E-Jurnal Akuntansi Universitas Udayana, 24(1), 662–686.
234 Regional economic growth based on tourism….(Hakim, Dewi)
https://doi.org/10.24843/eja.2018.v24.i01.p25
Sari, P. L. P. (2014). Analisis variabel-variabel yang mempengaruhi pendapatan asli
daerah Provinsi Bali. E-Jurnal Ekonomi Pembangunan Universitas Udayana,
3(11), 715–737.
Sarlina, L., Kurniawa, A., & Umiyati, I. (2019). Pengaruh akses pajak, fasilitas,
kualitas pelayanan dan persepsi adanya reward terhadap kepatuhan wajib pajak
kendaraan bermotor. Jurnal Ilmiah Akuntansi Dan Keuangan, 1(2), 145–160.
Seghir, G. M., Mostéfa, B., Abbes, S. M., & Zakarya, G. Y. (2015). Tourism spending-
economic growth causality in 49 countries: A dynamic panel data approach.
Procedia Economics and Finance, 23(October 2014), 1613–1623.
https://doi.org/10.1016/s2212-5671(15)00402-5
Sequeira, T. N., & Nunes, P. M. (2008). Does tourism influence economic growth? A
dynamic panel data approachy. Applied Economics, 40(18), 2431–2441.
https://doi.org/10.1080/00036840600949520
Setiyawati, A., & Hamzah, A. (2007). Analisis pengaruh PAD, DAU, DAK, dan
belanja pembangunan terhadap pertumbuhan ekonomi, kemiskinan, dan
pengangguran: Pendekatan analisis Jalur. Jurnal Akuntansi Dan Keuangan
Indonesia, 4(2), 211–228. https://doi.org/10.21002/jaki.2007.11
Sihaloho, E. D. (2020). Analisis pengaruh penerimaan pajak terhadap pertumbuhan
ekonomi indonesia: pendekatan vektor autoregressive. Forum Ekonomi, 22(2),
202–209.
Sokhanvar, A. (2019). Does foreign direct investment accelerate tourism and
economic growth within Europe ? Tourism Management Perspectives,
29(September 2018), 86–96. https://doi.org/10.1016/j.tmp.2018.10.005
Sowwam, M., Riyanto, Anindita, D., Riyadi, S. A., & Qibthiyyah, R. M. (2018).
Kajian dampak sektor pariwisata terhadap perekonomian Indonesia. In
Lembaga Penyelidikan Ekonomi dan Masyaraka.
https://kemenparekraf.go.id/asset_admin/assets/uploads/media/pdf/media_15
54%0A437393_Laporan_Akhir.pdf
Stimson, R. J., Stough, R. R., & Roberts, B. H. (2002). Regional economic
development (Vol. 35, Issue 2). Springer Berlin Heidelberg.
https://doi.org/10.1007/978-3-662-04911-2
Sugara, D. B., & Winarso, W. (2013). Pengaruh pendapatan pariwisata terhadap
pendapatan asli daerah di Kabupaten Garut. Jurnal Ecodemica: Jurnal
Ekonomi, Manajemen, Dan Bisnis, 1(2), 14–22.

Jurnal Ekonomi dan Bisnis, Volume 24 No. 2 October 2021, 211 - 236 235
Sun, Z., Chang, C.-P., & Hao, Y. (2017). Fiscal decentralization and China’s
provincial economic growth: A panel data analysis for China’s tax sharing
system. Quality & Quantity, 51(5), 2267–2289.
Sunanto. (2015). Analisis pengaruh pajak daerah terhadap pendapatan asli daerah
(PAD) di Kabupaten Musi Banyuasin. Jurnal ACSY : Jurnal Accounting
Politeknik Sekayu, 2(1), 1–10.
Sunarto & Sunyoto, T. (2016). Pengaruh pajak daerah dan retribusi daerah terhadap
kemandirian daerah yang berdampak pada pertumbuhan ekonomi daerah
(Studi empiris pada kabupaten dan kota di Jawa Tengah). Dharma Ekonomi,
13(43), 13–22.
Suwandika, P. E., & Yasa, I. N. M. (2015). Pengaruh pendapatan asli daerah dan
investasi terhadap pertumbuhan ekonomi dan tingkat pengangguran di Provinsi
Bali. E-Jurnal Ekonomi Pembangunan Universitas Udayana, 4(7), 794–810.
Tarasova, V. V., & Tarasov, V. E. (2018). Concept of dynamic memory in economics.
Communications in Nonlinear Science and Numerical Simulation, 55, 127–
145. https://doi.org/10.1016/j.cnsns.2017.06.032
Tendean, J., Palar, S., & Tolosang, K. (2014). Pengaruh jumlah wisatawan terhadap
pendapatan asli daerah (PAD) Kota Manado melalui pajak hotel sebagai
intervening variabel. Jurnal Berkala Ilmiah Efisiensi, 14(3), 1–15.
Tiebout, C. M. (1961). An economic theory of fiscal decentralization. In Public
Finances: Needs, Sources, and Utilization: Vol. I (pp. 79–96).
http://www.nber.org/books/univ61-1
Tugcu, C. T. (2014). Tourism and economic growth nexus revisited: A panel causality
analysis for the case of the Mediterranean Region. Tourism Management, 42,
207–212. https://doi.org/10.1016/j.tourman.2013.12.007
Ucak, A. (2015). Adam Smith: The inspirer of modern growth theories. Procedia -
Social and Behavioral Sciences, 195(284), 663–672.
https://doi.org/10.1016/j.sbspro.2015.06.258
Waryanto, P. (2017). Pengaruh belanja modal terhadap pertumbuhan ekonomi di
Indonesia. Indonesian Treasury Review: Jurnal Perbendaharaan, Keuangan
Negara Dan Kebijakan Publik, 2(1), 35–55.
Webster, C., & Ivanov, S. (2014). Transforming competitiveness into economic
benefits: Does tourism stimulate economic growth in more competitive
destinations? Tourism Management, 40, 137–140.
https://doi.org/10.1016/j.tourman.2013.06.003

236 Regional economic growth based on tourism….(Hakim, Dewi)
Wong, K. K. K.-K. (2013). Partial Least Squares Structural Equation Modeling (PLS-
SEM) techniques using SmartPLS. Marketing Bulletin, 24(1), 1–32.
Wulandari, P. A., & Iryanie, E. (2016). Analisis pengaruh kontribusi pajak daerah
terhadap pendapatan asli daerah (PAD) Kota Banjarmasin. Prosiding Seminar
Nasional Indocompac.
Yasin, M. (2003). Public spending and economic growth: Empirical investigation of
Sub-Saharan Africa. Southwestern Economic Review, 30(1), 59–68.
Yuliana, Y. (2014). Pengaruh pendapatan asli daerah dan belanja modal terhadap
pertumbuhan ekonomi (Studi pada kabupaten/kota di Pulau Sumatra). Jurnal
Akuntansi Dan Keuangan Universitas Bandar Lampung, 5(1), 33–48.
Yushkov, A. (2015). Fiscal decentralization and regional economic growth: Theory,
empirics, and the Russian experience. Russian Journal of Economics, 1(4),
404–418. https://doi.org/10.1016/j.ruje.2016.02.004