reflecting on performance feedback: the effect of
TRANSCRIPT
Kennesaw State UniversityDigitalCommons@Kennesaw State University
Doctor of Business Administration Dissertations Coles College of Business
Summer 7-1-2016
Reflecting on Performance Feedback: The Effect ofCounterfactual Thinking on Subsequent LeaderPerformanceKelly R. HallKennesaw State University
Follow this and additional works at: http://digitalcommons.kennesaw.edu/dba_etd
Part of the Organizational Behavior and Theory Commons, Performance ManagementCommons, and the Training and Development Commons
This Dissertation is brought to you for free and open access by the Coles College of Business at DigitalCommons@Kennesaw State University. It hasbeen accepted for inclusion in Doctor of Business Administration Dissertations by an authorized administrator of DigitalCommons@Kennesaw StateUniversity. For more information, please contact [email protected].
Recommended CitationHall, Kelly R., "Reflecting on Performance Feedback: The Effect of Counterfactual Thinking on Subsequent Leader Performance"(2016). Doctor of Business Administration Dissertations. Paper 22.
REFLECTING ON PERFORMANCE FEEDBACK: THE EFFECT OF
COUNTERFACTUAL THINKING ON SUBSEQUENT LEADER PERFORMANCE
by
Kelly R. Hall
A Dissertation
Presented in Partial Fulfillment of Requirements for the
Degree of
Doctor of Business Administration
In the
Coles College of Business
Kennesaw State University
Kennesaw, GA
2016

Copyright by
Kelly R. Hall
2016

iii
ACKNOWLEDGEMENTS
The pursuit of this degree has taught me many things, both academically and
personally. Among its most important lessons is that the bonds of family are
demonstrated not in good times but in the face of challenge. My husband, Reese, has
made many sacrifices to support my goals, and his patience and encouragement have
never wavered. He has always been there to celebrate my successes and to keep me
grounded during times of struggle. I thank him for his enduring love and support, the
many ways in which he has helped me realize my potential, and for being my constant
companion and friend.
My children, David and Holly, have been my continuous source of inspiration.
Not only have they too made sacrifices, but they have also been incredibly understanding
and patient during this process. They taught me the power of seemingly small words, and
I thank them for the many times they said “good luck,” “great job,” and “it will be ok.”
They motivated me to push through the most difficult days.
My husband and children’s support have been matched only by that of my
parents, Jan and Rick Balota. I thank them for their living lessons on the importance of a
strong work ethic and perseverance. I appreciate the many times my mom listened to my
ideas and offered unique insight and encouragement. I thank my dad for the remarkable
and countless sacrifices he has made for his children, as well as for his words of wisdom.

iv
My parents’ unfailing devotion and commitment to family have enabled me to attain this
goal and to excel in life.
I have also come to understand that there is no substitute for faculty who
genuinely care about the success of their students and are committed to going the extra
mile to help students succeed. I owe a special thanks to my committee chair and mentor,
Dr. Neal Mero. His support has surpassed anything that I could have expected. I thank
him for supporting my vision and encouraging me during the most challenging aspects of
this project. Through his mentorship, I have learned many valuable lessons, and I
appreciate all he has done to support me within and beyond this program. Likewise, I am
indebted to my committee members, Dr. Robin Cheramie and Dr. Steve Werner, as well
as all of the DBA faculty and Global Scholars who have contributed to my growth and
development. Similarly, many faculty members contributed to this research by offering
recommendations, serving as expert judges, and assisting with participant recruitment. I
greatly appreciate their time and support.
I thank my cohort members and friends with whom I have shared this journey. I
would like to extend a special thanks to Dana Harrison and James Smith whose
friendship, assistance, and laughter during this program have been invaluable. I thank
Dana for walking alongside me and for sharing the joys, excitement, and challenges of
this endeavor. I thank James for the support, encouragement, and suggestions during
times of frustration and uncertainty. Likewise, I thank Shawn Wilson for his time and
assistance with critical tasks associated with this project. Finally, I thank my many cohort
members who served as expert judges and assisted with various dissertation tasks. I

v
appreciate the friendships I have made in this program, and I count them among my many
blessings.
I am also grateful to the friends and family who contributed to this research by
serving as actors and crewmembers. I am incredibly thankful for the help of Reese Hall,
David Hall, Jim McMillan, Kelly Moore, Ameret Carlson, Brandon Wilhoit, Reggie
Oates, Ryan Johnson, Joyce Armijo, Gabriella Ochsenfeld, and Tamara Stanger. I am
also grateful to Dennis and Nicole Roehl for their willingness to allow me the use of their
business facilities for filming purposes.
Finally, I would like to thank my colleagues at Stetson University for their
support. I appreciate their complete confidence and their ongoing encouragement
throughout this endeavor. I am thankful to have had such a tremendous support system.

vi
DEDICATION
I dedicate this dissertation to the one who taught me how to push the limits and to
be graceful under pressure—to the loving memory of my best friend and grandmother,
Betty Jo Reese.
vii
ABSTRACT
REFLECTING ON PERFORMANCE FEEDBACK: THE EFFECT OF
COUNTERFACTUAL THINKING ON SUBSEQUENT LEADER PERFORMANCE
by
Kelly R. Hall
Performance feedback is an integral aspect of facilitating employee learning.
Despite its importance, research suggests that when that feedback conveys a performance
discrepancy, subsequent performance does not improve. Researchers have advanced
reflection as a strategy for increasing feedback effectiveness and have established its
value for learning and performance improvement. However, these studies have not
accounted for the effects of specific types of reflection on performance. To this point, the
current research examines the role of one form of reflection, counterfactual thinking, for
learning after performance discrepancies. I explored boundary conditions that might
influence self-focused upward counterfactual thinking—a form of reflection particularly
important for learning and performance improvement—and examined whether and when
such thinking influences the relationship between a baseline performance discrepancy
and subsequent performance. To investigate these issues, I designed, developed, and
validated a computer simulated leadership skills task and administered it to graduate and
undergraduate students (N= 169) in a web-based research setting. I tested the proposed
relationships using conditional process analysis. The results of this study demonstrated
that when individuals encounter performance discrepancies they might attempt to
viii
reconcile such through self-focused upward counterfactual thinking. This research
represents a step toward an improved understanding of reflection, performance
discrepancy feedback processing, and subsequent performance effects.
Keywords: Counterfactual thinking, performance feedback, reflection, simulations.
ix
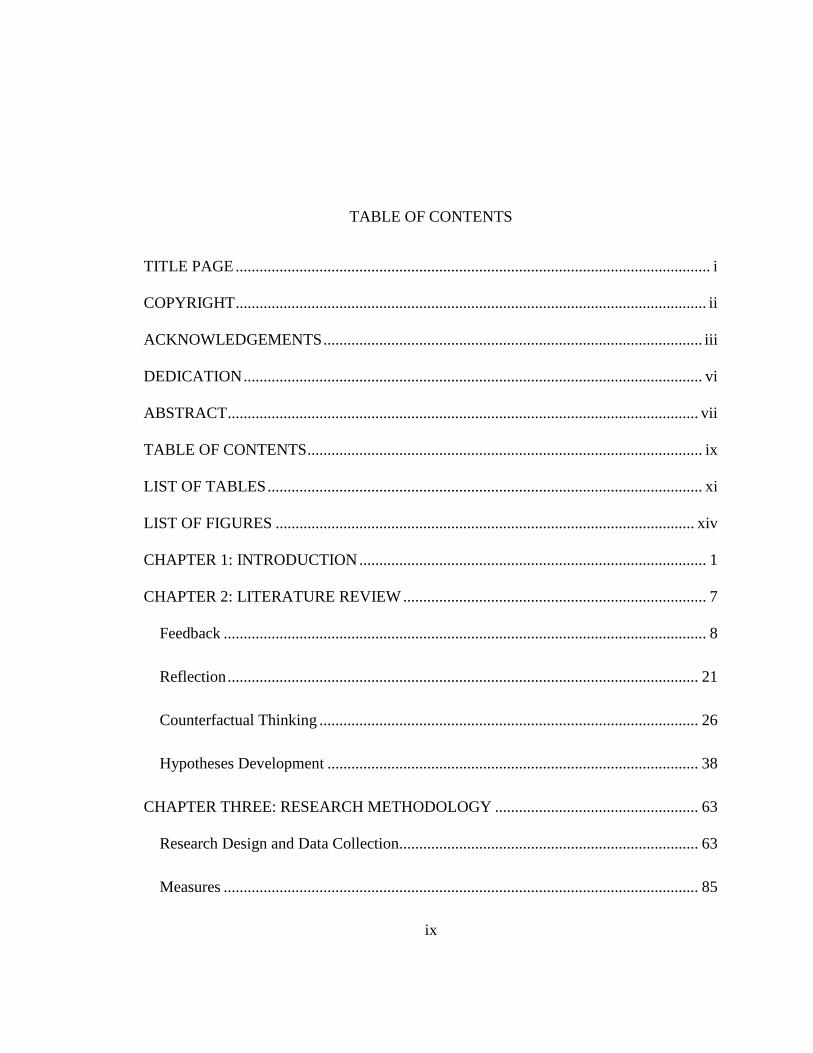
TABLE OF CONTENTS
TITLE PAGE ....................................................................................................................... i
COPYRIGHT ...................................................................................................................... ii
ACKNOWLEDGEMENTS ............................................................................................... iii
DEDICATION ................................................................................................................... vi
ABSTRACT ...................................................................................................................... vii
TABLE OF CONTENTS ................................................................................................... ix
LIST OF TABLES ............................................................................................................. xi
LIST OF FIGURES ......................................................................................................... xiv
CHAPTER 1: INTRODUCTION ....................................................................................... 1
CHAPTER 2: LITERATURE REVIEW ............................................................................ 7
Feedback ......................................................................................................................... 8
Reflection ...................................................................................................................... 21
Counterfactual Thinking ............................................................................................... 26
Hypotheses Development ............................................................................................. 38
CHAPTER THREE: RESEARCH METHODOLOGY ................................................... 63
Research Design and Data Collection........................................................................... 63
Measures ....................................................................................................................... 85
x
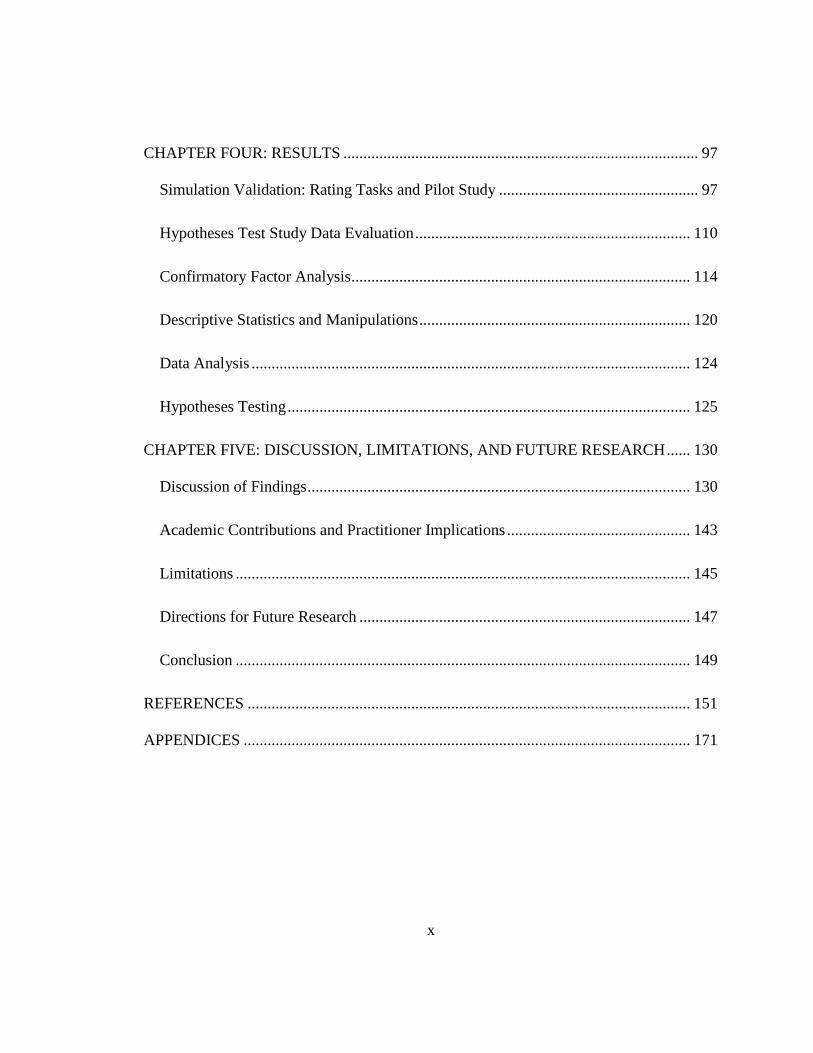
CHAPTER FOUR: RESULTS ......................................................................................... 97
Simulation Validation: Rating Tasks and Pilot Study .................................................. 97
Hypotheses Test Study Data Evaluation ..................................................................... 110
Confirmatory Factor Analysis ..................................................................................... 114
Descriptive Statistics and Manipulations .................................................................... 120
Data Analysis .............................................................................................................. 124
Hypotheses Testing ..................................................................................................... 125
CHAPTER FIVE: DISCUSSION, LIMITATIONS, AND FUTURE RESEARCH ...... 130
Discussion of Findings ................................................................................................ 130
Academic Contributions and Practitioner Implications .............................................. 143
Limitations .................................................................................................................. 145
Directions for Future Research ................................................................................... 147
Conclusion .................................................................................................................. 149
REFERENCES ............................................................................................................... 151
APPENDICES ................................................................................................................ 171
xi
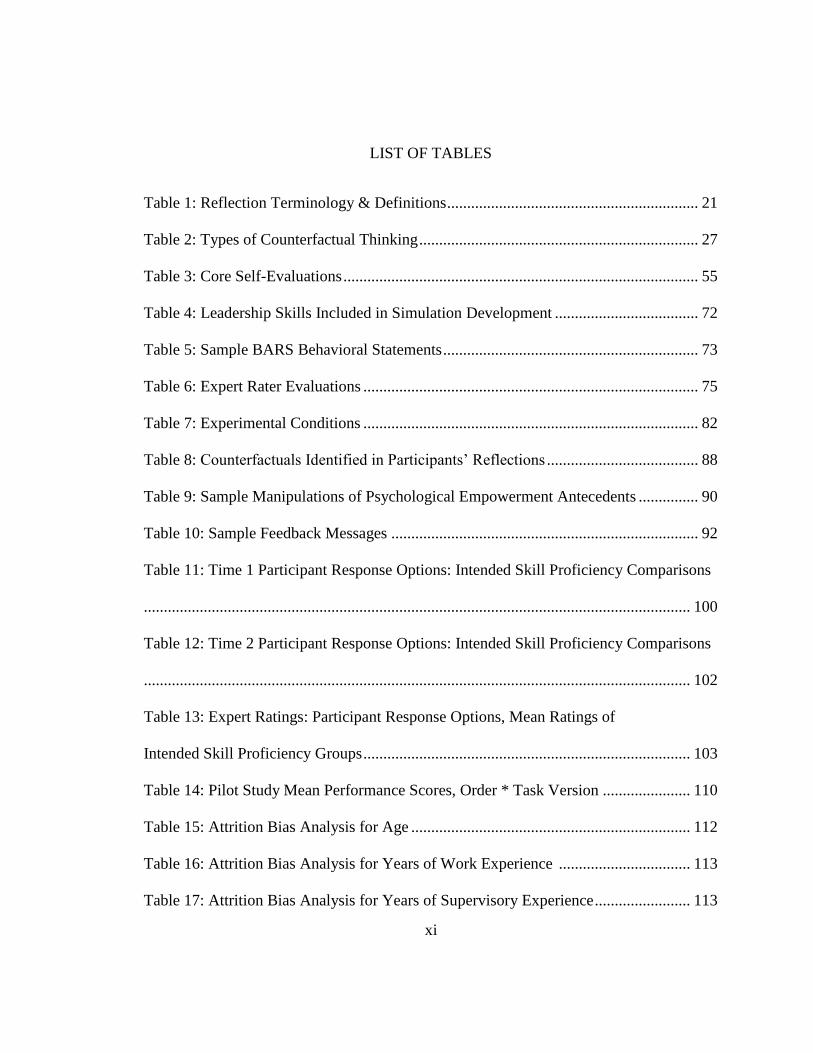
LIST OF TABLES
Table 1: Reflection Terminology & Definitions ............................................................... 21
Table 2: Types of Counterfactual Thinking ...................................................................... 27
Table 3: Core Self-Evaluations ......................................................................................... 55
Table 4: Leadership Skills Included in Simulation Development .................................... 72
Table 5: Sample BARS Behavioral Statements ................................................................ 73
Table 6: Expert Rater Evaluations .................................................................................... 75
Table 7: Experimental Conditions .................................................................................... 82
Table 8: Counterfactuals Identified in Participants’ Reflections ...................................... 88
Table 9: Sample Manipulations of Psychological Empowerment Antecedents ............... 90
Table 10: Sample Feedback Messages ............................................................................. 92
Table 11: Time 1 Participant Response Options: Intended Skill Proficiency Comparisons
......................................................................................................................................... 100
Table 12: Time 2 Participant Response Options: Intended Skill Proficiency Comparisons
......................................................................................................................................... 102
Table 13: Expert Ratings: Participant Response Options, Mean Ratings of
Intended Skill Proficiency Groups .................................................................................. 103
Table 14: Pilot Study Mean Performance Scores, Order * Task Version ...................... 110
Table 15: Attrition Bias Analysis for Age ...................................................................... 112
Table 16: Attrition Bias Analysis for Years of Work Experience ................................. 113
Table 17: Attrition Bias Analysis for Years of Supervisory Experience ........................ 113
xii
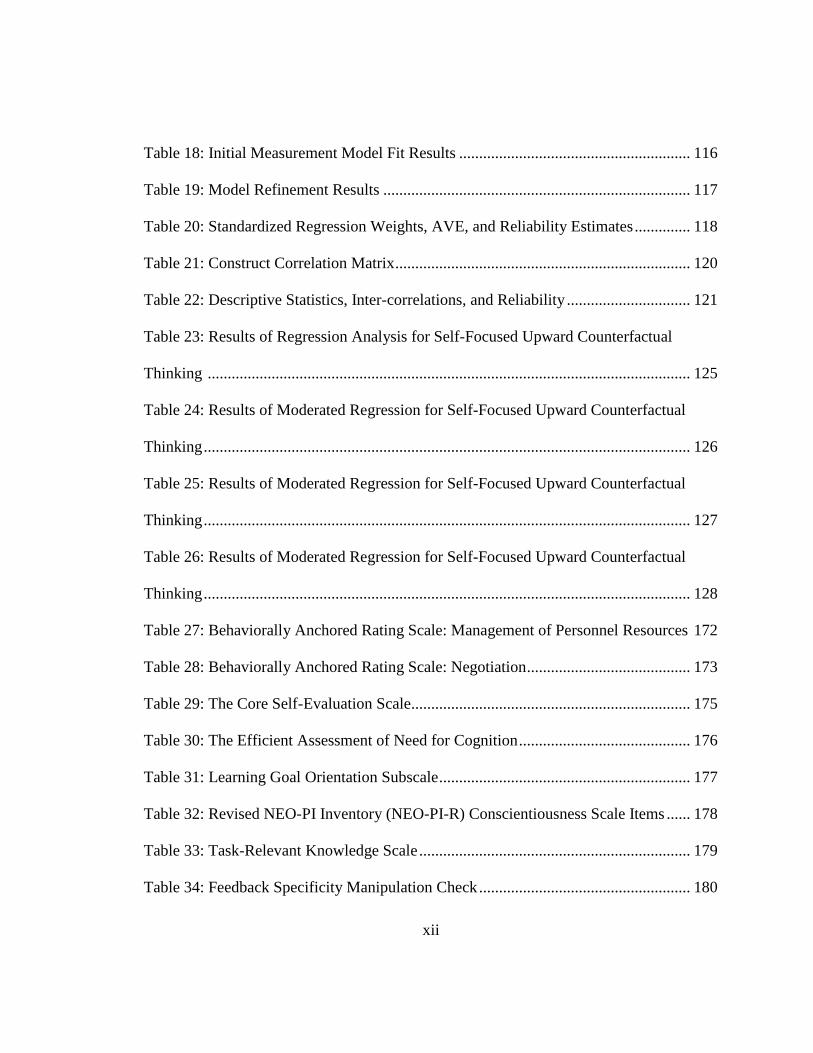
Table 18: Initial Measurement Model Fit Results .......................................................... 116
Table 19: Model Refinement Results ............................................................................. 117
Table 20: Standardized Regression Weights, AVE, and Reliability Estimates .............. 118
Table 21: Construct Correlation Matrix .......................................................................... 120
Table 22: Descriptive Statistics, Inter-correlations, and Reliability ............................... 121
Table 23: Results of Regression Analysis for Self-Focused Upward Counterfactual
Thinking ......................................................................................................................... 125
Table 24: Results of Moderated Regression for Self-Focused Upward Counterfactual
Thinking .......................................................................................................................... 126
Table 25: Results of Moderated Regression for Self-Focused Upward Counterfactual
Thinking .......................................................................................................................... 127
Table 26: Results of Moderated Regression for Self-Focused Upward Counterfactual
Thinking .......................................................................................................................... 128
Table 27: Behaviorally Anchored Rating Scale: Management of Personnel Resources 172
Table 28: Behaviorally Anchored Rating Scale: Negotiation ......................................... 173
Table 29: The Core Self-Evaluation Scale...................................................................... 175
Table 30: The Efficient Assessment of Need for Cognition ........................................... 176
Table 31: Learning Goal Orientation Subscale ............................................................... 177
Table 32: Revised NEO-PI Inventory (NEO-PI-R) Conscientiousness Scale Items ...... 178
Table 33: Task-Relevant Knowledge Scale .................................................................... 179
Table 34: Feedback Specificity Manipulation Check ..................................................... 180

xiii
Table 35: Adapted Manipulation Check for the Current Study ...................................... 180
Table 36: Psychological Empowerment in the Workplace Scale ................................... 181
Table 37: Adapted Psychological Empowerment Scale for the Current Study .............. 181
xiv
LIST OF FIGURES
Figure 1: Content-Specific vs. Content-Neutral Pathways of Counterfactual Thinking .. 35
Figure 2: Hypothesized Relationships .............................................................................. 39
Figure 3: The O*NET Content Model .............................................................................. 67
Figure 4: Sample Simulation Audio-Video Content: Manager - Employee Interaction .. 68
Figure 5: Sample Simulation Graphic: Manager’s Email Correspondence ...................... 69
Figure 6: Data Collection Process..................................................................................... 81
Figure 7: Initial Measurement Model ............................................................................. 115
1
CHAPTER 1: INTRODUCTION
Employee learning has important consequences for individual thought and
behavior. Employee learning is also vital to the success of an organization; it is
considered a prerequisite for organizational adaptability and competitiveness (Maurer,
Pierce, & Shore, 2002). Due to its importance, companies devote significant resources to
learning. For example, in 2012, organizations in the United States invested $164 billion
in learning initiatives (Miller, 2013).
One of the most integral aspects of facilitating employee learning is providing
feedback (Kuchinke, 2000). Feedback is any information regarding the effectiveness of
an individual’s behavior (Ilgen, Fisher, & Taylor, 1979). Although feedback is ubiquitous
in organizations (Kinicki, Prussia, Wu, & McKee-Ryan, 2004), there are multiple
characteristics that can make any one instance of feedback unique. For example, feedback
may convey goal attainment (i.e. positive feedback) or it may convey a performance
discrepancy (i.e. negative/corrective feedback) (Ilgen et al., 1979). Recent findings
suggest that up to 90% of employees believe that receiving feedback about their
performance discrepancies is critical for performance improvement, and more than 50%
indicate they would prefer to receive such feedback to praise (Zenger & Folkman, 2015).
While many employees prefer corrective feedback, and it is vital for organizations to
provide it to employees, there is little evidence that providing such feedback actually
2
leads to performance improvement (e.g. Anseel & Lievens, 2006; Kluger & DeNisi,
1996).
The influence of feedback on performance has been investigated for nearly a
century (Arps, 1917), and we know that when individuals encounter performance
discrepancies, they may respond with self-enhancement strivings. Self-enhancement
strivings are strivings that drive individuals to protect themselves from threatening
information (e.g. corrective feedback) and increase favorable self-views (Sedikides &
Strube, 1997). Self-enhancement strivings may lead one to dismiss corrective feedback,
which can inhibit learning processes and subsequently maintain or lower performance
levels (Anseel & Lievens, 2006; Kluger & DeNisi, 1996). Thus, it is important to identify
strategies that reduce such strivings and increase feedback effectiveness (Kinicki et al.,
2004). To this point, encouraging feedback recipients to actively process and elaborate on
feedback has been proposed as a way to reduce self-enhancement strivings and to
increase the acceptance of unfavorable feedback (Anseel & Lievens, 2006).
Recently, scholars have positioned reflection as a learning intervention that can
help employees process feedback and experiences, thereby increasing the likelihood of
learning, behavior change, and performance improvement (e.g. Anseel, Lievens, &
Schollaert, 2009; DeRue, Nahrgang, Hollenbeck, & Workman, 2012; Ellis, Carette,
Anseel, & Lievens, 2014). Reflection has long been regarded as a critical component of
the learning process (Dewey, 1933). Through probing cause and effect, questioning
assumptions, and analyzing the meaning of experiences, one can increase his or her
3
awareness of personal experiences and therefore his or her ability to learn from those
experiences (Ashford & DeRue, 2012; Hullfish & Smith, 1961). Scholars have found
positive effects of reflective techniques in the feedback-performance relationship (e.g.
Anseel et al., 2009; Ellis et al., 2014; Villado & Arthur, 2013). Such findings have been
reported for individual written reflection strategies and structured group reflections (e.g.
after-event-reviews).
Despite the positive effects of reflection on learning, we know little about
situational and contextual factors that support or hinder reflection in the workplace. To
better understand the effects of reflection on employee learning and its role in feedback
processing, I suggest that it is important to identify boundary conditions that prompt
individuals to reflect and those that may accentuate or attenuate the effects of reflection
on performance. Extant literature offers limited insight into such issues as of yet. Thus,
the conceptual basis for evaluating learning through reflection is incomplete.
The purpose of the current research is to offer a more complete picture of the
effects of reflection. To this end, I will explore counterfactual thinking, a form of
reflection that has received insufficient attention in management studies (Ellis et al.,
2014), as well as its effects on a key learning outcome, performance. Counterfactual
thoughts are mental representations of alternatives to past events, actions, or states
(Byrne, 2005; Roese, 1997). Prior management studies (e.g. Anseel et al., 2009; DeRue et
al., 2012; Ellis & Davidi, 2005; Ellis, Ganzach, Castle, & Sekely, 2010; Ellis, Mendel, &
Aloni-Zohar, 2009; Ellis, Mendel, & Nir, 2006) have not empirically examined how
4
counterfactual thoughts influence the ways in which one learns from and responds to
feedback and experiences; yet, it is important to do so.
Counterfactual thinking is a core feature of human cognition (Sanna & Chang,
2003). Neural networks monitor counterfactual experiences and outcomes—similar to the
monitoring of direct experiences (Platt & Hayden, 2011). When individuals engage in
reflection, they not only consider what they did do, but also what could or should have
been done (Epstude & Roese, 2008). Counterfactual thoughts can enhance awareness of
what could have ensued from alternate behavioral choices (Boorman, Behrens, &
Rushworth, 2011). This is important because, often, performance is improved by altering
past performance strategies (Ilgen & Davis, 2000). Therefore, I argue that counterfactual
thinking, which can illuminate such strategies and enhance motivation, warrants
empirical attention.
Though not empirically examined in extant management literature, the potential
value of counterfactual thinking has been acknowledged by management scholars (Ellis
et al., 2014). Specifically, counterfactual thinking is thought to help learners overcome
perception biases and adjust mental models. These same scholars, as well as others
(DeRue et al., 2012), highlight the need to better understand how counterfactual thinking
contributes to reflective learning and development. Furthering this understanding will not
only provide insight on cognitive mechanisms that influence how one learns from
feedback; it is also expected to provide insight on how to improve responses to corrective
5
feedback that conveys performance discrepancies, an important issue to researchers and
managers alike.
To these points, it is important to consider whether reflecting on alternate courses
of actions reduce dismissal of such feedback and, instead, lead to performance
improvement. Likewise, it is important to consider what determines whether the recipient
will act on lessons learned to improve performance. To address these questions, I argue
that scholars must look beyond constructs considered in traditional feedback process
models (Fedor, Davis, Maslyn, & Mathieson, 2001; Ilgen et al., 1979; Kluger & DeNisi,
1996; Nadler, 1979). While there is empirical support for a fundamental proposition of
such models (i.e. individuals go through a series of cognitive evaluations before
responding to feedback), the models have been better predictors of responses to favorable
feedback than to unfavorable feedback (Kinicki et al., 2004). Thus, when examining
corrective feedback that highlights performance discrepancies, other cognitive processes
must be considered.
Scholars contented that when individuals encounter corrective feedback on
performance discrepancies, they will work harder (e.g. expend more effort, persist, and
focus on the task) if the feedback triggers motivational processes (Kluger & DeNisi,
1996). Many times, it does not. Moreover, most individuals will not try to determine
why their performance strategies failed or generate ideas for improved performance, until
after they have exhausted a ‘work harder’ strategy (Kluger & DeNisi, 1996). Here, we
see an inherent challenge of corrective feedback. If we struggle to get individuals to work
6
harder when they encounter a performance discrepancy, how then, can we get them to
work smarter?
I suggest that, when prompted to reflect on alternate behaviors and work
strategies, as well as potential outcomes of such, it may help individuals overcome the
breakdown that frequently occurs between the receipt of corrective feedback and
intentions to respond to the feedback. I propose to integrate established theory from the
psychology field—the functional theory of counterfactual thinking (Epstude & Roese,
2008)—to investigate how counterfactual thinking influences feedback processing and
subsequent performance.
The current research will contribute to both the reflective learning and feedback
literatures. This research untangles counterfactual thinking from other aspects of
reflection, such as self-explanation, wherein learners explain behaviors they did
implement. Past management research has not accounted for the unique impact of
counterfactuals on performance and, to date, reflection studies in the management
literature have largely emphasized conversational forms of reflection such as after-event-
reviews (e.g. Ellis et al., 2014). Contextual factors, expected to exert distinct effects on
counterfactual generation, are also investigated. The result is expected to be an improved
understanding of reflection processes and effects on performance. Finally, the current
research considers the indirect effect of counterfactual thinking in processing feedback
that conveys performance discrepancies, which is expected to reduce the dismissal of
such feedback and lead to improved performance.
7
CHAPTER 2: LITERATURE REVIEW
To better understand how reflection can influence feedback processing and
learning, this research examines the effects of counterfactual thinking on learning
following performance discrepancies. In this chapter, I will present a review of learning
literature and propose a model that focuses on boundary conditions that influence
counterfactual thinking and when such thinking affects task performance. Specifically,
chapter two is organized into five sections.
The first section provides a review of the feedback literature with an emphasis on
the functions of feedback, its effects on performance, two feedback characteristics—sign
and specificity, as well as feedback process models. The second section reviews
reflection, particularly its contribution to learning and how reflection has been integrated
into management studies. In the third section, I narrow down to a specific form of
reflection, counterfactual thinking, and provide a detailed review of findings from the
psychology literature. The fourth section presents the functional theory of counterfactual
thinking to illustrate how counterfactuals can impact how individuals may process
feedback that conveys performance discrepancies and subsequent behaviors. The last
section includes the proposed boundary conditions that influence counterfactual thinking,
as well as its effect on performance, and I advance the conceptual framework through the
development of hypotheses.
8
Feedback
Feedback is ubiquitous in organizations (Kinicki et al., 2004), and it is a core job
characteristic according to Hackman and Oldham’s (1976) theory of work design
(Hackman & Lawler, 1971; Hackman & Oldham, 1976). It has been defined as any
information regarding the effectiveness of an individual’s behavior (Ilgen et al., 1979).
Feedback may be initiated by an external agent (e.g. manager, supervisor, etc.), or
individuals may proactively seek feedback by monitoring the environment or requesting
feedback (i.e. feedback inquiry) (Ashford & Cummings, 1983; Kluger & DeNisi, 1996).
Receiving feedback is important; it provides critical information about employees’ work
behaviors. For instance, feedback helps employees know if their behaviors are correct,
accurate, and adequate (Bourne, 1957; Earley, Northcraft, Lee, & Lituchy, 1990). Thus,
feedback reduces uncertainty and signals the relative importance of goals in a workplace
(Ashford & Cummings, 1983). Through feedback, employees can gain information about
performance outcomes (i.e. outcome feedback) and on strategies used to obtain the
outcomes (i.e. process feedback) (Earley et al., 1990).
Functions of Feedback.
Feedback serves multiple purposes, including directive, incentive, and
motivational functions (Payne & Hauty, 1955; Vroom, 1964). Most individuals, at some
point, have lacked clarity in their jobs. By providing direction and clarifying roles,
feedback can help employees overcome this challenge. Similarly, employees may find
9
themselves questioning the need to engage in certain behaviors or thinking ‘what’s in it
for me?’ The incentive function of feedback addresses such issues by signaling expected
payoffs for engaging in various workplace behaviors. Feedback can also ignite
motivation processes, as it contains referent information that can help employees meet
goals (Herold & Greller, 1977), as well as higher-order needs (Deci & Ryan, 1992;
Hackman & Oldham, 1976). By providing performance discrepancy information and
increasing employees’ awareness of their performance, feedback can influence self-
efficacy (Bandura & Cervone, 1983), goal commitment (Latham & Locke, 1991), and
can provide employees with a sense of accomplishment and personal control over their
jobs (Deci, 1975; Earley et al., 1990). The numerous effects of feedback make it an
important organizational and individual resource that has meaningful implications for
learning and performance in the workplace (Ashford & Cummings, 1983).
Feedback Characteristics: Sign and Specificity.
Although feedback is common in organizations, there are a number of
characteristics that make any one instance of feedback unique. Feedback sign and
feedback specificity are two such characteristics. Feedback sign refers to the extent to
which the feedback is positive (i.e. favorable; goal attainment) or negative (i.e.
unfavorable; performance discrepancy) (Ilgen et al., 1979). Feedback specificity refers to
the level of information presented in the feedback message (Goodman et al., 2004; 2011).
In the following sections, I will review these two feedback characteristics.
10
Feedback sign. The sign of feedback captures its positive or negative nature. This
feedback characteristic has received a substantial amount of scholarly attention (Kluger
& DeNisi, 1996). Through such efforts, researchers have determined that sign can affect
many outcomes, including a recipient’s performance, recollection, perceptions of
accuracy, and the overall processing of feedback (Fedor et al., 2001; Ilgen et al., 1979;
Kluger & DeNisi, 1996; Smither, Brett, & Atwater, 2007). An example of this can be
seen in Smither et al.’s (2007) study. These scholars examined recipients’ recollection of
feedback, nine months following the feedback intervention, and found that individuals
were able to recall positive feedback more than negative feedback. This may be the result
of individuals’ tendencies to deny and reject negative feedback (Ilgen et al., 1979).
As may be expected, individuals typically view positive feedback more favorably
than negative feedback. This assessment can impact one’s mood, such that favorable
feedback commonly leads to positive affect and unfavorable feedback leads to negative
affect (Ilgen et al., 1979). Recognizing that mood may, in turn, influence the receipt of
feedback, researchers turned their attention to this relationship.
In a social perception task experiment, Ingram (1984) primed participants with
positive and negative moods to determine the impacts on processing favorable and
unfavorable feedback. Findings revealed that mood and favorability interact to influence
how feedback is processed. Those primed with a negative mood experience prior to
receiving unfavorable feedback, had longer reaction times and recalled more of the
feedback than those who were not primed. Ingram argued that for feedback to be fully
11
processed and comprehended, it must be processed at a deep level. In Ingram’s study, this
was facilitated by ensuring subjects were presented with mood-consistent feedback
details (Bower, 1981). In other words, individuals were presented with unfavorable
feedback when they were in negative moods, thus there was an alignment between mood
state and feedback sign.
Although Ingram’s study provided insight regarding the influence of mood on
feedback processes, these effects are not invariable. In fact, the relationship is believed to
be quite complex and, in some cases, moods have no impact or may have mood-
incongruent effects. For example, negative moods, resulting from unfavorable feedback,
may lead to increased motivation, while the reverse being true for positive moods (for a
detailed discussion of the affect infusion model see Forgas & George, 2001). Basically,
what is relevant is that information processing strategies can impact the magnification,
elimination, or reversal of transient mood states that influence the receipt of feedback
(Forgas, 1995).
Kluger and DeNisi (1996) reviewed research on the inconsistent effects of
feedback sign on performance and offered a theoretical explanation for how feedback
sign may lead to varying outcomes. According to these scholars, positive feedback may
signal that an opportunity for self-enhancement is present which can result in task-
motivation processes. Through these processes, the feedback recipient can be prompted
to raise the standard for performance and to improve future performance. Alternatively,
feedback can also attenuate performance effects. Kluger and DeNisi (1996) suggest that
12
attenuation effects occur when feedback shifts attention to oneself, affective reactions, or
framing effects. They argue that these attentional shifts deplete cognitive resources,
hinder performance, and may cause the feedback recipient to maintain the performance
standard, rather than seeking a higher performance goal. These effects are concerning,
especially in the case of a performance discrepancy, as feedback details and the
development of alternative work strategies for performance improvement fade into the
background of one’s thought processes (Kluger & DeNisi, 1996).
Krenn, Würth, & Hergovich (2013) found support for some of Kluger & DeNisi’s
(1996) theoretical arguments. During a selective attention task, participants were given
the option to raise the task difficulty level following feedback. Those who received
positive feedback were more likely to raise the standard; whereas, those who received
negative feedback were more likely to maintain the standard. Yet, interestingly, when
performance scores from round one and round two of the study were compared, there
were no significant performance improvements for those who chose to raise the
performance standard following negative feedback. It appears that, perhaps, subjects had
the motivation to increase the standard, though they lacked a performance improvement
strategy. Other subjects, who chose to maintain the standard (i.e. the task difficulty level)
following negative feedback, also struggled with subsequent performance efforts. For
these individuals, performance levels across rounds remained constant and, in some
cases, worsened. Ultimately, while feedback sign provides important cues about task-goal
13
discrepancies, empirical findings on the effect of feedback sign on performance have
been inconsistent (Kluger & DeNisi, 1996).
Feedback specificity. Feedback can vary based on the level of information
presented in the feedback message, otherwise known as feedback specificity (Goodman
et al., 2004). Earley et al. (1990) compared the effects of varying levels of feedback
specificity during a stock investment simulation. More precisely, they assessed how such
influences the relationships between feedback and goal-setting, self-confidence, effort,
and appropriateness of information search. Their study showed that specific feedback
rather than less specific feedback, appeared to be a more effective way to shape one’s
task strategy. Fedor (1991) supported this position and argued that specific feedback
prevents uncertainty about how individuals should respond to the feedback.
Despite support for the value of specific feedback, Kluger and DeNisi (1996)
suggested that the effects of feedback specificity are less clear. They argued that while
there does appear to be a link between feedback specificity and learning, one should not
assume that specific feedback always leads to learning, as empirical data suggest
otherwise. In some cases, feedback can be too specific and/or the specific information
may conflict with the recipient’s natural cognitive representation of the task. As a result,
specific feedback may impede learning and performance (Kluger & DeNisi, 1996). This
presents a challenge for those tasked with providing feedback—low feedback specificity
may leave the recipient feeling uncertain, while high specificity may hinder learning
processes.
14
Research by Davis, Carson, Ammeter, & Treadway (2005), as well as Goodman
and colleagues (2004, 2011), further highlight the complexities of feedback specificity.
Davis et al. (2005) found that specific feedback was more effective for those with a
performance goal orientation, whereas it was less effective for those with a learning
orientation. Feedback specificity has also been shown to negatively impact exploratory
behavior, learning, and transfer of training (Goodman et al., 2004, 2011). From this
research, one may question if less specific feedback is more beneficial in situations that
call for corrective action (e.g. performance discrepancies).
Feys, Anseel, & Wille (2011) revealed findings that may help to answer such a
question. These scholars examined the influence of feedback specificity on initial
feedback reactions—a critical component of feedback processing. They found that
unfavorable reactions to negative feedback were more pronounced as information
specificity increased. Based on this finding, Feys et al. cautioned the use of high
specificity feedback and suggested that less specific feedback, combined with guided
reflection, may be more beneficial for recipients of unfavorable feedback.
In spite of the contradictory findings regarding the benefits of specific feedback,
managers are still trained and encouraged to give specific feedback (Goodman et al.,
2004; Tyler, 2012). Could this practice actually be hindering the learning and
development of current and future leaders? To consider this possibility, it is important to
review how employees process feedback.
15
While the focus throughout this section has been on feedback sign and specificity,
some details of feedback processing have emerged. In the following section, I will
elaborate on feedback process models and provide a richer understanding of the cognitive
steps one is believed to go through upon receiving feedback.
Feedback Process Models.
Feedback is not a simple stimulus (Ilgen et al., 1979), nor is the overall feedback
process. Scholars have identified cognitive processes that are believed to mediate the
relationship between the receipt of feedback and the response to feedback. While there
are multiple theoretical models that present this process (e.g. Fedor, 1991; Ilgen et al.,
1979; Kluger & DeNisi, 1996; Taylor et al., 1984), I will review two—Kluger &
DeNisi’s (1996) model and Ilgen et al.’s (1979) model.
I limit the review to the aforementioned models for specific reasons. Although,
Kluger & DeNisi’s model, compared to other models, is complex and less amendable to
advanced statistical processes (Kinicki et al., 2004), it does provide theoretical arguments
that are specific to learning. Because learning is a focal point of the current study, Kluger
and DeNisi’s arguments are worth noting. Similarly, Ilgen et al.’s model can also add
value to the current discussion. It is the foundation of the other feedback process models
and a parsimonious representation of the cognitive steps in the feedback process.
Moreover, Ilgen et al.’s model has undergone a longitudinal examination (Kinicki et al.,
2004), wherein the mediating role of cognitive variables in the feedback process was
16
empirically tested using covariance structure analysis. In contrast, variables from other
models (Fedor et al., 1991; Taylor et al., 1984) have been used in bivariate studies, and
the evaluation of psychometric properties of the variables in such studies has been less
robust (Kinicki et al., 2004).
Kluger & DeNisi’s (1996) feedback intervention theory. Recall that Kluger &
DeNisi conducted a meta-analysis that revealed that over a third of feedback
interventions decreased performance. This finding, which could not be explained by
sampling error, feedback sign, or established theories, led to the proposal of the feedback
intervention theory (FIT). The FIT offers an explanation as to how feedback is
cognitively processed and how such processing influences one’s response to feedback.
Kluger & DeNisi argue that behavior is regulated through comparisons of
feedback to goals and standards, of which there are many. These goals and standards are
organized by the individual hierarchically and, upon receiving feedback, individuals shift
their locus of attention to varying levels of the hierarchy. The hierarchy progresses from
task-learning processes (i.e. involving details of the task) to task-motivation (i.e.
involving the focal task) and, finally, meta-task processes (i.e. involving the self). These
three types of processes can impact feedback effectiveness in unique ways.
A core assumption of FIT is that feedback interventions command significant
cognitive resources; yet, individual attention is limited. Feedback cues, the nature of the
task, and situational and personality variables impact how one’s limited attention is
allocated to the hierarchical processes. When attention is directed toward the self, meta-
17
task processes are activated, and these processes attenuate the effects of feedback on
performance. An example of such processes is the activation of affective responses. In
contrast, attention directed to task-motivation processes can lead to increased effort and
persistence. For instance, task-motivation processes can prompt the feedback recipient to
compare the feedback to the task standard, which ultimately contributes to improved
performance. However, in some cases, task-motivation processes are inadequate to
eliminate the feedback-standard discrepancy. As a result, attention may shift to task-
learning processes (e.g. increased cognitive elaboration of feedback). Task-learning
processes help individuals develop working hypotheses and evaluations of their
behaviors, as well as develop task-specific strategies.
Enhancing the effects of feedback on performance is important, particularly in the
case of a performance discrepancy. Strategies for responding to such feedback are to: 1)
increase effort, 2) abandon the standard, 3) change (i.e. lower) the standard, or 4) reject
the feedback (Kluger & DeNisi, 1996). Through their arguments, Kluger and DeNisi
(1996) highlight some of the challenges associated with corrective feedback. Corrective
feedback, shown to lead to affective reactions (Ilgen et al., 1979), can divert attention up
the hierarchy and further away from details of the task. This can hinder task-motivation
processes, the link to task-learning processes. When task-learning processes are not
activated, it can prevent one from identifying improvement strategies and may
subsequently decrease the likelihood of reducing the feedback-standard discrepancy.
Taken together, these findings suggest it may be less likely for recipients of corrective
18
feedback to increase effort and more likely for them to focus on affective reactions or to
disregard the feedback. This is critical given that managers cannot avoid giving negative
or constructive feedback to employees, and employees’ responses to such feedback are
pivotal for performance (Kinicki et al., 2004).
Krenn et al. (2013) lent partial support for the feedback intervention theory. Their
study showed that individuals were more likely to raise the standard following positive
feedback; however, there were no significant performance differences for those who
raised standards following positive feedback and those who maintained standards. In
contrast, corrective feedback was shown to lead to avoidance behaviors and no
significant performance improvements, even when recipients chose to practice and
maintain the standard. Again, this sheds light on the importance of identifying strategies
that may assist individuals with tapping into the benefits of task-learning processes.
Ilgen et al.’s (1979) feedback process model. Ilgen et al. (1979) view the feedback
recipient as a processor of information. Specifically, as individuals receive feedback, they
process the information through a series of sequential cognitive steps that include:
perception of feedback, acceptance of feedback, desire to respond, and intended response.
Depending on the outcome of such processing, feedback may or may not lead to the
desired behavior.
Perception of feedback refers to the extent to which the recipient perceives that
feedback is an accurate representation of his or her behavior and, thus, influences the
acceptance of feedback (Ilgen et al., 1979). These scholars argued that when individuals
19
receive timely, consistent, positive, and specific feedback from a credible and trustworthy
source, they are likely to perceive the feedback as accurate and to accept the feedback.
Individual differences, such as locus of control and self-esteem, can also exert an
influence on the perceptions of feedback and feedback acceptance.
Feedback acceptance prompts a desire to respond to the feedback. A recipient’s
desire to respond is believed to be influenced by the extent to which the feedback
conveys a sense of competence and personal control to the recipient, as well as provides
information about extrinsic rewards associated with the use of feedback. The desire to
respond leads to behavioral intentions. Thus, Ilgen et al. (1979) argued that cognitive
processes mediate the relationship between receipt of feedback and response to feedback.
As noted earlier, Kinicki et al. (2004) tested the Ilgen et al. feedback process
model using covariance structure analysis. This was the first complete test of the
proposition that individuals go through a series of cognitive evaluations prior to
responding to feedback. Consistent with Ilgen et al.’s (1979) model, Kinicki et al. found
strong support for the mediating properties of the cognitive chain. However, in their
empirical test, a gestalt of feedback characteristics—frequency, specificity, and sign
(positive)—was formed to develop a feedback-rich environment construct. In a feedback-
rich environment, individuals receive frequent, specific, and positive feedback. Kinicki et
al. (2004) demonstrated that when the feedback environment is rich, individuals are more
likely to perceive the feedback as accurate. While this finding is important, it does not
help to explain corrective feedback processing. To this point, there is a need for further
20
research that focuses on deep level cognitive processes that mediate the processing of
feedback that conveys performance discrepancies.
From Kinicki et al.’s findings, it seems clear that cognitive processes play a
critical role in how individuals respond to feedback. What remains less clear, however, is
how to help employees overcome attitudinal and behavioral resistance to feedback that
conveys performance discrepancy information (Kinicki et al., 2004). As discussed earlier,
feedback is not always positive, as was represented in the feedback-rich environment
construct, and past findings (Ilgen et al., 1979), as well as theory (e.g. self-consistency;
self-enhancement), support the notion that individuals are less likely to perceive
corrective feedback as accurate and therefore less likely to accept it. It is also not clear if
specific feedback is the best option when providing corrective feedback. Given that
feedback specificity may conflict with one’s natural cognitive representation of the task
(Kluger & DeNisi, 1996), is it plausible that specific feedback may obstruct some of the
cognitive processes that mediate the relationship between the receipt of feedback and
how one responds to feedback?
Scholars have argued that it is important for feedback to be processed at a deep
level (Ingram, 1984), and this seems particularly true for processing feedback that
highlights performance discrepancies and conveys the need for corrective actions. Thus, I
argue that strategies that enhance deep-level information processing should be explored
as a means to enhance the effectiveness of feedback. One process that can help achieve
this is reflection.
21
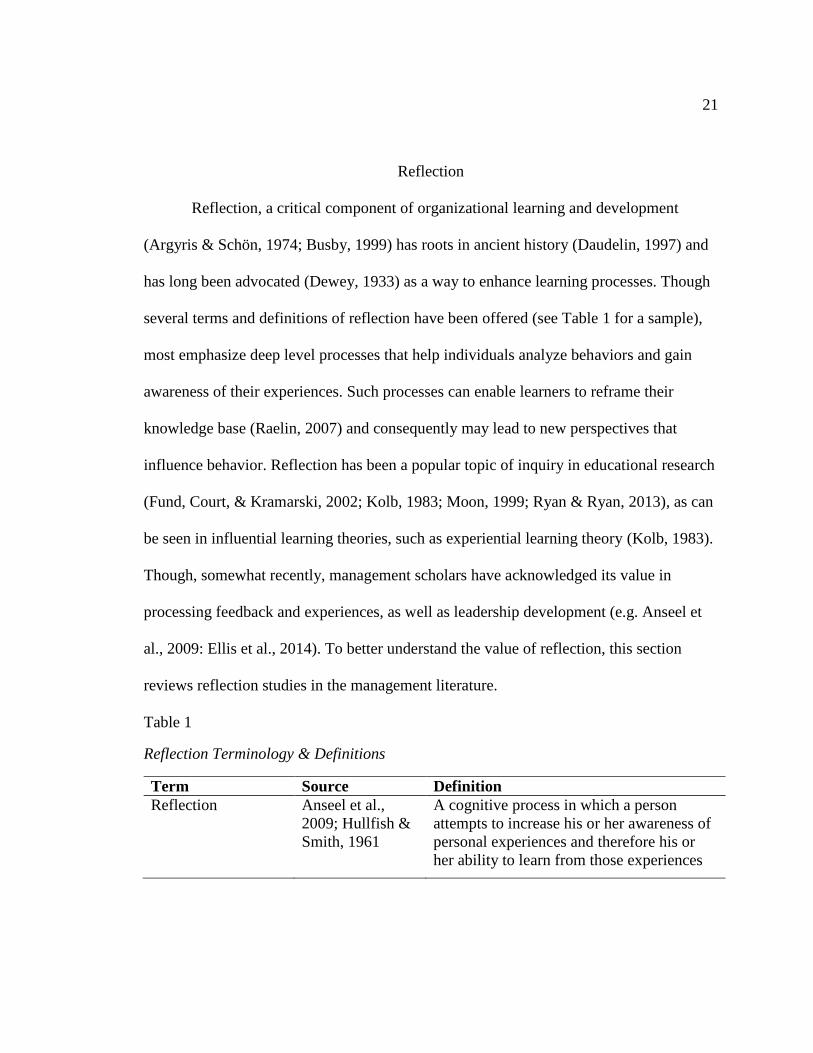
Reflection
Reflection, a critical component of organizational learning and development
(Argyris & Schön, 1974; Busby, 1999) has roots in ancient history (Daudelin, 1997) and
has long been advocated (Dewey, 1933) as a way to enhance learning processes. Though
several terms and definitions of reflection have been offered (see Table 1 for a sample),
most emphasize deep level processes that help individuals analyze behaviors and gain
awareness of their experiences. Such processes can enable learners to reframe their
knowledge base (Raelin, 2007) and consequently may lead to new perspectives that
influence behavior. Reflection has been a popular topic of inquiry in educational research
(Fund, Court, & Kramarski, 2002; Kolb, 1983; Moon, 1999; Ryan & Ryan, 2013), as can
be seen in influential learning theories, such as experiential learning theory (Kolb, 1983).
Though, somewhat recently, management scholars have acknowledged its value in
processing feedback and experiences, as well as leadership development (e.g. Anseel et
al., 2009: Ellis et al., 2014). To better understand the value of reflection, this section
reviews reflection studies in the management literature.
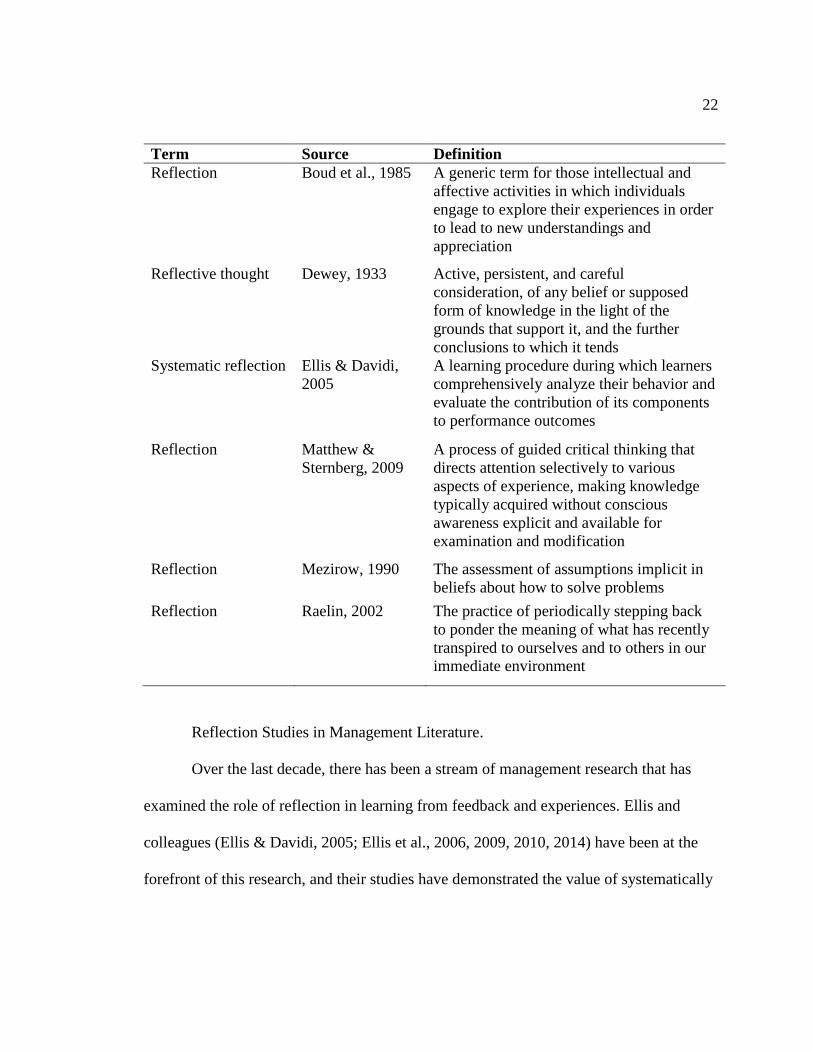
Table 1
Reflection Terminology & Definitions
Term Source Definition
Reflection Anseel et al.,
2009; Hullfish &
Smith, 1961
A cognitive process in which a person
attempts to increase his or her awareness of
personal experiences and therefore his or
her ability to learn from those experiences
22
Term Source Definition
Reflection Boud et al., 1985 A generic term for those intellectual and
affective activities in which individuals
engage to explore their experiences in order
to lead to new understandings and
appreciation
Reflective thought Dewey, 1933 Active, persistent, and careful
consideration, of any belief or supposed
form of knowledge in the light of the
grounds that support it, and the further
conclusions to which it tends
Systematic reflection Ellis & Davidi,
2005
A learning procedure during which learners
comprehensively analyze their behavior and
evaluate the contribution of its components
to performance outcomes
Reflection Matthew &
Sternberg, 2009
A process of guided critical thinking that
directs attention selectively to various
aspects of experience, making knowledge
typically acquired without conscious
awareness explicit and available for
examination and modification
Reflection Mezirow, 1990 The assessment of assumptions implicit in
beliefs about how to solve problems
Reflection Raelin, 2002 The practice of periodically stepping back
to ponder the meaning of what has recently
transpired to ourselves and to others in our
immediate environment
Reflection Studies in Management Literature.
Over the last decade, there has been a stream of management research that has
examined the role of reflection in learning from feedback and experiences. Ellis and
colleagues (Ellis & Davidi, 2005; Ellis et al., 2006, 2009, 2010, 2014) have been at the
forefront of this research, and their studies have demonstrated the value of systematically
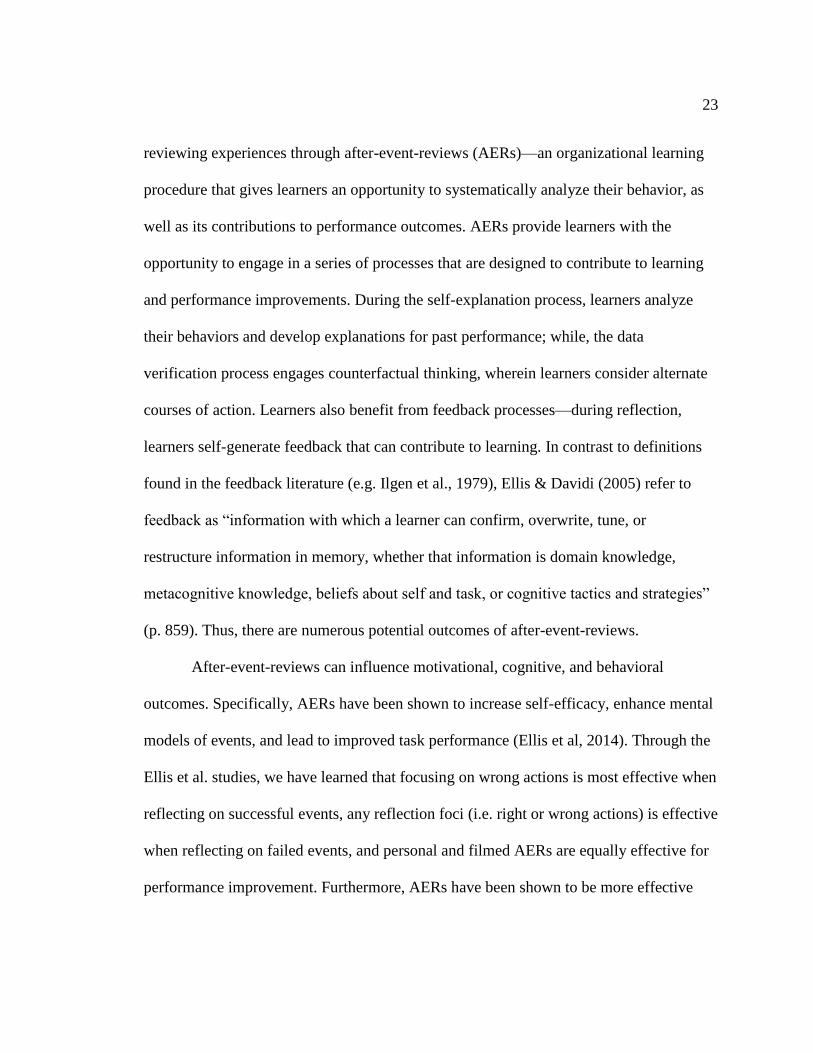
23
reviewing experiences through after-event-reviews (AERs)—an organizational learning
procedure that gives learners an opportunity to systematically analyze their behavior, as
well as its contributions to performance outcomes. AERs provide learners with the
opportunity to engage in a series of processes that are designed to contribute to learning
and performance improvements. During the self-explanation process, learners analyze
their behaviors and develop explanations for past performance; while, the data
verification process engages counterfactual thinking, wherein learners consider alternate
courses of action. Learners also benefit from feedback processes—during reflection,
learners self-generate feedback that can contribute to learning. In contrast to definitions
found in the feedback literature (e.g. Ilgen et al., 1979), Ellis & Davidi (2005) refer to
feedback as “information with which a learner can confirm, overwrite, tune, or
restructure information in memory, whether that information is domain knowledge,
metacognitive knowledge, beliefs about self and task, or cognitive tactics and strategies”
(p. 859). Thus, there are numerous potential outcomes of after-event-reviews.
After-event-reviews can influence motivational, cognitive, and behavioral
outcomes. Specifically, AERs have been shown to increase self-efficacy, enhance mental
models of events, and lead to improved task performance (Ellis et al, 2014). Through the
Ellis et al. studies, we have learned that focusing on wrong actions is most effective when
reflecting on successful events, any reflection foci (i.e. right or wrong actions) is effective
when reflecting on failed events, and personal and filmed AERs are equally effective for
performance improvement. Furthermore, AERs have been shown to be more effective
24
when learners make internal and specific, rather than external and general, attributions for
their performance (Ellis et al., 2006).
In contrast to after-event-reviews operationalized as structured group reflections,
Anseel et al. (2009) examined individual written reflections as a strategy to improve task
performance following feedback. Their findings revealed that reflection following
feedback enhanced performance more than feedback alone. Reflection without feedback
did not yield significant performance improvements.
This research provides further support for the benefits of reflection, but is
reflection effective for everyone? Anseel et al. (2009) found that individual differences
influence the effectiveness of written reflections. Specifically, the strategy was less
effective for those low in learning orientation and those low in need for cognition. When
participants were low in these traits, they engaged less in reflection. Likewise, the
strategy was less effective for those who reported that the task was not personally
important to them.
Although, Anseel et al.’s study did not investigate whether individual written
reflections are more effective for performance improvement than are group reflections,
other studies have explored such. Daudelin (1996), as well as Gurtner, Tschan, Semmer,
& Nägele (2007), found individual written reflections to be superior to group reflections.
Group reflection discussions may distract individuals from focusing on helpful
performance strategies, and the reflective thoughts may be less specific than those
generated during written reflections (Daudelin, 1996). Thus, individual reflective
25
processes, which help individuals explore performance outcomes, may be particularly
beneficial for enhancing the effectiveness of corrective feedback.
In sum, reflection studies in the management literature have offered support for
the value of reflection as a learning intervention. However, important questions remain
unanswered. Existing studies have not accounted for the unique contributions of specific
forms of reflection to learning. For example, recall that reflection is believed to be
facilitated through self-explanation, data verification (i.e. counterfactual thinking), and
self-feedback processes. Are some of these processes more effective for certain types of
feedback (e.g. corrective feedback)? We do not yet know, as studies have not
disentangled these processes from each other (Ellis et al., 2014).
I argue that counterfactual thinking is an important form of reflection, especially
for processing feedback on performance discrepancies, and should be examined
independently from other forms of reflection. Counterfactual thinking is a common
feature of human cognition (Sanna & Turley, 1996) that can be particularly active when
individuals experience negative affect or identify problems (Epstude & Roese, 2008)—
outcomes often associated with the receipt of corrective feedback (Ilgen et al., 1979).
This leads one to ask—can the effectiveness of corrective feedback on subsequent
performance be enhanced through counterfactual reflection and, if so, what are the
boundary conditions that facilitate such reflection? My study builds on research in the
psychology field which indicates that counterfactual thought serves a functional value, is
a useful component of behavior regulation, and is closely connected to goal cognitions
26
(Epstude & Roese, 2008; Roese, 1997; Roese & Olson, 1997), all of which are important
for responding to performance discrepancies. As such, the focus of this review now turns
to counterfactual thinking.
Counterfactual Thinking
Counterfactuals have been defined as mental representations of alternatives to
past events, actions, or states (Byrne, 2005; Roese, 1997). The earliest conceptualizations
of counterfactual thinking were based in the simulation heuristic (Kahneman & Tversky,
1982) and presented in Kahneman & Miller's (1986) norm theory. These scholars
proposed that individuals mentally undo events and simulate alternate versions of the
events. Thus, counterfactual thinking can lead to learning from mistakes and to
identifying alternate courses of action (Kahneman & Miller, 1986; Markman, Elizaga,
Ratcliff, & McMullen, 2007; Roese, 1994).
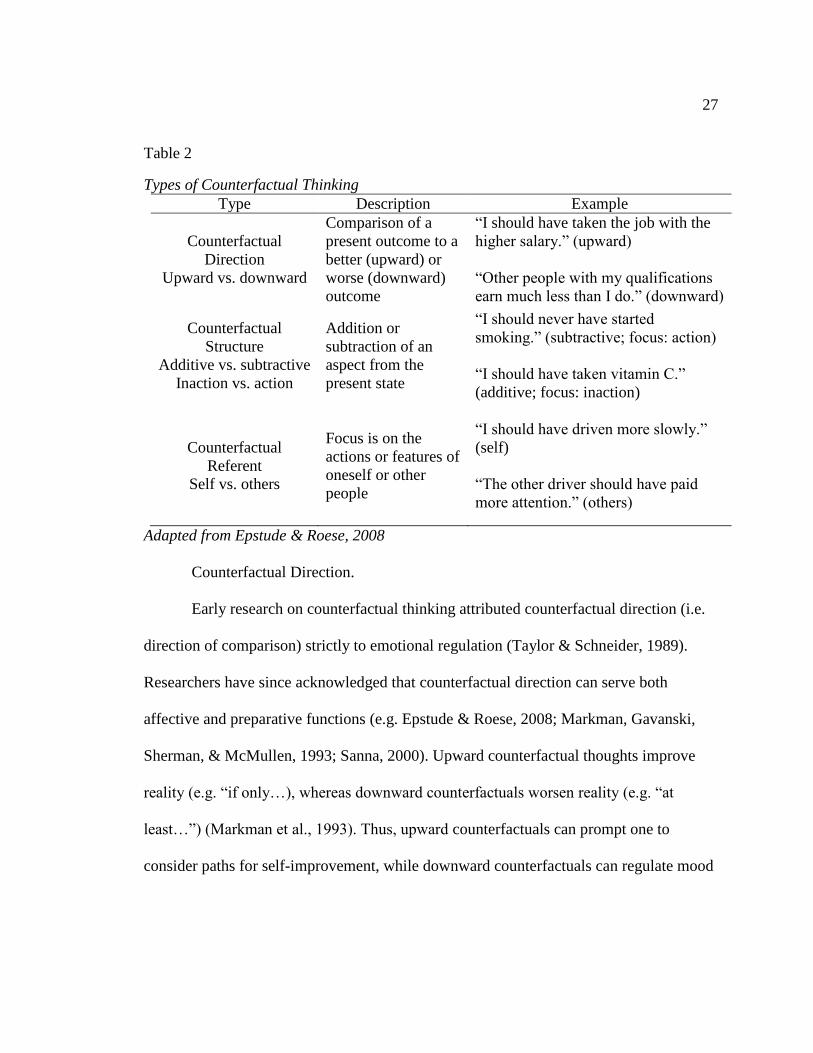
Counterfactuals are depicted with conditional propositions that contain an
antecedent and a consequence (Roese, 1997). There are multiple types of counterfactuals,
as shown in Table 2. To better understand how counterfactual thoughts influence
behavior, the following sections review empirical findings from the psychology literature,
followed by a discussion of the functional theory of counterfactual thinking (Epstude &
Roese, 2008), the framework that has organized the findings based on the paths through
which behavior is regulated.
27
Table 2
Types of Counterfactual Thinking
Type Description Example
Counterfactual
Direction
Upward vs. downward
Comparison of a
present outcome to a
better (upward) or
worse (downward)
outcome
“I should have taken the job with the
higher salary.” (upward)
“Other people with my qualifications
earn much less than I do.” (downward)
Counterfactual
Structure
Additive vs. subtractive
Inaction vs. action
Addition or
subtraction of an
aspect from the
present state
“I should never have started
smoking.” (subtractive; focus: action)
“I should have taken vitamin C.”
(additive; focus: inaction)
Counterfactual
Referent
Self vs. others
Focus is on the
actions or features of
oneself or other
people
“I should have driven more slowly.”
(self)
“The other driver should have paid
more attention.” (others)
Adapted from Epstude & Roese, 2008
Counterfactual Direction.
Early research on counterfactual thinking attributed counterfactual direction (i.e.
direction of comparison) strictly to emotional regulation (Taylor & Schneider, 1989).
Researchers have since acknowledged that counterfactual direction can serve both
affective and preparative functions (e.g. Epstude & Roese, 2008; Markman, Gavanski,
Sherman, & McMullen, 1993; Sanna, 2000). Upward counterfactual thoughts improve
reality (e.g. “if only…), whereas downward counterfactuals worsen reality (e.g. “at
least…”) (Markman et al., 1993). Thus, upward counterfactuals can prompt one to
consider paths for self-improvement, while downward counterfactuals can regulate mood
28
repair and maintenance. To date, scholars have reported numerous antecedents and
outcomes of counterfactual direction.
Markman et al.’s (1993) research was the first to identify the functional value of
counterfactual thinking and to investigate factors that may lead one to engage in such
thinking. Prior research had largely focused on cognitive rules that prompt counterfactual
generation, such as the timing of events in the cognitive chain (Kahneman & Miller,
1986; Wells, Taylor, & Turtle, 1987). In contrast, Markman et al. argued that
counterfactual thoughts can be driven by situational factors, and in any given situation,
individuals will generate the counterfactuals that yield the most psychological value.
Using a computer-simulated blackjack game, they examined the effects of event
repeatability on participants’ spontaneous counterfactual generation—both the prevalence
and the direction. The results demonstrated that when individuals believed the event was
repeatable (i.e. had the opportunity to play again), they engaged more in counterfactual
thinking, and they made upward comparisons—thoughts about how their results may be
better. This empirical test lent support to their notion that upward comparisons were
activated by the goal of future improvement. In contrast, downward counterfactuals were
used as a coping mechanism for those who had performed poorly and believed they
would not have an opportunity for improvement. In fact, when individuals generate
upward comparisons in the absence of opportunity for future improvement, it can often
lead to negative affective consequences (Sanna, 1997).
29
Overall, individuals are more likely to engage in upward comparisons after they
have experienced a loss or failure, which in a work-context could be when encountering
performance discrepancies. Downward comparisons, on the other hand, are more
common following successes (Markman et al., 1993; Roese & Olson, 1995; Sanna &
Turley, 1996). Though, this is not always the case—the influence of outcome valence on
counterfactual direction may be different based on one’s perceptions of control.
Perceived control influences counterfactual generation (Markman et al., 1995; Roese &
Olson, 1995), such that individuals tend to alter aspects of events that are within their
control and the outcomes they deem controllable. If individuals feel as though they
cannot control the outcome, they will be less likely to generate upward counterfactuals,
even if they have experienced a loss or failure. When the outcome is perceived to be
uncontrollable, greater functional value (e.g. preserve or enhance self-esteem) can be
gained from downward comparisons (Roese & Olson, 1995). Because upward
counterfactuals focus on performance improvement, it is important to better understand
antecedents of upward counterfactual thinking. What factors, beyond perceived control,
outcome valence, and beliefs about future opportunities, influence upward counterfactual
thinking?
Morris & Moore (2000) were among the first scholars to consider the influence of
organizational factors on counterfactual thoughts. In doing so, they investigated how
accountability may influence counterfactual thinking. Specifically, they examined the
influence of hierarchical accountability on the generation of self-focused upward
30
counterfactuals—the counterfactuals that have been shown to be particularly beneficial
for learning (Epstude & Roese, 2008).
Using archival data from the Aviation Safety Reporting System, which included
pilots’ reflections on naturally occurring near accidents, Morris & Moore (2000)
examined the prevalence of self-focused upward counterfactuals, specific comments
about lessons learned, and how such lessons will be applied in the future. While all pilots
are required to complete a reflection following a near accident, the researchers argued
that commercial and military pilots, compared to private pilots, would be reflecting under
higher levels of accountability and thus may reflect differently. The findings, which were
later replicated in a lab study, revealed that higher accountability inhibited self-focused
upward counterfactuals, as well as learning processes. Similar effects were seen in
Markman & Tetlock's (2000) lab study, wherein accountability led to counterfactual
excuse-making (i.e. denying responsibility through “I couldn’t have known…”).
Upward counterfactual thinking may lead individuals to accept responsibility for
undesirable outcomes, which can come at the expense of regret, negative affect and
dissatisfaction with performance outcomes, especially for those with low self-efficacy
(Markman, Gavanski, Sherman, & McMullen, 1995; Markman et al., 1993; Pierro et al.,
2008; Sanna, 1997). However, research suggests that overall the benefits of upward
thinking outweigh the costs. Upward counterfactual thinking can trigger hopefulness
about the future (Boninger, Gleicher, & Strathman, 1994), develop a sense of perceived
control (Nasco & Marsh, 1999), lead to motivation and preparative intentions for future
31
behaviors (McMullen & Markman, 2000; Roese, 1994; Sanna, 1997), and improve task
persistence (Markman, McMullen, & Elizaga, 2008; Markman, McMullen, Elizaga, &
Mizoguchi, 2006).
Notably, individual differences and beliefs can influence the effects of
counterfactual thinking. Research has shown that individuals with low self-efficacy felt
less prepared when generating upward counterfactuals, whereas those with high self-
efficacy felt prepared following both upward and downward counterfactual thinking, as
long as they believed the event was repeatable (Sanna, 1997). Dyczewski & Markman
(2012) also found evidence that beliefs about ability can influence counterfactual
thinking outcomes. In their study, participants who believed intelligence-related abilities,
were fixed (i.e. entity theorists) displayed greater motivation and enhanced performance
when they reflected on downward counterfactuals. In contrast, those who believed
intelligence-related abilities are malleable (i.e. incremental theorists) were more
motivated and performed better following upward counterfactual thinking.
Taken together, the research on counterfactual direction has shown that
perceptions of control, ability-related beliefs, and organizational factors can influence
counterfactual direction. Moreover, perceptions about future opportunities for
improvement affects whether one reflects upward or downward. For this reason,
opportunity has been called the “master moderator” (Eptsude & Roese, 2008). When an
opportunity is present, individuals tend to respond with behavioral regulation; whereas a
lack of opportunity or problematic circumstances leads to affect regulation.
32
Counterfactual Structure.
Counterfactuals are constructed by adding or removing elements that were in the
original event (Roese & Olson, 1993). When individuals focus on their inactions, the
counterfactuals take an additive structure (e.g. “If only I had taken advantage of the extra
training available...”). In contrast, when individuals focus on their actions, they engage in
subtractive counterfactual thinking (e.g. “If only I hadn’t missed the policy update...).
Empirical findings indicate counterfactual structure may play an important role in how
people process information and form behavioral intentions (Epstude & Roese, 2008).
Individuals are more likely to generate additive counterfactuals following
negative (Roese & Olson, 1993) and unexpected events (Sanna & Turley, 1996). Because
these counterfactuals help to illuminate alternate strategies and to identify ways to avoid
undesirable outcomes, they can constitute an adaptive strategy that enhances future
performance (Roese, 1994; Roese & Olson, 1993). Kray, Galinsky, & Markman (2009)
demonstrated this during a negotiation task. Participants engaged in counterfactual
thinking between negotiation rounds, and those who reflected via additive counterfactual
thinking, rather than subtractive, were more successful at obtaining value and generating
creative agreements during the negotiations.
Kray et al.’s (2009) findings are consistent with research by Markman et al.
(2007). Kray et al. revealed that two very different information processing styles are
evoked by additive versus subtractive thinking. Their research demonstrated that additive
thinking promotes an expansive processing style, wherein individuals tend to be more
33
creative. In such cases, individuals are free to explore multiple ways of altering an event
(Kray et al., 2006). In contrast, subtractive thinking counterfactuals center on existing
knowledge structures (i.e. elements in the original event), which prompt a relational
processing style that tends to be more effective for performance on analytical tasks. Since
Markman et al.’s (2007) study, it has been proposed that subtractive thinking requires
more controlled mental operations and may have a lower likelihood for eliciting
behavioral intentions, though further investigation of additive and subtractive
counterfactuals has been encouraged (Epstude & Roese, 2008).
Counterfactual Referent.
A final, yet important, distinction between various types of counterfactuals is that
of self-focused versus situation- or other-focused. Recall that Morris & Moore (2000)
found that accountability can inhibit self-focused counterfactuals, which may lead one to
focus on others’ actions or various circumstances beyond one’s control. Similarly, lack of
personal control and lack of power have also been shown to diminish self-focused
counterfactual thinking (Scholl & Sassenberg, 2014). When individuals lack such, they
may be more prone to focus on others’ actions, which tends to lead individuals to think
counterfactually about how others could have made the outcome better (Rim &
Summerville, 2014). While individuals can learn from other-focused counterfactuals,
self-focused counterfactuals are more useful for personal improvement and are believed
to provide greater functional value (Epstude & Roese, 2008). Based on this and what we
34
know about counterfactual direction, it may be more likely for those who receive
corrective feedback to learn and to attain performance improvements when they engage
in self-focused upward counterfactual thinking. If this is true, then it is important to
investigate factors that may prompt individuals, who encounter performance
discrepancies, to generate self-focused upward counterfactuals.
In sum, counterfactual thinking is a component of everyday thoughts. Individuals
think counterfactually by comparing reality to alternate versions of outcomes and actions.
Through such thoughts, individuals experience affective and preparative consequences.
Following decades of research in the psychology field, scholars now contend that the
primary function of counterfactual thinking centers on the management of ongoing
behavior. To explicate the various ways in which counterfactual thinking influences
behavior, Epstude & Roese (2008) proposed the functional theory of counterfactual
thinking which organizes the aforementioned findings and counterfactual effects on
behavior along two paths. The following section provides a discussion of this theory.
The Functional Theory of Counterfactual Thinking.
The functional theory of counterfactual thinking is grounded in processes of
comparative judgment and the fundamental assumption that counterfactual thought
regulates behavior (Epstude & Roese, 2008). Based on this theory, counterfactual
thinking is activated through the recognition of a problem (e.g. performance discrepancy)
or negative affect, such as that triggered by a negative emotional reaction. Counterfactual
35
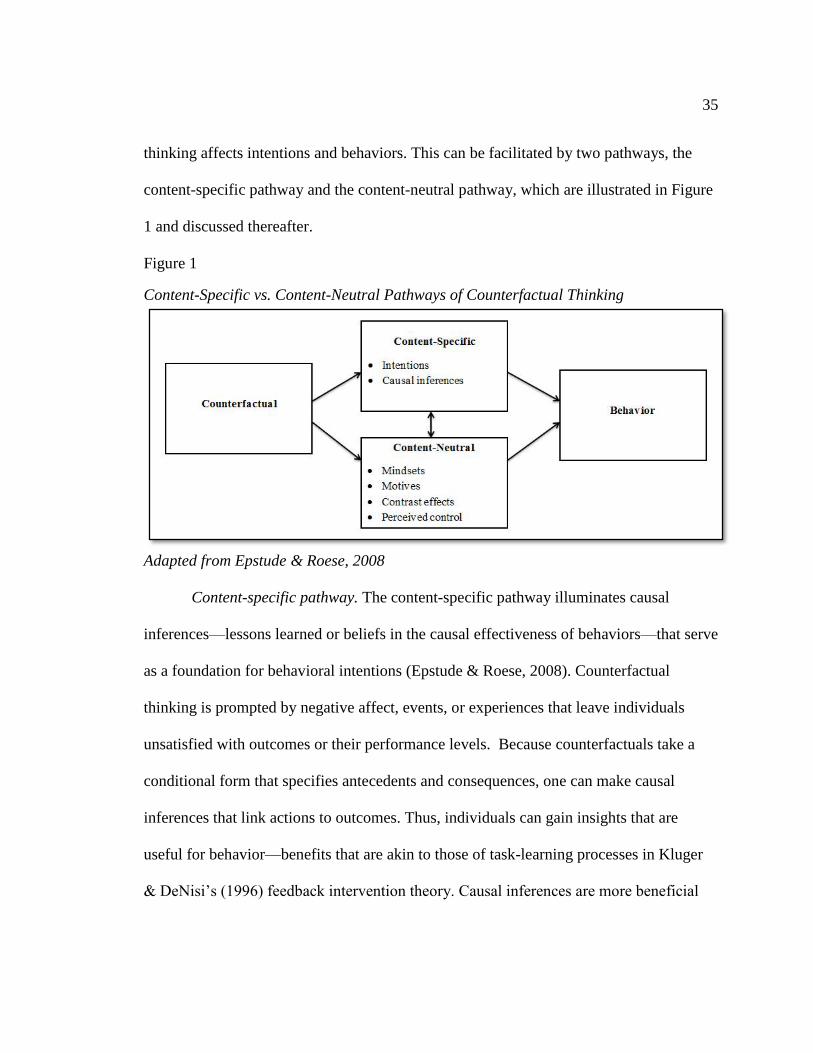
thinking affects intentions and behaviors. This can be facilitated by two pathways, the
content-specific pathway and the content-neutral pathway, which are illustrated in Figure
1 and discussed thereafter.
Figure 1
Content-Specific vs. Content-Neutral Pathways of Counterfactual Thinking
Adapted from Epstude & Roese, 2008
Content-specific pathway. The content-specific pathway illuminates causal
inferences—lessons learned or beliefs in the causal effectiveness of behaviors—that serve
as a foundation for behavioral intentions (Epstude & Roese, 2008). Counterfactual
thinking is prompted by negative affect, events, or experiences that leave individuals
unsatisfied with outcomes or their performance levels. Because counterfactuals take a
conditional form that specifies antecedents and consequences, one can make causal
inferences that link actions to outcomes. Thus, individuals can gain insights that are
useful for behavior—benefits that are akin to those of task-learning processes in Kluger
& DeNisi’s (1996) feedback intervention theory. Causal inferences are more beneficial
36
when generated through upward counterfactual thinking, as its focus is improvement
rather than maintaining status quo (i.e. downward counterfactuals) (Epstude & Roese,
2008).
According to the functional theory of counterfactual thinking, counterfactuals
may influence behavior indirectly by developing intentions which, in turn, impact
behavior, or directly—through task-specific insight. When stronger links between
behaviors and events are developed in memory, individuals are more likely to form
intentions for future opportunities (Sheeran, Webb, & Gollwitzer, 2005). Counterfactuals
help to create the link in memory and to facilitate such intentions. The manifestation of
intentions to behaviors is further supported through other theoretical frameworks (e.g.
theory of planned behavior) (Ajzen, 1991; Ajzen & Fishbein, 1980).
Multiple counterfactual studies have demonstrated the direct effect of
counterfactuals on behavior (e.g. Roese, 1994; Markman et al., 2008). Specifically,
studies have prompted subjects to generate counterfactuals about their anagram
performances, and then provided them with opportunities to perform again. Across these
studies, individuals’ persistence and performance levels increased more following
upward, additive, and self-focused counterfactual thinking. These studies have also
demonstrated the impact of counterfactuals on mood and strategic thoughts (Epstude &
Roese, 2008), which leads to the second pathway of counterfactual thinking—the
content-neutral path.
37
Content-neutral pathway. In contrast to the content-specific pathway, that
transfers specific information from causal inferences, the content-neutral pathway
influences behavior through shifts in mindsets, motivation, and self-inferences. Epstude
& Roese (2008) argue that the content-neutral pathway is less about specific information
and more about how information is handled, and they go on to state that a counterfactual
can “ignite attentional, cognitive, or motivational processes that themselves alter
behavior” (p. 175). For example, recall that Kray et al. (2006) found that additive
counterfactuals led to more creative negotiation tactics, thus demonstrating a different
mind-set prompted by additive vs. subtractive thinking. The motivational effects can be
seen in studies that indicate additive counterfactuals activate a promotion focus, whereas
subtractive counterfactuals activate a prevention focus (Roese et al., 2009; Roese et al.,
2006). Finally, counterfactual thinking can result in self-inferences—such as one’s sense
of mastery or confidence—and feelings of personal control, such as those demonstrated
in McMullen et al. (1995) and Nasco & Marsh (1999). Together, these influences affect
behavior.
An assumption of the functional theory of counterfactual thinking is that the
compatibility between the two paths should strengthen effects on behavior (Epstude &
Roese, 2008). For example, if an individual experiences increased motivation from
counterfactual thinking, the effects of content-specific paths (e.g. causal inferences)
should be clearer and stronger. It is further proposed that causal links in one task domain
38
may be facilitated from mind-sets produced by counterfactuals in a different domain.
Thus, benefits of counterfactual thinking may transfer across situations.
Counterfactual thinking is prompted by negative experiences, is a ubiquitous
aspect of cognition, and has been shown to influence behavior in numerous ways. Thus,
the functional theory of counterfactual thinking offers a valuable perspective when
assessing how employees may process and respond to corrective feedback on
performance discrepancies. Yet, to date, there are few studies (e.g. Morris & Moore,
2000) that have investigated the impact of workplace factors on counterfactual thinking,
which are crucial to consider when examining how employees’ process and respond to
performance discrepancies. To this point, in the following section I propose and develop
hypotheses for factors that influence counterfactual thinking during feedback processing
and subsequent performance.
Hypotheses Development
The feedback process can be impacted by individual differences, as well as
situational and contextual factors. Thus, it was important to consider such factors when
examining the role of counterfactuals in the cognitive processing of corrective feedback,
as well as subsequent learning and behavioral changes. Recall that, compared to other
types of counterfactuals, self-focused upward counterfactuals are particularly useful for
learning and behavioral regulation (Epstude & Roese, 2008). However, little is known
about individual and contextual factors that prompt individuals to develop these types of
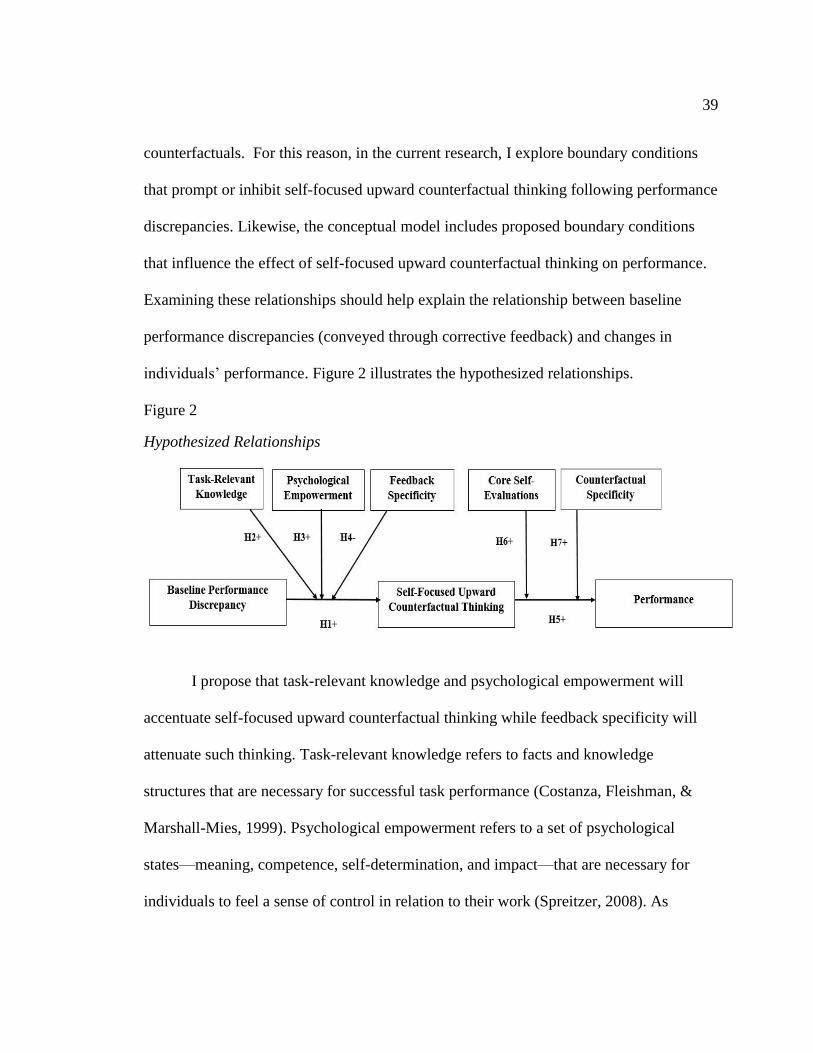
39
counterfactuals. For this reason, in the current research, I explore boundary conditions
that prompt or inhibit self-focused upward counterfactual thinking following performance
discrepancies. Likewise, the conceptual model includes proposed boundary conditions
that influence the effect of self-focused upward counterfactual thinking on performance.
Examining these relationships should help explain the relationship between baseline
performance discrepancies (conveyed through corrective feedback) and changes in
individuals’ performance. Figure 2 illustrates the hypothesized relationships.
Figure 2
Hypothesized Relationships
I propose that task-relevant knowledge and psychological empowerment will
accentuate self-focused upward counterfactual thinking while feedback specificity will
attenuate such thinking. Task-relevant knowledge refers to facts and knowledge
structures that are necessary for successful task performance (Costanza, Fleishman, &
Marshall-Mies, 1999). Psychological empowerment refers to a set of psychological
states—meaning, competence, self-determination, and impact—that are necessary for
individuals to feel a sense of control in relation to their work (Spreitzer, 2008). As
40
previously reviewed, feedback specificity is a situational variable that has been defined as
the level of information presented in the feedback message (Goodman et al., 2004).
I also propose that performance following counterfactual thinking, will be
influenced by core self-evaluations, as well as counterfactual content. The concept of
core self-evaluations is a higher-order trait that encompasses basic conclusions
individuals hold about themselves, the world, and others (Judge et al., 2007; Judge et al.,
2003; Bono & Judge, 2003). In the current research, counterfactual specificity refers to
the level of detail versus abstraction of counterfactual thoughts.
Effect of Baseline Performance Discrepancy on
Self-Focused Upward Counterfactual Thinking.
Consistent with my review of the counterfactual thinking literature, I propose that
feedback that conveys a performance discrepancy, compared to other types of feedback,
will predict self-focused upward counterfactual thinking. Recall that self-focused upward
counterfactuals focus on how an individual could have altered his or her behavior to
achieve a better outcome. According to the functional theory of counterfactual thinking
(Epsude & Roese, 2008), the first step in the regulatory process of counterfactual
thinking is the identification of a problem (e.g. performance discrepancy) or the
experience of negative affect. In such situations, individuals often attempt to reconcile
discrepancies and to learn from their mistakes; self-focused upward counterfactual
thinking can help achieve these ends (Roese, 1994).
41
Relative to other types of feedback (e.g. positive feedback), feedback that conveys
a discrepancy is more likely to prompt self-focused upward counterfactual thinking.
Research on negativity bias is one literature stream that provides insight on how
performance discrepancies may prompt such thinking. Negativity bias refers to the
tendency for individuals to pay more attention to negative than to positive information
(Cacioppo & Berntson, 1994; Ito, Larson, Smith, & Cacioppo, 1998). Across numerous
domains (for a review see Baumeister, Bratslavsky, Finkenauer, & Vohs, 2001), scholars
have found that negative information impacts behaviors and cognitions more strongly
than comparable positive information. In other words, negative information is more
potent than positive information and, as a result, people react more strongly (Baumeister
et al., 2001).
The elevated potency inherent in corrective feedback, compared to other
feedback, increases the likelihood that feedback recipients will engage in self-focused
upward counterfactual thinking. Bohner, Bless, Schwarz, & Strack (1988) demonstrated
that individuals are more likely to engage in causal and analytic reasoning following
negative events, compared to positive events, as such thinking may help individuals to
avoid similar situations in the future. Similarly, Baumeister (1991) found that when
individuals experience a negative situation, they are more likely to search for meaning
and to try to make sense of the situation compared to positive situations. In this way,
negative information leads to more extensive and elaborate information processing than
positive information (Baumeister et al., 2001).
42
The influence of negativity is not limited to past events; it also affects individuals’
thoughts about the future. Individuals are often motivated to avoid future negative
outcomes (Kahneman & Tversky, 1979). Upon receiving feedback on performance
discrepancies and in an effort to avoid negative outcomes, individuals may reflect on past
behaviors and consider alternative future behaviors that will decrease the likelihood of
further negative outcomes. In essence, the negative potency of such feedback should
prompt one to engage in analytic reasoning about their behaviors (Bohner et al., 1988)
and to try to avoid future mistakes. Thus, it is likely such reasoning will be facilitated by
self-focused upward counterfactuals.
Studies have demonstrated that self-focused counterfactuals are more prevalent
than other-focused counterfactuals (Davis et al., 1995; White & Roese, 2007), while
upward counterfactuals have been shown to be more common than downward (Epstude
& Roese, Nasco & Marsh, 1999; Roese & Olson, 1997). Additionally, upward
counterfactual thinking is the most common type of counterfactual thinking following
failure (Markman et al., 1993) and self-focused is best suited for learning and behavioral
regulation (Epstude & Roese, 2008). Following these findings and based on the
preceding discussion, I predict:
Hypothesis 1: Baseline performance discrepancy will positively relate to self-
focused upward counterfactual thinking.
Hypothesis 1 is consistent with previous findings. Though, recall that one of the
primary objectives of the current research is to explore boundary conditions that
43
determine when individuals, who receive feedback on performance discrepancies, will
engage in self-focused upward counterfactual thinking. We know that contextual factors,
such as accountability (Morris & Moore, 2000), can inhibit self-focused upward
counterfactual thinking. What other factors may inhibit or promote self-focused
counterfactuals? To address this question, the following section presents proposed
moderators of the relationship between baseline performance discrepancy and self-
focused upward counterfactual thinking.
Moderators of the Effect of Baseline Performance Discrepancy on
Self-Focused Upward Counterfactual Thinking.
Task-relevant knowledge. Knowledge is defined as “a collection of discrete but
related facts and information about a particular domain,” and task-relevant knowledge
refers to facts and knowledge structures that are necessary for successful task
performance (Costanza et al., 1999, p. 71). According to Locke (2000), task-relevant
knowledge influences how individuals approach tasks and the specific actions individuals
implement to make their task strategies work. I propose that, following performance
discrepancies, higher levels of task-relevant knowledge will increase self-focused upward
counterfactual thinking.
Theoretically, this argument is consistent with Bandura’s (Bandura, 1977, 1986)
social cognitive theory. According to social cognitive theory, task knowledge can enable
individuals to transform experiences into guides for task behaviors (Bandura, 1986).
Bandura argued that knowledge serves as a resource, from which individuals can
44
generate innovative courses of action. When individuals possess task-relevant
knowledge, they are more likely to experience higher levels of self-efficacy (Bandura,
1986), a trait shown to increase the preparative function of upward counterfactual
thinking (Sanna, 1997).
Similarly, task-relevant knowledge can enhance one’s ability to exercise self-
influence in his or her work environment (Bandura, 1986), thereby increasing the number
of behavioral options available. Barrick & Spilker (2003) demonstrated that when
individuals possess higher levels of task knowledge, they are more likely to focus on
relevant information for attaining goals and are more likely to engage in goal directed
behaviors. Task-relevant knowledge has also been shown to positively influence the
number and quality of solutions generated when solving workplace problems (Butler &
Scherer, 1997).
From this research, it is evident that task-relevant knowledge helps individuals to
direct efforts towards goals, as well as to select a behavioral response from among
multiple possibilities (Bandura, 1986). Recall that as individuals’ perceptions of
opportunities increases, so too does the likelihood of upward counterfactual thinking (e.g.
Eptsude & Roese, 2008; Markman et al., 1993). Thus, it follows that an increased
capability to engage in self-influence and an increased repertoire of behavioral
opportunities for attaining a task goal will lead one to engage in self-focused upward
counterfactual thinking. In contrast, a deficiency in task knowledge restricts one’s choice
of task behaviors, thereby limiting the exercise of self-influence, and inhibits
45
opportunities (Bandura, 1986). When opportunities are lacking, individuals are more
likely to engage in downward counterfactual thinking (Markman et al., 1993).
Other research also supports the argument that following performance
discrepancies, higher levels of task-relevant knowledge will increase self-focused upward
counterfactual thinking. More precisely, task-relevant knowledge facilitates better
representations of problems encountered during a task (Braune & Foshay, 1983),
provides additional information to draw upon when solving problems (Phillips & Gully,
1997), and helps individuals transition from one problem state to another (Jong &
Ferguson-Hessler, 1996).
Prior knowledge influences new conceptualizations of events. As individuals
develop new conceptualizations, they have a tendency to “hark back to old ideas,” from
which they can draw insight and use to reassemble in a new conceptualization (Perkins,
1988). In the context of a work domain, old ideas include prior task knowledge. Research
has demonstrated that even when individuals are instructed to not use such knowledge
during a task, inadvertently, they do (Marsh, Ward, & Landau, 1999).
Scholars have established that higher levels of task-relevant knowledge can lead
to more effective work behaviors. To this point, Rapp, Ahearne, Mathieu, & Schillewaert
(2006) found that salespeople with higher levels of task knowledge were more likely to
engage in adaptive selling. In doing so, they experimented with new techniques, adjusted
to meet the demands of a situation, and engaged in other similar success-facilitating
strategies.
46
Because task-relevant knowledge contributes to one’s ability to exercise self-
influence in his or her work environment, and task-relevant knowledge has been shown to
provide additional insights about problems and events, facilitates better representations of
situations, leads to adaptive behaviors, and is positively related to self-efficacy, I argue
that such knowledge will influence the extent to which individuals explore mental
simulations of how they could have altered their behaviors to attain better work
outcomes. Therefore, I predict:
Hypothesis 2: Task-relevant knowledge moderates the influence of baseline
performance discrepancy on self-focused upward counterfactual thinking, such
that the influence becomes more positive as task-relevant knowledge increases.
Psychological empowerment. Psychological empowerment is a motivational
construct that emerged from the empowerment literature (Conger & Kanungo, 1988;
Spreitzer, Kizilos, & Nason, 1997; Thomas & Velthouse, 1990). In contrast to social-
structural forms of empowerment, which emphasize the sharing of power between
subordinates and supervisors through organizational interventions (Conger & Kanungo,
1988), psychological empowerment captures the extent to which employees experience
empowerment (Spreitzer, 2008). In this way, psychological empowerment is a cognitive
state, which is manifest in four dimensions.
According to Spreitzer and colleagues (Spreitzer, 1995; Spreitzer et al., 1997),
individuals perceive that they are empowered and in control of their work when they
experience meaning, competence, self-determination, and impact. Meaning reflects the
47
extent to which individuals psychologically invest in a task (Thomas & Velthouse, 1990)
and refers to the alignment of one’s work goals and beliefs or values (Maynard, Gilson,
& Mathieu, 2012; Spreitzer, 1995). Competence, which has been linked to the concept of
self-efficacy (Bandura & Cervone, 1983), reflects an individual’s belief in his or her
capability to perform work activities (Spreitzer, 1997). Individuals experience self-
determination when they have choice in initiating and regulating their action and when
they experience a sense of autonomy (Deci et al., 1989). The fourth dimension, impact,
represents the extent to which individuals believe their behavior will influence work
outcomes (Spreitzer, 2008). Scholars have demonstrated that when one of the four
dimensions is missing, the experience of empowerment will be limited (Spreitzer, 1995).
Across numerous studies, scholars have consistently shown that empowerment
predicts performance and other positive workplace outcomes (Seibert, Wang, &
Courtright, 2011). Though, to date, the influence of empowerment on learning through
counterfactual thinking has not yet been examined. However, prior research on social
power, the capacity to control one’s own and others’ outcomes (Fiske & Berdahl, 2007),
and social perception support the prediction that psychological empowerment will
positively contribute to self-focused upward counterfactual thinking.
Power affects basic cognition and has clear links to self-regulation (Guinote,
2007b). Across three studies, Galinsky, Gruenfeld, & Magee (2003) demonstrated that,
compared to those with low power, those with high power are more likely to act in a
goal-consistent manner and to show a strong tendency toward action versus inaction.
48
Likewise, research has shown that, during goal-pursuit, those with power are more likely
to attend to goal relevant cues, are better at prioritization, are more flexible in their
thinking, and extensively process central information about a task or situation (Guinote,
2007). Similarly, studies have shown that power increases task persistence and resistance
to external influences that detract from goal attainment (Galinsky, Magee, Gruenfeld,
Whitson, & Liljenquist, 2008; Slabu & Guinote, 2010). From this research, it can be seen
that power is positively related to thoughts and behaviors that support goal attainment.
In contrast, powerless individuals face challenges during goal pursuit and operate
under more constraints. They have to attend to multiple cues in the environment, many of
which may not be relevant for task success (Guinote, 2007a; Keltner, Gruenfeld, &
Anderson, 2003). A lack of power also tends to inhibit behaviors during goal-pursuit
(Galinsky et al., 2003). To this point, the approach-inhibition theory of power (Keltzer et
al., 2003) indicates that power directs one’s actions towards reducing discrepancies
between current and desired end states, while a lack of power leads one to focus on
avoiding threats and punishments. Thus, the powerless experience less flexible thinking
and a stronger focus on obstacles and barriers in the environment (Galinsky et al., 2008).
With increased attention to multiple cues and goals in a situation (e.g. avoiding
punishments while executing a task), the powerless may have less cognitive resources to
devote to goal-pursuit (Shah, Friedman, & Kruglanski, 2002).
Scholars have recently examined the role of social power in counterfactual
thinking. Through a series of studies, Scholl & Sassenberg (2014) demonstrated that
49
when individuals had less power (i.e. subordinate vs. manager) they were less likely to
engage in self-focused counterfactuals. In contrast, those with high power were more
likely to engage in such thinking. The effect of high power on self-focused
counterfactuals was independent of attributions and facilitated by a perceived sense of
personal control. When individuals experienced a sense of personal control, they
considered alternative ways in which they could have changed the outcome. In contrast,
those with less power and, consequently, a lower sense of personal control were more
likely to succumb to thoughts about how the situation may have been different or how
others could have behaved differently (i.e. other-referent counterfactuals).
In the context of a workplace, one’s sense of power is not determined solely by
his or her role or job position. Rather, individuals can acquire a sense of power when they
perceive to be in control of their work, that is, through psychological empowerment
(Conger & Kanungo, 1988). In such instances, individuals adopt an active orientation
toward their work and sustain increased levels of task motivation (Spreitzer, 1995).
Psychological empowerment should thus have important implications for how individuals
process feedback on performance discrepancies. To this point, and based on the findings
reviewed above, when individuals are confronted with performance discrepancies,
psychological empowerment will positively contribute to self-focused upward
counterfactuals—the counterfactuals that lead to learning and illuminate strategies for
performance improvement.
50
Hypothesis 3: Psychological empowerment moderates the influence of baseline
performance discrepancy on self-focused upward counterfactual thinking, such
that the influence becomes more positive as psychological empowerment
increases.
Feedback specificity. Recall that the level of information presented in a feedback
message can vary in specificity. Specific feedback highlights errors individuals have
made and provides detailed information on how recipients can improve their performance
(Goodman et al., 2004; Payne & Hauty, 1955). When individuals receive specific
feedback, they are more likely to judge the correctness, accuracy, and adequacy of their
response (Bourne, 1966). Yet in many ways, specific feedback reduces the need for
recipients to engage cognitive processes, as they are essentially given a roadmap to guide
performance improvement efforts. In contrast, low feedback specificity provides
substantially less information and can highlight a problem that is not well understood.
Individuals may attempt to overcome such a problem by engaging in self-focused upward
counterfactual thinking. Prior research and theory in the feedback literature (Goodman et
al., 2004, 2011), as well as other bodies of learning literature (Keith & Frese, 2008),
support this logic.
Error management training (Frese, 1995) is one stream of research that offers
insight on varying levels of guidance during learning, and the value of error management
training is supported by action theory (Frese & Zapf, 1994). According to action theory,
individuals hold action-oriented mental models that are foundational to work behaviors.
51
Errors contribute to the development of such models, as errors contain information that
help individuals to think retrospectively about their strategies and to adjust strategies to
improve performance (Keith & Frese, 2008).
Error management training consists of learning events, wherein learners are
provided minimal guidance. In such training, individuals are afforded opportunities to
make errors, to identify the cause of the errors, and to generate solutions to overcome the
errors (Ivancic & Hesketh, 2000). Learners are not guided by immediate specific
feedback. Rather, they are enabled to engage in deep level information processing, which
is believed to be one of the mechanisms that contributes to the effectiveness of error
management training (Dormann & Frese, 1994). Indeed, there are benefits to this training
approach. Error management training increases controlled processing of behaviors
(Ivancic & Hesketh, 2000) and facilitates self-regulatory processes, such as
metacognitive activity and emotional control in the face of performance discrepancies
(Keith & Frese, 2005). It is also an effective approach for promoting adaptive task
strategies (Ivanhic & Heketh, 2000), as well as increasing transfer of training (Keith &
Frese, 2008).
A variation of error management training, guided error training, differs from the
above approach in that learners are provided examples of errors, along with the solutions
for overcoming the errors. In this way, guided error training provides more details (i.e.
higher specificity) to learners. Ivanhic & Heketh (2000) demonstrated that guided error
training decreases opportunities to build metacognitive skills and inhibits adaptive
52
transfer—the use of knowledge to change a learned procedure or to generate a solution to
a new problem. Additionally, they suggested that, during guided error training, learners
may be more likely to attribute their errors to the training program rather than to
themselves. The drawbacks of the guided approach help to highlight the potential value
of less specific feedback to self-focused upward counterfactual thinking. Attributions
facilitate counterfactual thinking (N’gbala & Branscombe, 2003). In the case of guided
error training, higher specificity may inhibit the self-focused attributions that facilitate
self-focused counterfactuals, as well as the metacognitive activity that supports planning,
monitoring, and evaluation of one’s task progress (Brown, Bransford, Ferrara, &
Campione, 1983). It is plausible to consider such effects will be present when examining
the influence of high feedback specificity on counterfactual thinking.
Empirical findings in the feedback literature, also support the argument that less
specific feedback will enhance self-focused upward counterfactual thinking. Goodman et
al. (2011) reported that less specific feedback led to increased levels of explicit
information processing, as measured in a “think out loud” decision-making experiment.
Those in the low feedback specificity condition also engaged in more planning for the
future. When individuals are focused on preparing for the future and finding routes to
alleviate problems, they often engage in upward counterfactual thinking (Sanna, 2000).
Such counterfactuals can help to illuminate causal links between behaviors and outcomes
that may otherwise not be apparent.
53
In an earlier experiment, Goodman et al. (2004) examined the effects of feedback
specificity on practice performance, exploration, and learning during a series of decision-
making tasks. The results of the study revealed that high feedback specificity was
negatively related to exploratory behavior and learning. In the context of counterfactual
thinking, high feedback specificity may limit the extent to which individuals explore
alternative versions of their behaviors and associated performance outcomes.
Based on the preceding discussions, I hypothesize that:
Hypothesis 4: Feedback specificity moderates the influence of baseline
performance discrepancy on self-focused upward counterfactual thinking, such
that the influence becomes weaker as feedback specificity increases.
The Effect of Self-Focused Upward
Counterfactual Thinking on Performance.
Counterfactual thinking involves the transfer of information from a causal
inference and/or the activation of information processing that enhances motivation and
effort expenditure. These processes, attained via the content-specific and content-neutral
pathways, fuel behavior change (Epstude & Roese, 2008). Self-focused upward
counterfactuals are particularly influential for behavioral regulation and, in this study, are
expected to predict performance.
As previously reviewed, multiple studies have shown that upward counterfactuals
predict intentions for behavior change. More precisely, upward counterfactuals lead to
intentions to perform success-facilitating behaviors (Roese, 1994). Beyond intentions to
54
perform improved behaviors, there is also robust support for the influence of upward
counterfactuals on improving performance, specifically on anagram tasks and academic
outcomes (e.g. Markman et al., 1993; Nasco & Marsh, 1999; Roese, 1994). Given that
upward counterfactuals predict behavioral intentions and performance improvement in
such situations, it follows that, in a work context, upward counterfactuals will also predict
performance. Likewise, and as noted by Epstude & Roese (2008), “it is straightforward
that self-focused thoughts are more useful for self-improvement” and behavior change
(p.179).
Therefore, I predict:
Hypothesis 5a: Self-focused upward counterfactual thinking is positively related
to performance.
Scholarly research has indicated that performance discrepancies can prompt self-
focused upward counterfactual thinking, and such thinking influences behavior (Epstude
& Roese, 2008). These findings suggest that self-focused upward counterfactual thinking
will mediate the relationship between baseline performance discrepancy and
performance. To this point, feedback on performance discrepancies should prompt
individuals to reflect on alternative strategies they could have pursued to attain a better
outcome. Such reflection provides causal insight about behaviors and outcomes, as well
as motivational benefits (Epstude & Roese, 2008), which, in turn, affects performance.
55
Specifically, I hypothesize:
Hypothesis 5b: Baseline performance discrepancy indirectly affects performance,
through self-focused upward counterfactual thinking.
In accordance with my previously stated objectives, this research also explores the
conditions that lead one to improve performance following self-focused upward
counterfactual thinking. Therefore, the following section outlines proposed boundary
conditions that influence the extent to which such thinking effects performance.
Moderators of the Effect of Self-Focused
Upward Counterfactual Thinking on Performance.
Core self-evaluations. Core self-evaluations are fundamental, bottom-line
evaluations that individuals hold about themselves, others, and the world (Judge, Locke,
& Durham, 1997). These evaluations consist of four traits, including self-esteem,
generalized self-efficacy, locus of control, and neuroticism (see Table 3), which, together,
form a higher-order core self-evaluations trait. Core self-evaluations have been shown to
predict life and job satisfaction, as well as job performance (Bono & Judge, 2003; Judge,
Locke, Durham, & Kluger, 1998).
Table 3
Core Self-Evaluations
Core Evaluation Definition
Self-esteem
The overall value one places on oneself
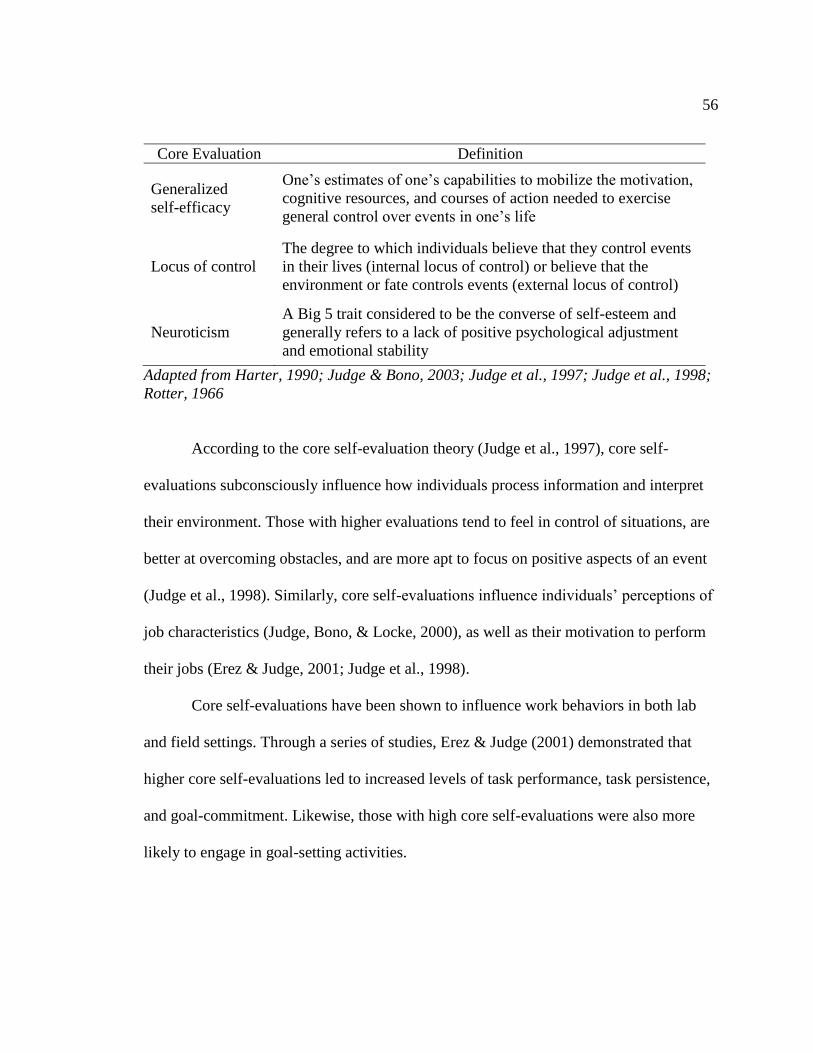
56
Core Evaluation Definition
Generalized
self-efficacy
One’s estimates of one’s capabilities to mobilize the motivation,
cognitive resources, and courses of action needed to exercise
general control over events in one’s life
Locus of control
The degree to which individuals believe that they control events
in their lives (internal locus of control) or believe that the
environment or fate controls events (external locus of control)
Neuroticism
A Big 5 trait considered to be the converse of self-esteem and
generally refers to a lack of positive psychological adjustment
and emotional stability
Adapted from Harter, 1990; Judge & Bono, 2003; Judge et al., 1997; Judge et al., 1998;
Rotter, 1966
According to the core self-evaluation theory (Judge et al., 1997), core self-
evaluations subconsciously influence how individuals process information and interpret
their environment. Those with higher evaluations tend to feel in control of situations, are
better at overcoming obstacles, and are more apt to focus on positive aspects of an event
(Judge et al., 1998). Similarly, core self-evaluations influence individuals’ perceptions of
job characteristics (Judge, Bono, & Locke, 2000), as well as their motivation to perform
their jobs (Erez & Judge, 2001; Judge et al., 1998).
Core self-evaluations have been shown to influence work behaviors in both lab
and field settings. Through a series of studies, Erez & Judge (2001) demonstrated that
higher core self-evaluations led to increased levels of task performance, task persistence,
and goal-commitment. Likewise, those with high core self-evaluations were also more
likely to engage in goal-setting activities.
57
Kamer & Annen (2010) examined the influence of core self-evaluations on
performance appraisal outcomes. Specifically, they examined the influence of core self-
evaluations on performance appraisal satisfaction and goal-commitment. Their findings
revealed that those with higher core self-evaluations reported higher satisfaction with
their performance appraisal as well as increased goal-commitment.
I propose that core self-evaluations will influence the extent to which self-focused
upward counterfactual thinking effects performance. Because those with higher core self-
evaluations feel more capable of mobilizing a course of action and cognitive resources,
are less fearful of novel situations, and have increased confidence in their abilities (Bono
& Judge, 2003; Judge et al., 1998), it is likely core self-evaluations will influence
whether individuals transfer the benefits of self-focused upward counterfactual thinking
to performance efforts. Following this logic and consistent with the review of the effects
of core self-evaluations on task behaviors, I hypothesize:
Hypothesis 6: Core self-evaluations moderate the influence of self-focused
upward counterfactual thinking on performance, such that the influence of self-
focused counterfactual thinking becomes more positive as core self-evaluations
increase.
Counterfactual specificity. Counterfactual thinking enables individuals to
mentally simulate how alternative behaviors might have led to different outcomes. I
argue that the specificity level of such simulations (i.e. the counterfactuals) plays an
important role in determining whether the counterfactuals influence performance. More
58
specifically, I argue that detailed and specific (i.e. concrete) counterfactuals, rather than
vague and abstract, will more positively effect performance. Theory and findings in the
goal-setting literature, namely goal-setting theory (Locke & Latham, 1990), as well as
findings from implementation intention (Gollwitzer & Sheeran, 2006) and counterfactual
thinking research (Smallman, 2013), illustrate the value of specificity during mental
simulations.
Goal-setting research (Locke & Latham, 2002) has found that specificity
contributes to the effectiveness of goals. According to goal-setting theory (Locke &
Latham, 1990), specific goals help to reduce ambiguity about what has to be achieved.
Thus, specific goals direct effort and attention during the pursuit of a task. It is likely that
the specificity of counterfactuals will regulate effort, attention, and behavior similarly,
thus leading to stronger effects on performance.
I further propose that detailed and specific counterfactuals will exert effects on
behaviors similar to those of implementation intentions. Implementation intentions have
been defined as if-then plans that connect good opportunities to act with cognitive or
behavioral responses that are useful for accomplishing goals (Gollwitzer & Sheeran,
2006). Implementation intentions specify when, where, and how one intends to achieve
the goal, rather than merely specifying an intended outcome (i.e. a goal intention). The
detail and specificity of such thoughts create a stronger link in memory compared to
vague and abstract thoughts (Sheeran et al., 2005). As a result, individuals are more apt to
engage in goal-directed behaviors when the opportunity presents. Gollwitzer & Sheeran
59
(2006) documented empirical support for this notion in a fairly recent meta-analysis.
I propose that there are parallels between implementation intentions and
counterfactuals. Both thought processes evoke if-then conditionals that serve as self-
regulatory guides for behavior. As such, I argue that when counterfactuals are detailed
and specific, they will exert a stronger influence on performance.
A recent study (Smallman, 2013) in the counterfactual thinking literature offers
empirical support for my argument. In a series of five studies, Smallman demonstrated
that counterfactual content influences the extent to which counterfactuals elicit relevant
behavioral intentions. The level of detail and specificity of counterfactuals were among
the content aspects examined. The findings revealed that when counterfactuals are
detailed and specific, they are more likely to evoke behavioral intentions. According to
the theory of planned behavior (Ajzen, 1991), behavioral intentions indicate the extent to
which one will work hard and expend effort for performance.
Based on the theory of planned behavior (Ajzen, 1991) and building on
Smallman’s (2013) finding, as well as the parallels between implementation intentions
and counterfactuals, I predict that:
Hypothesis 7: Counterfactual specificity moderates the influence of
self-focused upward counterfactual thinking on performance, such that the
influence of self-focused counterfactual thinking becomes more positive when
counterfactual specificity includes a detailed/specific behavioral description.
60
Conditional Indirect Effects.
Recall that the overall goal of this research is to offer a more complete picture of
the effects of reflection. To this end, I have hypothesized boundary conditions that are
believed to influence the extent to which individuals engage in self-focused upward
counterfactual thinking following a performance discrepancy, as well as those that are
believed to influence the extent to which such thinking affects performance. Because the
proposed relationships are contingent on boundary conditions, so too is the hypothesized
indirect effect in the proposed research model (Hayes, 2012).
Stated differently, I argue that the indirect effect of self-focused upward
counterfactual thinking in the baseline performance discrepancy—performance
relationship is dependent on the values of the proposed moderators. Thus, I have
proposed above moderated mediation (James & Brett, 1984) or, in other words, a
conditional process model (Hayes & Preacher, 2013). A conditional process model
attempts to explain both how and when an effect occurs (Hayes, 2013) and can, therefore,
offer valuable insight into complex relationships.
Assuming task-relevant knowledge, psychological empowerment, and feedback
specificity moderate the association between baseline performance discrepancy and self-
focused upward counterfactual thinking, it is expected that these constructs will
conditionally influence the strength of the indirect relationship between baseline
performance discrepancy and performance. Likewise, assuming that core self-evaluations
and counterfactual specificity moderate the relationship between self-focused upward
61
counterfactual thinking and performance, it is likely these moderators will influence the
association between baseline performance discrepancy and performance. Because the
variables in my proposed research model are expected to demonstrate a pattern of
moderated mediation, I present and will test the following hypotheses:
Hypothesis 8a: Task-relevant knowledge will moderate the positive and indirect
effect of baseline performance discrepancy on performance, through self-focused
upward counterfactual thinking. Specifically, self-focused upward counterfactual
thinking will mediate the indirect effect when task-relevant knowledge is high but
not when it is low.
Hypothesis 8b: Psychological empowerment will moderate the positive and
indirect effect of baseline performance discrepancy on performance, through self-
focused upward counterfactual thinking. Specifically, self-focused upward
counterfactual thinking will mediate the indirect effect when psychological
empowerment is high but not when it is low.
Hypothesis 8c: Feedback specificity will moderate the positive and indirect effect
of baseline performance discrepancy on performance, through self-focused
upward counterfactual thinking. Specifically, self-focused upward counterfactual
thinking will mediate the indirect effect when feedback specificity is low but not
when it is high.
Hypothesis 8d: Core self-evaluations will moderate the positive and indirect effect
62
of baseline performance discrepancy on performance, through self-focused
upward counterfactual thinking. Specifically, self-focused upward counterfactual
thinking will mediate the indirect effect when core self-evaluations are high but
not when core self-evaluations are low.
Hypothesis 8e: Counterfactual specificity will moderate the positive and indirect
effect of baseline performance discrepancy on performance, through self-focused
upward counterfactual thinking. Specifically, self-focused upward counterfactual
thinking will mediate the indirect effect when counterfactual specificity is high but
not when it is low.
63
CHAPTER THREE: RESEARCH METHODOLOGY
In this chapter, I introduce the research methodology used to examine the research
model discussed in Chapter 2 (see Figure 2). The details of my study are organized into
three sections. The first section provides details pertaining to the design and data
collection, which includes a discussion of the simulation I created to test my research
model and the identification of sample participants. The second section introduces the
study’s independent, dependent and control measures. The final section details the
statistical method used to analyze and interpret the data.
Research Design and Data Collection
Research Setting.
To test the conceptual model, I designed, developed, and validated a social
interaction simulation and administered it via a virtual experiment (Harrison, Lin, Carroll,
& Carley, 2007) to study participants. Simulations are more standardized than
observations, as well as other forms of behavioral evaluations, and are an effective means
of studying behavior (Thornton & Cleveland, 1990). Simulations have enabled
management scholars to replicate the core features of an activity and to elicit overt
behaviors from participants, while pursuing highly focused research and controlling for
extraneous effects (Secchi, 2015; Thornton & Cleveland, 1990). These immersive
64
technology tools have been used extensively to examine aspects of the learning process,
such as the effects of reflection interventions (e.g. Anseel et al., 2009; Ellis et al., 2006,
2009), as well as in other management research such as feedback, empowerment, and
individual work performance (Biron & Bamberger, 2010; Goodman et al., 2004, 2011).
Scholars have included an array of simulated tasks in management studies, for instance
electronic workplace correspondence (Anseel et al., 2009), complex decision-making
endeavors (Ellis et al., 2009), strategic planning (Ellis et al., 2006), and operational
activities (Goodman et al., 2011). In the current study, a simulated leadership skills task
was designed, developed, validated, and implemented. I introduce the details of such in
the following sections.
Simulation Overview and Development.
Simulation overview. The simulation, developed via SimWriter® immersive
learning technology, was comprised of a series of discrete simulated social interactions
designed to capture realistic workplace interactions and to facilitate assessment of
leadership skill proficiency. Research participants assumed the role of a manager, Pat
Reese, and interacted with subordinates in a virtual organization. Participants
demonstrated their leadership skill by responding to interactions in the leadership role.
They chose a response from a series of provided potential responses. Following the
participant’s selection, and using conversation branching rules similar to those of a
decision-tree structure, the simulated subordinates then replied to the participant with
comments tailored to the participant’s response selection.
65
I designed the simulation to assess two leadership skills, negotiation and
management of personnel resources, over task rounds. Each task round included six
interactions (i.e. conversations), comprised of up to 25 opportunities (i.e. decision points)
for participants to demonstrate their negotiation skill proficiency and up to 24
opportunities to demonstrate their management of personnel resources skill proficiency.
The underlying critical incidents and details of some interactions were inspired by
negotiation, management, and supervisory case studies and role-plays (Asherman &
Asherman, 2004; Clandy, 1994; Lewicki, Barry, & Saunders, 2015), whereas others were
inspired by conversations with management scholars and industry professionals with
management experience. Upon executing a trial run of the simulation and based on its
length, approximately two hours, as well as the results of the skill-domain validation
process, the findings for which are discussed in Chapter 4, the negotiation interactions
were removed from the final simulation. Thus, the final simulation deployed in this
research consisted of three interactions with up to 24 opportunities to demonstrate one’s
personnel management skills per task round (i.e. six interactions with up to 48 decisions
total).
Participants completed the first task round (Time 1) by observing and responding
to subordinates during three interactions that reflected situations managers routinely
encounter in the workplace. These included situations such as helping subordinates to
adjust to organizational changes, to identify root causes of lack of productivity, and to
communicate effectively regarding task demands. After the first task round, participants
received performance feedback, and subsequently participated in a written reflection
66
activity. Upon completing the reflection activity, participants advanced to a second task
round (Time 2), also consisting of three interactions, to demonstrate their leadership skill
performance following reflection. After completing the simulation, participants were
debriefed on the purpose of the research.
Simulation development. To assure the realism and to enhance the face validity of
the simulation, the simulation content and context, such as the job setting, worker details,
and skills, were developed using occupational details provided in the Occupational
Information Network (O*NET) Content Model (Peterson et al., 2001). O*NET is a
comprehensive, theoretically and empirically sound system that provides occupational
information for nearly 950 jobs in the United States (National Center for O*NET
Development, n.d.). The O*NET Content Model is the conceptual foundation of this
system.
The O*NET Content Model (Figure 3) offers a framework for identifying and
organizing important information about jobs. Six descriptors are used to organize such
information, including: worker characteristics, worker requirements, experience
requirements such as skills, occupational requirements, worker characteristics, and
occupation-specific information. As such, it encompasses both job-oriented descriptors,
as well as worker-oriented descriptors. Likewise, it includes occupational-specific
descriptors and cross-occupational descriptors—thus enabling occupational information
to be applied across jobs and industries (Mumford & Peterson, 1999). In these ways, the
O*NET skills domain provides a common language for leadership skills across job
settings. Moreover, the O*NET skills domain integrates decades of academic research
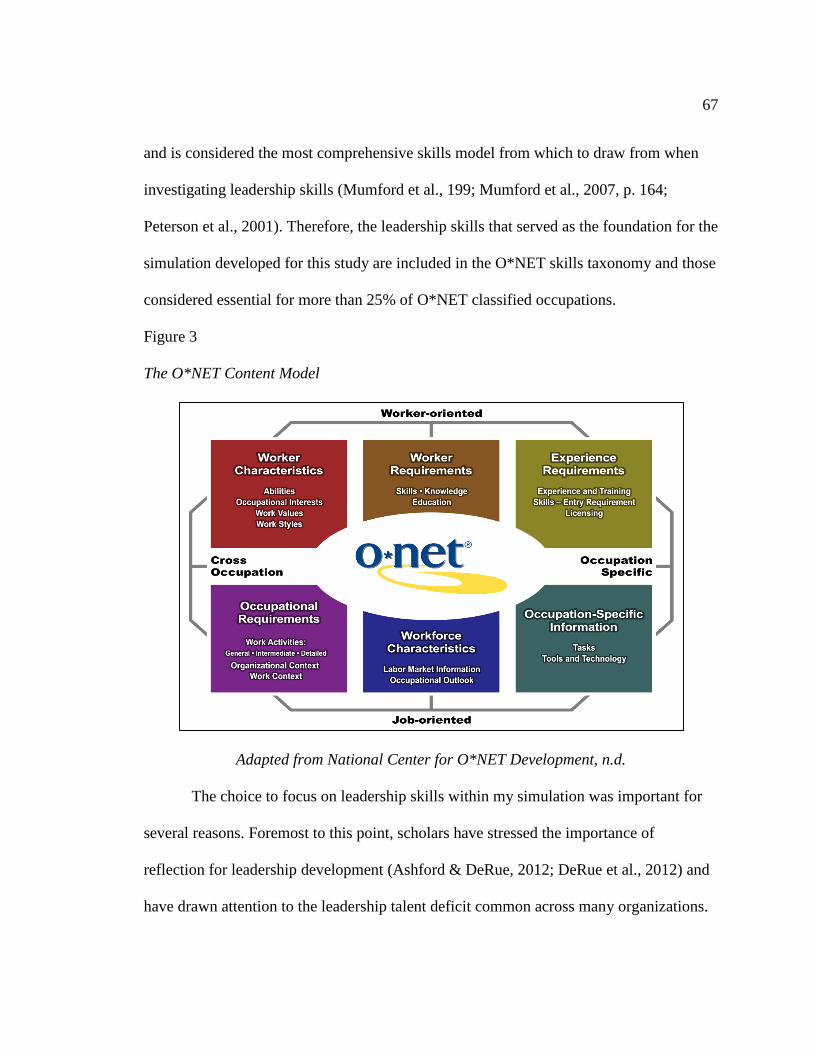
67
and is considered the most comprehensive skills model from which to draw from when
investigating leadership skills (Mumford et al., 199; Mumford et al., 2007, p. 164;
Peterson et al., 2001). Therefore, the leadership skills that served as the foundation for the
simulation developed for this study are included in the O*NET skills taxonomy and those
considered essential for more than 25% of O*NET classified occupations.
Figure 3
The O*NET Content Model
Adapted from National Center for O*NET Development, n.d.
The choice to focus on leadership skills within my simulation was important for
several reasons. Foremost to this point, scholars have stressed the importance of
reflection for leadership development (Ashford & DeRue, 2012; DeRue et al., 2012) and
have drawn attention to the leadership talent deficit common across many organizations.
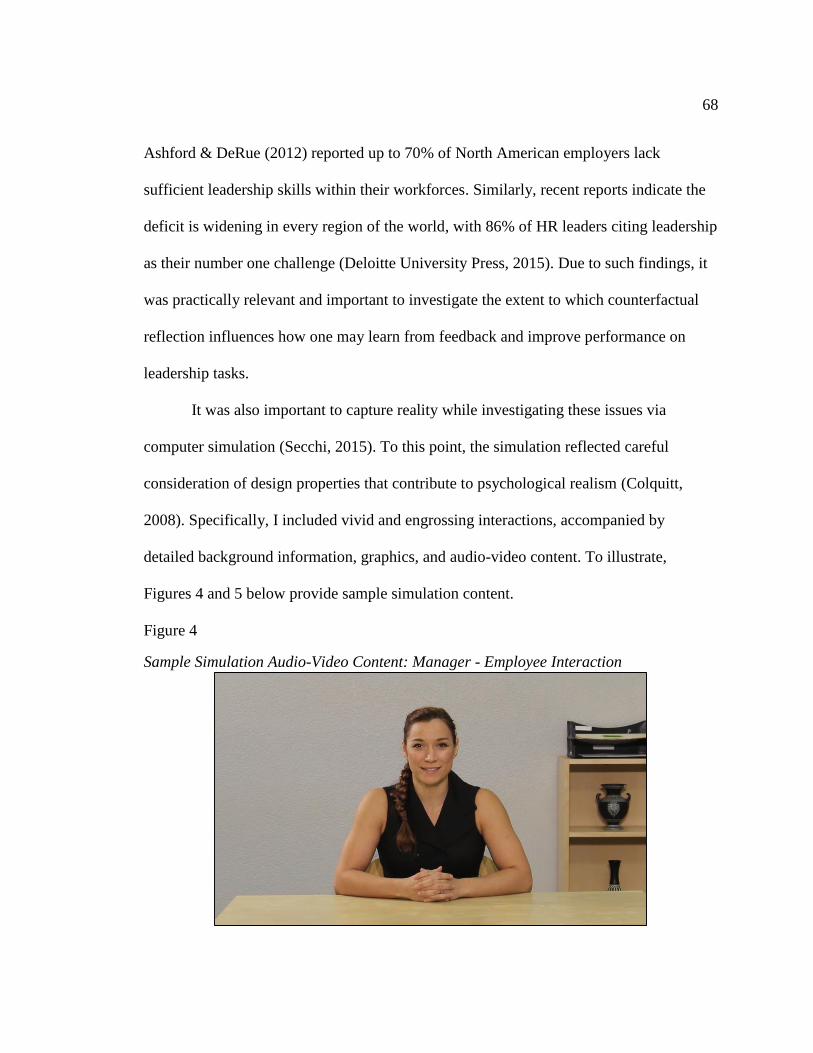
68
Ashford & DeRue (2012) reported up to 70% of North American employers lack
sufficient leadership skills within their workforces. Similarly, recent reports indicate the
deficit is widening in every region of the world, with 86% of HR leaders citing leadership
as their number one challenge (Deloitte University Press, 2015). Due to such findings, it
was practically relevant and important to investigate the extent to which counterfactual
reflection influences how one may learn from feedback and improve performance on
leadership tasks.
It was also important to capture reality while investigating these issues via
computer simulation (Secchi, 2015). To this point, the simulation reflected careful
consideration of design properties that contribute to psychological realism (Colquitt,
2008). Specifically, I included vivid and engrossing interactions, accompanied by
detailed background information, graphics, and audio-video content. To illustrate,
Figures 4 and 5 below provide sample simulation content.
Figure 4
Sample Simulation Audio-Video Content: Manager - Employee Interaction
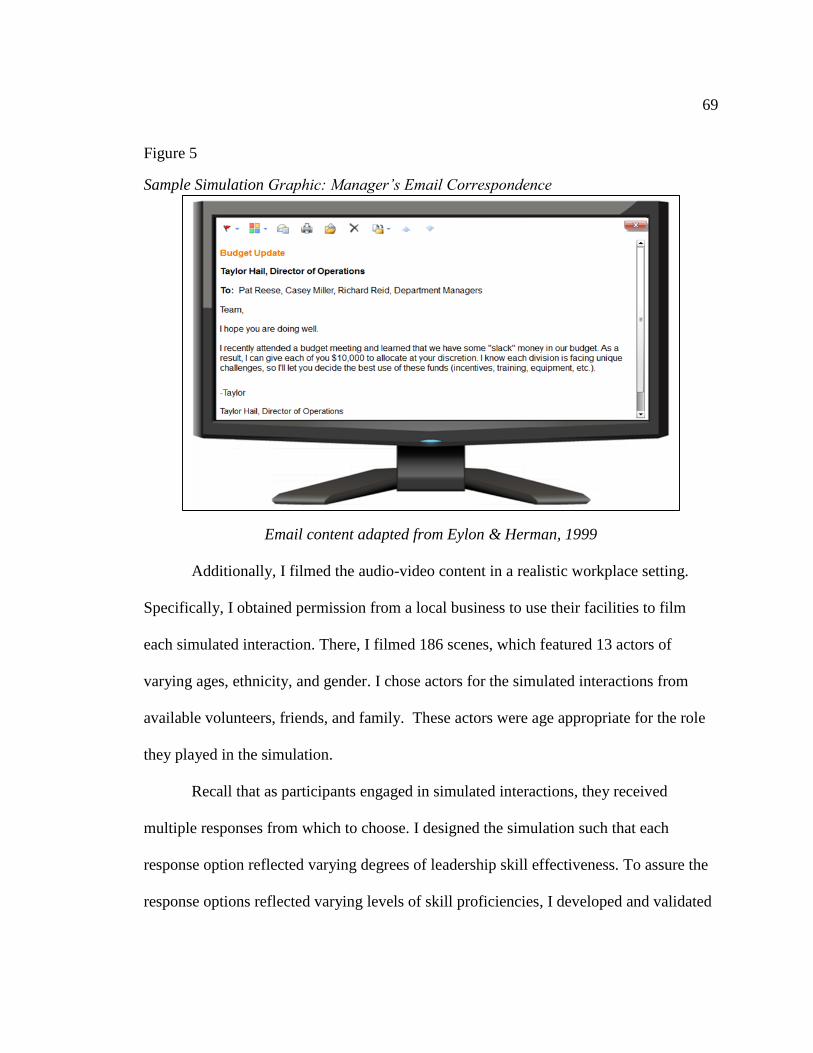
69
Figure 5
Sample Simulation Graphic: Manager’s Email Correspondence
Email content adapted from Eylon & Herman, 1999
Additionally, I filmed the audio-video content in a realistic workplace setting.
Specifically, I obtained permission from a local business to use their facilities to film
each simulated interaction. There, I filmed 186 scenes, which featured 13 actors of
varying ages, ethnicity, and gender. I chose actors for the simulated interactions from
available volunteers, friends, and family. These actors were age appropriate for the role
they played in the simulation.
Recall that as participants engaged in simulated interactions, they received
multiple responses from which to choose. I designed the simulation such that each
response option reflected varying degrees of leadership skill effectiveness. To assure the
response options reflected varying levels of skill proficiencies, I developed and validated
70
behaviorally anchored rating scales (BARS) (Smith & Kendall, 1963), as described in the
next section, which I used to guide the design of participant response options.
Subsequently, I used the scales to validate the corresponding response option scores used
for performance score calculations in the final simulation.
In addition to the careful development of participant response options, the design
of the current study required two complete task versions (Time 1 and Time 2 tasks) to test
the effects of counterfactual reflection on leadership skill performance. It was important,
therefore, to ensure that Time 1 tasks (i.e. three interactions per skill category) were
equivalent in complexity to those presented at Time 2. To develop such, I followed an
incident isomorphic cloning procedure (Clause, Mullins, Nee, Pulakos, & Schmitt, 1998;
Lievens & Sackett, 2007) that has been supported as an effective means of developing
alternate assessments (Lievens & Anseel, 2007) and has been implemented in prior
management reflection studies (Anseel et al., 2009).
The incident isomorphic cloning procedure is grounded in item generation theory,
which posits that the items that comprise test forms (in this case simulated interactions)
contain both radicals and incidentals (Kyllonen, 2002). Radicals are structural features
that determine item difficulty, whereas incidentals are surface details and characteristics
that do not influence item difficulty (Dennis et al., 2002; Irvine et al., 1990; Lievens &
Sacket, 2007). Based on the role of these factors, the incident isomorphic cloning
procedure consists of developing alternate task items by generating item variants that
retain the radicals (features that determine item difficulty) while altering the incidentals
(surface details) (Lievens & Anseel, 2007). Specifically, when following this approach,
71
the skill domain and the critical incident are considered radicals that impact item
difficulty. Conversely, the context of the incident, as well as linguistic and grammar
changes to the context in which the incident is embedded and the ways of responding to
the incident, are incidentals (Lievens & Sackett, 2007). Consequently, these were the
incidentals of focus when I developed item variants for the alternate simulated
interactions.
As such, the incident isomorphic cloning procedure yielded alternate task
measurement items (i.e. task rounds) that were based on the same critical incident yet
appeared superficially different. Although superficial details varied between task items,
by using behaviorally anchored rating scales as the foundation for generating the original
and alternate task items, I generated psychometrically equivalent task rounds. I now
discuss the steps for developing and validating the behaviorally anchored rating scales,
followed by the simulation validation protocol.
Behaviorally Anchored Rating Scales.
Behaviorally anchored rating scales are assessment tools that capture performance
in multi-dimensional, behavior-specific terms (Schwab, Heneman, & DeCotiis, 1975) and
provide raters with behavioral descriptions that exemplify varying degrees of each
dimension (Smith & Kendall, 1963). BARS are designed to standardize observation and
rating processes (Smith & Kendall, 1963; Jacobs, Kafry, & Zedeck, 1980). Additionally,
scholars consider BARS useful when providing feedback, as the scales provide concrete
examples of job behaviors that can be improved (Cummings & Schwab, 1973). To these
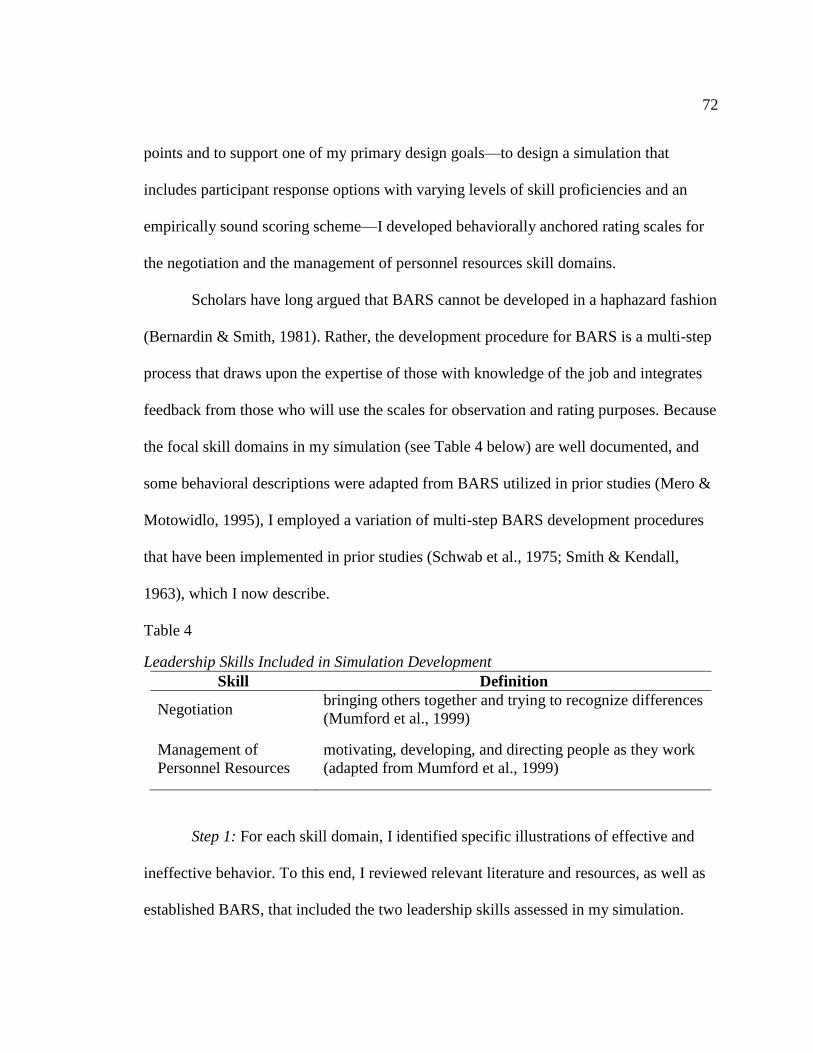
72
points and to support one of my primary design goals—to design a simulation that
includes participant response options with varying levels of skill proficiencies and an
empirically sound scoring scheme—I developed behaviorally anchored rating scales for
the negotiation and the management of personnel resources skill domains.
Scholars have long argued that BARS cannot be developed in a haphazard fashion
(Bernardin & Smith, 1981). Rather, the development procedure for BARS is a multi-step
process that draws upon the expertise of those with knowledge of the job and integrates
feedback from those who will use the scales for observation and rating purposes. Because
the focal skill domains in my simulation (see Table 4 below) are well documented, and
some behavioral descriptions were adapted from BARS utilized in prior studies (Mero &
Motowidlo, 1995), I employed a variation of multi-step BARS development procedures
that have been implemented in prior studies (Schwab et al., 1975; Smith & Kendall,
1963), which I now describe.
Table 4
Leadership Skills Included in Simulation Development
Skill Definition
Negotiation bringing others together and trying to recognize differences
(Mumford et al., 1999)
Management of
Personnel Resources
motivating, developing, and directing people as they work
(adapted from Mumford et al., 1999)
Step 1: For each skill domain, I identified specific illustrations of effective and
ineffective behavior. To this end, I reviewed relevant literature and resources, as well as
established BARS, that included the two leadership skills assessed in my simulation.
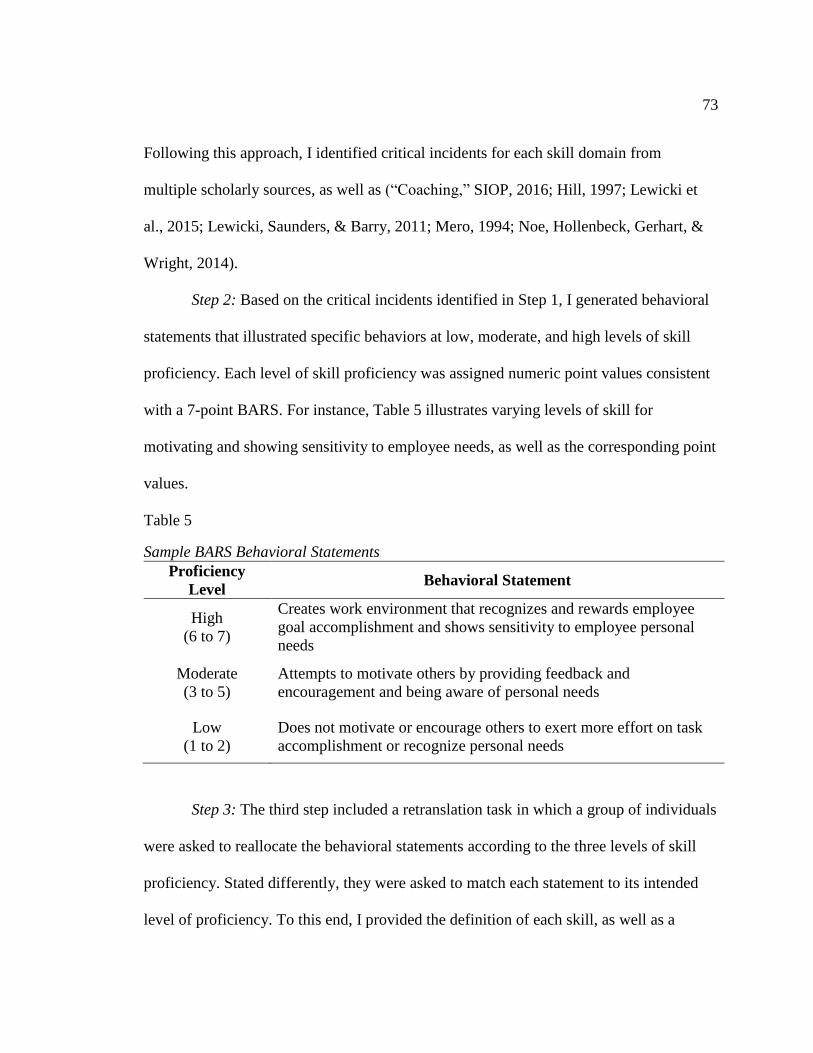
73
Following this approach, I identified critical incidents for each skill domain from
multiple scholarly sources, as well as (“Coaching,” SIOP, 2016; Hill, 1997; Lewicki et
al., 2015; Lewicki, Saunders, & Barry, 2011; Mero, 1994; Noe, Hollenbeck, Gerhart, &
Wright, 2014).
Step 2: Based on the critical incidents identified in Step 1, I generated behavioral
statements that illustrated specific behaviors at low, moderate, and high levels of skill
proficiency. Each level of skill proficiency was assigned numeric point values consistent
with a 7-point BARS. For instance, Table 5 illustrates varying levels of skill for
motivating and showing sensitivity to employee needs, as well as the corresponding point
values.
Table 5
Sample BARS Behavioral Statements
Proficiency
Level Behavioral Statement
High
(6 to 7)
Creates work environment that recognizes and rewards employee
goal accomplishment and shows sensitivity to employee personal
needs
Moderate
(3 to 5)
Attempts to motivate others by providing feedback and
encouragement and being aware of personal needs
Low
(1 to 2)
Does not motivate or encourage others to exert more effort on task
accomplishment or recognize personal needs
Step 3: The third step included a retranslation task in which a group of individuals
were asked to reallocate the behavioral statements according to the three levels of skill
proficiency. Stated differently, they were asked to match each statement to its intended
level of proficiency. To this end, I provided the definition of each skill, as well as a
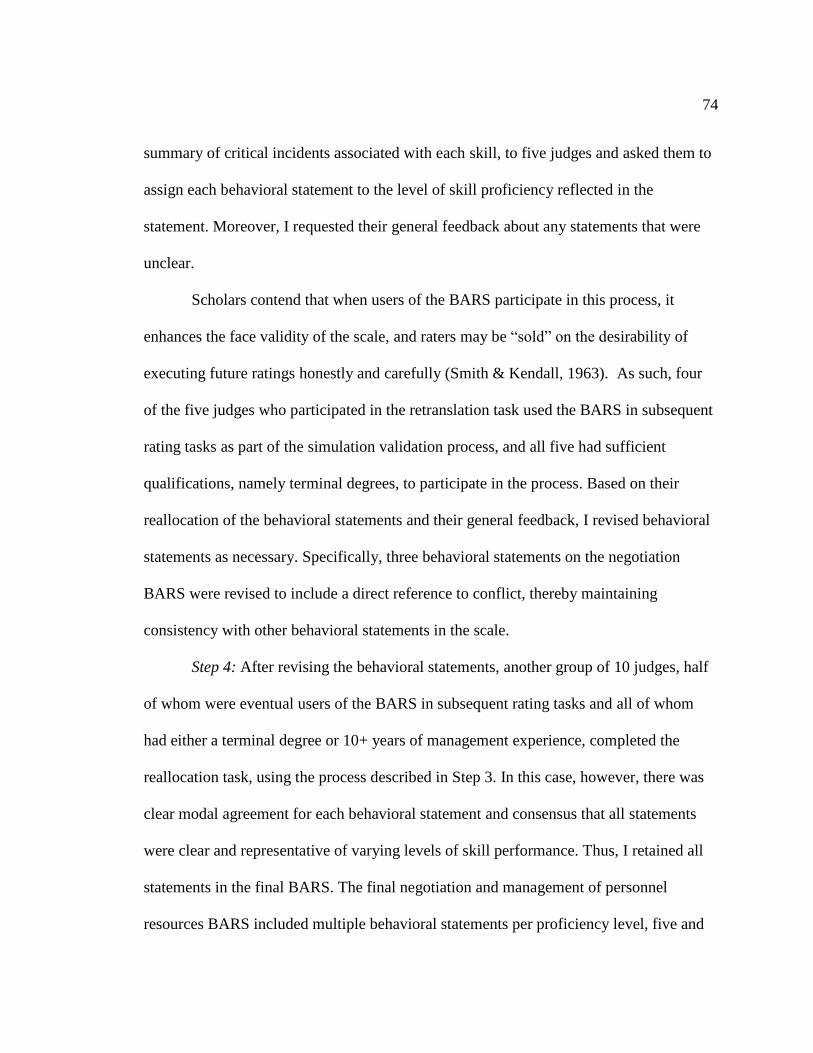
74
summary of critical incidents associated with each skill, to five judges and asked them to
assign each behavioral statement to the level of skill proficiency reflected in the
statement. Moreover, I requested their general feedback about any statements that were
unclear.
Scholars contend that when users of the BARS participate in this process, it
enhances the face validity of the scale, and raters may be “sold” on the desirability of
executing future ratings honestly and carefully (Smith & Kendall, 1963). As such, four
of the five judges who participated in the retranslation task used the BARS in subsequent
rating tasks as part of the simulation validation process, and all five had sufficient
qualifications, namely terminal degrees, to participate in the process. Based on their
reallocation of the behavioral statements and their general feedback, I revised behavioral
statements as necessary. Specifically, three behavioral statements on the negotiation
BARS were revised to include a direct reference to conflict, thereby maintaining
consistency with other behavioral statements in the scale.
Step 4: After revising the behavioral statements, another group of 10 judges, half
of whom were eventual users of the BARS in subsequent rating tasks and all of whom
had either a terminal degree or 10+ years of management experience, completed the
reallocation task, using the process described in Step 3. In this case, however, there was
clear modal agreement for each behavioral statement and consensus that all statements
were clear and representative of varying levels of skill performance. Thus, I retained all
statements in the final BARS. The final negotiation and management of personnel
resources BARS included multiple behavioral statements per proficiency level, five and
75
four respectively. The final BARS, used to design and to validate the simulation content
can be found in Appendix A. I now describe the specific steps taken during the
simulation validation process.
Simulation Validation.
Recall that I incorporated O*NET job information in the development of my
simulation. Although this responded to calls for research designs that maximize content
validity, as well as external validity (Colquitt, 2008; Scandura & Williams, 2000), I also
took additional steps to validate the simulation and the effectiveness of the leadership
skill scoring rules. More precisely, expert raters conducted independent evaluations of the
simulation content, using the behaviorally anchored rating scales described above. The
expert raters were comprised of individuals from academia and industry professionals
with leadership experience. I conducted three expert rating processes, as shown in Table
5. In the following sections, I provide an overview of each rating process, and I provide
the results in Chapter 4.
Table 6
Expert Rater Evaluations
Content Evaluated Aim of Evaluation/Details
Time 1 and Time 2 tasks Assess the similarity between the incidents depicted
in Time 1 and Time 2 interactions
Participant response options
Determine the ranking of skill effectiveness for each
set of response options
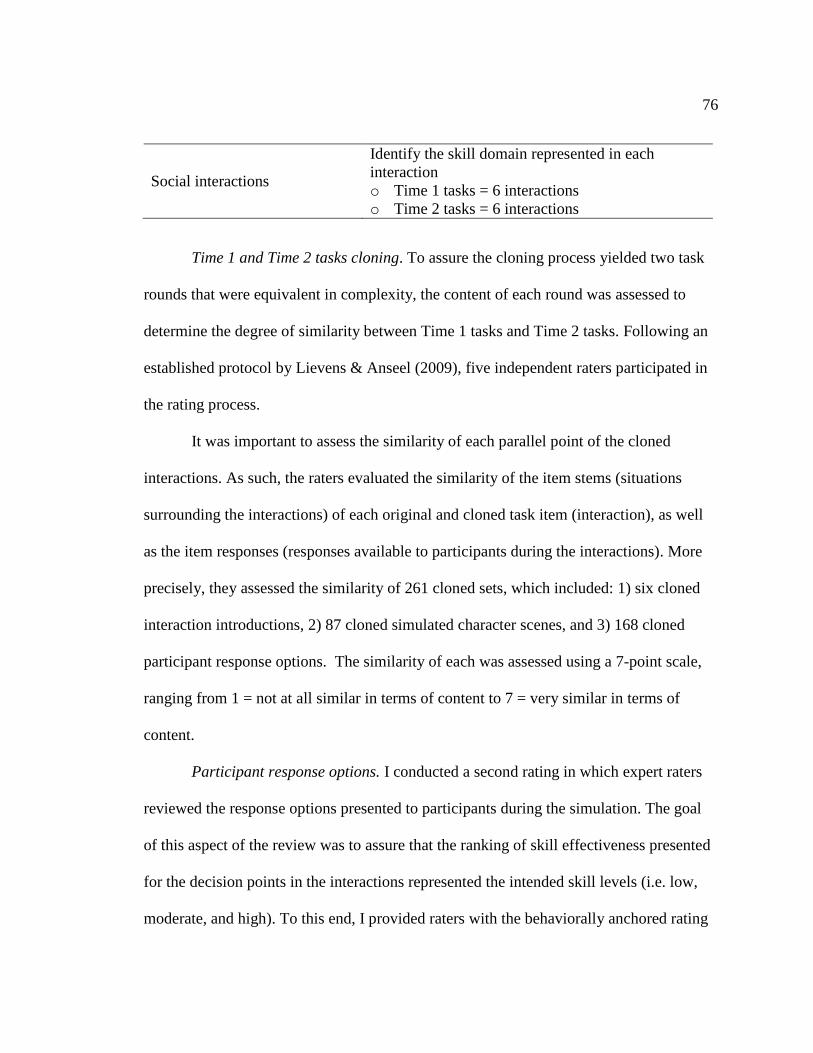
76
Social interactions
Identify the skill domain represented in each
interaction
o Time 1 tasks = 6 interactions
o Time 2 tasks = 6 interactions
Time 1 and Time 2 tasks cloning. To assure the cloning process yielded two task
rounds that were equivalent in complexity, the content of each round was assessed to
determine the degree of similarity between Time 1 tasks and Time 2 tasks. Following an
established protocol by Lievens & Anseel (2009), five independent raters participated in
the rating process.
It was important to assess the similarity of each parallel point of the cloned
interactions. As such, the raters evaluated the similarity of the item stems (situations
surrounding the interactions) of each original and cloned task item (interaction), as well
as the item responses (responses available to participants during the interactions). More
precisely, they assessed the similarity of 261 cloned sets, which included: 1) six cloned
interaction introductions, 2) 87 cloned simulated character scenes, and 3) 168 cloned
participant response options. The similarity of each was assessed using a 7-point scale,
ranging from 1 = not at all similar in terms of content to 7 = very similar in terms of
content.
Participant response options. I conducted a second rating in which expert raters
reviewed the response options presented to participants during the simulation. The goal
of this aspect of the review was to assure that the ranking of skill effectiveness presented
for the decision points in the interactions represented the intended skill levels (i.e. low,
moderate, and high). To this end, I provided raters with the behaviorally anchored rating
77
scales used during the simulation development process and asked that they assess the
behaviors depicted in each response using the provided behavioral scales.
The expert rater group for this task was comprised of 10 individuals. Five
assessed the participant response options in first task round, and five assessed the
response options in the second task round. More precisely, each rater evaluated 168
participant response options of varying skill proficiencies, namely 56 high, 56 moderate,
and 56 low-skill proficiency response options.
The data generated via the rater evaluation process was analyzed using an analysis
of variance (ANOVA), which provided an empirical test of whether there were
significant differences between the low, moderate, and high skill proficiencies reflected
in the response options at each decision point during the interactions.
Social interactions. To validate the simulated social interactions, I adapted a
content validity assessment procedure suggested by Hinkin & Tracey (1999) to
empirically test the skills reflected in each social interaction. I asked a group of raters to
examine the content of the simulation and to identify the skill domain captured in each
interaction. More precisely, 30 raters assessed the extent to which each social interaction
captured the negotiation skill domain, as well as the extent to which each interaction
captured the management of personnel resources skill domain, using a 5-point Likert type
scale ranging from 1= not at all to 5= completely. The raters were also asked to classify
each interaction as either a negotiation interaction or a management of personnel
resources interaction.
78
Cloning effectiveness pilot study. The final step in the simulation validation
process was a pilot study designed to provide further verification that the cloning
procedure used to generate alternate task versions for Time 1 and Time 2 was effective.
Based on the results of the skill domain rating task and the projected length of the full
simulation, the negotiation interactions were not included in the pilot study, nor the final
simulation. With the condensed simulation consisting of six management of personnel
resources interactions (i.e. three per round), I collected data to test whether mean
performance on the two task rounds was comparable as viewed by non-expert
participants. In prior research, undergraduate students and, in some cases, college
applicants have been used to assess differences between alternate test versions (e.g.
Lievens & Anseel, 2007; Lievens, Buyse, & Sackett, 2005; Lievens & Sackett, 2007).
Following this practice, my pilot study sample was comprised of undergraduate business
students, and all received extra credit for their participation.
Participants completed both task versions in a counterbalanced order, and I
collected 58 usable responses. This provided a sufficient number of observations to
determine if there were significant differences between mean performance on each task
round (Hair, Black, Babin, & Anderson, 2010). Specifically, I analyzed the data with a 2
(order: normal vs. reversed) X 2 (task: Time 1 vs. Time 2) mixed ANOVA, with repeated
measures on the last factor and performance as the dependent variable. I discuss the
results in Chapter 4.
79
Reflection Prompt Pilot Study.
I conducted a second pilot study to test the effectiveness of the reflection prompt
(see Appendix B). The sample was comprised of 12 undergraduate business students
(58% female, 42% male). They were provided the counterfactual reflection prompt and
were asked to reflect on their performance during a leadership and teamwork simulation,
completed as part of a junior-level organizational behavior course. The content of their
reflections confirmed that the reflection instructions were effective for prompting
counterfactual thoughts. As such, I determined that the prompt was acceptable for my
final data collection.
Final Data Collection.
The sample to test my hypotheses was comprised of both graduate and
undergraduate students, recruited from multiple U.S. universities. Prior reflection studies
in the management literature (e.g. Anseel et al, 2009; Ellis et al., 2006, 2009), including
DeRue et al. (2012) who examined the influence of reflection on leadership development,
have included student samples. Similarly, the use of student samples is common practice
throughout counterfactual thinking research (e.g. Markman et al., 1995; Roese & Olson,
1993; Sanna, 1997; Smallman & Roese, 2009). More importantly, I selected a student
sample for my study due to recent industry reports, which indicate that organizations
consistently struggle to develop leadership skills across all levels—particularly among
millennial leaders (Deloitte University Press, 2015). Additionally, Mumford, Campion,
& Morgeson (2007) have demonstrated that leadership skills are needed at all
80
organizational levels, and the leadership skills included in my research are those needed
at all levels of organizational strata—including junior (1-5 years of experience), mid (6-
20 years), and senior (21+ years) levels (Mumford et al., 2007). Thus, graduate and
undergraduate students, whose experience levels are represented in such strata, were an
appropriate sample for this study.
To encourage individuals to participate, I highlighted that the skills on which they
were assessed are skills often evaluated in employment selection processes (Lievens &
Anseel, 2007). I also informed participants that workplace simulations are often used in
professional settings to develop individuals for management positions (Anseel et al.,
2009). Thus, through their participation, they had the opportunity to test their skill levels
relative to those desired in selection and promotion decisions. I assured participants that
their survey responses, performance scores, and reflection content would remain
confidential. Additionally, students received extra credit for participation, when permitted
by their instructors and the policies of their respective institutions.
The faculty who assisted with the recruitment process provided the participation
link to their students directly and, in some cases, posted to the link universities’ learning
management systems (e.g. Blackboard®). The participation link remained active for four
weeks, and a total of 613 students (136 graduate; 483 undergraduate) were invited to
participate in the study.
Of the 613 students invited to participate, 251 students (41%) provided their
consent to participate in the study. Due to technology reporting failures, 18 cases were
missing substantial amounts of data (i.e. >50%) and, consequently, were removed from
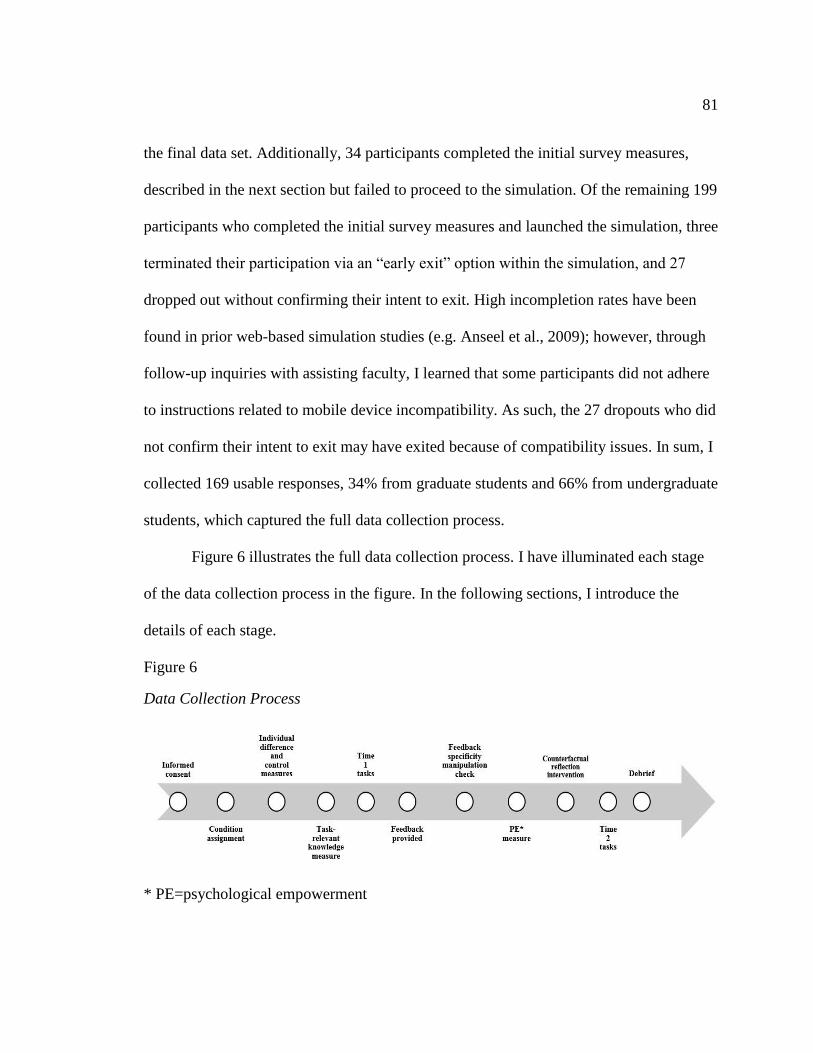
81
the final data set. Additionally, 34 participants completed the initial survey measures,
described in the next section but failed to proceed to the simulation. Of the remaining 199
participants who completed the initial survey measures and launched the simulation, three
terminated their participation via an “early exit” option within the simulation, and 27
dropped out without confirming their intent to exit. High incompletion rates have been
found in prior web-based simulation studies (e.g. Anseel et al., 2009); however, through
follow-up inquiries with assisting faculty, I learned that some participants did not adhere
to instructions related to mobile device incompatibility. As such, the 27 dropouts who did
not confirm their intent to exit may have exited because of compatibility issues. In sum, I
collected 169 usable responses, 34% from graduate students and 66% from undergraduate
students, which captured the full data collection process.
Figure 6 illustrates the full data collection process. I have illuminated each stage
of the data collection process in the figure. In the following sections, I introduce the
details of each stage.
Figure 6
Data Collection Process
* PE=psychological empowerment
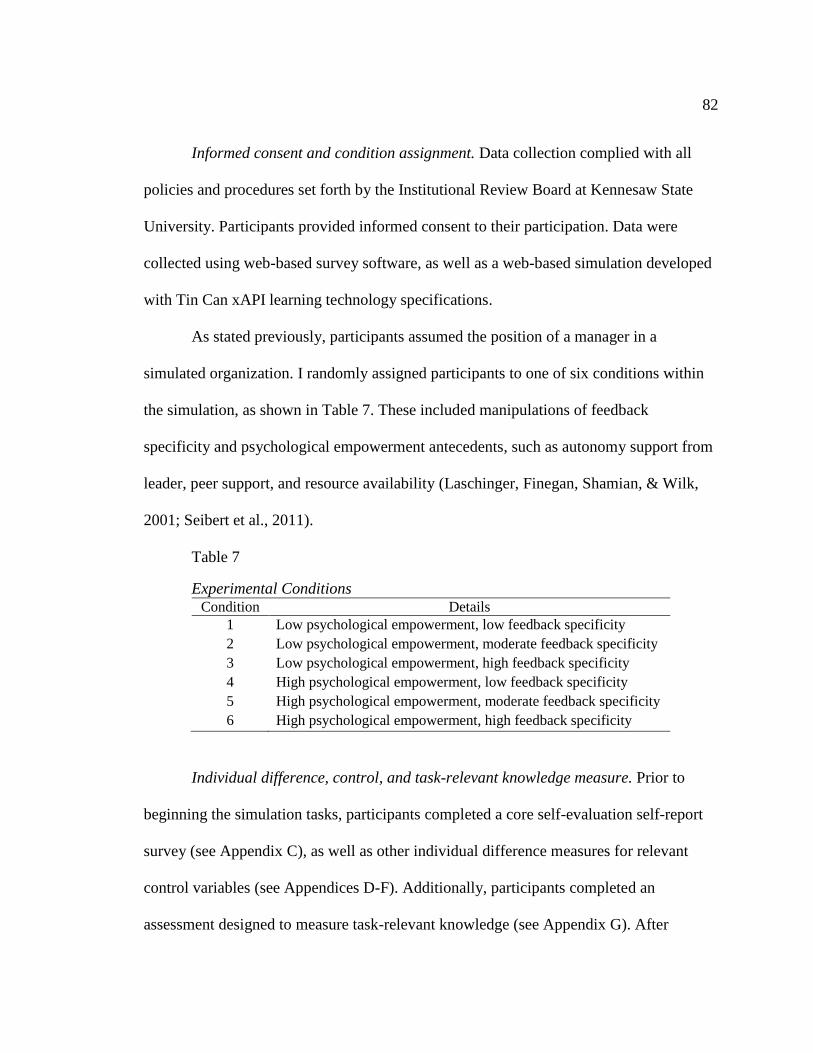
82
Informed consent and condition assignment. Data collection complied with all
policies and procedures set forth by the Institutional Review Board at Kennesaw State
University. Participants provided informed consent to their participation. Data were
collected using web-based survey software, as well as a web-based simulation developed
with Tin Can xAPI learning technology specifications.
As stated previously, participants assumed the position of a manager in a
simulated organization. I randomly assigned participants to one of six conditions within
the simulation, as shown in Table 7. These included manipulations of feedback
specificity and psychological empowerment antecedents, such as autonomy support from
leader, peer support, and resource availability (Laschinger, Finegan, Shamian, & Wilk,
2001; Seibert et al., 2011).
Table 7
Experimental Conditions Condition Details
1 Low psychological empowerment, low feedback specificity
2 Low psychological empowerment, moderate feedback specificity
3 Low psychological empowerment, high feedback specificity
4 High psychological empowerment, low feedback specificity
5 High psychological empowerment, moderate feedback specificity
6 High psychological empowerment, high feedback specificity
Individual difference, control, and task-relevant knowledge measure. Prior to
beginning the simulation tasks, participants completed a core self-evaluation self-report
survey (see Appendix C), as well as other individual difference measures for relevant
control variables (see Appendices D-F). Additionally, participants completed an
assessment designed to measure task-relevant knowledge (see Appendix G). After
83
completing the survey items, I directed participants to the webpage with the social
interaction simulation, where they proceeded to Time 1 tasks.
Time 1 tasks. Participants demonstrated their management of personnel resources
skills across three social interactions. During each task, participants interacted with a
simulated employee and, to facilitate communication with the employees, were provided
multiple responses from which to choose. Each response option reflected varying degrees
of leadership skill effectiveness and had a point value associated with its effectiveness
level (i.e. low = 1 point, moderate = 4 points, high = 7 points).
Feedback provided. Web-based software tracked and recorded the participants’
responses. Additionally, the software tracked the corresponding score for each response,
which it used to generate an overall performance score for Time 1 tasks. Upon
completing the Time 1 tasks, the computed performance scores, as well as simulation-
generated performance feedback was provided to the participants. The content of the
feedback varied based on the condition in which the participant was assigned.
Manipulation check and psychological empowerment measure. After participants
received their performance feedback, they completed a feedback specificity manipulation
check (see Appendix H). Likewise, to help assess the extent to which psychological
empowerment influences self-focused upward counterfactual thinking, participants
provided self-reported psychological empowerment data (see Appendix I) prior to the
reflection intervention.
Counterfactual reflection intervention. When participants completed the feedback
specificity manipulation check, as well as the psychological empowerment survey, the
84
simulation directed them to a counterfactual reflection intervention. The reflection
intervention protocol included a reflection prompt, and I designed the simulation such
that participants could not proceed to Time 2 tasks until they had spent at least five
minutes on the reflection activity. I subsequently analyzed the reflection content provided
by participants to assess the extent to which they engaged in self-focused upward
counterfactual thinking. I discuss the process used to analyze the reflection content in the
measurement section.
Time 2 tasks. After participants completed the written reflection activity, they
proceeded to Time 2 tasks that consisted of three social interactions (i.e. clones of Time 1
tasks). Participants’ responses and scores were recorded and tracked, using the same
process as Time 1.
Debrief. The experiment concluded with a debriefing, which was facilitated by
the simulation. The content of the debrief included a general description of the purpose
of the research which protected details that, if shared with others, could potentially prime
prospective participants. Specifically, participants were informed that the purpose of the
research was to determine if actions and thoughts taken early in the simulation influenced
subsequent behaviors.
Common Method Variance.
My data collection process mitigated the threats associated with common method
variance (CMV), the variance attributed to the method of measurement (Podsakoff,
MacKenzie, Lee, & Podsakoff, 2003). Specifically, my study included an objective
85
measure of performance. As such, the measurement of the criterion variable was
separated from the source of the predictor measurement. In the following section, I
discuss the details of each measure.
Measures
Independent Variable.
Baseline performance discrepancy. After completing Time 1 tasks, participants
received instant feedback on their Time 1 performance, which the computer simulation
software automatically generated. The feedback addressed their baseline performance
discrepancy, the difference between participants’ performance on Time 1 tasks and the
desired performance (i.e. 100%). Thus, I operationalized baseline performance
discrepancy as the extent to which Time 1 performance was below the target score, which
was computed as: the target score minus Time 1 performance score earned. To illustrate,
if a participant earned a score of 77% on Time 1 tasks, then the baseline performance
discrepancy was 23. I now describe the process for calculating their performance below.
Dependent Variable.
Performance. Recall that, throughout the interactions, participants selected their
preferred responses from provided options. As previously described, I assigned each
response varying points based on skill effectiveness (i.e. low = 1 point, moderate = 4
points, high = 7 points). Performance, the dependent variable, represented the overall
score (i.e. percentage) earned on Time 2 tasks, which was tracked and reported by the
simulation software.
86
Mediating Variable.
Self-focused upward counterfactual thinking. Self-focused upward counterfactual
thoughts are thoughts about how one could have attained a better outcome by altering his
or her behavior. To measure self-focused upward counterfactual thinking, I followed
established coding procedures (e.g. Roese & Olson, 1993, 1995; Scholl & Sassenberg,
2014). Two independent coders, blind to the subjects’ treatment condition or scores on
any of the study’s measures, qualitatively assessed the respondents’ reflections and coded
the referent focus (i.e. self-, other-, or situation- focused), as well as the direction of each
counterfactual thought. Prior to coding, the coders received training on the coding task as
well as the coding rules.
Following the training and rules provided, the coders identified whether each
thought was a counterfactual. When counterfactuals were identified, the coders proceeded
to determine whether the counterfactual referent was self-, other-, or situation-focused.
They coded counterfactual thoughts that specified alternatives to the respondents’
behavior as self-focused. In contrast, counterfactual thoughts that focused on alternatives
to another person’s (e.g. the simulated person’s) behavior were coded as other-focused.
Situation-focused thoughts included thoughts that referred to situational details or both
actors (Scholl & Sassenberg, 2014) and were coded as such.
Additionally, the coders identified the direction of counterfactual thoughts. They
coded counterfactual thoughts that specified an outcome better than the actual outcome as
an upward counterfactual. Conversely, they coded counterfactual thoughts that specified
an outcome worse than the actual outcome as a downward counterfactual.
87
The coding process resulted in the frequency of each type of counterfactual
thought. The current study examines the influence of self-focused upward counterfactual
thinking on performance. Therefore, the percentage of such thoughts relative to the
participants’ total thoughts (i.e. lines of reflection text) was the measurement focus of
interest and the operationalization of self-focused upward counterfactual thinking.
Following the process described, the coders evaluated 553 lines of text. To
determine if there was agreement between the coders on whether the 553 lines of text
contained counterfactual thoughts, I assessed Cohen’s k, which takes into account chance
agreement and is appropriate when the aim is to assess absolute agreement between two
coders (Cohen, 1960; Hallgren, 2012). The two coders agreed that 178 lines contained
counterfactual thoughts and 322 lines lacked such thoughts. There was substantial
agreement between the two coders’ judgement (Landis & Koch, 1977), k = .79 (95% CI,
.75 to .85), p < .001.
Despite substantial agreement, the coders disagreed on 53 lines of text. As such, a
third coder, whom received the same coding rules and training as the two primary coders,
evaluated the items in question to resolve coding disagreements. Using a majority
decision rule, 37 of the 53 lines were determined to contain counterfactual thoughts,
whereas 16 did not. Thus, the total number of counterfactual thoughts identified was 215.
As stated, the coders also determined the referent and direction of the
counterfactuals. Recall that, when identifying counterfactual thoughts, the two primary
coders agreed upon 178 counterfactuals. Their agreement on which type of counterfactual
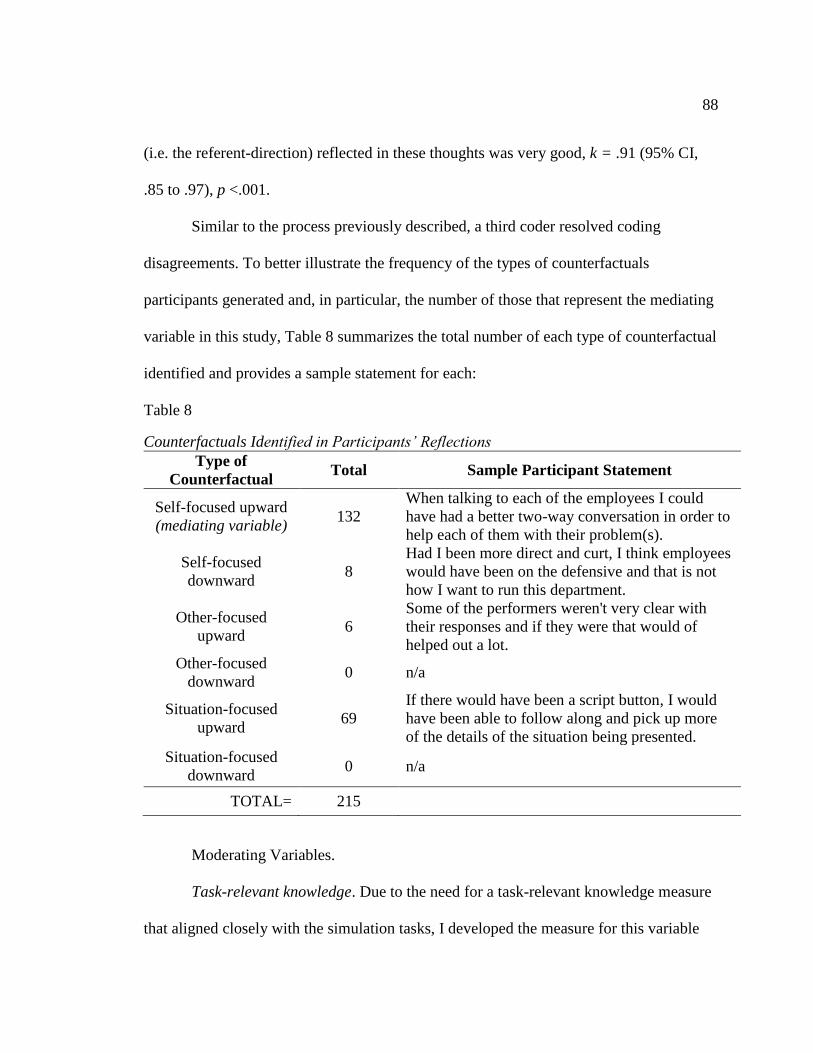
88
(i.e. the referent-direction) reflected in these thoughts was very good, k = .91 (95% CI,
.85 to .97), p <.001.
Similar to the process previously described, a third coder resolved coding
disagreements. To better illustrate the frequency of the types of counterfactuals
participants generated and, in particular, the number of those that represent the mediating
variable in this study, Table 8 summarizes the total number of each type of counterfactual
identified and provides a sample statement for each:
Table 8
Counterfactuals Identified in Participants’ Reflections
Type of
Counterfactual Total Sample Participant Statement
Self-focused upward
(mediating variable) 132
When talking to each of the employees I could
have had a better two-way conversation in order to
help each of them with their problem(s).
Self-focused
downward 8
Had I been more direct and curt, I think employees
would have been on the defensive and that is not
how I want to run this department.
Other-focused
upward 6
Some of the performers weren't very clear with
their responses and if they were that would of
helped out a lot.
Other-focused
downward 0 n/a
Situation-focused
upward 69
If there would have been a script button, I would
have been able to follow along and pick up more
of the details of the situation being presented.
Situation-focused
downward 0 n/a
TOTAL= 215
Moderating Variables.
Task-relevant knowledge. Due to the need for a task-relevant knowledge measure
that aligned closely with the simulation tasks, I developed the measure for this variable
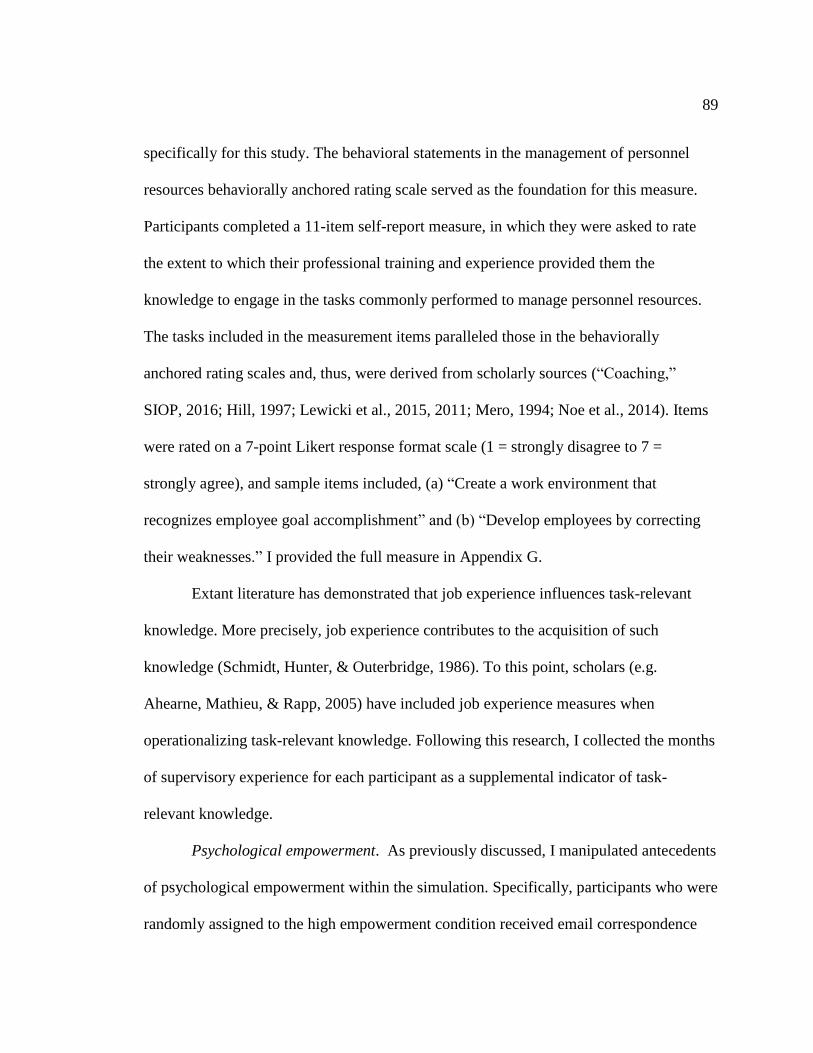
89
specifically for this study. The behavioral statements in the management of personnel
resources behaviorally anchored rating scale served as the foundation for this measure.
Participants completed a 11-item self-report measure, in which they were asked to rate
the extent to which their professional training and experience provided them the
knowledge to engage in the tasks commonly performed to manage personnel resources.
The tasks included in the measurement items paralleled those in the behaviorally
anchored rating scales and, thus, were derived from scholarly sources (“Coaching,”
SIOP, 2016; Hill, 1997; Lewicki et al., 2015, 2011; Mero, 1994; Noe et al., 2014). Items
were rated on a 7-point Likert response format scale (1 = strongly disagree to 7 =
strongly agree), and sample items included, (a) “Create a work environment that
recognizes employee goal accomplishment” and (b) “Develop employees by correcting
their weaknesses.” I provided the full measure in Appendix G.
Extant literature has demonstrated that job experience influences task-relevant
knowledge. More precisely, job experience contributes to the acquisition of such
knowledge (Schmidt, Hunter, & Outerbridge, 1986). To this point, scholars (e.g.
Ahearne, Mathieu, & Rapp, 2005) have included job experience measures when
operationalizing task-relevant knowledge. Following this research, I collected the months
of supervisory experience for each participant as a supplemental indicator of task-
relevant knowledge.
Psychological empowerment. As previously discussed, I manipulated antecedents
of psychological empowerment within the simulation. Specifically, participants who were
randomly assigned to the high empowerment condition received email correspondence
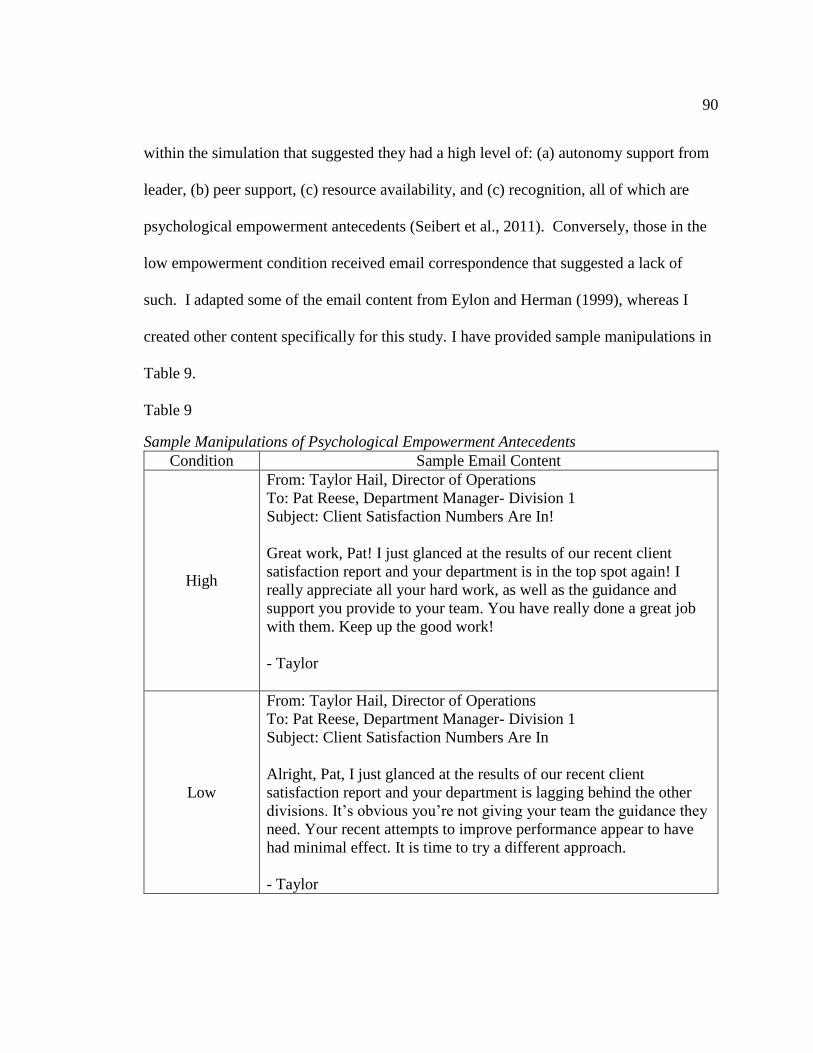
90
within the simulation that suggested they had a high level of: (a) autonomy support from
leader, (b) peer support, (c) resource availability, and (c) recognition, all of which are
psychological empowerment antecedents (Seibert et al., 2011). Conversely, those in the
low empowerment condition received email correspondence that suggested a lack of
such. I adapted some of the email content from Eylon and Herman (1999), whereas I
created other content specifically for this study. I have provided sample manipulations in
Table 9.
Table 9
Sample Manipulations of Psychological Empowerment Antecedents
Condition Sample Email Content
High
From: Taylor Hail, Director of Operations
To: Pat Reese, Department Manager- Division 1
Subject: Client Satisfaction Numbers Are In!
Great work, Pat! I just glanced at the results of our recent client
satisfaction report and your department is in the top spot again! I
really appreciate all your hard work, as well as the guidance and
support you provide to your team. You have really done a great job
with them. Keep up the good work!
- Taylor
Low
From: Taylor Hail, Director of Operations
To: Pat Reese, Department Manager- Division 1
Subject: Client Satisfaction Numbers Are In
Alright, Pat, I just glanced at the results of our recent client
satisfaction report and your department is lagging behind the other
divisions. It’s obvious you’re not giving your team the guidance they
need. Your recent attempts to improve performance appear to have
had minimal effect. It is time to try a different approach.
- Taylor
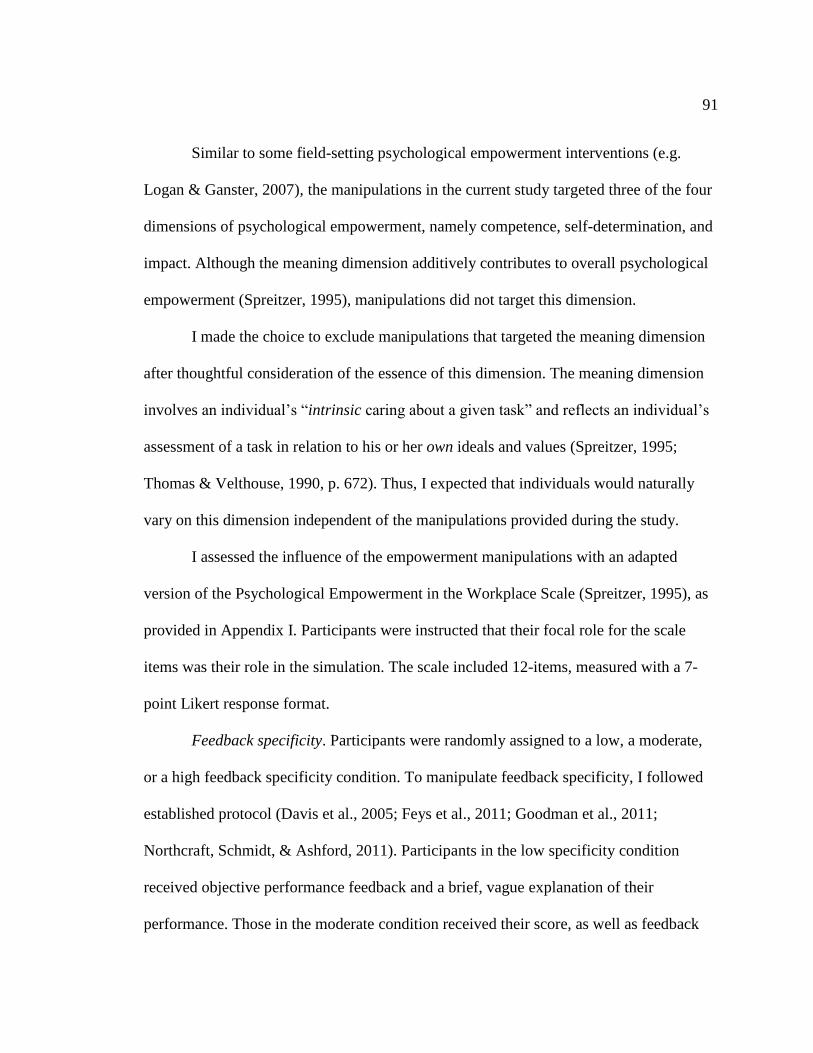
91
Similar to some field-setting psychological empowerment interventions (e.g.
Logan & Ganster, 2007), the manipulations in the current study targeted three of the four
dimensions of psychological empowerment, namely competence, self-determination, and
impact. Although the meaning dimension additively contributes to overall psychological
empowerment (Spreitzer, 1995), manipulations did not target this dimension.
I made the choice to exclude manipulations that targeted the meaning dimension
after thoughtful consideration of the essence of this dimension. The meaning dimension
involves an individual’s “intrinsic caring about a given task” and reflects an individual’s
assessment of a task in relation to his or her own ideals and values (Spreitzer, 1995;
Thomas & Velthouse, 1990, p. 672). Thus, I expected that individuals would naturally
vary on this dimension independent of the manipulations provided during the study.
I assessed the influence of the empowerment manipulations with an adapted
version of the Psychological Empowerment in the Workplace Scale (Spreitzer, 1995), as
provided in Appendix I. Participants were instructed that their focal role for the scale
items was their role in the simulation. The scale included 12-items, measured with a 7-
point Likert response format.
Feedback specificity. Participants were randomly assigned to a low, a moderate,
or a high feedback specificity condition. To manipulate feedback specificity, I followed
established protocol (Davis et al., 2005; Feys et al., 2011; Goodman et al., 2011;
Northcraft, Schmidt, & Ashford, 2011). Participants in the low specificity condition
received objective performance feedback and a brief, vague explanation of their
performance. Those in the moderate condition received their score, as well as feedback
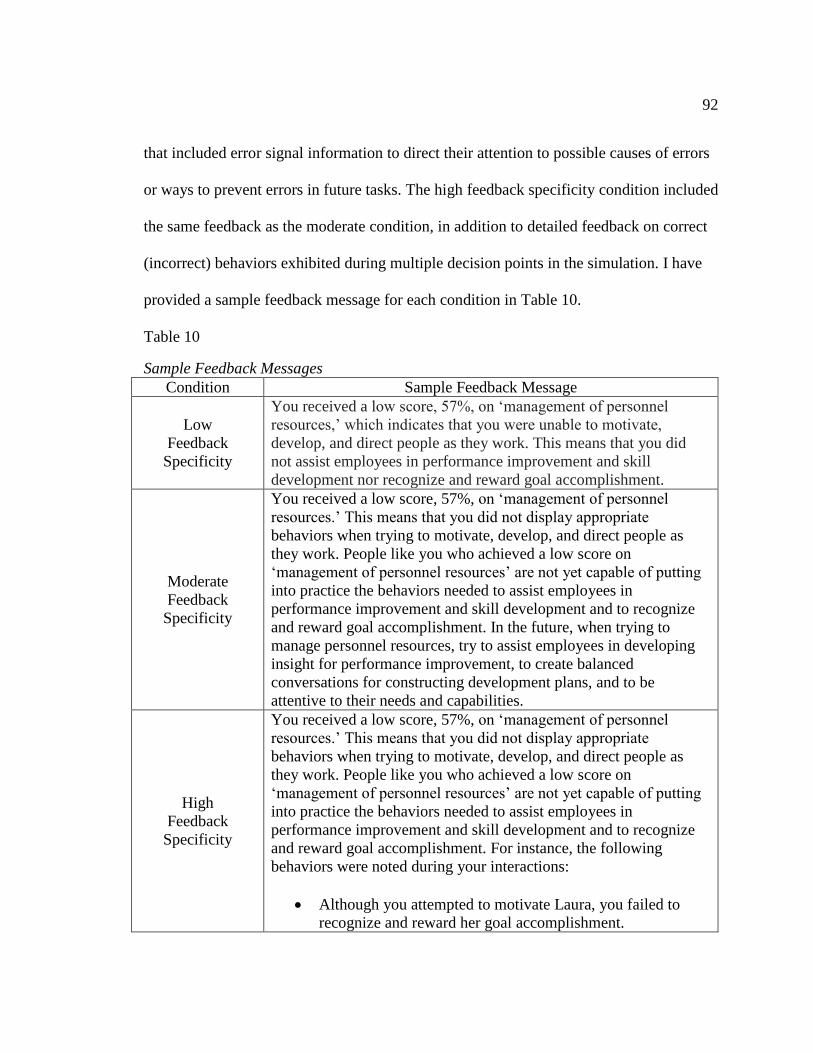
92
that included error signal information to direct their attention to possible causes of errors
or ways to prevent errors in future tasks. The high feedback specificity condition included
the same feedback as the moderate condition, in addition to detailed feedback on correct
(incorrect) behaviors exhibited during multiple decision points in the simulation. I have
provided a sample feedback message for each condition in Table 10.
Table 10
Sample Feedback Messages
Condition Sample Feedback Message
Low
Feedback
Specificity
You received a low score, 57%, on ‘management of personnel
resources,’ which indicates that you were unable to motivate,
develop, and direct people as they work. This means that you did
not assist employees in performance improvement and skill
development nor recognize and reward goal accomplishment.
Moderate
Feedback
Specificity
You received a low score, 57%, on ‘management of personnel
resources.’ This means that you did not display appropriate
behaviors when trying to motivate, develop, and direct people as
they work. People like you who achieved a low score on
‘management of personnel resources’ are not yet capable of putting
into practice the behaviors needed to assist employees in
performance improvement and skill development and to recognize
and reward goal accomplishment. In the future, when trying to
manage personnel resources, try to assist employees in developing
insight for performance improvement, to create balanced
conversations for constructing development plans, and to be
attentive to their needs and capabilities.
High
Feedback
Specificity
You received a low score, 57%, on ‘management of personnel
resources.’ This means that you did not display appropriate
behaviors when trying to motivate, develop, and direct people as
they work. People like you who achieved a low score on
‘management of personnel resources’ are not yet capable of putting
into practice the behaviors needed to assist employees in
performance improvement and skill development and to recognize
and reward goal accomplishment. For instance, the following
behaviors were noted during your interactions:
Although you attempted to motivate Laura, you failed to
recognize and reward her goal accomplishment.
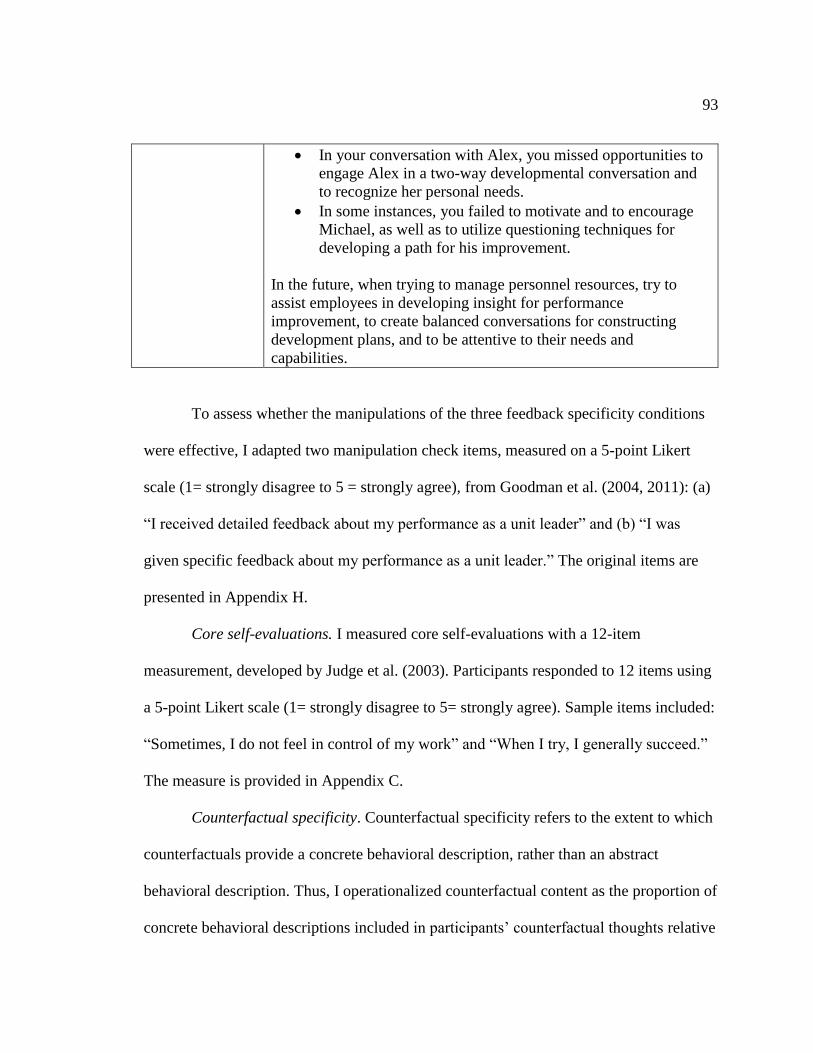
93
In your conversation with Alex, you missed opportunities to
engage Alex in a two-way developmental conversation and
to recognize her personal needs.
In some instances, you failed to motivate and to encourage
Michael, as well as to utilize questioning techniques for
developing a path for his improvement.
In the future, when trying to manage personnel resources, try to
assist employees in developing insight for performance
improvement, to create balanced conversations for constructing
development plans, and to be attentive to their needs and
capabilities.
To assess whether the manipulations of the three feedback specificity conditions
were effective, I adapted two manipulation check items, measured on a 5-point Likert
scale (1= strongly disagree to 5 = strongly agree), from Goodman et al. (2004, 2011): (a)
“I received detailed feedback about my performance as a unit leader” and (b) “I was
given specific feedback about my performance as a unit leader.” The original items are
presented in Appendix H.
Core self-evaluations. I measured core self-evaluations with a 12-item
measurement, developed by Judge et al. (2003). Participants responded to 12 items using
a 5-point Likert scale (1= strongly disagree to 5= strongly agree). Sample items included:
“Sometimes, I do not feel in control of my work” and “When I try, I generally succeed.”
The measure is provided in Appendix C.
Counterfactual specificity. Counterfactual specificity refers to the extent to which
counterfactuals provide a concrete behavioral description, rather than an abstract
behavioral description. Thus, I operationalized counterfactual content as the proportion of
concrete behavioral descriptions included in participants’ counterfactual thoughts relative
94
to their total number of counterfactual thoughts. Similar to other measurement aspects of
the counterfactuals, two independent coders, whom received training and coding rules,
qualitatively assessed the content of the counterfactuals to determine the level of
specificity reflected in each thought. The coders rated each counterfactual thought on the
extent to which it included a particular course of action (i.e. a specific behavior), using a
5-point Likert response format scale ranging from 1 (strongly disagree) to 5 (strongly
agree).
I assessed Cohen’s k (Cohen, 1960) to determine if there was agreement between
the coders on whether the counterfactual thoughts contained specific behaviors. There
was substantial agreement between the two primary coders (Landis & Koch, 1977), k =
.79 (95% CI, .75 to .85), p < .001. For each item in which there was a lack of agreement
(i.e. the coders did not code it the exact same), I calculated a mean counterfactual
specificity rating from the two ratings. When determining the proportion of specific
counterfactuals out of the total number of counterfactual thoughts, I included
counterfactuals that rated greater than or equal to four, and the final measurement value
was the ratio of high specificity counterfactuals out of the total number of thoughts,
expressed as a percentage.
Control Variables.
Individual differences. To account for relationships established in prior research, I
used control variables. Need for cognition—the tendency for individuals to engage in and
enjoy thinking (Cacioppo & Petty, 1982)—has been shown to influence the effectiveness
95
of counterfactual thinking (Petrocelli, Seta, & Seta, 2013) as well as reflection (Anseel et
al., 2009) on task performance. Thus, I controlled for this variable using an 18-item scale
(Cacioppo, Petty, & Kao, 1984). Consistent with prior research (Anseel et al., 2009),
participants responded to these items using a 7-point anchored scale (1= extremely
uncharacteristic of me and 7= extremely characteristic of me). Sample items include “I
really enjoy a task that involves coming up with new solutions to problems” and “The
notion of thinking abstractly is appealing to me.” The 18-item scale is included in
Appendix D.
I also controlled for learning goal orientation—a mindset that motivates an
individual to develop his or her competence by acquiring new skills or mastering new
situations (Dweck, 1986; Dweck & Leggett, 2000). Anseel et al. (2009) demonstrated
that written reflections are more effective for improving task performance when
individuals have a high learning orientation. Similarly, Wong, Haselhuhn, & Kray (2012)
have demonstrated that implicit beliefs—the beliefs that underlie learning goal
orientation—influence the effects of counterfactual thinking. Based on these findings, I
controlled for learning goal orientation using four items from VandeWalle, Cron, &
Slocum's (2001) scale, measured on a 7-point scale ranging from 1 (strongly disagree) to
7 (strongly agree). Sample items include, “I truly enjoy learning for the sake of learning”
and “I like classes that really force me to think hard.” The measurement items are
presented in Appendix E.
Additionally, studies have demonstrated that conscientiousness, a Big Five
(McCrae & Costa, 1987) personality trait that is exemplified by planning, organization,
96
persistence, and achievement, among other behaviors, influences learning and reflection
processes (e.g. Bidjerano & Dai, 2007; Colquitt & Simmering, 1998; DeRue et al., 2012;
Komarraju, Karau, Schmeck, & Avdic, 2011). Therefore, I controlled for
conscientiousness using six items from the NEO Personality Inventory-Revised (NEO-
PI-R) (Costa & McCrae, 1992). These items were measured on a 5-point scale (1 =
strongly disagree to 5 = strongly agree) and are provided in Appendix F.
Demographic variables. Prior research has established that multiple demographic
variables can impact learning processes (e.g. Cassara, 1990; Joy & Kolb, 2009; Maurer,
2001; Severiens & ten Dam, 1994). As a result, and consistent with DeRue et al. (2012)
as well as DeRue & Wellman (2009), I controlled for international status (1 = born
outside the U.S., 0 = born in the U.S.), as well as age and gender (0 = male, 1 = female).
Additionally, I controlled for total amount of work experience, measured as number of
months of full-time experience.
97
CHAPTER FOUR: RESULTS
In this chapter, I provide a comprehensive review of the data and the results for
each analysis I conducted to validate the simulation and to test the hypotheses.
Accordingly, I have organized the details in this chapter in four sections. In the first
section, I provide details pertaining to the simulation validation process, which includes
the results from three expert rater evaluations as well as my pilot study. The second
section includes an evaluation of the measurement model, followed by the results of the
hypotheses testing. In the final section, I provide a summary of results, and I provide a
detailed discussion of the findings subsequently in Chapter 5.
Simulation Validation: Rating Tasks and Pilot Study
Cloning Task.
Recall that I followed an established protocol by Lievens & Anseel (2009) when
examining the effectiveness of the incident isomorphic cloning procedure. Five
independent raters (40% female, 60% male) participated in the rating process. The raters
had an average work experience of 20 years (SD= 9.03) and an average of 12 years (SD=
7.87) experience using behaviorally anchored rating scales or similar behavioral
guidelines to rate individual performance. Sixty-percent of the raters had a masters or
terminal degree.
98
To determine the degree to which the raters provided consistency in their ratings
of the 261 cloned sets, I assessed inter-rater reliability with a two-way mixed,
consistency, average measures intra-class correlation (ICC). This is an appropriate
measure for fully crossed designs in which the researcher seeks to determine if the raters
provided scores that are similar in rank order and when the average of the ratings is of
focal interest (Hallgren, 2012; LeBreton & Senter, 2008; McGraw & Wong, 1996). Based
on the assessment for the current rating task, the resulting ICC was in the excellent range,
ICC= .84 (95% CI, .81 to .87), p < .001 (Cicchetti, 1994). The ICC demonstrated that the
raters had a high level of agreement and rated the cloned items similarly (LeBreton &
Senter, 2008).
The average similarity rating across all cloned items was 6.52 (SD=.48). The
results indicated that the simulation contained six cloned interactions (three cloned
negotiation interactions and three cloned management of personnel resources
interactions). As such, the rating process provided preliminary results that the cloned
interactions were suitable for use in the data collection process. Subsequently, I
conducted a pilot study to confirm whether the two task rounds were comparable as
viewed by non-expert participants, and I provide those details in a later section.
Participant Response Options Rating Tasks.
Time 1 participant response options. Five raters (60% female, 40% male)
independently evaluated each set of response options presented in Time 1 interactions.
99
The raters had an average work experience of 21.8 years (SD= 5.42), an average of 6
years (SD= 4.42) experience using behaviorally anchored rating scales or similar
behavioral guidelines to rate individuals’ performance, and were scholars and industry
professionals.
Participant response options were comprised of three levels of intended skill
proficiency: low (n= 280), moderate (n= 275), and high (n= 275). Due to an error on the
rater data-collection spreadsheet, there was one moderate- and one high-skill proficiency
response option missing from the data. Nevertheless, given the high number of
observations per cell and the limited amount of missing data, I determined that the
missing values would not materially affect the results (Hair et al., 2010). There were no
outliers, as assessed by boxplot, and the data were normally distributed, as assessed by
histograms and values of skewness and kurtosis. However, Levene’s test of homogeneity
of variances indicated that homogeneity of variances was violated (p = .046). As such,
Welch’s F (Welch, 1951) and Games-Howell post hoc analyses were conducted to
correct for this issue (Field, 2013; Hair et al., 2010)
Specifically, I conducted a one-way Welch ANOVA to determine whether the
level of skill proficiency reflected in participant response options was different for each
intended proficiency level. The mean expert rating for participant response options was
statistically significantly different among the three intended skill proficiency groups
Welch’s F (2, 549.24) = 550.40, p <.001. The effect size, calculated using eta squared,
was .56. The expert rating of skill proficiency reflected in participant response options
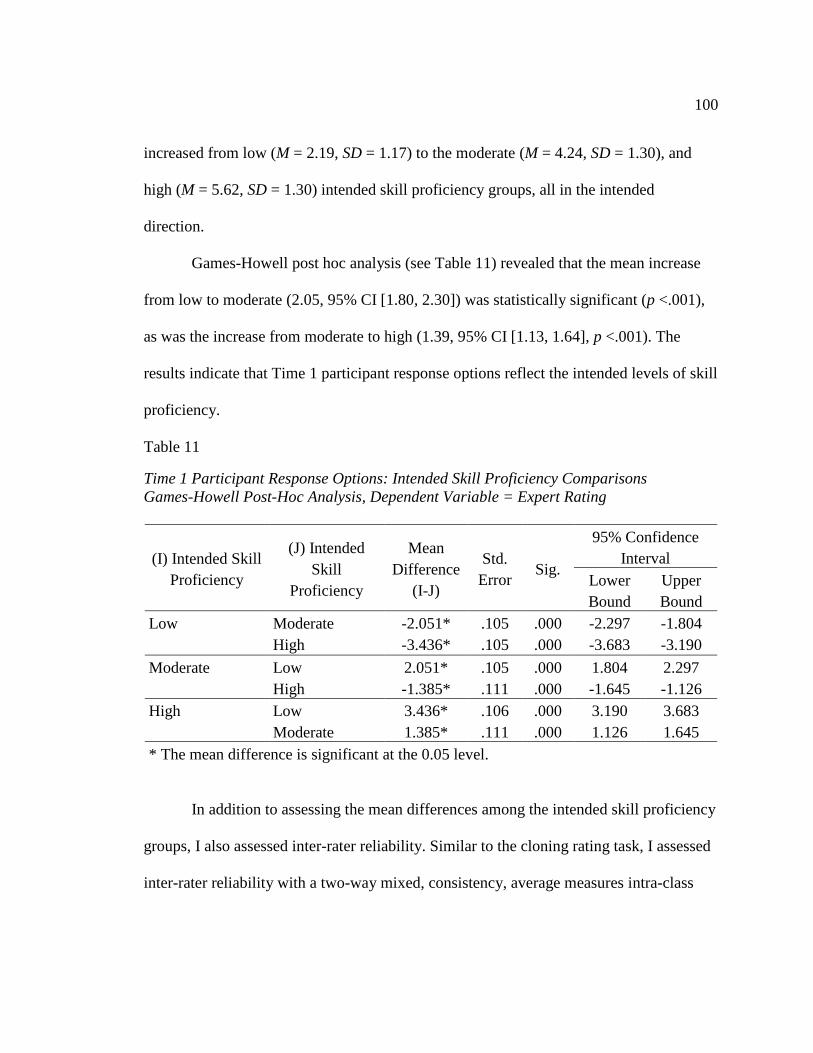
100
increased from low (M = 2.19, SD = 1.17) to the moderate (M = 4.24, SD = 1.30), and
high (M = 5.62, SD = 1.30) intended skill proficiency groups, all in the intended
direction.
Games-Howell post hoc analysis (see Table 11) revealed that the mean increase
from low to moderate (2.05, 95% CI [1.80, 2.30]) was statistically significant (p <.001),
as was the increase from moderate to high (1.39, 95% CI [1.13, 1.64], p <.001). The
results indicate that Time 1 participant response options reflect the intended levels of skill
proficiency.
Table 11
Time 1 Participant Response Options: Intended Skill Proficiency Comparisons
Games-Howell Post-Hoc Analysis, Dependent Variable = Expert Rating
(I) Intended Skill
Proficiency
(J) Intended
Skill
Proficiency
Mean
Difference
(I-J)
Std.
Error Sig.
95% Confidence
Interval
Lower
Bound
Upper
Bound
Low Moderate -2.051* .105 .000 -2.297 -1.804
High -3.436* .105 .000 -3.683 -3.190
Moderate Low 2.051* .105 .000 1.804 2.297
High -1.385* .111 .000 -1.645 -1.126
High Low 3.436* .106 .000 3.190 3.683
Moderate 1.385* .111 .000 1.126 1.645
* The mean difference is significant at the 0.05 level.
In addition to assessing the mean differences among the intended skill proficiency
groups, I also assessed inter-rater reliability. Similar to the cloning rating task, I assessed
inter-rater reliability with a two-way mixed, consistency, average measures intra-class
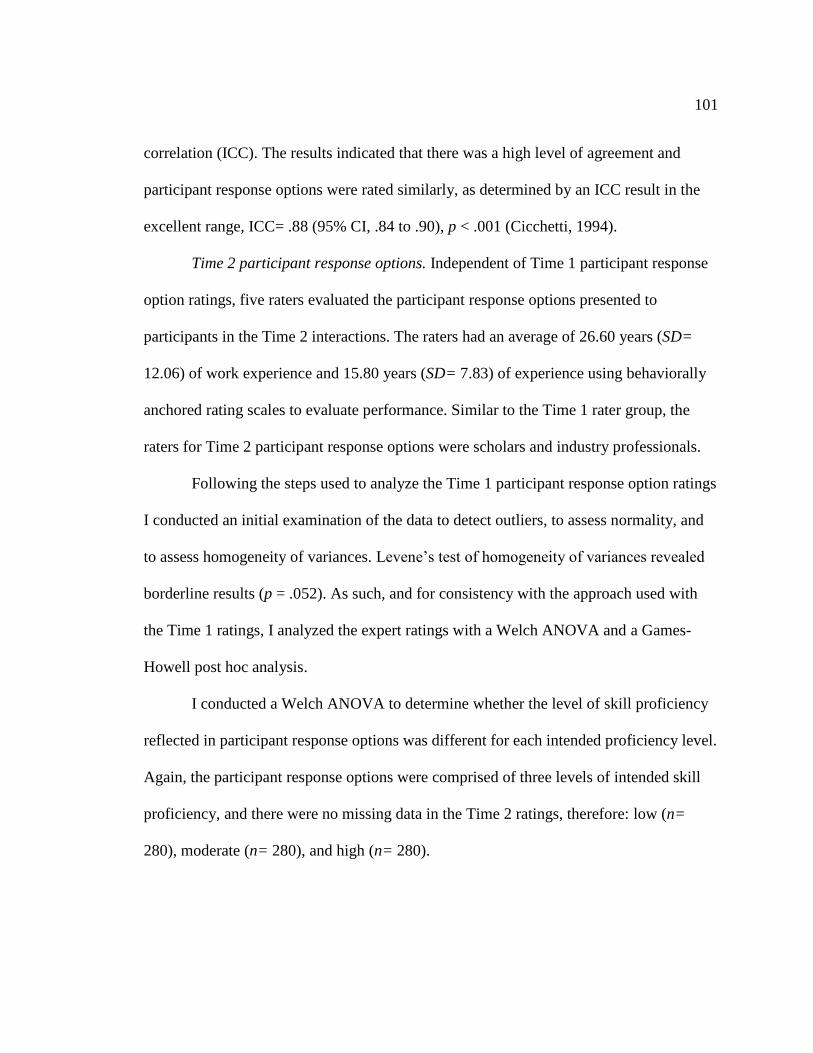
101
correlation (ICC). The results indicated that there was a high level of agreement and
participant response options were rated similarly, as determined by an ICC result in the
excellent range, ICC= .88 (95% CI, .84 to .90), p < .001 (Cicchetti, 1994).
Time 2 participant response options. Independent of Time 1 participant response
option ratings, five raters evaluated the participant response options presented to
participants in the Time 2 interactions. The raters had an average of 26.60 years (SD=
12.06) of work experience and 15.80 years (SD= 7.83) of experience using behaviorally
anchored rating scales to evaluate performance. Similar to the Time 1 rater group, the
raters for Time 2 participant response options were scholars and industry professionals.
Following the steps used to analyze the Time 1 participant response option ratings
I conducted an initial examination of the data to detect outliers, to assess normality, and
to assess homogeneity of variances. Levene’s test of homogeneity of variances revealed
borderline results (p = .052). As such, and for consistency with the approach used with
the Time 1 ratings, I analyzed the expert ratings with a Welch ANOVA and a Games-
Howell post hoc analysis.
I conducted a Welch ANOVA to determine whether the level of skill proficiency
reflected in participant response options was different for each intended proficiency level.
Again, the participant response options were comprised of three levels of intended skill
proficiency, and there were no missing data in the Time 2 ratings, therefore: low (n=
280), moderate (n= 280), and high (n= 280).
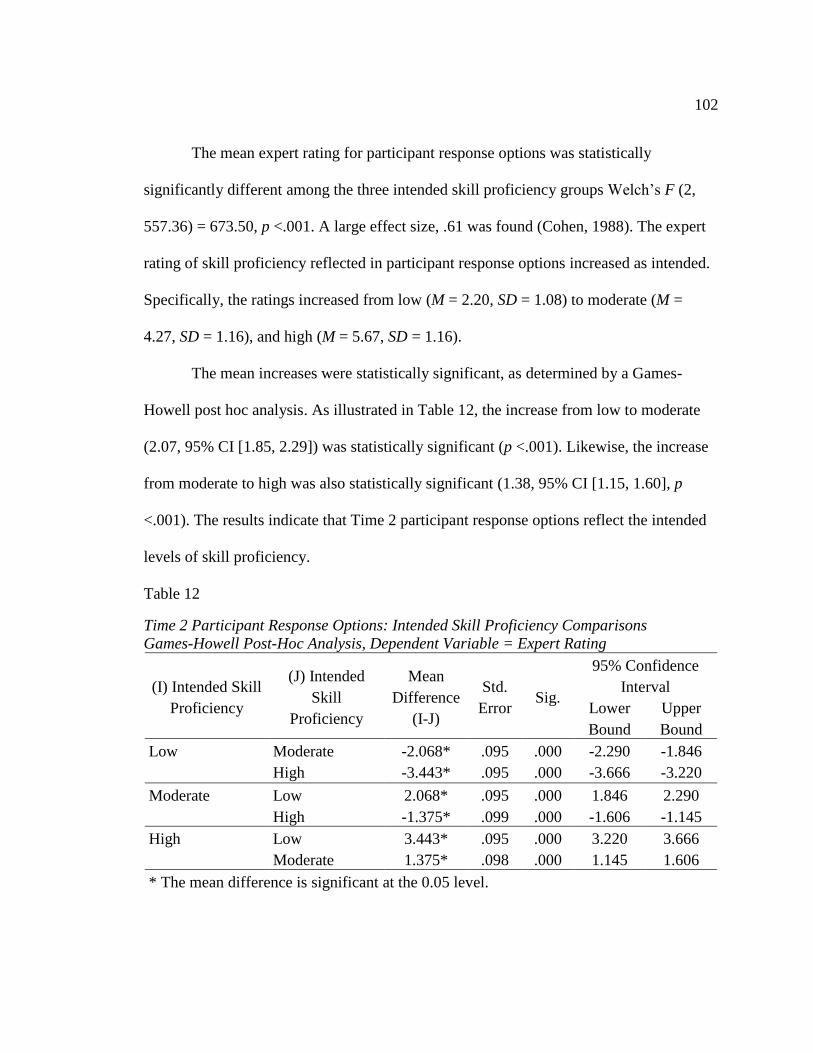
102
The mean expert rating for participant response options was statistically
significantly different among the three intended skill proficiency groups Welch’s F (2,
557.36) = 673.50, p <.001. A large effect size, .61 was found (Cohen, 1988). The expert
rating of skill proficiency reflected in participant response options increased as intended.
Specifically, the ratings increased from low (M = 2.20, SD = 1.08) to moderate (M =
4.27, SD = 1.16), and high (M = 5.67, SD = 1.16).
The mean increases were statistically significant, as determined by a Games-
Howell post hoc analysis. As illustrated in Table 12, the increase from low to moderate
(2.07, 95% CI [1.85, 2.29]) was statistically significant (p <.001). Likewise, the increase
from moderate to high was also statistically significant (1.38, 95% CI [1.15, 1.60], p
<.001). The results indicate that Time 2 participant response options reflect the intended
levels of skill proficiency.
Table 12
Time 2 Participant Response Options: Intended Skill Proficiency Comparisons
Games-Howell Post-Hoc Analysis, Dependent Variable = Expert Rating
(I) Intended Skill
Proficiency
(J) Intended
Skill
Proficiency
Mean
Difference
(I-J)
Std.
Error Sig.
95% Confidence
Interval
Lower
Bound
Upper
Bound
Low Moderate -2.068* .095 .000 -2.290 -1.846
High -3.443* .095 .000 -3.666 -3.220
Moderate Low 2.068* .095 .000 1.846 2.290
High -1.375* .099 .000 -1.606 -1.145
High Low 3.443* .095 .000 3.220 3.666
Moderate 1.375* .098 .000 1.145 1.606
* The mean difference is significant at the 0.05 level.
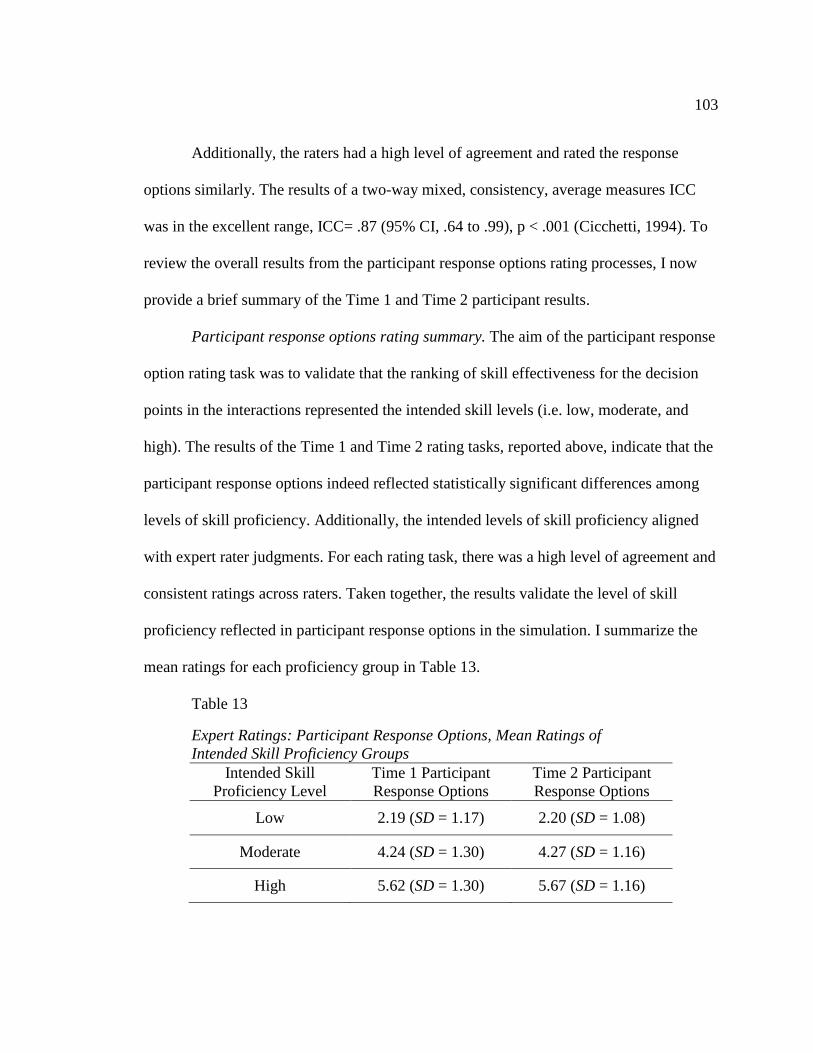
103
Additionally, the raters had a high level of agreement and rated the response
options similarly. The results of a two-way mixed, consistency, average measures ICC
was in the excellent range, ICC= .87 (95% CI, .64 to .99), p < .001 (Cicchetti, 1994). To
review the overall results from the participant response options rating processes, I now
provide a brief summary of the Time 1 and Time 2 participant results.
Participant response options rating summary. The aim of the participant response
option rating task was to validate that the ranking of skill effectiveness for the decision
points in the interactions represented the intended skill levels (i.e. low, moderate, and
high). The results of the Time 1 and Time 2 rating tasks, reported above, indicate that the
participant response options indeed reflected statistically significant differences among
levels of skill proficiency. Additionally, the intended levels of skill proficiency aligned
with expert rater judgments. For each rating task, there was a high level of agreement and
consistent ratings across raters. Taken together, the results validate the level of skill
proficiency reflected in participant response options in the simulation. I summarize the
mean ratings for each proficiency group in Table 13.
Table 13
Expert Ratings: Participant Response Options, Mean Ratings of
Intended Skill Proficiency Groups
Intended Skill
Proficiency Level
Time 1 Participant
Response Options
Time 2 Participant
Response Options
Low 2.19 (SD = 1.17) 2.20 (SD = 1.08)
Moderate 4.24 (SD = 1.30) 4.27 (SD = 1.16)
High 5.62 (SD = 1.30) 5.67 (SD = 1.16)
104
Social Interactions Rating Task.
To assess the extent to which each social interaction captured its intended skill
domain, thirty raters evaluated the content of each social interaction. The raters (63%
female, 37% male) had an average of 24.53 years (SD = 9.94) of total work experience,
18.80 years (SD = 9.94) experience in a position that required negotiation skills, 15.03
years (SD = 9.01) experience in a position that required management of personnel
resource skills, and 8.13 years (SD = 7.10) experience using behaviorally anchored rating
scales to evaluate individuals’ performance. The majority (83%) held, at least, a masters
degree and 57% had doctoral level training.
Recall that I designed six interactions to assess participants’ management of
personnel resources skills and six to assess their negotiation skills. Thus, the raters
evaluated the content of 12 interactions. For each interaction, a paired-samples t-test was
used to determine whether there was a statistically significant mean difference between
the interaction’s rating on the extent to which it depicted a situation in which the manager
displayed negotiation skills compared to the extent to which it depicted a situation in
which the manager displayed management of personnel resources skills. This was an
appropriate analysis to assess how a single target, in this case each interaction, rated in
terms of responses to two different questions (Pallant, 2013). Prior to conducting each
analysis, I inspected the data to ensure the basic assumptions of t-tests had been met, as
well as the paired-samples t-test assumption of normal distribution of the difference
105
between the two scores for each interaction. I provide the results of each analysis below,
and I have organized the interactions by intended skill domain.
Management of personnel resources interactions. The “Alex” interaction rated
higher on management of personnel resources (M = 3.87, SD = 1.11) compared to
negotiation (M = 1.90, SD = 1.00), a statistically significant mean increase of 1.97, 95%
CI [1.32, 2.61], t (29) = 6.22, p <.001, d = 1.14. Thus, the interaction reflected the
intended skill domain.
Likewise, the “Julie” interaction rated higher on management of personnel
resources (M = 4.43, SD = .67) compared to negotiation (M = 2.07, SD = 1.31), a
statistically significant mean increase of 2.67, 95% CI [1.82, 2.91], t (29) = 8.80, p <.001,
d = 1.61. Again, a large effect was found (Cohen, 1988), and the interaction reflected the
posited skill domain.
As posited, the “Chris” interaction rated higher on management of personnel
resources (M = 4.40, SD = .81) compared to negotiation (M = 2.30, SD = 1.26), a
statistically significant mean increase of 2.10, 95% CI [1.48, 2.72], t (29) = 6.90, p <.001,
d = 1.26. Thus, the results indicate that the “Chris” interaction reflected the intended skill
domain.
I also designed the “Michael” interaction to assess management of personnel
resources skills. As intended, the interaction rated higher on management of personnel
resources (M = 4.40, SD = .72) compared to negotiation (M = 2.37, SD = 1.27), a
106
statistically significant mean increase of 2.03, 95% CI [1.43, 2.64], t (29) = 6.84, p <.001,
d = 1.25. Thus, the content of the interaction aligned with its intended skill domain.
The “Laura” interaction rated higher on management of personnel resources (M =
4.50, SD = .82) compared to negotiation (M = 2.40, SD = 1.22), a statistically significant
mean increase of 1.86, 95% CI [1.40, 2.80], t (29) = 6.17, p <.001. The results indicated a
large effect size, 1.13 (Cohen, 1988), and the interaction reflected the intended skill
domain.
Lastly, the “Sam” interaction also rated higher on management of personnel
resources (M = 4.30, SD = .75) compared to negotiation (M = 1.36, SD = 1.10), a
statistically significant mean increase of 1.93, 95% CI [1.40, 2.51], t (29) = 6.92, p <.001.
Again, I found a large effect size, 1.26 (Cohen, 1988) and determined that the interaction
reflected the intended skill domain.
Negotiation interactions. I designed the “Joe” interaction to assess participants’
negotiation skills. As intended, the interaction rated higher on negotiation (M = 4.13, SD
= .86) compared to management of personnel resources (M = 1.93, SD = 1.08), a
statistically significant mean increase of 1.56, 95% CI [1.62, 2.79], t (29) = 7.71, p <.001,
d= 1.41. Thus, the content of the interaction aligned with the posited skill domain.
Similarly, the “Kevin” interaction also captured the intended skill domain.
Specifically, the interaction rated higher on negotiation (M = 4.20, SD = 1.06) compared
to management of personnel resources (M = 1.73, SD = 1.11), a statistically significant
107
mean increase of 2.47, 95% CI [1.74, 3.20], t (29) = 6.95, p <.001. The results indicated a
large effect size, d= 1.27 (Cohen, 1988).
I also designed the “Joyce” interaction to assess participants’ negotiation skills.
The interaction rated higher on negotiation (M = 4.70, SD = .47) compared to
management of personnel resources (M = 2.00, SD = 1.05), a statistically significant
mean increase of 2.70, 95% CI [2.23, 3.17], t (29) = 11.70, p <.001, d= 2.14. Thus, the
content of the interaction aligned with the posited skill domain.
Likewise, the “Ryan” interaction rated higher on negotiation (M = 4.27, SD = .69)
compared to management of personnel resources (M = 2.83, SD = 1.26), a statistically
significant mean increase of 1.43, 95% CI [.93, 1.94], t (29) = 5.79, p <.001, d= 1.06.
Thus, the results indicated that the content of the interaction reflected the intended skill
domain.
I designed the “John” interaction to reflect an interaction that would facilitate the
assessment of participants’ negotiation skills. Contrary to my design intent, the
interaction rated higher on management of personnel resources (M = 3.40, SD = 1.32)
compared to negotiation (M = 3.33, SD = 1.45). However, the mean difference was not
statistically significant, .67, 95% CI [-.85, .91], t (29) = .15, p = .88. Thus, the expert
raters did not perceive the interaction as one that distinctly reflected the negotiation skill
domain.
The “Dylan” interaction, the last negotiation interaction evaluated, was rated
higher on negotiation (M = 3.47, SD = 1.28) compared to management of personnel
108
resources (M = 3.10, SD = 1.21). Nevertheless, the mean difference was not statistically
significant, .38, 95% CI [-.42, 1.16], t (29) = .95, p = .35. Thus, similar to its clone, the
“John” interaction, the “Dylan” interaction did not distinctly reflect the negotiation skill
domain.
Social interactions rating task summary. The social interactions rating task
assessed the extent to which the posited skill domain reflected in each social interaction.
The results indicated that all six management of personnel resources interactions
successfully captured the intended skill domain, whereas four of the six negotiation
interactions successfully captured the intended skill domain. Two interactions, the “John”
and “Dylan” clones, did not distinctly reflect the intended skill, negotiation.
Recall that, in addition to the ratings discussed in the preceding sections, the
expert raters also made a subjective decision as to which skill primarily reflected in the
manager’s statements (i.e. the participant role in the simulation). The results were
consistent with the findings above. The majority classification for each aligned with the
intended skill domain, with the exception of two negotiation interactions. As such, I
retained the six management of personnel resources interactions and advanced to the
cloning effectiveness pilot study.
Cloning Effectiveness Pilot Study.
To assess whether mean performance on the two task rounds was comparable as
viewed by non-expert participants, 62 participants completed both tasks (Time 1 and
109
Time 2 interactions) in a counterbalanced order. Initial inspection of the data revealed
four cases with extreme scores more than two standard deviations below mean
performance and completion times that suggested that the participants may have “clicked
through” the simulation without weighing the various response options at each decision
point. As such, I chose to remove those cases. Thus, the final sample included 58 usable
responses for the two groups: normal (n = 28) and reversed (n = 30). The sample was
59% female, had a mean age of 20.67 years (SD = 1.25), and had a mean work
experience of 2.23 years (SD = 2.21).
On average, participants completed the simulation in 40.05 minutes (SD = 11.78).
The mean performance scores for the two task versions, presented to participants in a
counterbalanced order, are reported in Table 14. I analyzed the performance data with a 2
(order: normal- vs. reversed-order) X 2 (task: Time 1 vs. Time 2) mixed ANOVA, with
repeated measures on the last factor and performance as the dependent variable. Results
showed neither an interaction effect between task and order, Wilks’ Lamba = 1.00, F (1,
56) = .005, p = .95, nor a significant main effect of task, Wilks’ Lamba = .97, F (1, 56) =
.208, p = .65. The results indicated adequate alternate-form reliability at the level of task
version and absence of practice or fatigue effects. As such, I determined that the
simulation was ready for use in the hypothesis test study.
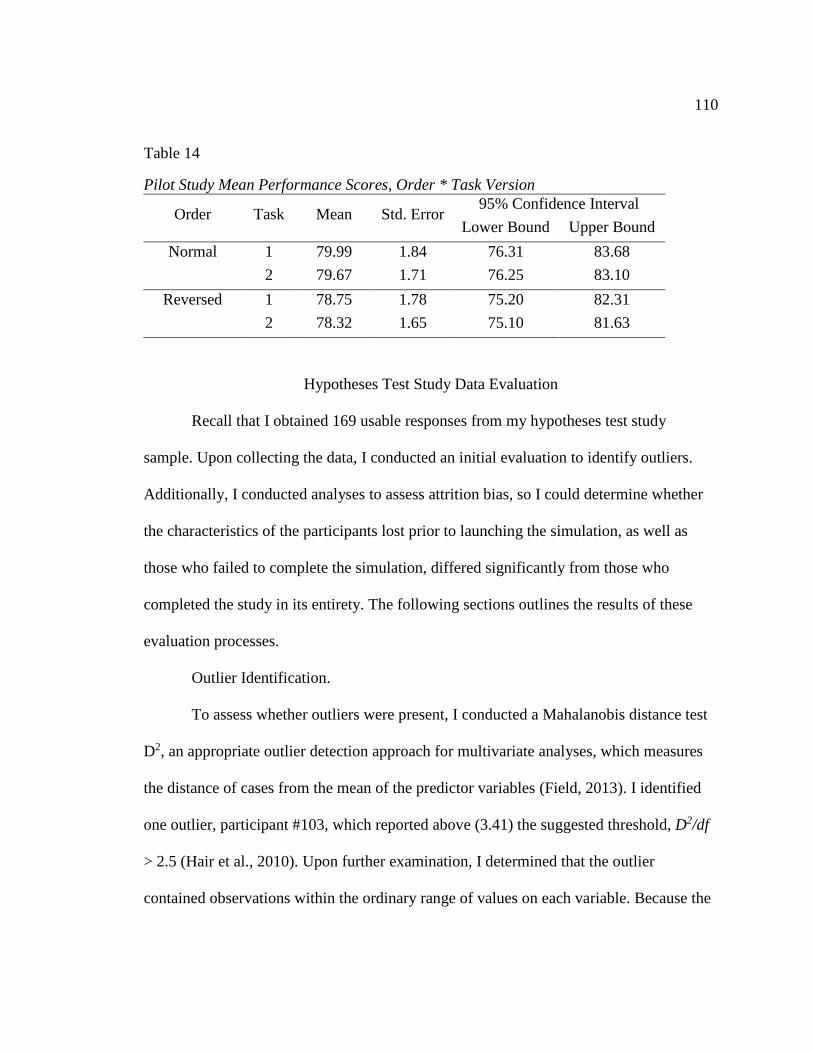
110
Table 14
Pilot Study Mean Performance Scores, Order * Task Version
Order Task Mean Std. Error 95% Confidence Interval
Lower Bound Upper Bound
Normal 1 79.99 1.84 76.31 83.68
2 79.67 1.71 76.25 83.10
Reversed 1 78.75 1.78 75.20 82.31
2 78.32 1.65 75.10 81.63
Hypotheses Test Study Data Evaluation
Recall that I obtained 169 usable responses from my hypotheses test study
sample. Upon collecting the data, I conducted an initial evaluation to identify outliers.
Additionally, I conducted analyses to assess attrition bias, so I could determine whether
the characteristics of the participants lost prior to launching the simulation, as well as
those who failed to complete the simulation, differed significantly from those who
completed the study in its entirety. The following sections outlines the results of these
evaluation processes.
Outlier Identification.
To assess whether outliers were present, I conducted a Mahalanobis distance test
D2, an appropriate outlier detection approach for multivariate analyses, which measures
the distance of cases from the mean of the predictor variables (Field, 2013). I identified
one outlier, participant #103, which reported above (3.41) the suggested threshold, D2/df
> 2.5 (Hair et al., 2010). Upon further examination, I determined that the outlier
contained observations within the ordinary range of values on each variable. Because the
111
participant did not appear to be particularly high or low on any variables, rather just
unique in combination, I chose to retain the case so as not to reduce the sample size
further, nor to ignore a potentially valid element of the population (Hair et al., 2010).
Attrition Bias.
Due to the number of participants, 8 graduate- and 56 undergraduate students,
who either elected to drop out or were unable to complete the simulation because of
technical complications, it was important to assess whether those who dropped out were
systematically different from those in the final sample. To this end, I conducted
independent sample t-tests to assess differences in age, work experience, and supervisory
experience between those in the final sample and those who did not complete the study in
its entirety. While it was clear that some participants (n = 34) opted not to proceed to the
simulation after completing the initial survey measures, recall that there was reason to
believe that other participants, whose attrition occurred after launching the simulation (n
= 30), may have failed to complete the study due to technical issues. As such, I conducted
separate analyses to account for two types of attrition: 1) attrition prior to launching the
simulation and 2) attrition after launching the simulation.
I reported the mean age for the final sample as well as the two attrition groups in
Table 16. An independent-samples t-test revealed there was no significant difference in
age between those in the final sample and those who dropped out during the simulation
(t = 1.87, p = .07). In contrast, the difference in age between the final sample and that of
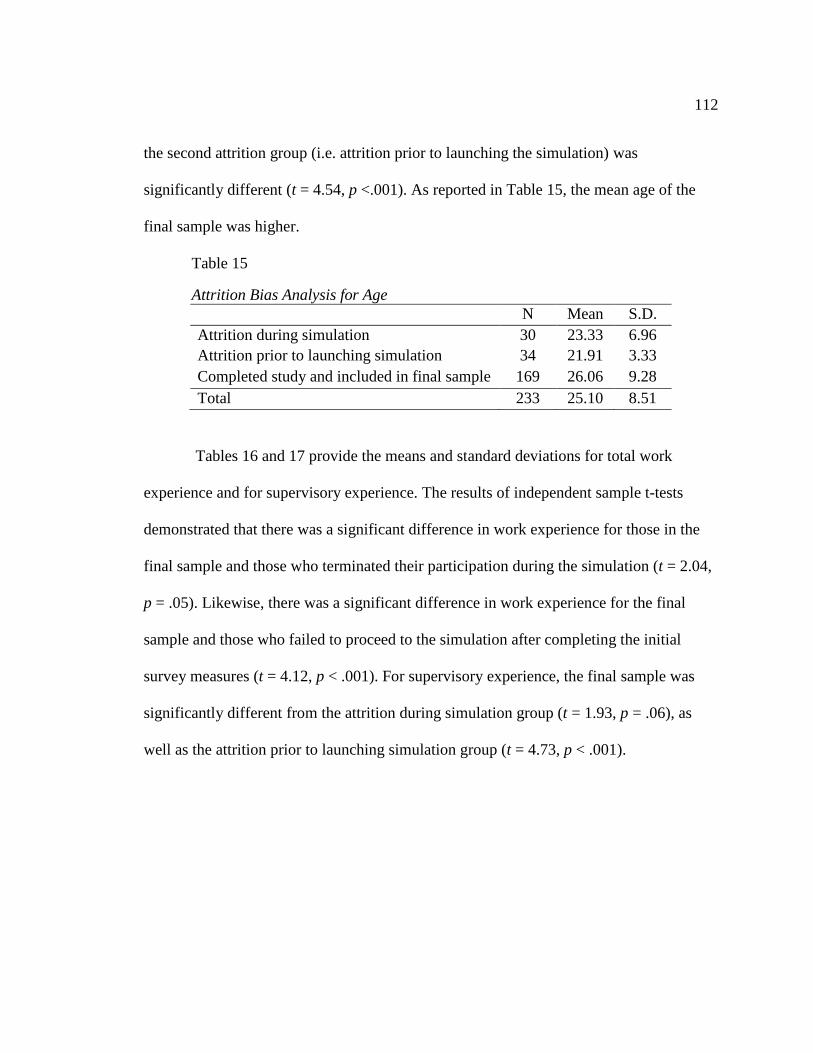
112
the second attrition group (i.e. attrition prior to launching the simulation) was
significantly different (t = 4.54, p <.001). As reported in Table 15, the mean age of the
final sample was higher.
Table 15
Attrition Bias Analysis for Age
N Mean S.D.
Attrition during simulation 30 23.33 6.96
Attrition prior to launching simulation
Launch
34 21.91 3.33
Completed study and included in final sample 169 26.06 9.28
Total 233 25.10 8.51
Tables 16 and 17 provide the means and standard deviations for total work
experience and for supervisory experience. The results of independent sample t-tests
demonstrated that there was a significant difference in work experience for those in the
final sample and those who terminated their participation during the simulation (t = 2.04,
p = .05). Likewise, there was a significant difference in work experience for the final
sample and those who failed to proceed to the simulation after completing the initial
survey measures (t = 4.12, p < .001). For supervisory experience, the final sample was
significantly different from the attrition during simulation group (t = 1.93, p = .06), as
well as the attrition prior to launching simulation group (t = 4.73, p < .001).
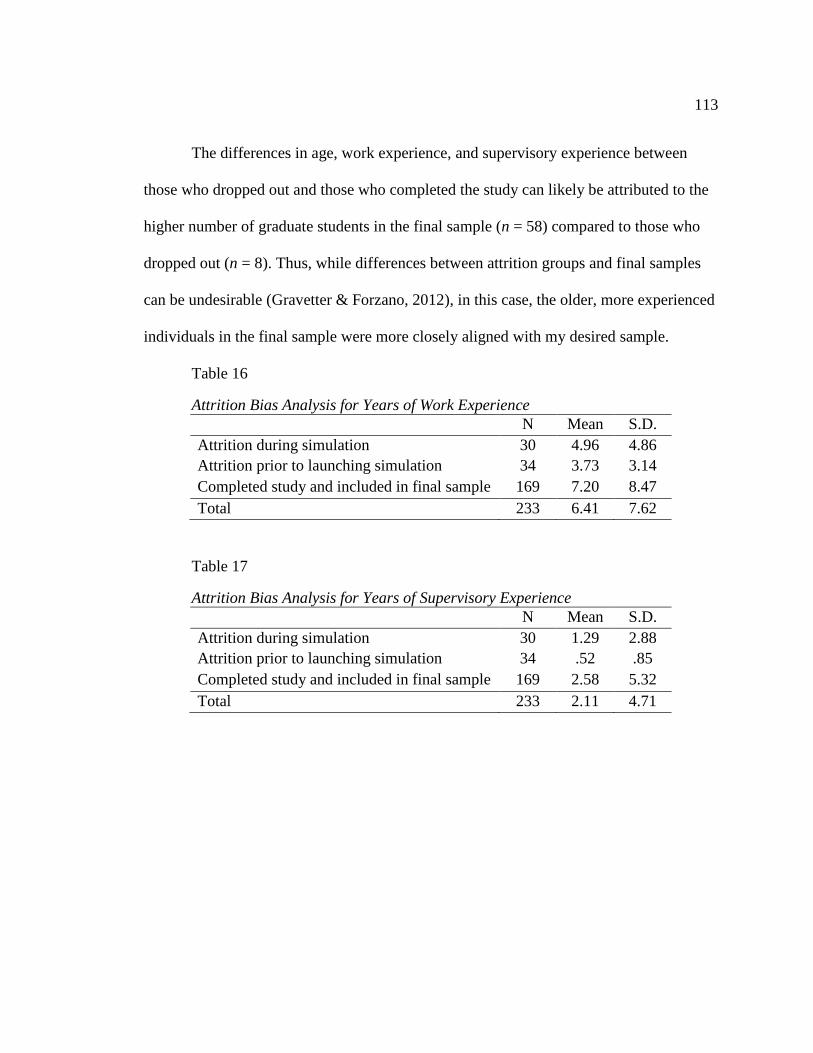
113
The differences in age, work experience, and supervisory experience between
those who dropped out and those who completed the study can likely be attributed to the
higher number of graduate students in the final sample (n = 58) compared to those who
dropped out (n = 8). Thus, while differences between attrition groups and final samples
can be undesirable (Gravetter & Forzano, 2012), in this case, the older, more experienced
individuals in the final sample were more closely aligned with my desired sample.
Table 16
Attrition Bias Analysis for Years of Work Experience
N Mean S.D.
Attrition during simulation 30 4.96 4.86
Attrition prior to launching simulation
Launch
34 3.73 3.14
Completed study and included in final sample 169 7.20 8.47
Total 233 6.41 7.62
Table 17
Attrition Bias Analysis for Years of Supervisory Experience
N Mean S.D.
Attrition during simulation 30 1.29 2.88
Attrition prior to launching simulation
Launch
34 .52 .85
Completed study and included in final sample 169 2.58 5.32
Total 233 2.11 4.71
114
Confirmatory Factor Analysis
Prior to testing the hypotheses, I conducted a confirmatory factor analysis (CFA)
to test measurement model validity. This examined the alignment among the data and the
theoretical specification of factors (Hair et al., 2010). I performed the CFA using the IBM
SPSS® AMOS TM version 22.0.0 software package. In the following sections, I report the
steps I took to assess the initial measurement model as well as to improve model fit.
Subsequently, I report the details of the final measurement model, as well as construct
reliability and convergent and discriminant validity.
Initial Measurement Model.
Recall from Chapter 3, my study includes two latent constructs, two direct
measures calculated by the simulation software, two direct measures from coding
processes, and one experimentally manipulated categorical variable. Because
confirmatory factor analysis assesses the extent to which measured variables represent
latent constructs, only the three latent constructs in my research model were included in
the CFA (Hair et al., 2010), namely psychological empowerment, task-relevant
knowledge, and core self-evaluations. Each construct exceeded recommendations for a
minimum of three to four indicators (Byrne, 2013; Hair et al., 2010). Specifically, each
consisted of multiple indicators, including 12 for psychological empowerment, 11 for
task-relevant knowledge, and 12 for core self-evaluations. To illustrate, an image of the
initial measurement model is provided in Figure 7, Initial Measurement Model.
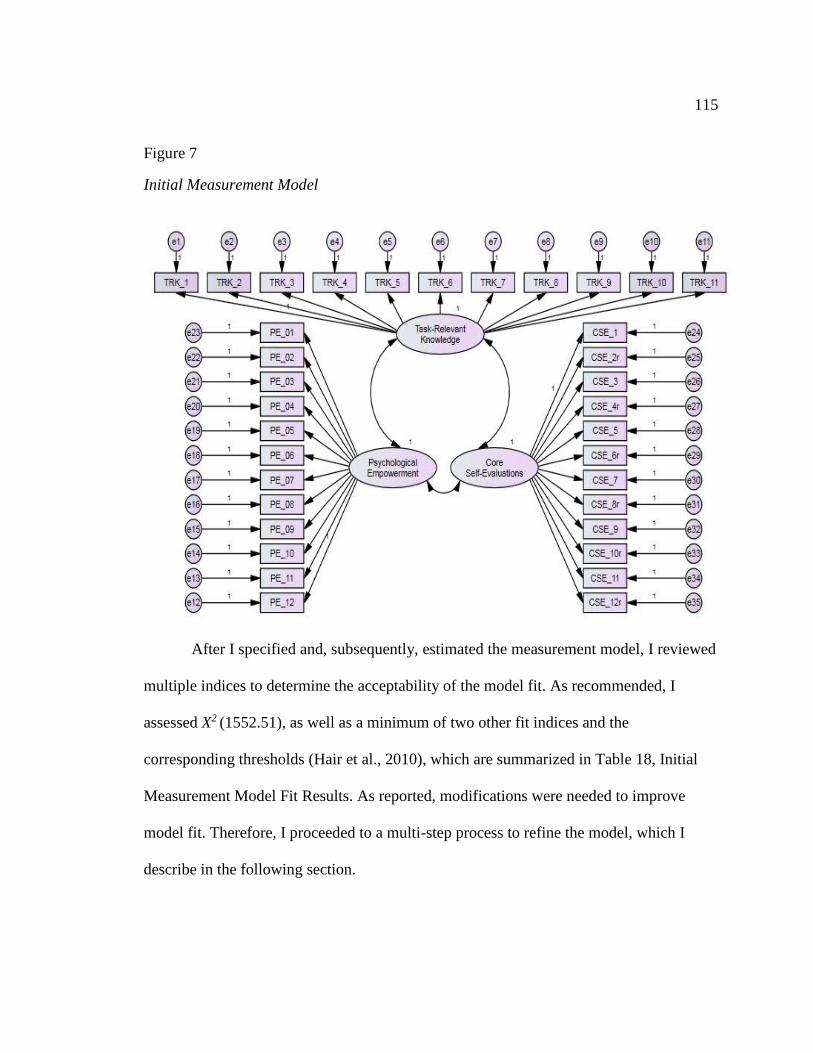
115
Figure 7
Initial Measurement Model
After I specified and, subsequently, estimated the measurement model, I reviewed
multiple indices to determine the acceptability of the model fit. As recommended, I
assessed X2 (1552.51), as well as a minimum of two other fit indices and the
corresponding thresholds (Hair et al., 2010), which are summarized in Table 18, Initial
Measurement Model Fit Results. As reported, modifications were needed to improve
model fit. Therefore, I proceeded to a multi-step process to refine the model, which I
describe in the following section.
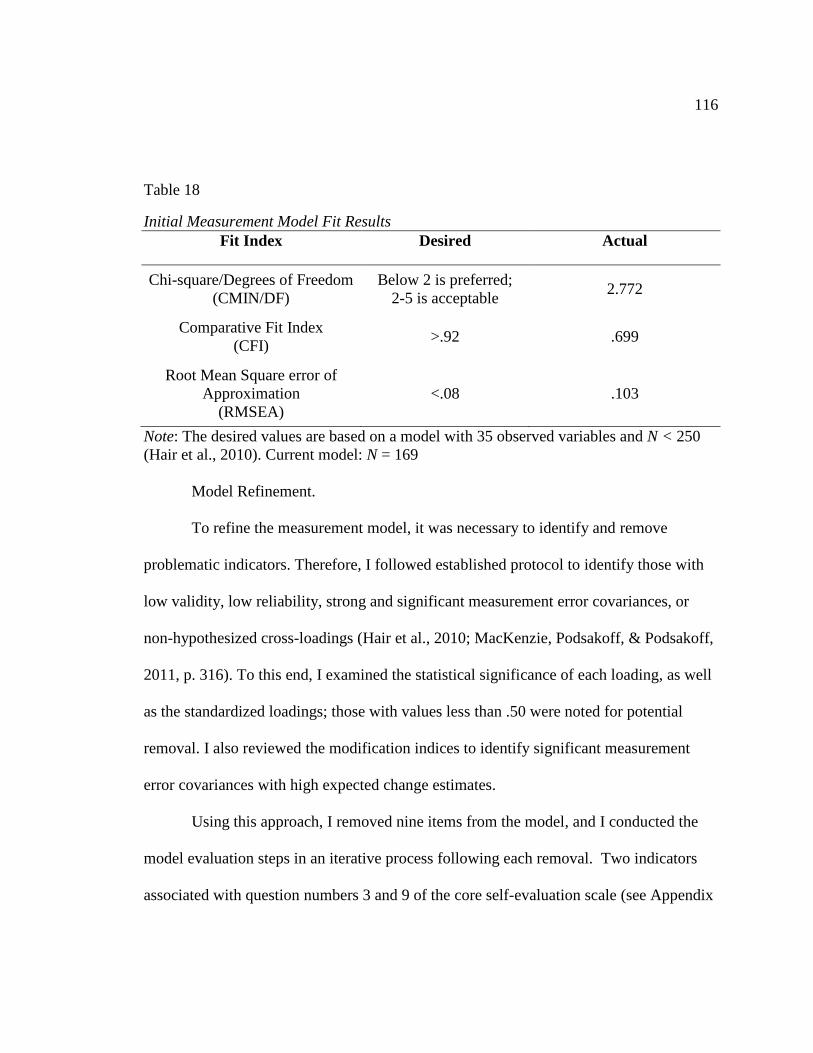
116
Table 18
Initial Measurement Model Fit Results
Fit Index Desired Actual
Chi-square/Degrees of Freedom
(CMIN/DF)
Below 2 is preferred;
2-5 is acceptable 2.772
Comparative Fit Index
(CFI) >.92 .699
Root Mean Square error of
Approximation
(RMSEA)
<.08 .103
Note: The desired values are based on a model with 35 observed variables and N < 250
(Hair et al., 2010). Current model: N = 169
Model Refinement.
To refine the measurement model, it was necessary to identify and remove
problematic indicators. Therefore, I followed established protocol to identify those with
low validity, low reliability, strong and significant measurement error covariances, or
non-hypothesized cross-loadings (Hair et al., 2010; MacKenzie, Podsakoff, & Podsakoff,
2011, p. 316). To this end, I examined the statistical significance of each loading, as well
as the standardized loadings; those with values less than .50 were noted for potential
removal. I also reviewed the modification indices to identify significant measurement
error covariances with high expected change estimates.
Using this approach, I removed nine items from the model, and I conducted the
model evaluation steps in an iterative process following each removal. Two indicators
associated with question numbers 3 and 9 of the core self-evaluation scale (see Appendix
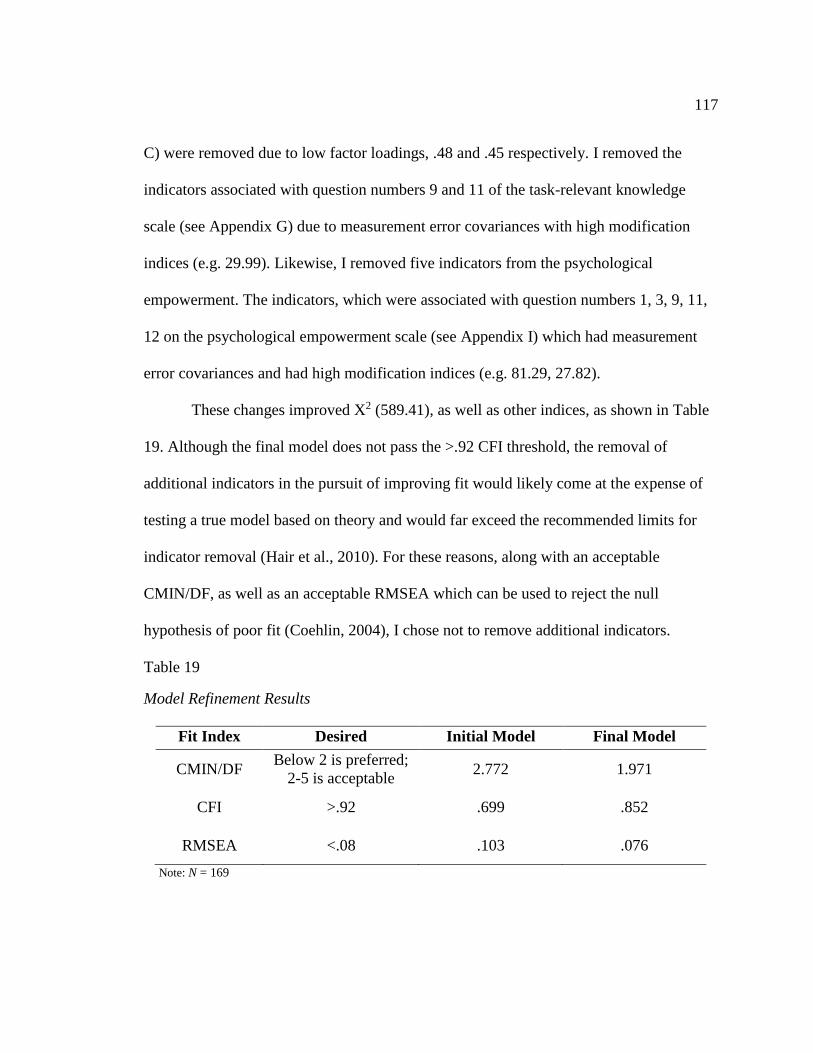
117
C) were removed due to low factor loadings, .48 and .45 respectively. I removed the
indicators associated with question numbers 9 and 11 of the task-relevant knowledge
scale (see Appendix G) due to measurement error covariances with high modification
indices (e.g. 29.99). Likewise, I removed five indicators from the psychological
empowerment. The indicators, which were associated with question numbers 1, 3, 9, 11,
12 on the psychological empowerment scale (see Appendix I) which had measurement
error covariances and had high modification indices (e.g. 81.29, 27.82).
These changes improved X2 (589.41), as well as other indices, as shown in Table
19. Although the final model does not pass the >.92 CFI threshold, the removal of
additional indicators in the pursuit of improving fit would likely come at the expense of
testing a true model based on theory and would far exceed the recommended limits for
indicator removal (Hair et al., 2010). For these reasons, along with an acceptable
CMIN/DF, as well as an acceptable RMSEA which can be used to reject the null
hypothesis of poor fit (Coehlin, 2004), I chose not to remove additional indicators.
Table 19
Model Refinement Results
Fit Index Desired Initial Model Final Model
CMIN/DF Below 2 is preferred;
2-5 is acceptable 2.772 1.971
CFI >.92 .699 .852
RMSEA <.08 .103 .076
Note: N = 169
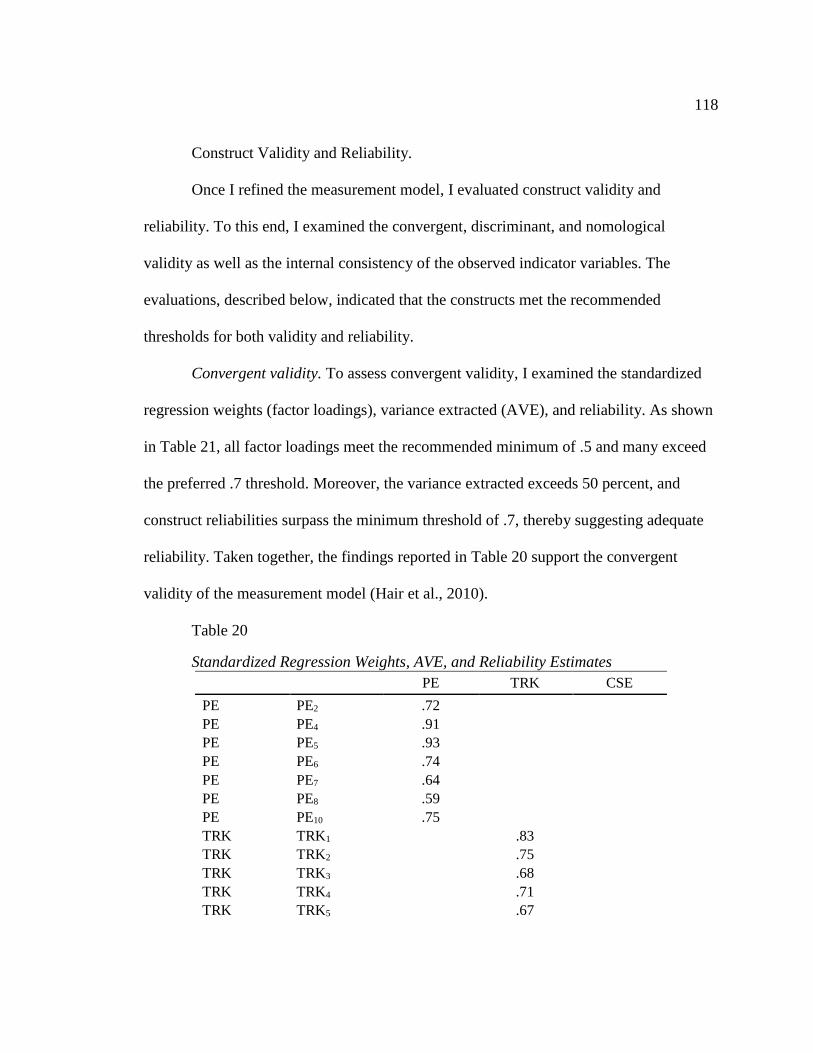
118
Construct Validity and Reliability.
Once I refined the measurement model, I evaluated construct validity and
reliability. To this end, I examined the convergent, discriminant, and nomological
validity as well as the internal consistency of the observed indicator variables. The
evaluations, described below, indicated that the constructs met the recommended
thresholds for both validity and reliability.
Convergent validity. To assess convergent validity, I examined the standardized
regression weights (factor loadings), variance extracted (AVE), and reliability. As shown
in Table 21, all factor loadings meet the recommended minimum of .5 and many exceed
the preferred .7 threshold. Moreover, the variance extracted exceeds 50 percent, and
construct reliabilities surpass the minimum threshold of .7, thereby suggesting adequate
reliability. Taken together, the findings reported in Table 20 support the convergent
validity of the measurement model (Hair et al., 2010).
Table 20
Standardized Regression Weights, AVE, and Reliability Estimates
PE TRK CSE
PE PE2 .72
PE PE4 .91
PE PE5 .93
PE PE6 .74
PE PE7 .64
PE PE8 .59
PE PE10 .75
TRK TRK1 .83
TRK TRK2 .75
TRK TRK3 .68
TRK TRK4 .71
TRK TRK5 .67
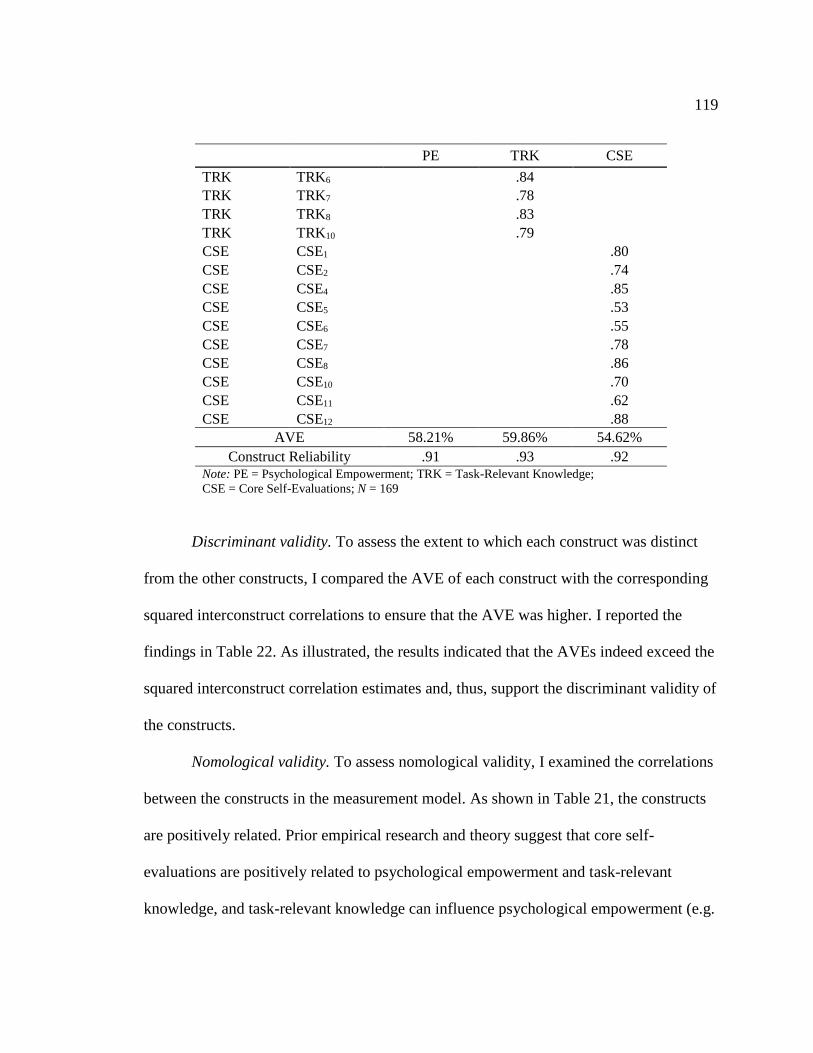
119
PE TRK CSE
TRK TRK6 .84
TRK TRK7 .78
TRK TRK8 .83
TRK TRK10 .79
CSE CSE1 .80
CSE CSE2 .74
CSE CSE4 .85
CSE CSE5 .53
CSE CSE6 .55
CSE CSE7 .78
CSE CSE8 .86
CSE CSE10 .70
CSE CSE11 .62
CSE CSE12 .88
AVE 58.21% 59.86% 54.62%
Construct Reliability .91 .93 .92 Note: PE = Psychological Empowerment; TRK = Task-Relevant Knowledge;
CSE = Core Self-Evaluations; N = 169
Discriminant validity. To assess the extent to which each construct was distinct
from the other constructs, I compared the AVE of each construct with the corresponding
squared interconstruct correlations to ensure that the AVE was higher. I reported the
findings in Table 22. As illustrated, the results indicated that the AVEs indeed exceed the
squared interconstruct correlation estimates and, thus, support the discriminant validity of
the constructs.
Nomological validity. To assess nomological validity, I examined the correlations
between the constructs in the measurement model. As shown in Table 21, the constructs
are positively related. Prior empirical research and theory suggest that core self-
evaluations are positively related to psychological empowerment and task-relevant
knowledge, and task-relevant knowledge can influence psychological empowerment (e.g.
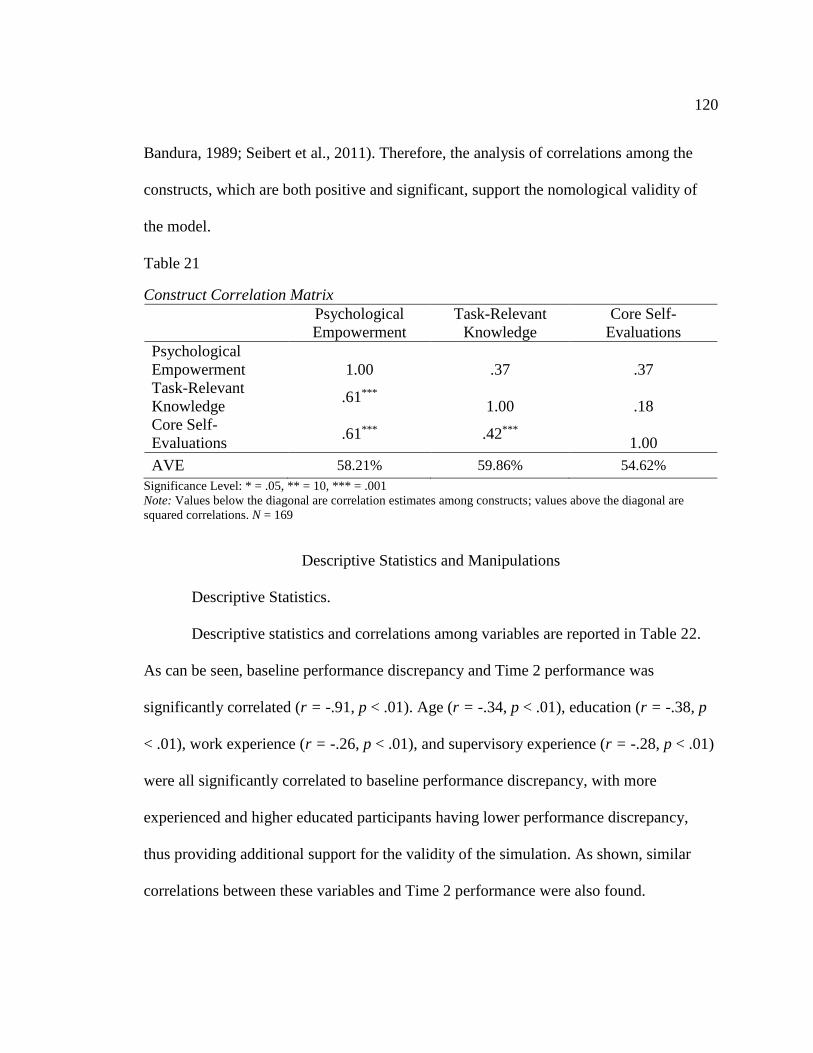
120
Bandura, 1989; Seibert et al., 2011). Therefore, the analysis of correlations among the
constructs, which are both positive and significant, support the nomological validity of
the model.
Table 21
Construct Correlation Matrix
Psychological
Empowerment
Task-Relevant
Knowledge
Core Self-
Evaluations
Psychological
Empowerment 1.00 .37 .37
Task-Relevant
Knowledge .61***
1.00 .18
Core Self-
Evaluations .61*** .42***
1.00
AVE 58.21% 59.86% 54.62%
Significance Level: * = .05, ** = 10, *** = .001
Note: Values below the diagonal are correlation estimates among constructs; values above the diagonal are
squared correlations. N = 169
Descriptive Statistics and Manipulations
Descriptive Statistics.
Descriptive statistics and correlations among variables are reported in Table 22.
As can be seen, baseline performance discrepancy and Time 2 performance was
significantly correlated (r = -.91, p < .01). Age (r = -.34, p < .01), education (r = -.38, p
< .01), work experience (r = -.26, p < .01), and supervisory experience (r = -.28, p < .01)
were all significantly correlated to baseline performance discrepancy, with more
experienced and higher educated participants having lower performance discrepancy,
thus providing additional support for the validity of the simulation. As shown, similar
correlations between these variables and Time 2 performance were also found.
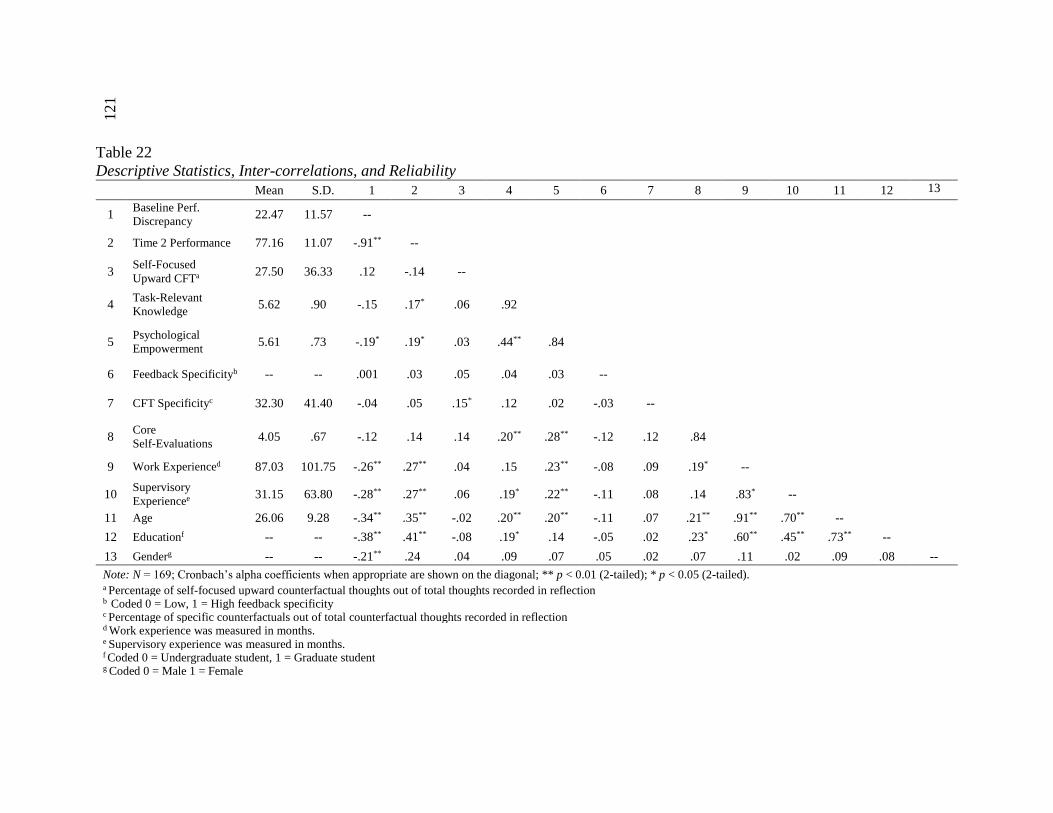
121
Table 22
Descriptive Statistics, Inter-correlations, and Reliability
Mean S.D. 1 2 3 4 5 6 7 8 9 10 11 12 13
1 Baseline Perf.
Discrepancy 22.47 11.57 --
2 Time 2 Performance 77.16 11.07 -.91** --
3 Self-Focused
Upward CFTa 27.50 36.33 .12 -.14 --
4 Task-Relevant
Knowledge 5.62 .90 -.15 .17* .06 .92
5 Psychological
Empowerment 5.61 .73 -.19* .19* .03 .44** .84
6 Feedback Specificityb -- -- .001 .03 .05 .04 .03 --
7 CFT Specificityc 32.30 41.40 -.04 .05 .15* .12 .02 -.03 --
8 Core
Self-Evaluations 4.05 .67 -.12 .14 .14 .20** .28** -.12 .12 .84
9 Work Experienced 87.03 101.75 -.26** .27** .04 .15 .23** -.08 .09 .19* --
10 Supervisory
Experiencee 31.15 63.80 -.28** .27** .06 .19* .22** -.11 .08 .14 .83* --
11 Age 26.06 9.28 -.34** .35** -.02 .20** .20** -.11 .07 .21** .91** .70** --
12 Educationf -- -- -.38** .41** -.08 .19* .14 -.05 .02 .23* .60** .45** .73** --
13 Genderg -- -- -.21** .24 .04 .09 .07 .05 .02 .07 .11 .02 .09 .08 --
Note: N = 169; Cronbach’s alpha coefficients when appropriate are shown on the diagonal; ** p < 0.01 (2-tailed); * p < 0.05 (2-tailed). a Percentage of self-focused upward counterfactual thoughts out of total thoughts recorded in reflection b Coded 0 = Low, 1 = High feedback specificity c Percentage of specific counterfactuals out of total counterfactual thoughts recorded in reflection d Work experience was measured in months. e Supervisory experience was measured in months. f Coded 0 = Undergraduate student, 1 = Graduate student g Coded 0 = Male 1 = Female
122
Additionally, psychological empowerment was significantly correlated to lower baseline
performance discrepancy (r = -.19, p < .05), and both psychological empowerment (r =
.19, p < .05) and task-relevant knowledge (r = .17, p < .05) were significantly correlated
with Time 2 performance, demonstrating that those who felt more empowered and
reported higher levels of task-relevant knowledge performed somewhat better on the
simulation tasks.
Manipulations.
Recall that my study included manipulations of feedback specificity and
psychological empowerment antecedents. Prior to testing the hypotheses, I evaluated the
effectiveness of the manipulations by analyzing participants’ responses to the 2-item
perceived feedback specificity manipulation check (see Appendix H), as well as the mean
ratings on the psychological empowerment scale (see Appendix I). I provide the results in
the following sections.
Feedback specificity. The feedback specificity manipulations included three
specificity levels: low (n= 58), moderate (n= 55), and high (n= 56). When I assessed
perceptions of feedback specificity among the three groups, Levene’s test of homogeneity
of variances indicated that homogeneity of variances was violated (p = .001).
Consequently, I conducted a one-way Welch ANOVA to determine whether the mean
ratings of perceived feedback specificity differed significantly for each level of feedback
specificity. Results demonstrated that the mean rating of perceived feedback specificity
123
was statistically significantly different among the three groups, Welch’s F (2, 166) =
10.94, p <.001, with a medium to large effect size, .13 (Cohen,1988).
Despite reaching statistical significance, the actual difference in mean scores
between the groups indicated that, for some groups, participants’ perceptions of feedback
specificity were not aligned with the intended levels of feedback specificity. More
precisely, post-hoc comparisons using the Games-Howell test, which corrects for the
homogeneity of variances violation, indicated that the mean score for the low feedback
specificity condition (M = 4.96, SD = 1.40) did not differ significantly from the moderate
feedback specificity group (M = 5.29, SD = 1.10). However, the mean difference between
the low and high conditions (-.98, 95% CI [-1.49, -.47]) was significantly different (p
<.001), as was the difference between moderate and high (-.65, 95% CI [-1.09, -.20], p
<.001). On the basis of these findings, to conduct subsequent analyses I combined the
low and moderate groups such that the final feedback specificity variable included two
conditions (i.e. low and high).
Psychological empowerment. To assess whether manipulations of psychological
empowerment antecedents were effective for influencing the extent to which participants
felt empowered, I conducted an independent-samples t-test to compare psychological
empowerment scores for participants in the low (n = 93) and high (n = 76) conditions.
There was no significant difference in scores for those in the low psychological
empowerment group (M = 5.67, SD = .66) and those in the high group (M = 5.54, SD =
.81). The magnitude of the mean difference (.13, 95% CI [-.10, .35]) was very small
124
(Cohen, 1988), d = .18, and not in the intended direction. I note this finding as a
limitation and discuss it in more detail in Chapter 5.
Data Analysis
To test hypothesis 1, I conducted a hierarchical regression analysis using IBM®
SPSS® 23.0.0 software. I used a two-step process. First, I entered the control variables in
Model 1, followed by the independent variable, baseline performance discrepancy, in
Model 2.
All subsequent hypotheses were tested with the PROCESS macro—a
computational tool for SPSS, developed by Preacher and Hayes (Preacher & Hayes,
2004) to help researchers overcome analytical challenges associated with mediation,
moderation, and conditional process analyses (Hayes, 2012). This tool uses a path
analysis framework to estimate coefficients in ordinary least squares (OLS) regression
models and can generate direct, indirect, and conditional indirect effects in moderated
mediation models (Hayes, 2012, 2013).
For each proposed boundary condition in the relationship between baseline
performance discrepancy and self-focused upward counterfactual thinking (H1 – H4), I
utilized PROCESS Model 1, as there was not an ideal PROCESS model to test all
moderators simultaneously. Using the PROCESS options available, I requested the mean
center for all products.
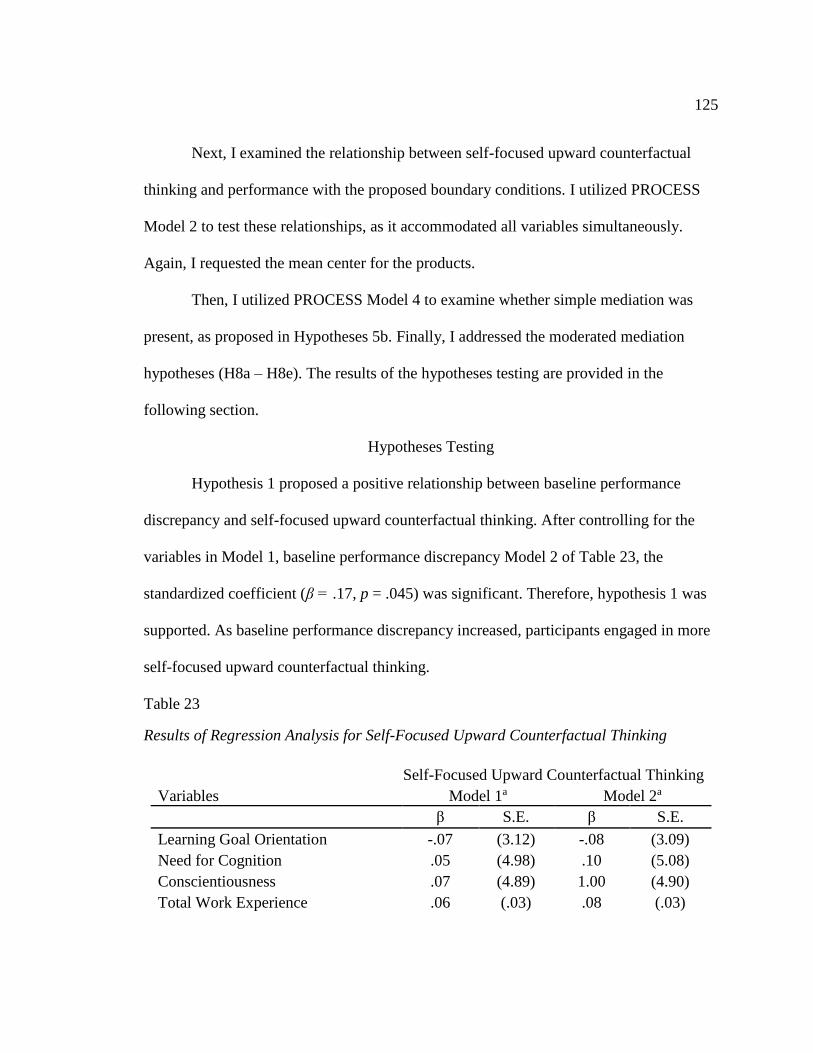
125
Next, I examined the relationship between self-focused upward counterfactual
thinking and performance with the proposed boundary conditions. I utilized PROCESS
Model 2 to test these relationships, as it accommodated all variables simultaneously.
Again, I requested the mean center for the products.
Then, I utilized PROCESS Model 4 to examine whether simple mediation was
present, as proposed in Hypotheses 5b. Finally, I addressed the moderated mediation
hypotheses (H8a – H8e). The results of the hypotheses testing are provided in the
following section.
Hypotheses Testing
Hypothesis 1 proposed a positive relationship between baseline performance
discrepancy and self-focused upward counterfactual thinking. After controlling for the
variables in Model 1, baseline performance discrepancy Model 2 of Table 23, the
standardized coefficient (β = .17, p = .045) was significant. Therefore, hypothesis 1 was
supported. As baseline performance discrepancy increased, participants engaged in more
self-focused upward counterfactual thinking.
Table 23
Results of Regression Analysis for Self-Focused Upward Counterfactual Thinking
Self-Focused Upward Counterfactual Thinking
Variables Model 1a Model 2a
β S.E. β S.E.
Learning Goal Orientation -.07 (3.12) -.08 (3.09)
Need for Cognition .05 (4.98) .10 (5.08)
Conscientiousness .07 (4.89) 1.00 (4.90)
Total Work Experience .06 (.03) .08 (.03)
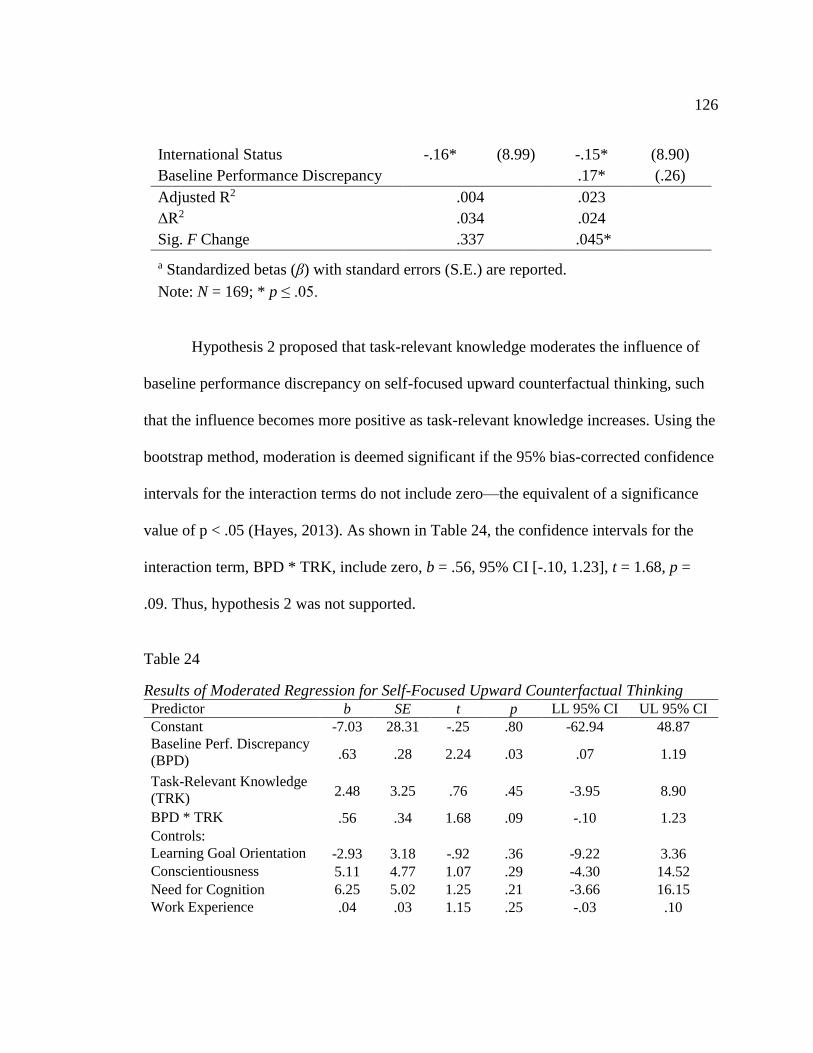
126
International Status -.16* (8.99) -.15* (8.90)
Baseline Performance Discrepancy .17* (.26)
Adjusted R2 .004 .023
ΔR2 .034 .024
Sig. F Change .337 .045*
a Standardized betas (β) with standard errors (S.E.) are reported.
Note: N = 169; * p ≤ .05.
Hypothesis 2 proposed that task-relevant knowledge moderates the influence of
baseline performance discrepancy on self-focused upward counterfactual thinking, such
that the influence becomes more positive as task-relevant knowledge increases. Using the
bootstrap method, moderation is deemed significant if the 95% bias-corrected confidence
intervals for the interaction terms do not include zero—the equivalent of a significance
value of p < .05 (Hayes, 2013). As shown in Table 24, the confidence intervals for the
interaction term, BPD * TRK, include zero, b = .56, 95% CI [-.10, 1.23], t = 1.68, p =
.09. Thus, hypothesis 2 was not supported.
Table 24
Results of Moderated Regression for Self-Focused Upward Counterfactual Thinking Predictor b SE t p LL 95% CI UL 95% CI
Constant -7.03 28.31 -.25 .80 -62.94 48.87
Baseline Perf. Discrepancy
(BPD) .63 .28 2.24 .03 .07 1.19
Task-Relevant Knowledge
(TRK) 2.48 3.25 .76 .45 -3.95 8.90
BPD * TRK .56 .34 1.68 .09 -.10 1.23
Controls:
Learning Goal Orientation -2.93 3.18 -.92 .36 -9.22 3.36
Conscientiousness 5.11 4.77 1.07 .29 -4.30 14.52
Need for Cognition 6.25 5.02 1.25 .21 -3.66 16.15
Work Experience .04 .03 1.15 .25 -.03 .10
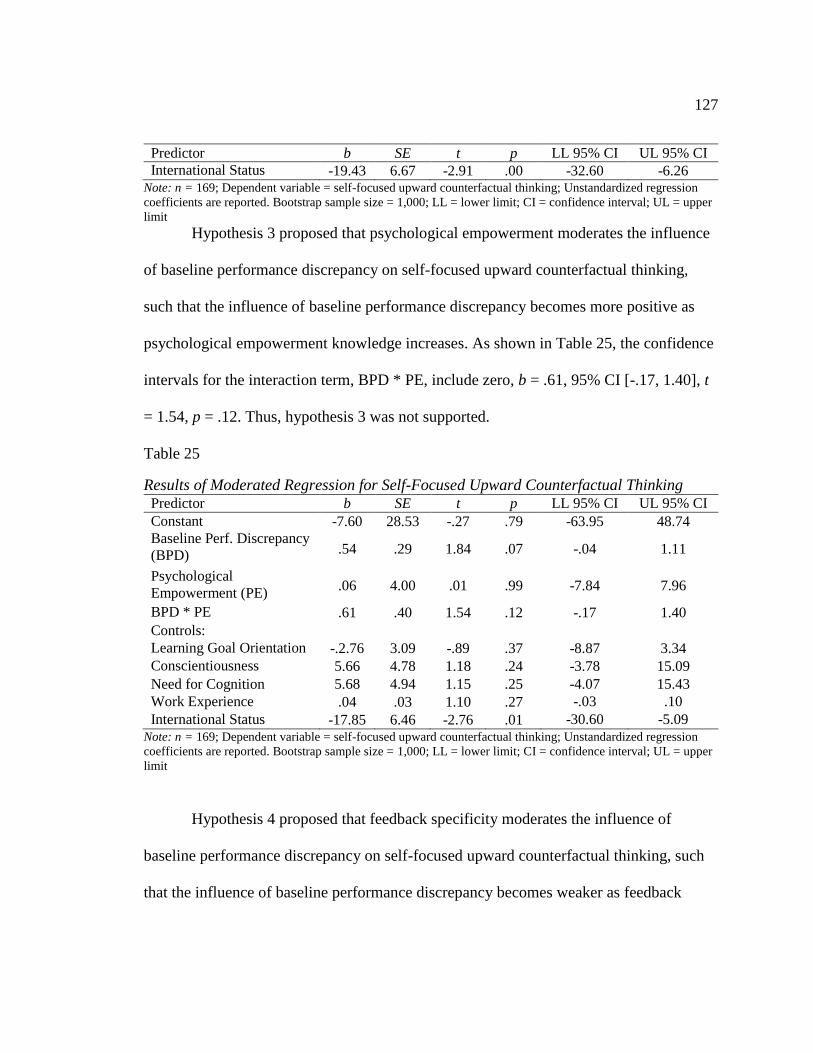
127
Predictor b SE t p LL 95% CI UL 95% CI
International Status -19.43 6.67 -2.91 .00 -32.60 -6.26 Note: n = 169; Dependent variable = self-focused upward counterfactual thinking; Unstandardized regression
coefficients are reported. Bootstrap sample size = 1,000; LL = lower limit; CI = confidence interval; UL = upper
limit
Hypothesis 3 proposed that psychological empowerment moderates the influence
of baseline performance discrepancy on self-focused upward counterfactual thinking,
such that the influence of baseline performance discrepancy becomes more positive as
psychological empowerment knowledge increases. As shown in Table 25, the confidence
intervals for the interaction term, BPD * PE, include zero, b = .61, 95% CI [-.17, 1.40], t
= 1.54, p = .12. Thus, hypothesis 3 was not supported.
Table 25
Results of Moderated Regression for Self-Focused Upward Counterfactual Thinking Predictor b SE t p LL 95% CI UL 95% CI
Constant -7.60 28.53 -.27 .79 -63.95 48.74
Baseline Perf. Discrepancy
(BPD) .54 .29 1.84 .07 -.04 1.11
Psychological
Empowerment (PE) .06 4.00 .01 .99 -7.84 7.96
BPD * PE .61 .40 1.54 .12 -.17 1.40
Controls:
Learning Goal Orientation -.2.76 3.09 -.89 .37 -8.87 3.34
Conscientiousness 5.66 4.78 1.18 .24 -3.78 15.09
Need for Cognition 5.68 4.94 1.15 .25 -4.07 15.43
Work Experience .04 .03 1.10 .27 -.03 .10
International Status -17.85 6.46 -2.76 .01 -30.60 -5.09
Note: n = 169; Dependent variable = self-focused upward counterfactual thinking; Unstandardized regression
coefficients are reported. Bootstrap sample size = 1,000; LL = lower limit; CI = confidence interval; UL = upper
limit
Hypothesis 4 proposed that feedback specificity moderates the influence of
baseline performance discrepancy on self-focused upward counterfactual thinking, such
that the influence of baseline performance discrepancy becomes weaker as feedback
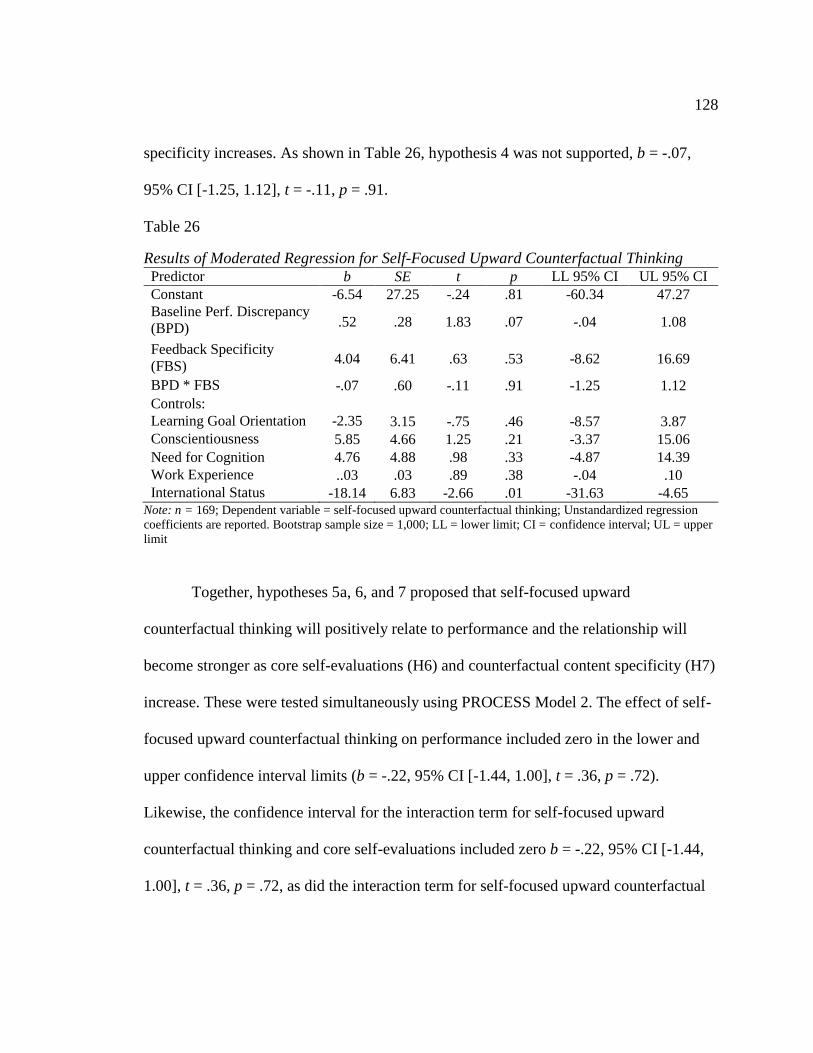
128
specificity increases. As shown in Table 26, hypothesis 4 was not supported, b = -.07,
95% CI [-1.25, 1.12], t = -.11, p = .91.
Table 26
Results of Moderated Regression for Self-Focused Upward Counterfactual Thinking Predictor b SE t p LL 95% CI UL 95% CI
Constant -6.54 27.25 -.24 .81 -60.34 47.27
Baseline Perf. Discrepancy
(BPD) .52 .28 1.83 .07 -.04 1.08
Feedback Specificity
(FBS) 4.04 6.41 .63 .53 -8.62 16.69
BPD * FBS -.07 .60 -.11 .91 -1.25 1.12
Controls:
Learning Goal Orientation -2.35
2.42. 3.15 -.75 .46 -8.57 3.87
Conscientiousness 5.85 4.66 1.25 .21 -3.37 15.06
Need for Cognition 4.76 4.88 .98 .33 -4.87 14.39
Work Experience ..03 .03 .89 .38 -.04 .10
International Status -18.14 6.83 -2.66 .01 -31.63 -4.65 Note: n = 169; Dependent variable = self-focused upward counterfactual thinking; Unstandardized regression
coefficients are reported. Bootstrap sample size = 1,000; LL = lower limit; CI = confidence interval; UL = upper
limit
Together, hypotheses 5a, 6, and 7 proposed that self-focused upward
counterfactual thinking will positively relate to performance and the relationship will
become stronger as core self-evaluations (H6) and counterfactual content specificity (H7)
increase. These were tested simultaneously using PROCESS Model 2. The effect of self-
focused upward counterfactual thinking on performance included zero in the lower and
upper confidence interval limits (b = -.22, 95% CI [-1.44, 1.00], t = .36, p = .72).
Likewise, the confidence interval for the interaction term for self-focused upward
counterfactual thinking and core self-evaluations included zero b = -.22, 95% CI [-1.44,
1.00], t = .36, p = .72, as did the interaction term for self-focused upward counterfactual
129
thinking and counterfactual content specificity, b = -.22, 95% CI [-1.44, 1.00], t = .36, p =
.72. Therefore, hypotheses 5a, 6, and 7 were not supported.
Hypothesis 5b proposed that baseline performance discrepancy indirectly affects
performance, through self-focused upward counterfactual thinking. The effect of baseline
performance discrepancy on performance in isolation (the total effect) was significant, as
indicated by a significant unstandardized regression coefficient (b = -.86, 95% CI [-.92, -
.79], t = -25.43, p < .01). When self-focused upward counterfactual thinking is
introduced as well (the direct effect), the total effect changed minimally, (b = -.85, 95%
CI [-.92, -.78], t = -25.28, p < .01). Based on bootstrap confidence intervals, mediation is
present if the 95% bias-corrected indirect effect confidence intervals do not include zero.
This is the equivalent of a significance value of p < .05 (Hayes, 2013). In this case, the
indirect effect of baseline performance discrepancy on performance through self-focused
upward counterfactual thinking was negative (-.01) and the confidence interval included
zero (95% CI [-.02, .01]). Therefore, hypothesis 5b was not supported.
Regarding the proposed conditional indirect effects (Hypotheses 8a – 8e), the
preceding results indicated that neither the indirect effect nor the proposed boundary
conditions on the direct paths in the research model were significant. Likewise, the
conditional indirect effect hypotheses (H8a – H8e) were not supported.
In summary, the results of the hypotheses testing indicated that hypothesis 1, the
relationship between baseline performance discrepancy was supported. The remaining
hypotheses were not supported.
130
CHAPTER FIVE: DISCUSSION, LIMITATIONS, AND FUTURE RESEARCH
In this study, I integrated established theory from the psychology field—the
functional theory of counterfactual thinking (Epstude & Roese, 2008)—to investigate
how counterfactual thinking influences feedback processing and subsequent performance.
To this end, I examined whether a performance discrepancy, conveyed to individuals
through feedback, indirectly effects subsequent performance through self-focused upward
counterfactual thinking. In addition, I analyzed boundary conditions of such thinking and
its effects on performance. To examine these relationships, I designed, developed,
validated, and implemented a leadership skill social interaction simulation. I tested the
conceptual model using data from a sample of 169 graduate and undergraduate students. I
validated the research model with a CFA and, subsequently, tested the hypotheses with
hierarchical regression analysis and the PROCESS macro for SPSS. In this chapter, I
discuss the findings, implications, and limitations of my research, as well as directions for
future research.
Discussion of Findings
My research represents a step towards theoretically integrating counterfactual
thinking theory with reflection in the management literature to explain how individuals
process and learn from feedback that conveys performance discrepancies. Over the last
decade, scholars have promoted reflection as a way to enhance learning from feedback
131
and experiences (e.g. Ellis et al., 2014). However, prior research has not investigated the
unique contribution of counterfactual thinking to learning and performance improvement.
In this study, I sought to address this and to investigate whether counterfactual thinking
can enhance the effectiveness of performance discrepancy feedback on performance.
Baseline Performance Discrepancy, Self-Focused Upward
Counterfactual Thinking, and Proposed Boundary Conditions.
As predicted, my research suggests that when individuals reflect on performance
discrepancies, they will likely engage in self-focused upward counterfactual thinking. In
doing so, they question how they could have altered their behaviors to attain better
outcomes. The results, therefore, demonstrate that individuals may attempt to reconcile
performance discrepancies through self-focused upward counterfactual thoughts. Thus,
this finding may be an important step towards understanding how to assist individuals
with processing performance discrepancy feedback and to increase the effectiveness of
such feedback.
Task-relevant knowledge. The question remains as to what conditions support and
hinder self-focused upward counterfactual thinking. I expected that task-relevant
knowledge would moderate the effect of baseline performance discrepancy on self-
focused upward counterfactual thinking, such that task-relevant knowledge would
strengthen the relationship. However, my results did not support this hypothesis. This
finding can be interpreted in three ways: 1) task-relevant knowledge plays no role in
influencing self-focused upward thoughts, 2) it plays a conditional role in the
132
relationship, or 3) the self-report measure of task-relevant knowledge did not capture
accurately participants’ task knowledge.
Task-relevant knowledge can lead to higher levels of self-efficacy, to help
individuals direct efforts toward goals, and to select behavioral responses from among
multiple possibilities (Bandura, 1986). Therefore, while it may be possible that task-
relevant knowledge plays no role in influencing self-focused upward counterfactual
thoughts, theory suggests otherwise. As such, it seems more likely that task-relevant
knowledge may play a conditional role, rather than no role, in influencing counterfactual
thoughts. According to Kinciki et al. (2004), the extent to which an individual perceives
feedback as an accurate representation of his or her performance, predicts whether he or
she has a desire to respond (i.e. whether an individual wants to respond in line with the
feedback). Therefore, in the current study, the extent to which individuals perceived their
performance discrepancies as accurate may have influenced their desire to scan their
repertoire of knowledge in the pursuit of identifying behavioral alternatives, from which
they could generate self-focused upward counterfactuals.
It is also possible that the lack of support for task-relevant knowledge as a
boundary condition is an artifact of the self-report measurement. Participants may have
selected those responses that were more socially desirable or more ego flattering than
other responses, thereby compressing scores at the high end of the scale and restricting
variance (Podsakoff & Organ, 1986). To this point, 61% of participants rated their task-
relevant knowledge as greater than or equal to 6 out of 7. Because task-relevant
133
knowledge is comprised of facts and knowledge structures that are necessary for
successful task performance (Costanza et al., 1999, p. 71), one would expect to find a
significant negative correlation between task-relevant knowledge and baseline
performance discrepancy. Surprisingly, I did not find such in this study.
However, recall from Chapter 3 that job experience contributes to the acquisition
of task-relevant knowledge (Schmidt et al., 1986), and prior research has included job
experience measures when operationalizing task-relevant knowledge (e.g. Ahearne,
Mathieu, & Rapp, 2005). Following this practice, I collected supervisory experience as a
supplemental indicator of task-relevant knowledge. Interestingly, when I tested the
proposed relationship with supervisory experience as the indicator of task-relevant
knowledge, I found support for hypothesis 2 (β = .01, p < .05). Likewise, I found a
significant negative correlation between supervisory experience and baseline
performance discrepancy (r = -.28, p <.01).
These findings suggest that either participants did not assess accurately their task-
relevant knowledge or the accumulation of task-relevant knowledge through experience
(Costanza, 1999) offers a unique contribution to self-focused upward counterfactual
thinking. Perhaps supervisory experience provides individuals with opportunities to
organize related facts and information about the skill domain in ways that are more
meaningful and, thus, increases the influence of knowledge structures on counterfactual
reflection.
134
Psychological empowerment. Contrary to my prediction, psychological
empowerment did not moderate the relationship between baseline performance
discrepancy and self-focused upward counterfactual thinking. Prior research has
established a theoretical and empirical connection between social power and self-focused
counterfactuals (Scholl & Sassenberg, 2014). As such, the extent to which one actually
has the ability to control one’s own and other’s outcomes (i.e. social power) may make
psychological empowerment less relevant. In the current study, participants’ ability to
control outcomes was restricted to three predetermined choices. Therefore, although they
served in the manager role, the extent to which they could actually control their course of
action was somewhat restricted. Consequently, they may have had lower levels of social
power, which would have attenuated self-focused counterfactuals. Additionally and as
previously noted, the manipulations of psychological empowerment antecedents did not
generate distinct conditions of low and high psychological empowerment. Consequently,
the variance was limited, with the vast majority (92%) of participants reporting
psychological empowerment scores greater than or equal to 5 out of 7.
The empowerment literature offers potential explanations as to why the conditions
were difficult to manipulate. Specifically, in contrast to structural empowerment,
psychological empowerment comes from within an individual, not from external
programs or processes (Spreitzer & Quinn, 2008; Spreitzer, 2008). Although forms of
structural empowerment, such as those manipulated in this study, are antecedents to
psychological empowerment, a number of individual differences (e.g. locus of control,
135
self-conscientiousness) also influence psychological empowerment (Seibert et al., 2011).
It is possible that, for some participants, these factors influenced their sense of
empowerment more than the manipulations. In the current study, I did not capture those
individual differences and, thus, I cannot ascertain how many psychological
empowerment scores may have been impacted by such differences.
Another possible explanation for the ineffective manipulations lies in the research
setting and, consistent with job characteristics theory (Hackman & Oldham, 1980), the
design of the work itself (i.e. the simulation) may have promoted psychological
empowerment. According to job characteristics theory, five core job characteristics (skill
variety, task significance, task identify, autonomy, and feedback) influence critical
psychological states that, in turn, affect motivational outcomes (e.g. empowerment).
Before measuring psychological empowerment, each interaction was unique in terms of
its situation and the challenge it posed for the participant. As such, it offered skill variety.
Similarly, in each interaction, participants’ actions affected others (subordinates), and
each interaction had a clear outcome. Thus, participants may have perceived task
significance, as well as task identity. With the freedom to complete the simulation from a
location of their preference, along with their roles as managers in the simulation,
participants may have had a high level of autonomy. Finally, with the feedback provided
by the simulated characters during the interactions, as well as the feedback provided at
the end of Time 1 tasks, participants may have had sufficient knowledge of their results.
136
If true, then these design properties of the simulation may have promoted psychological
empowerment, thus contributing to the high scores on this construct.
On a related note, scholars contend that immersive learning experiences and
interactivity in virtual worlds can enhance engagement and empowerment (de Freitas,
Rebolledo-Mendez, Liarokapis, Magoulas, & Poulovassilis, 2010). As such, it is possible
that the use of a virtual workplace setting affected how participants experienced
empowerment in the study. To this point, participants may have had difficulty
differentiating their sense of empowerment as a participant in a virtual simulation from
their sense of empowerment as a manager in the virtual organization.
Feedback specificity. I also examined whether feedback specificity influences the
extent to which individuals engage in self-focused upward counterfactual thinking. I
argued that high feedback specificity might limit the extent to which individuals explore
alternative versions of their behaviors and associated performance outcomes. Following
this line of thought, I hypothesized (hypothesis 4) that as feedback specificity increases,
the relationship between baseline performance discrepancy and self-focused upward
counterfactual thinking would weaken. However, I did not find support for this
relationship and, interestingly, there were no significant mean differences between the
low- and high feedback specificity groups on self-upward counterfactual thinking,
reflection word count, nor reflection time.
To these points, recall that the feedback specificity manipulations did not yield
low-, moderate-, and high feedback specificity groups and, consequently, I conducted the
137
analysis with low and high conditions only. As such, the variance of this construct was
somewhat limited. The feedback messages, including the specificity level of each, were
similar to those used successfully in prior studies (e.g. Feys et al., 2011). Thus, it was
interesting that the distinctions among the feedback specificity levels were less clear in
the current study, which is important to consider when interpreting the results of
hypothesis 4. Perhaps, rather than focusing on the specificity level of the text-based
performance feedback, which was the focus of the manipulation check and the
measurement of the construct, it is possible that participants in the current study also
considered the specificity level of the feedback provided by the simulated characters
during the interactions. As such, participants may have considered nonverbal feedback
such as the simulated characters’ facial expressions, as well as other body language,
when responding to the feedback specificity manipulation check and when considering
the specificity level while reflecting. Such issues could have affected the results of
hypothesis 4.
The lack of support for this hypothesis and the lack of mean differences between
the low and high feedback specificity groups on reflection word count and reflection time
are intriguing, particularly when viewed in the context of Goodman et al.’s (2011)
findings. Their study demonstrated that low feedback specificity led to higher levels of
explicit information processing. In the current study, feedback specificity had no
significant effects. A possible explanation for this may be that, whereas Goodman et al.’s
(2011) study captured information processing via a verbal protocol method, the current
138
study engaged participants in a written reflection activity. Future studies should utilize a
verbal reflection protocol to examine the effect of feedback specificity on self-focused
upward counterfactual thinking.
The Effect of Self-Focused Upward Counterfactual Thinking on
Performance, Proposed Boundary Conditions, and Indirect Effects.
According to the functional theory of counterfactual thinking (Epstude & Roese,
2008), counterfactual thinking involves the transfer of information from a causal
inference and/or the activation of information processing that enhances motivation and
effort expenditure and, consequently, fuels behavior change. As such, I argued that self-
focused upward counterfactual thinking would positively influence performance
(hypothesis 5a). Surprisingly, and contrary to theory as well as prior research in the
psychology literature (e.g. Epstude & Roese, 2008), I did not find this effect in my study.
Whereas most counterfactual thinking studies in the psychology literature have
measured the effect of counterfactuals on anagram task performance or academic-related
tasks such as test performance (e.g. Markman et al., 1993; Nasco & Marsh, 1999; Roese,
1994), my study examined the impact of self-focused upward counterfactuals on
leadership task performance. Thus, the lack of support for hypothesis 5a is an important
finding for integrating counterfactual thinking theory with reflection (e.g. after-event-
reviews) in management studies. Upon further review of the reflection content, it became
evident that the lack of support for hypothesis 5a is likely attributable to multiple factors.
139
From a design point of view, it was not possible for some participants to
implement their self-focused upward counterfactuals in Time 2 tasks. For example, one
participant stated, “One of the biggest things I could have done differently on this activity
was to complete it in seclusion, because I was easily distracted by other individuals,
which I feel hindered my ability to fully comprehend the meetings…” (Participant 133).
Because I instructed participants to complete the study in one sitting, it was not possible
for this participant to implement the counterfactual in Time 2 tasks as, presumably, it
would require him or her to disconnect temporarily from the simulation while relocating.
Similarly, some participants generated self-focused upward counterfactuals about
alternate statements they would have made to their subordinates, as well as alternate
rewards and punishments they would have used to attain a better outcome. However, in
this simulated environment, unless their counterfactuals aligned with one of the three
available options at each decision point in Time 2 tasks, they were not able to apply their
counterfactuals to subsequent behaviors.
From a theoretical point of view, it is possible that the lack of support for
hypothesis 5a can be attributed to affective contrasts resulting from self-focused upward
comparisons. For some participants, upward counterfactual thinking may have triggered
regret and led to distress (Davis, Lehman, Wortman, Cohen Silver, & Thompson, 1995;
Gilbar & Hevroni, 2007), thereby hindering their performance on Time 2 tasks. Prior
research suggests that when participants suffer from depression or anxiety, they may be
particularly prone to such effects of counterfactual thinking (Markman & Miller, 2006).
140
Based on my findings, it is also important to ask whether self-focused upward
counterfactuals differentially affect performance on closed versus open skills. Closed
skills (e.g. computer software skills) require individuals to behave in a particular way
based on a set of rules, whereas open skills (e.g. leadership) are more variable and, thus,
are associated with multiple behaviors rather than a set of rules (Yelon & Ford, 1999).
Studies have demonstrated that, individuals often need supportive contexts to transfer
learning from open skills training to subsequent tasks (Blume, Ford, Baldwin, & Huang,
2010). In the current study, participants did not have access to a supportive context (i.e.
mentoring, peer interaction, etc.). As such, this may explain why some participants in the
current study, which focused on open skill training, did not transfer learning to Time 2
tasks. Again, this is an important consideration because prior counterfactual thinking
studies have typically assessed the effects of counterfactual thinking on closed skills (e.g.
anagram performance).
Additionally, it is possible that implicit leadership theories (ILT) (e.g. Cronshaw
& Lord, 1987; Shondrick & Lord, 2010) affected how participants attended to their
feedback and, consequently, how they responded to it. ILTs are cognitive structures or
prototypes that specify the traits and abilities that characterize leaders and are developed
through socialization and past experiences with leaders (Epitropaki, Sy, Martin, Tram-
Quon, & Topakas, 2013). ILTs can influence selective attention, as well as how
individuals think and act in leadership situations (Junker & van Dick, 2014).
141
To these points, my brief review of reflection content suggested that ILTs may
have influenced participants’ Time 1 behaviors, as one participant noted that he would
have been “more encouraging but feared it appeared unprofessional” (Participant 149), as
well as how participants interpreted and applied feedback in Time 2 tasks. Specifically,
some participants expressed that to perform better (i.e. be a more effective leader) they
would need to be “harsher” (Participant 205), “more strict” (Participant 100), and “more
stern” (Participant 52).
These were interesting responses, as the feedback directed participants to
encourage, reward, and engage participants in balanced conversation and participative
decision-making (see Appendix J). Based on cognitive dissonance theory (Festinger,
1957), if the feedback was not aligned with participants’ ILTs, they would likely try to
reduce dissonance by avoiding self-focused counterfactuals that targeted the behaviors
suggested in the feedback and, instead, generate self-focused upward counterfactuals that
aligned with their cognitive schemas of effective leadership. Consequently, this could
have lowered their Time 2 performance.
Finally, Noe (1986) defined motivation to transfer as a trainee’s desire to use the
knowledge and skills learned in training on the job. Transfer motivation is influenced by
many factors, including attitudes towards training (Gegenfurtner, Veermans, Festner, &
Gruber, 2009). As such, if participants approached the study solely as an opportunity to
earn extra credit, rather than an opportunity to assess, to learn, and to develop their
142
leadership skills, then this could have negatively influenced transfer of learning from
self-focused upward counterfactuals to Time 2 tasks.
Based on the lack of support for the direct relationship proposed in hypothesis 5a,
it is not surprising that hypothesis 5b, which proposed that baseline performance
discrepancy would indirectly affect performance through self-focused upward
counterfactual thinking, was also not supported. In light of the preceding discussion,
there are several potential boundary conditions that merit exploration and may result in a
positive relationship between self-focused upward counterfactual thinking and
performance, and a positive indirect effect of baseline performance discrepancy on
performance through such thinking.
In the current study, I examined core self-evaluations (hypothesis 6) and
counterfactual content specificity (hypothesis 7) as boundary conditions of the
relationship between self-focused upward counterfactual thinking and performance. I
expected that core self-evaluations would strengthen the relationship, because those with
high core self-evaluations have increased confidence in their abilities and are more
capable of mobilizing cognitive resources (Bono & Judge, 2003; Judge et al., 1998).
Likewise, I expected that as the specificity of counterfactuals increase, the likelihood of
creating strong links in memory and evoking behavioral change would increase.
However, I did not find support for these relationships.
As previously noted, the training transfer literature suggests that environmental
factors likely play an important role in whether individuals transfer learning from
143
counterfactuals to subsequent work tasks. When such factors are absent, one could expect
that distal predictors of behavior (e.g. core self-evaluations) are not sufficient to promote
the transfer of learning to performance. Similarly, recall that some participants generated
counterfactuals that were beyond the scope of the simulation or misaligned with the
feedback, consequently making the specificity level of counterfactuals less relevant than
other considerations.
Academic Contributions and Practitioner Implications
My primary contribution to the management literature lies in identifying the types
of thoughts individuals generate when they reflect on performance discrepancies.
Consequently, this finding advances our knowledge of cognitive processes that are
relevant for processing and learning from performance discrepancy feedback. To these
points, my research demonstrates the usefulness of the functional theory of counterfactual
thinking (Epstude & Roese, 2008) for further exploration of reflection in management
studies.
My research also makes methodological contributions. Specifically, I developed
my research setting with the most robust immersive learning simulation authoring tool
available (NexLearn, 2016) and deployed it with emerging learning technologies that
enable one to collect data about a wide range of experiences. In doing so, I created a valid
and reliable high fidelity interactive simulation that promoted psychological realism in
behavioral research. As noted in a participant’s reflection, “I especially liked seeing
144
another human on the other side of the desk. This is very realistic because there will most
likely always be another person sitting on the other side of the desk while you are
addressing issues as a manager” (Participant 209). The use of social interaction
simulations in behavioral research appears to be a viable option for balancing scholars’
desires to promote psychological realism (Colquitt, 2008) with their need to capture
standardized observations that reduce biased assessments.
On a related note, my study advances knowledge about the usefulness of the
incident isomorphic cloning procedure for the development of alternate problem
descriptions and social interaction tasks. This approach has been utilized in prior studies
(e.g. Anseel et al., 2009) for cloning electronic in-basket exercises, and scholars have
encouraged the investigation of its effectiveness for other types of tasks and content
(Lievens & Anseel, 2007). As such, the strong support found in my study for the
effectiveness of the cloning procedure for developing alternate simulation content makes
an important contribution to the literature on assessment center exercises.
Recent findings reported in the 2016 Deloitte Human Capital Trends Report
suggest that 84% executives view learning as an important issue in their organization, and
44% of executives view it as very important. Thus, my research is important for
academics and practitioners alike. These executives indicate that their companies are not
developing skills fast enough nor leaders effectively. All the while, they are urged to
implement employee-centric, technology-driven learning opportunities, such as
experiential simulations (Deloitte University Press, 2016).
145
To these points, my research provides practical insights on how to develop
reliable web-based simulations that can be used for initial skill assessment, technology-
based training, or as a selection tool. Additionally, from a practical point of view, the
counterfactual reflection intervention could be instrumental for developing employees
after performance discrepancy feedback, as it can help them to identify alternate
behavioral choices. Moreover, as seen in the current study, the reflection intervention can
highlight misunderstandings employees may have about the content of feedback, thereby
equipping managers with insight to aid in employee development and to minimize the
impact of such misunderstandings on subsequent performance.
Limitations
My study is subject to a number of limitations. Foremost to this point, my sample
was comprised of students, and their diligence, as well as their motivation to learn, while
completing the simulation tasks and the reflection activity may not be representative of
those who encounter learning opportunities in an organizational setting. Specifically, the
reflection content indicated that some participants did not take the tasks seriously and,
consequently, one may question the quality of the data. Additionally, the sample was
relatively small and thus limited the power of statistical analyses. It will be important for
future studies to investigate the usefulness of counterfactual thinking interventions with
larger and more representative samples. Moreover, my data was collected within the
same period of time, and I did not include a control group (i.e. no reflection) in this study.
146
Potential design limitations should also be noted. Despite the benefits of the social
interaction simulation I developed for this study, there were also drawbacks to
conducting the study in a web-based setting. Specifically, a considerable number of
participants did not complete the study in its entirety. Aside from those who may have
dropped out due to technical reasons, some participants expressed frustration with the
time requirement on the reflection activity (i.e. the 5-minute minimum), as well as other
design aspects such as not being able to replay audio-video content. It is plausible that
these or similar design properties within the simulation influenced participants’
willingness to complete the study.
My attrition bias analyses revealed age and work experience differences between
my final sample and those in the attrition groups. Despite this, and as previously noted, I
do not believe this was a substantial shortcoming. The characteristics of my final sample
were more closely aligned with my desired sample.
Concerning the manipulations in this study, as previously stated, the analyses
revealed that the manipulations were not fully effective. Specifically, the manipulations
of psychological empowerment did not facilitate distinct conditions of low and high
psychological empowerment and, overall, the psychological empowerment scores were
compressed at the high end of the scale. Similarly, the feedback specificity manipulations
were not fully effective, as there was no significant mean difference between the low and
moderate groups. As such, I combined the low- and moderate feedback specificity
groups, which limited the variance on feedback specificity.
147
Finally, I measured the task-relevant knowledge construct with self-report survey
questions. As such, participants’ perceptions of their task-relevant knowledge may have
differed from their actual levels of knowledge. Likewise, participants may have selected
the responses they deemed as most socially desirable.
Directions for Future Research
Given the limitations of the current study and the lack of counterfactual thinking
studies in management, there are substantial opportunities for future research on
counterfactual thinking and reflection in the workplace. Specifically, I recommend that
researchers devote attention to exploring other feedback characteristics and outcomes that
may influence reflection. Moreover, future research should focus on ways to maximize
the effectiveness of counterfactual thinking interventions. I outline these
recommendations in detail below.
Although the findings of this study suggest that feedback specificity does not
influence the extent to which individuals engage in self-focused upward counterfactual
thinking, other feedback characteristics such as feedback format, as well as feedback
outcomes such as feedback reactions are worth exploring. Prior research has
demonstrated that feedback format influences feedback reactions as well as performance
improvement. Specifically, Atwater & Brett (2006) investigated how feedback format
influences individuals’ feedback reactions and found that when individuals received text
feedback about their leadership behaviors they were more angry, discouraged, and less
148
motivated than those who received numeric and comparative feedback. Moreover,
feedback reactions were related to performance improvement. To these points, the current
study included text feedback only and did not measure initial feedback reactions that may
have affected the reflective processes. Although I did not quantitatively assess
participants’ feedback reactions, my brief qualitative review of reflection content
suggests that some participants focused on their reactions while reflecting. For example,
participants commented, “I am satisfied with my performance rating” (Participant 49), “I
am disappointed in my performance” (Participant 19), and “I do believe that I did better
than the grade shown” (Participant 54). To help individuals process feedback more
effectively, perhaps reflection prompts should vary based on recipients’ initial feedback
reactions or target specific aspects of reflection (e.g. counterfactual thinking, self-
explanation). In turn, this may lead to more focused reflection and higher levels of
improvement. A deeper understanding of how feedback format and feedback reactions, as
well as other feedback characteristics (e.g. feedback frequency) influence reflection are
important for enhancing its effects on performance.
Similarly, it is important to identify how design changes to reflection
interventions may enhance their effectiveness. To this end, the training literature may
offer insight. For example, according to Noe & Colquitt (2002) individuals’ motivation to
learn increases when the objectives, purpose, and intended outcomes of a training
intervention are clearly communicated to participants. The current study did not inform
participants of the various types of counterfactual thoughts or the associated benefits, as
149
demonstrated in psychology studies (see Epstude & Roese, 2008). Future studies should
explore the impact of such on the extent to which participants engage in reflection and
the extent to which they transfer learning to subsequent tasks.
Another promising avenue for future research is to combine counterfactual
thinking interventions with prompts that target goal-setting or prefactual thinking.
Prefactual thoughts are mental simulations about strategies and outcomes before the
actual outcomes are known (Scholl & Sassenberg, 2014). Thus, individuals engage in
prefactual thinking prior to engaging in a course of action. In the current study, it appears
that some participants had difficulty applying what they had learned through reflection to
subsequent interactions. Perhaps forward-focused activities such as goal-setting or
prefactual thinking can increase the effectiveness of lessons learned through
counterfactual thinking.
Finally, scholars should devote attention to investing the effectiveness of
counterfactual thinking for feedback processing in applied settings. Because the current
was set in a virtual workplace, it remains to be seen how environmental factors (e.g. peer
and supervisor support) influence whether lessons learned through counterfactual
thinking are applied to subsequent tasks. Scholars should explore such possibilities in
future studies.
Conclusion
This research established a new direction for reflection studies in the management
literature by integrating counterfactual thinking theory from the psychology literature.
150
While management scholars have highlighted the benefits of reflection for learning from
feedback and experiences (e.g. Ellis et al., 2014), prior studies have not accounted for the
unique contribution of counterfactual thinking to learning. Moreover, little focus has been
given to individual written forms of reflection (e.g. Anseel et al., 2009).
To enhance our understanding of reflective processes following performance
discrepancies, my research untangled counterfactual thinking from other aspects of
reflection (e.g. self-explanation). Additionally, using an individual written reflection
intervention, I explored whether and under what conditions performance discrepancies
indirectly effect performance through self-focused upward counterfactual thinking. To
these ends, I developed and validated a leadership skill social interaction simulation
capable of reliably assessing leadership skill performance over alternate task rounds.
My research demonstrated that when individuals encounter performance
discrepancies they are likely to engage in self-upward counterfactual thinking, during
which they consider how they could have altered their behaviors to attain better
performance outcomes. Overall, such thinking has supported learning in prior research in
the psychology field; however, my research underscores the need to investigate
environmental factors and intervention design properties that may exert unique effects of
counterfactual thinking on applied task performance. I anticipate that as our
understanding of the influence of such factors on this common feature of human
cognition (Sanna et al., 2003) develops, we will be able to identify ways to enhance the
effectiveness of performance discrepancy feedback.
151
REFERENCES
Ahearne, M., Mathieu, J., & Rapp, A. (2005). To empower or not to empower your sales
force? An empirical examination of the influence of leadership empowerment
behavior on customer satisfaction and performance. Journal of Applied
Psychology, 90(5), 945–955. http://doi.org/10.1037/0021-9010.90.5.945
Ajzen, I. (1991). The theory of planned behavior. Organizational Behavior & Human
Decision Processes, 50(2), 179–211.
Ajzen, I., & Fishbein, M. (1980). Understanding attitudes and predicting social behavior.
Englewood Cliffs, NJ: Prentice Hall.
Anseel, F., & Lievens, F. (2006). Certainty as a moderator of feedback reactions? A test
of the strength of the self-verification motive. Journal of Occupational and
Organizational Psychology, 79(4), 533–551.
http://doi.org/10.1348/096317905X71462
Anseel, F., Lievens, F., & Schollaert, E. (2009). Reflection as a strategy to enhance task
performance after feedback. Organizational Behavior and Human Decision
Processes, 110(1), 23–35. http://doi.org/10.1016/j.obhdp.2009.05.003
Argyris, C., & Schön, D. A. (1974). Theory in practice : Increasing professional
effectiveness. San Francisco : Jossey-Bass Publishers, 1974.
Arps, G. F. (1917). A preliminary report on “work with knowledge versus work without
knowledge of results.” Psychological Review, 24(6), 449–455.
Asherman, I., & Asherman, S. (2004). Twenty-five plus role-plays to teach negotiation.
Amherst, MA: HRD Press.
Ashford, S. J., & Cummings, L. L. (1983). Feedback as an individual resource: Personal
strategies of creating information. Organizational Behavior & Human
Performance, 32(3), 370–398.
Ashford, S. J., & DeRue, D. S. (2012). Developing as a leader. Organizational Dynamics,
41(2), 146–154. http://doi.org/10.1016/j.orgdyn.2012.01.008
152
Atwater, L., & Brett, J. (2006). Feedback format: Does it influence manager’s reactions
to feedback? Journal of Occupational and Organizational Psychology, 79(4),
517–532. http://doi.org/10.1348/096317905X58656
Bandura, A. (1977). Social learning theory. Upper Saddle River, NJ: Prentice Hall.
Bandura, A. (1986). Social foundations of thought and action: A social cognitive theory.
New Jersey, U.S.: Prentice Hall.
Bandura, A., & Cervone, D. (1983). Self-evaluative and self-efficacy mechanisms
governing the motivational effects of goal systems. Journal of Personality and
Social Psychology, 45(5), 1017–1028.
Barrick, J. A., & Spilker, B. C. (2003). The relations between knowledge, search strategy,
and performance in unaided and aided information search. Organizational
Behavior and Human Decision Processes, 90(1), 1–18.
http://doi.org/10.1016/S0749-5978(03)00002-5
Baumeister, R. F. (1991). Meanings of life. United States of America: Guilford Press.
Baumeister, R. F., Bratslavsky, E., Finkenauer, C., & Vohs, K. D. (2001). Bad is stronger
than good. Review of General Psychology, 5(4), 323–370.
http://doi.org/10.1037//1089-2680.5.4.323
Bernardin, H. J., & Smith, P. C. (1981). A clarification of some issues regarding the
development and use of behaviorally anchored ratings scales (BARS). Journal of
Applied Psychology, 66(4), 458.
Bidjerano, T., & Dai, D. Y. (2007). The relationship between the big-five model of
personality and self-regulated learning strategies. Learning and Individual
Differences, 17(1), 69–81. http://doi.org/10.1016/j.lindif.2007.02.001
Biron, M., & Bamberger, P. (2010). The impact of structural empowerment on individual
well-being and performance: Taking agent preferences, self-efficacy and
operational constraints into account. Human Relations, 63(2), 163–191.
http://doi.org/10.1177/0018726709337039
Blume, B. D., Ford, J. K., Baldwin, T. T., & Huang, J. L. (2010). Transfer of training: A
meta-analytic review. Journal of Management, 36(4), 1065–1105.
http://doi.org/10.1177/0149206309352880
153
Bohner, G., Bless, H., Schwarz, N., & Strack, F. (1988). What triggers causal
attributions? The impact of valence and subjective probability. European Journal
of Social Psychology, 18, 335–345.
Boninger, D. S., Gleicher, F., & Strathman, A. (1994). Counterfactual thinking: From
what might have been to what may be. Journal of Personality and Social
Psychology, 67(2), 297–307.
Bono, J. E., & Judge, T. A. (2003). Core self-evaluations: A review of the trait and its
role in job satisfaction and job performance. European Journal of Personality,
17(S1), S5–S18. http://doi.org/10.1002/per.481
Boorman, E. D., Behrens, T. E., & Rushworth, M. F. (2011). Counterfactual choice and
learning in a neural network centered on human lateral frontopolar cortex. PLoS
Biology, 9(6), e1001093. http://doi.org/10.1371/journal.pbio.1001093
Bourne Jr, L. E. (1957). Effects of delay of information feedback and task complexity on
the identification of concepts. Journal of Experimental Psychology, 54(3), 201–
207.
Braune, R., & Foshay, W. R. (1983). Towards a practical model of cognitive/information
processing task analysis and schema acquisition for complex problem-solving
situations. Instructional Science, 12(2), 121–145.
Brown, A. L., Bransford, J. D., Ferrara, R. A., & Campione, J. C. (1983). Learning,
remembering, and understanding. In Handbook of child psychology (Flavell &
E.M. Markman, Vol. 3, pp. 77–166). New York, NY: Wiley.
Busby, J. S. (1999). The effectiveness of collective retrospection as a mechanism of
organizational learning. The Journal of Applied Behavioral Science, 35(1), 109–
129. http://doi.org/10.1177/0021886399351009
Butler, A. B., & Scherer, L. L. (1997). The effects of elicitation aids, knowledge, and
problem content on option quantity and quality. Organizational Behavior &
Human Decision Processes, 72(2), 184–202.
Byrne, R. M. (2005). The rational imagination: How people create alternatives to reality.
Cambridge, MA: MIT Press.
Cacioppo, J. T., & Berntson, G. G. (1994). Relationship between attitudes and evaluative
space: A critical review, with emphasis on the separability of positive and
negative substrates. Psychological Bulletin, 115(3), 401–423.
http://doi.org/10.1037/0033-2909.115.3.401
154
Cacioppo, J. T., & Petty, R. E. (1982). The need for cognition. Journal of Personality and
Social Psychology, 42(1), 116–131.
Cacioppo, J. T., Petty, R. E., & Kao, C. F. (1984). The efficient assessment of need for
cognition. Journal of Personality Assessment, 48(3), 306–307.
Cassara, B. (1990). Adult education in a multicultural society. London: UK: Routledge.
Cicchetti, D. V. (1994). Guidelines, criteria, and rules of thumb for evaluating normed
and standardized assessment instruments in psychology. Psychological
Assessment, 6(4), 284–290.
Clandy, A. (1994). Fifty cases for management and supervisory training. Amherst, MA:
HRD Press.
Clause, C. S., Mullins, M. E., Nee, M. T., Pulakos, E., & Schmitt, N. (1998). Parallel test
form development: A procedure for alternate predictors and an example.
Personnel Psychology, 51(1), 193–208.
Coaching. (2016). Retrieved from
http://www.siop.org/Workplace/coaching/coaching_toc.aspx
Colquitt, J. A. (2008). From the editors publishing laboratory research in AMJ: A
question of when, not if. Academy of Management Journal, 51(4), 616–620.
Colquitt, J. A., & Simmering, M. J. (1998). Conscientiousness, goal orientation, and
motivation to learn during the learning process: A longitudinal study. Journal of
Applied Psychology, 83(4), 654–665.
Conger, J. A., & Kanungo, R. N. (1988). The empowerment process: Integrating theory
and practice. The Academy of Management Review, 13(3), 471–482.
http://doi.org/10.2307/258093
Costa, P. T. J., & McCrae, R. R. (1992). Revised NEO personality inventory (NEO-PI-R)
and NEO five-factor inventory (NEO-FFI) professional manual. Odessa, FL:
Psychological Assessment Resources.
Costanza, D. P., Fleishman, E. A., & Marshall-Mies, J. (1999). Knowledges. In N. G.
Peterson, M. D. Mumford, W. C. Borman, P. R. Jeanneret, & E. A. Fleishman
(Eds.), An occupational information system for the 21st century: The development
of ONET. (pp. 71–90). Washington, DC: American Psychological Association.
155
Cronshaw, S. F., & Lord, R. G. (1987). Effects of categorization, attribution, and
encoding processes on leadership perceptions. Journal of Applied Psychology,
72(1), 97–106.
Cummings, L. L., & Schwab, D. P. (1973). Performance in organizations: Determinants
and appraisal. Glenview, IL: Scott Foresman & Co.
Daudelin, M. (1997). Learning from experience through reflection. Organizational
Dynamics, 24(3), 36–48.
Davis, C. G., Lehman, D. R., Wortman, C. B., Cohen Silver, R., & Thompson, S. C.
(1995). The undoing of traumatic life events. Personality & Social Psychology
Bulletin, 21(2), 109–124.
Davis, W. D., Carson, C. M., Ammeter, A. P., & Treadway, D. C. (2005). The interactive
effects of goal orientation and feedback specificity on task performance. Human
Performance, 18(4), 409–426.
de Freitas, S., Rebolledo-Mendez, G., Liarokapis, F., Magoulas, G., & Poulovassilis, A.
(2010). Learning as immersive experiences: Using the four-dimensional
framework for designing and evaluating immersive learning experiences in a
virtual world. British Journal of Educational Technology, 41(1), 69–85.
http://doi.org/10.1111/j.1467-8535.2009.01024.x
Deci, E. L., & Ryan, R. M. (1992). The initiation and regulation of intrinsically motivated
learning and achievement. In A. K. Boggiano & T. S. Pittman (Eds.),
Achievement and motivation: A social-developmental perspective. (pp. 9–36).
New York, NY: Cambridge University Press.
DeRue, D. S., Nahrgang, J. D., Hollenbeck, J. R., & Workman, K. (2012). A quasi-
experimental study of after-event reviews and leadership development. Journal of
Applied Psychology, 97(5), 997–1015. http://doi.org/10.1037/a0028244
DeRue, D. S., & Wellman, N. (2009). Developing leaders via experience: The role of
developmental challenge, learning orientation, and feedback availability. Journal
of Applied Psychology, 94(4), 859–875. http://doi.org/10.1037/a0015317
Dewey, J. (1933). How we think. Oxford, England: Heath.
Dormann, T., & Frese, M. (1994). Error management training: Replication and the
function of exploratory behavior. International Journal of Human-Computer
Interaction, 6, 1129–1141.
156
Dweck, C. S. (1986). Motivational processes affecting learning. American Psychologist,
41(10), 1040–1048.
Dweck, C. S., & Leggett, E. L. (2000). A social-cognitive approach to motivation and
personality. In E. T. Higgins, A. W. Kruglanski, E. T. (Ed) Higgins, & A. W. (Ed)
Kruglanski (Eds.), Motivational science: Social and personality perspectives. (pp.
394–415). New York, NY: Psychology Press.
Dyczewski, E. A., & Markman, K. D. (2012). General attainability beliefs moderate the
motivational effects of counterfactual thinking. Journal of Experimental Social
Psychology, 48(5), 1217–1220. http://doi.org/10.1016/j.jesp.2012.04.016
Earley, P. C., Northcraft, G. B., Lee, C., & Lituchy, T. R. (1990). Impact of process and
outcome feedback on the relation of goal setting to task performance. Academy of
Management Journal, 33(1), 87–105.
Ellis, S., Carette, B., Anseel, F., & Lievens, F. (2014). Systematic reflection: Implications
for learning from failures and successes. Current Directions in Psychological
Science, 23(1), 67–72. http://doi.org/10.1177/0963721413504106
Ellis, S., & Davidi, I. (2005). After-event reviews: Drawing lessons from successful and
failed experience. Journal of Applied Psychology, 90(5), 857–871.
http://doi.org/10.1037/0021-9010.90.5.857
Ellis, S., Ganzach, Y., Castle, E., & Sekely, G. (2010). The effect of filmed versus
personal after-event reviews on task performance: The mediating and moderating
role of self-efficacy. Journal of Applied Psychology, 95(1), 122–131.
http://doi.org/10.1037/a0017867
Ellis, S., Mendel, R., & Aloni-Zohar, M. (2009). The effect of accuracy of performance
evaluation on learning from experience: The moderating role of after-event
reviews. Journal of Applied Social Psychology, 39(3), 541–563.
Ellis, S., Mendel, R., & Nir, M. (2006). Learning from successful and failed experience:
The moderating role of kind of after-event review. Journal of Applied
Psychology, 91(3), 669–680. http://doi.org/10.1037/0021-9010.91.3.669
Epitropaki, O., Sy, T., Martin, R., Tram-Quon, S., & Topakas, A. (2013). Implicit
leadership and followership theories “in the wild”: Taking stock of information-
processing approaches to leadership and followership in organizational settings.
The Leadership Quarterly, 24(6), 858–881.
http://doi.org/10.1016/j.leaqua.2013.10.005
157
Epstude, K., & Roese, N. J. (2008). The functional theory of counterfactual thinking.
Personality and Social Psychology Review, 12(2), 168–192.
http://doi.org/10.1177/1088868308316091
Erez, A., & Judge, T. A. (2001). Relationship of core self-evaluations to goal setting,
motivation, and performance. Journal of Applied Psychology, 86(6), 1270–1279.
Eylon, D., & Herman, S. (1999). Exploring empowerment: One method for the
classroom. Journal of Management Education, 23(1), 80–94.
Fedor, D. B., Davis, W. D., Maslyn, J. M., & Mathieson, K. (2001). Performance
improvement efforts in response to negative feedback: The roles of source power
and recipient self-esteem. Journal of Management, 27, 79–97.
Festinger, L. (1957). A theory of cognitive dissonance. Standford, CA: Standford
University Press.
Feys, M., Anseel, F., & Wille, B. (2011). Improving feedback reports: The role of
procedural information and information specificity. Academy of Management
Learning & Education, 10(4), 661–681. http://doi.org/10.5465/amle.2010.0054
Field, A. (2013). Discovering statistics using IBM SPSS (4th ed.). London: SAGE.
Fiske, S. T., & Berdahl, J. L. (2007). Social power. In A. Kruglanski & E. Higgins (Eds.),
Social psychology: A handbook of basic principles (2nd ed., pp. 678–692). New
York: Guilford Press.
Forgas, J. P., & George, J. M. (2001). Affective Influences on Judgments and Behavior in
Organizations: An Information Processing Perspective. Organizational Behavior
and Human Decision Processes, 86(1), 3–34.
http://doi.org/10.1006/obhd.2001.2971
Frese, M. (1995). Error management in training: Conceptual and empirical results. In C.
Zucchermaglio, S. Bagnara, & S. Stucky (Eds.), Organizational Learning and
Technological Change (Vol. 141, pp. 112–124). Springer Berlin Heidelberg.
Retrieved from http://dx.doi.org/10.1007/978-3-642-79550-3_7
Frese, M., & Zapf, D. (1994). Action as the core of work psychology: A German
approach. In H. C. Triandis, M. D. Dunnette, L. M. Hough, H. C. (Ed) Triandis,
M. D. (Ed) Dunnette, & L. M. (Ed) Hough (Eds.), Handbook of industrial and
organizational psychology. (2nd ed., Vol. 4, pp. 271–340). Palo Alto, CA, US:
Consulting Psychologists Press.
158
Fund, Z., Court, D., & Kramarski, B. (2002). Construction and application of an
evaluative tool to assess reflection in teacher-training courses. Assessment &
Evaluation in Higher Education, 27(6), 485–499.
Galinsky, A. D., Gruenfeld, D. H., & Magee, J. C. (2003). From power to action. Journal
of Personality and Social Psychology, 85(3), 453–466.
http://doi.org/10.1037/0022-3514.85.3.453
Galinsky, A. D., Magee, J. C., Gruenfeld, D. H., Whitson, J. A., & Liljenquist, K. A.
(2008). Power reduces the press of the situation: Implications for creativity,
conformity, and dissonance. Journal of Personality and Social Psychology, 95(6),
1450–1466. http://doi.org/10.1037/a0012633
Gegenfurtner, A., Veermans, K., Festner, D., & Gruber, H. (2009). Integrative literature
review: Motivation to transfer training: An integrative literature review. Human
Resource Development Review, 8(3), 403–423.
http://doi.org/10.1177/1534484309335970
Gilbar, O., & Hevroni, A. (2007). Counterfactuals, coping strategies and psychological
distress among breast cancer patients. Anxiety, Stress, & Coping, 20(4), 382–392.
Gollwitzer, P. M., & Sheeran, P. (2006). Implementation intentions and goal
achievement: A meta‐analysis of effects and processes. Advances in Experimental
Social Psychology, 38, 69–119.
Goodman, J. S., Wood, R. E., & Chen, Z. (2011). Feedback specificity, information
processing, and transfer of training. Organizational Behavior and Human
Decision Processes, 115(2), 253–267. http://doi.org/10.1016/j.obhdp.2011.01.001
Goodman, J. S., Wood, R. E., & Hendrickx, M. (2004). Feedback specificity, exploration,
and learning. Journal of Applied Psychology, 89(2), 248–262.
http://doi.org/10.1037/0021-9010.89.2.248
Guinote, A. (2007a). Behaviour variability and the situated focus theory of power.
European Review of Social Psychology, 18(1), 256–295.
http://doi.org/10.1080/10463280701692813
Guinote, A. (2007b). Power affects basic cognition: Increased attentional inhibition and
flexibility. Journal of Experimental Social Psychology, 43(5), 685–697.
http://doi.org/10.1016/j.jesp.2006.06.008
Gurtner, A., Tschan, F., Semmer, N. K., & Nägele, C. (2007). Getting groups to develop
good strategies: Effects of reflexivity interventions on team process, team
159
performance, and shared mental models. Organizational Behavior and Human
Decision Processes, 102(2), 127–142. http://doi.org/10.1016/j.obhdp.2006.05.002
Hackman, J. R., & Lawler, E. E. (1971). Employee reactions to job characteristics.
Journal of Applied Psychology, 55(3), 259–286.
Hackman, J. R., & Oldham, G. R. (1976). Motivation through the design of work: Test of
a theory. Organizational Behavior & Human Performance, 16(2), 250–279.
Hair, J. F., Black, W. C., Babin, B. J., & Anderson, R. E. (2010). Multivariate data
analysis (7th ed.). Upper Saddle River, NJ: Prentice Hall.
Hallgren, K. A. (2012). Computing inter-rater reliability for observational data: an
overview and tutorial. Tutorials in Quantitative Methods for Psychology, 8(1), 23.
Harrison, J. R., Lin, Z., Carroll, G. R., & Carley, K. M. (2007). Simulation modeling in
organizational and management research. Academy of Management Review,
32(4), 1229–1245.
Hayes, A. F. (2012). PROCESS: A versatile computational tool for observed variable
mediation, moderation, and conditional process modeling. Retrieved from
http://www.personal.psu.edu/jxb14/M554/articles/process2012.pdf
Hayes, A. F. (2013). Introduction to mediation, moderation, and conditional process
analysis: A regression-based approach. New York, NY: Guilford Press.
Hayes, A. F., & Preacher, K. J. (2013). Conditional process modeling: Using structural
equation modeling to examine contingent causal processes. In G. R. Hancock &
R. O. Mueller, Structural equation modeling: A second course (pp. 219–266).
Charolette, NC: Information Age Publishing, Inc.
Herold, D. M., & Greller, M. M. (1977). Feedback the definition of a construct. Academy
of Management Journal, 20(1), 142–147.
Hill, L. A. (1997). Building effective one-on-one work relationships. Harvard Business
School Note 9-497-028.
Hinkin, T. R., & Tracey, J. B. (1999). An analysis of variance approach to content
validation. Organizational Research Methods, 2(2), 175–186.
http://doi.org/10.1177/109442819922004
Hullfish, G., & Smith, P. G. (1961). Reflective thinking: The method of education. New
York, NY: Dodd Mead Publishers.
160
Ilgen, D. R., & Davis, C. A. (2000). Bearing bad news: Reactions to negative
performance feedback. Applied Psychology: An International Review, 49(3), 550–
565.
Ilgen, D. R., Fisher, C. D., & Taylor, M. S. (1979). Consequences of individual feedback
on behavior in organizations. Journal of Applied Psychology, 64(4), 349–371.
Ingram, R. E. (1984). Information processing and feedback: Effects of mood and
information favorability on the cognitive processing of personally relevant
information. Cognitive Therapy and Research, 8(4), 371–386.
Ito, T. A., Larson, J. T., Smith, N. K., & Cacioppo, J. T. (1998). Negative information
weighs more heavily on the brain: The negativity bias in evaluative
categorizations. Journal of Personality & Social Psychology, 75(5), 887–900.
Ivancic, K., & Hesketh, B. (2000). Learning from errors in a driving simulation: Effects
on driving skill and self-confidence. Ergonomics, 43(12), 1966–1984.
Jacobs, R., Kafry, D., & Zedeck, S. (1980). Expectations of behaviorally anchored rating
scales. Personnel Psychology, 33(3), 595–640.
Joy, S., & Kolb, D. A. (2009). Are there cultural differences in learning style?
International Journal of Intercultural Relations, 33(1), 69–85.
http://doi.org/10.1016/j.ijintrel.2008.11.002
Judge, T. A., Bono, J. E., & Locke, E. A. (2000). Personality and job satisfaction: The
mediating role of job characteristics. Journal of Applied Psychology, 85(2), 237–
249.
Judge, T. A., Locke, E. A., & Durham, C. C. (1997). The dispositional causes of job
satisfaction: A core evaluations approach. Research in Organizational Behavior,
19, 151–188.
Judge, T. A., Locke, E. A., Durham, C. C., & Kluger, A. N. (1998). Dispositional effects
on job and life satisfaction: the role of core evaluations. Journal of Applied
Psychology, 83(1), 17–34.
Junker, N. M., & van Dick, R. (2014). Implicit theories in organizational settings: A
systematic review and research agenda of implicit leadership and followership
theories. The Leadership Quarterly, 25(6), 1154–1173.
http://doi.org/10.1016/j.leaqua.2014.09.002
161
Kahneman, D., & Miller, D. T. (1986). Norm theory: Comparing reality to its
alternatives. Psychological Review, 93(2), 136–153. http://doi.org/10.1037/0033-
295X.93.2.136
Kahneman, D., & Tversky, A. (1979). Prospect theory: An analysis of decision under
risk. Econometrica, (2), 263–292. http://doi.org/10.2307/1914185
Kahneman, D., & Tversky, A. (1982). The simulation heuristic. In Judgment under
uncertainty: Heuristics and biases (D. Kahneman, E. Slovic, A. Tversky, pp.
201–208). New York, NY: Cambridge University Press.
Keith, N., & Frese, M. (2005). Self-regulation in error management training: Emotion
control and metacognition as mediators of performance effects. Journal of
Applied Psychology, 90(4), 677–691. http://doi.org/10.1037/0021-9010.90.4.677
Keith, N., & Frese, M. (2008). Effectiveness of error management training: A meta-
analysis. Journal of Applied Psychology, 93(1), 59–69.
http://doi.org/10.1037/0021-9010.93.1.59
Keltner, D., Gruenfeld, D. H., & Anderson, C. (2003). Power, approach, and inhibition.
Psychological Review, 110(2), 265–284. http://doi.org/10.1037/0033-
295X.110.2.265
Kinicki, A. J., Prussia, G. E., Wu, B. (Joshua), & McKee-Ryan, F. M. (2004). A
covariance structure analysis of employees’ response to performance feedback.
Journal of Applied Psychology, 89(6), 1057–1069. http://doi.org/10.1037/0021-
9010.89.6.1057
Kluger, A. N., & DeNisi, A. (1996). The effects of feedback interventions on
performance: A historical review, a meta-analysis, and a preliminary feedback
intervention theory. Psychological Bulletin, 119(2), 254–284.
http://doi.org/http://dx.doi.org/10.1037/0033-2909.119.2.254
Kolb, D. A. (1983). Experiential learning: Experience as the source of learning and
development. Englewood Cliffs, NJ: Prentice Hall.
Komarraju, M., Karau, S. J., Schmeck, R. R., & Avdic, A. (2011). The Big Five
personality traits, learning styles, and academic achievement. Personality and
Individual Differences, 51(4), 472–477. http://doi.org/10.1016/j.paid.2011.04.019
Kray, L. J., Galinsky, A. D., & Markman, K. D. (2009). Counterfactual structure and
learning from experience in negotiations. Journal of Experimental Social
Psychology, 45(4), 979–982. http://doi.org/10.1016/j.jesp.2009.03.008
162
Krenn, B., Würth, S., & Hergovich, A. (2013). The impact of feedback on goal setting
and task performance: Testing the feedback intervention theory. Swiss Journal of
Psychology, 72(2), 79–89. http://doi.org/10.1024/1421-0185/a000101
Landis, J. R., & Koch, G. G. (1977). The measurement of observer agreement for
categorical data. Biometrics, 33(1), 159. http://doi.org/10.2307/2529310
Laschinger, H. K., Finegan, J., Shamian, J., & Wilk, P. (2001). Impact of structural and
psychological empowerment on job strain in nursing work settings: Expanding
Kanter’s model. The Journal of Nursing Administration, 31(5), 260–272.
Latham, G. P., & Locke, E. A. (1991). Self-regulation through goal setting.
Organizational Behavior & Human Decision Processes, 50(2), 212–247.
LeBreton, J. M., & Senter, J. L. (2008). Answers to 20 questions about interrater
reliability and interrater agreement. Organizational Research Methods, 11(4),
815–852. http://doi.org/10.1177/1094428106296642
Lewicki, R. J., Barry, B., & Saunders, D. M. (2015). Negotiation: Readings, exercises,
and cases (7th ed.). New York, NY: McGraw-Hill Education.
Lewicki, R. J., Saunders, D. M., & Barry, B. (2011). Essentials of negotiation. (5th ed.).
New York, NY: McGraw-Hill.
Lievens, F., & Anseel, F. (2007). Creating alternate in-basket forms through cloning:
Some preliminary results. International Journal of Selection and Assessment,
15(4), 428–433.
Lievens, F., Buyse, T., & Sackett, P. R. (2005). Retest effects in operational selection
settings: Development and test of a framework. Personnel Psychology, 58(4),
981–1007.
Lievens, F., & Sackett, P. R. (2007). Situational judgment tests in high-stakes settings:
Issues and strategies with generating alternate forms. Journal of Applied
Psychology, 92(4), 1043–1055. http://doi.org/10.1037/0021-9010.92.4.1043
Locke, E. A., & Latham, G. P. (1990). A theory of goal setting & task performance.
Englewood Cliffs, NJ: Prentice-Hall.
Locke, E. A., & Latham, G. P. (2002). Building a practically useful theory of goal setting
and task motivation: A 35-year odyssey. American Psychologist, 57(9), 705–717.
http://doi.org/10.1037//0003-066X.57.9.705
163
Logan, M. S., & Ganster, D. C. (2007). The effects of empowerment on attitudes and
performance: The role of social support and empowerment beliefs. Journal of
Management Studies, 44(8), 1523–1550. http://doi.org/10.1111/j.1467-
6486.2007.00711.x
Markman, K. D., Elizaga, R. A., Ratcliff, J. J., & McMullen, M. N. (2007). The interplay
between counterfactual reasoning and feedback dynamics in producing inferences
about the self. Thinking & Reasoning, 13(2), 188–206.
http://doi.org/10.1080/13546780600927157
Markman, K. D., Gavanski, I., Sherman, S. J., & McMullen, M. N. (1993). The mental
simulation of better and worse possible worlds. Journal of Experimental Social
Psychology, 29(1), 87–109. http://doi.org/10.1006/jesp.1993.1005
Markman, K. D., Gavanski, I., Sherman, S. J., & McMullen, M. N. (1995). The impact of
perceived control on the imagination of better and worse possible worlds.
Personality and Social Psychology Bulletin, 21(6), 588–595.
http://doi.org/10.1177/0146167295216005
Markman, K. D., McMullen, M. N., & Elizaga, R. A. (2008). Counterfactual thinking,
persistence, and performance: A test of the Reflection and Evaluation Model.
Journal of Experimental Social Psychology, 44(2), 421–428.
http://doi.org/10.1016/j.jesp.2007.01.001
Markman, K. D., McMullen, M. N., Elizaga, R. A., & Mizoguchi, N. (2006).
Counterfactual thinking and regulatory fit. Judgment and Decision Making, 1(2),
98–107.
Markman, K. D., & Miller, A. K. (2006). Depression, control, and counterfactual
thinking: Functional for whom? Journal of Social and Clinical Psychology, 25(2),
210.
Markman, K. D., & Tetlock, P. E. (2000). “I couldn’t have known”: Accountability,
foreseeability and counterfactual denials of responsibility. British Journal of
Social Psychology, 39(3), 313–325.
Marsh, R. L., Ward, T. B., & Landau, J. D. (1999). The inadvertent use of prior
knowledge in a generative cognitive task. Memory & Cognition, 27(1), 94–105.
Maurer, T. J. (2001). Career-relevant learning and development, worker age, and beliefs
about self-efficacy for development. Journal of Management, 27(2), 123.
164
Maurer, T. J., Pierce, H. R., & Shore, L. M. (2002). Perceived beneficiary of employee
development activity: A three-dimensional social exchange model. Academy of
Management Review, 27(3), 432–444.
Maynard, M. T., Gilson, L. L., & Mathieu, J. E. (2012). Empowerment--fad or fab? A
multilevel review of the past two decades of research. Journal of Management,
38(4), 1231–1281. http://doi.org/10.1177/0149206312438773
McCrae, R. R., & Costa, P. T. (1987). Validation of the five-factor model of personality
across instruments and observers. Journal of Personality and Social Psychology,
52(1), 81–90.
McGraw, K. O., & Wong, S. P. (1996). Forming inferences about some intraclass
correlation coefficients. Psychological Methods, 1(1), 30.
McMullen, M. N., & Markman, K. D. (2000). Downward counterfactuals and motivation:
The wake-up call and the pangloss effect. Personality and Social Psychology
Bulletin, 26(5), 575–584. http://doi.org/10.1177/0146167200267005
Mero, N. P., & Motowidlo, S. J. (1995). Effects of rater accountability on the accuracy
and the favorability of performance ratings. Journal of Applied Psychology, 80(4),
517.
Miller, L. (2013). ASTD’s 2013 state of the industry report: Workplace learning. T+D,
67(11), 40–45.
Moon, J. A. (1999). Reflection in learning & professional development: Theory &
practice.
Morris, M. W., & Moore, P. C. (2000). The lessons we (don’t) learn: Counterfactual
thinking and organizational accountability after a close call. Administrative
Science Quarterly, 45(4), 737–765.
Mumford, M. D., & Peterson, N. G. (Eds.). (1999). The O*NET Content Model:
Structural considerations in describing jobs. In An occupational information
system for the 21st century: The development of ONET. (pp. 21–30). Washington,
DC: American Psychological Association.
Mumford, T. V., Campion, M. A., & Morgeson, F. P. (2007). The leadership skills
strataplex: Leadership skill requirements across organizational levels. The
Leadership Quarterly, 18(2), 154–166.
http://doi.org/10.1016/j.leaqua.2007.01.005
165
Nadler, D. A. (1979). The effects of feedback on task group behavior: A review of the
experimental research. Organizational Behavior and Human Performance, 23(3),
309–338.
Nasco, S. A., & Marsh, K. L. (1999). Gaining control through counterfactual thinking.
Personality and Social Psychology Bulletin, 25(5), 556–568.
N’gbala, A., & Branscombe, N. (2003). Causal attribution and counterfactual thinking -
when does performing one facilitate performance of the other. Swiss Journal of
Psychology, 62(4), 209–218. http://doi.org/10.1024/1421-0185.62.4.209
Noe, R. A. (1986). Trainees’ attributes and attitudes: Neglected influences on training
effectiveness. Academy of Management Review, 11(4), 736–749.
Noe, R. A., & Colquitt, J. A. (2002). Planning for training impact: Principles of training
effectiveness. In Creating, implementing, and maintaining effective training and
development: State-of-the-art lessons for practice (K. Kraiger, pp. 53–79). San
Francisco, CA: Jossey-Bass Inc.
Noe, R. A., Hollenbeck, J. R., Gerhart, B., & Wright, P. M. (2014). Fundamentals of
human resource management. (5th ed.). New York, NY: McGraw-Hill/Irwin.
Northcraft, G. B., Schmidt, A. M., & Ashford, S. J. (2011). Feedback and the rationing of
time and effort among competing tasks. Journal of Applied Psychology, 96(5),
1076–1086. http://doi.org/10.1037/a0023221
Pallant, J. (2013). SPSS survival manual: A step by step guide to data analysis using IBM
SPSS (5th ed.). Maidenhead, Berkshire, England: McGraw Hill.
Payne, R. B., & Hauty, G. T. (1955). Effect of psychological feedback upon work
decrement. Journal of Experimental Psychology, 50(6), 343–351.
Perkins, D. N. (1988). Creativity and the quest for mechanism. In The psychology of
human thought (Sternberg, Robert J.; Smith, Edward E., pp. 309–336). New
York, NY: Cambridge University Press.
Peterson, N. G., Mumford, M. D., Borman, W. C., Jeanneret, P. R., Fleishman, E. A.,
Levin, K. Y., … Dye, D. M. (2001). Understanding work using the occupational
information network (O*NET): Implications for practice and research. Personnel
Psychology, 54(2), 451–492.
166
Petrocelli, J. V., Seta, C. E., & Seta, J. J. (2013). Dysfunctional counterfactual thinking:
When simulating alternatives to reality impedes experiential learning. Thinking &
Reasoning, 19(2), 205–230.
Phillips, J. M., & Gully, S. M. (1997). Role of goal orientation, ability, need for
achievement, and locus of control in the self-efficacy and goal–setting process.
Journal of Applied Psychology, 82(5), 792.
Pierro, A., Leder, S., Mannetti, L., Tory Higgins, E., Kruglanski, A. W., & Aiello, A.
(2008). Regulatory mode effects on counterfactual thinking and regret. Journal of
Experimental Social Psychology, 44(2), 321–329.
http://doi.org/10.1016/j.jesp.2007.06.002
Platt, M. L., & Hayden, B. (2011). Learning: Not just the facts, ma’am, but the
counterfactuals as well. PLoS Biology, 9(6), e1001092.
Podsakoff, P. M., MacKenzie, S. B., Lee, J.-Y., & Podsakoff, N. P. (2003). Common
method biases in behavioral research: A critical review of the literature and
recommended remedies. Journal of Applied Psychology, 88(5), 879–903.
http://doi.org/10.1037/0021-9010.88.5.879
Podsakoff, P. M., & Organ, D. W. (1986). Self-reports in organizational research:
Problems and prospects. Journal of Management, 12(4), 531–544.
Preacher, K. J., & Hayes, A. F. (2004). SPSS and SAS procedures for estimating indirect
effects in simple mediation models. Behavior Research Methods, Instruments, &
Computers, 36(4), 717–731.
Raelin, J. A. (2007). Toward an epistemology of practice. Academy of Management
Learning & Education, 6(4), 495–519.
Rapp, A., Ahearne, M., Mathieu, J., & Schillewaert, N. (2006). The impact of knowledge
and empowerment on working smart and working hard: The moderating role of
experience. International Journal of Research in Marketing, 23(3), 279–293.
http://doi.org/10.1016/j.ijresmar.2006.02.003
Rim, S., & Summerville, A. (2014). How far to the road not taken? The effect of
psychological distance on counterfactual direction. Personality and Social
Psychology Bulletin, 40(3), 391–401. http://doi.org/10.1177/0146167213513304
Roese, N. J. (1994). The functional basis of counterfactual thinking. Journal of
Personality & Social Psychology, 66(5), 805–818.
167
Roese, N. J. (1997). Counterfactual thinking. Psychological Bulletin, 121(1), 133–148.
Roese, N. J., & Olson, J. M. (1993). The structure of counterfactual thought. Personality
and Social Psychology Bulletin, 19(3), 312–319.
http://doi.org/10.1177/0146167293193008
Roese, N. J., & Olson, J. M. (1995). Outcome controllability and counterfactual thinking.
Personality and Social Psychology Bulletin, 21(6), 620–628.
http://doi.org/10.1177/0146167295216008
Roese, N. J., & Olson, J. M. (1997). Counterfactual thinking: The intersection of affect
and function. In Advances in experimental social psychology (M.P Zanna, Vol.
29, pp. 1–59). San Diego, CA: Academic Press.
Ryan, M., & Ryan, M. (2013). Theorising a model for teaching and assessing reflective
learning in higher education. Higher Education Research & Development, 32(2),
244–257. http://doi.org/10.1080/07294360.2012.661704
Sanna, L., & Chang, E. (2003). The past is not what it used to be: Optimists’ use of
retroactive pessimism to diminish the sting of failure. Journal of Research in
Personality, 37(5), 388–404.
Sanna, L. J. (1997). Self-efficacy and counterfactual thinking: Up a creek with and
without a paddle. Personality and Social Psychology Bulletin, 23(6), 654–666.
Sanna, L. J. (2000). Mental simulation, affect, and personality: A conceptual framework.
Current Directions in Psychological Science, 9(5), 168–173.
http://doi.org/10.1111/1467-8721.00086
Sanna, L. J., & Turley, K. J. (1996). Antecedents to spontaneous counterfactual thinking:
Effects of expectancy violation and outcome valence. Personality and Social
Psychology Bulletin, 22(9), 906–919. http://doi.org/10.1177/0146167296229005
Scandura, T. A., & Williams, E. A. (2000). Research methodology in management:
Current practices, trends, and implications for future research. Academy of
Management Journal, 43(6), 1248–1264.
Schmidt, F. L., Hunter, J. E., & Outerbridge, A. N. (1986). Impact of job experience and
ability on job knowledge, work sample performance, and supervisory ratings of
job performance. Journal of Applied Psychology, 71(3), 432–439.
168
Scholl, A., & Sassenberg, K. (2014). Where could we stand if I had…? How social power
impacts counterfactual thinking after failure. Journal of Experimental Social
Psychology, 53, 51–61.
Schwab, D. P., Heneman, H. G., & DeCotiis, T. A. (1975). Behaviorally anchored rating
scales: A review of the literature. Personnel Psychology, 28(4), 549–562.
Secchi, D. (2015). A case for agent-based models in organizational behavior and team
research. Team Performance Management: An International Journal, 21(1/2),
37–50. http://doi.org/10.1108/TPM-12-2014-0063
Sedikides, C., & Strube, M. J. (1997). Self-evaluation: To thine own self be good, to
thine own self be sure, to thine own self be true, and to thine own self be better.
Advances in Experimental Social Psychology, 29, 209–269.
Seibert, S. E., Wang, G., & Courtright, S. H. (2011). Antecedents and consequences of
psychological and team empowerment in organizations: A meta-analytic review.
Journal of Applied Psychology, 96(5), 981–1003.
http://doi.org/10.1037/a0022676
Severiens, S. E., & ten Dam, G. T. M. (1994). Gender Differences in Learning Styles: A
Narrative Review and Quantitative Meta-Analysis. Higher Education, (4), 487–
501.
Shah, J. Y., Friedman, R., & Kruglanski, A. W. (2002). Forgetting all else: On the
antecedents and consequences of goal shielding. Journal of Personality and
Social Psychology, 83(6), 1261–1280. http://doi.org/10.1037//0022-
3514.83.6.1261
Sheeran, P., Webb, T. L., & Gollwitzer, P. M. (2005). The interplay between goal
intentions and implementation intentions. Personality & Social Psychology
Bulletin, 31(1), 87–98.
Shondrick, S. J., & Lord, R. G. (2010). Implicit leadership and followership theories:
Dynamic structures for leadership perceptions, memory, leader–follower
processes. In International Review of Industrial and Organizational Psychology
(G. P. Hodgkinson, J. K. Ford, pp. 1–33).
Slabu, L., & Guinote, A. (2010). Getting what you want: Power increases the
accessibility of active goals. Journal of Experimental Social Psychology, 46(2),
344–349. http://doi.org/10.1016/j.jesp.2009.10.013
169
Smallman, R. (2013). It’s what’s inside that counts: The role of counterfactual content in
intention formation. Journal of Experimental Social Psychology, 49(5), 842–851.
http://doi.org/10.1016/j.jesp.2013.05.004
Smith, P. C., & Kendall, L. M. (1963). Retranslation of expectations: An approach to the
construction of unambiguous anchors for rating scales. Journal of Applied
Psychology, 47(2), 149–155. http://doi.org/10.1037/h0047060
Smither, J. W., Brett, J. F., & Atwater, L. E. (2007). What do leaders recall about their
multisource feedback? Journal of Leadership & Organizational Studies, 14(3),
202–218. http://doi.org/10.1177/1071791907308463
Spreitzer, G. G. (2008). Taking stock: a review of more than twenty years of research on
empowerment at work. The SAGE Handbook of Organizational Behavior:
Volume One: Micro Approaches, 1, 54–72.
Spreitzer, G. M. (1995). Psychological, empowerment in the workplace: Dimensions,
measurement and validation. Academy of Management Journal, 38(5), 1442–
1465. http://doi.org/10.2307/256865
Spreitzer, G. M., Kizilos, M. A., & Nason, S. W. (1997). A dimensional analysis of the
relationship between psychological empowerment, effectiveness, satisfaction, and
strain. Journal of Management, 23(5), 679–704.
Thomas, K. W., & Velthouse, B. A. (1990). Cognitive elements of empowerment: An
“interpretive” model of intrinsic task motivation. Academy of Management
Review, 15(4), 666–681.
Thornton, G. C., & Cleveland, J. N. (1990). Developing managerial talent through
simulation. American Psychologist, 45(2), 190–199.
VandeWalle, D., Cron, W. L., & Slocum, J. W. J. (2001). The role of goal orientation
following performance feedback. Journal of Applied Psychology, 86(4), 629–640.
Villado, A. J., & Arthur, W. (2013). The comparative effect of subjective and objective
after-action reviews on team performance on a complex task. Journal of Applied
Psychology, 98(3), 514–528. http://doi.org/10.1037/a0031510
Vroom, V. H. (1964). Work and motivation. Oxford England: Wiley.
Welch, B. L. (1951). On the comparison of several mean values: An alternative approach.
Biometrika, 38(3/4), 330–336.
170
Wells, G. L., Taylor, B. R., & Turtle, J. W. (1987). The undoing of scenarios. Journal of
Personality and Social Psychology, 53(3), 421–430. http://doi.org/10.1037/0022-
3514.53.3.421
Wong, E. M., Haselhuhn, M. P., & Kray, L. J. (2012). Improving the future by
considering the past: The impact of upward counterfactual reflection and implicit
beliefs on negotiation performance. Journal of Experimental Social Psychology,
48(1), 403–406. http://doi.org/10.1016/j.jesp.2011.07.014

171
APPENDICES
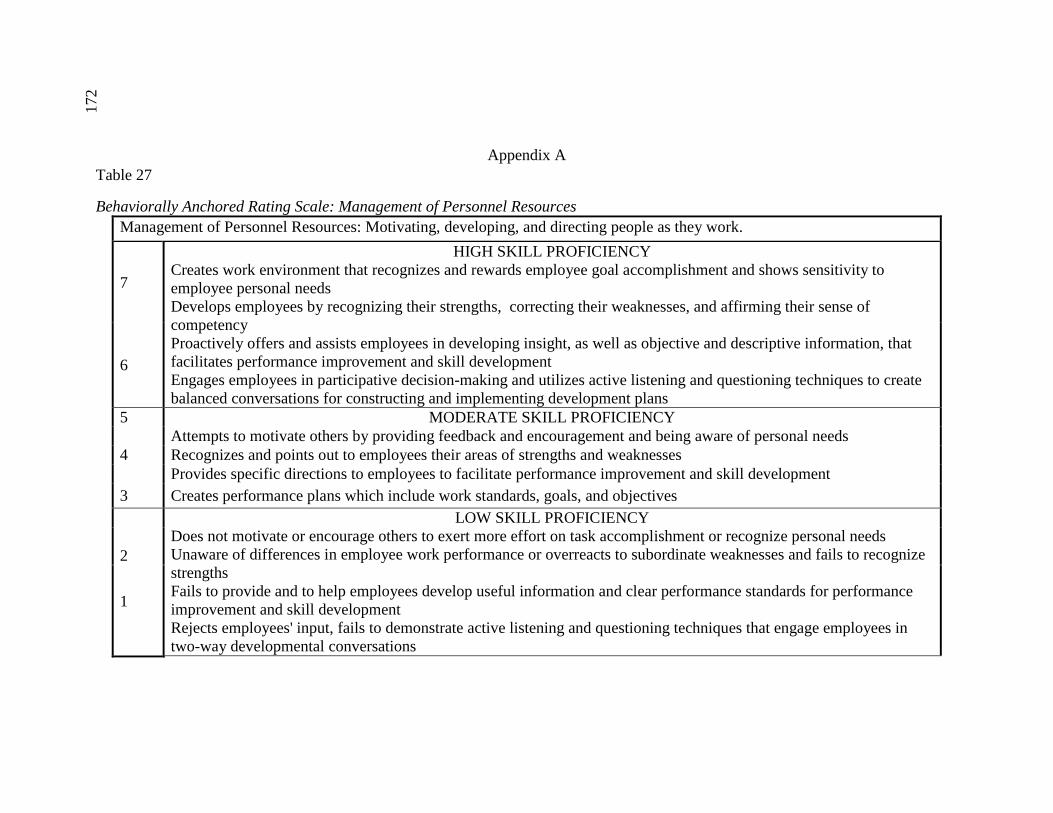
172
Appendix A
Table 27
Behaviorally Anchored Rating Scale: Management of Personnel Resources
Management of Personnel Resources: Motivating, developing, and directing people as they work.
7
HIGH SKILL PROFICIENCY
Creates work environment that recognizes and rewards employee goal accomplishment and shows sensitivity to
employee personal needs
Develops employees by recognizing their strengths, correcting their weaknesses, and affirming their sense of
competency
Proactively offers and assists employees in developing insight, as well as objective and descriptive information, that
facilitates performance improvement and skill development
Engages employees in participative decision-making and utilizes active listening and questioning techniques to create
balanced conversations for constructing and implementing development plans
6
5 MODERATE SKILL PROFICIENCY
Attempts to motivate others by providing feedback and encouragement and being aware of personal needs
4 Recognizes and points out to employees their areas of strengths and weaknesses
Provides specific directions to employees to facilitate performance improvement and skill development
3 Creates performance plans which include work standards, goals, and objectives
LOW SKILL PROFICIENCY
Does not motivate or encourage others to exert more effort on task accomplishment or recognize personal needs
Unaware of differences in employee work performance or overreacts to subordinate weaknesses and fails to recognize
strengths
Fails to provide and to help employees develop useful information and clear performance standards for performance
improvement and skill development
Rejects employees' input, fails to demonstrate active listening and questioning techniques that engage employees in
two-way developmental conversations
2
1
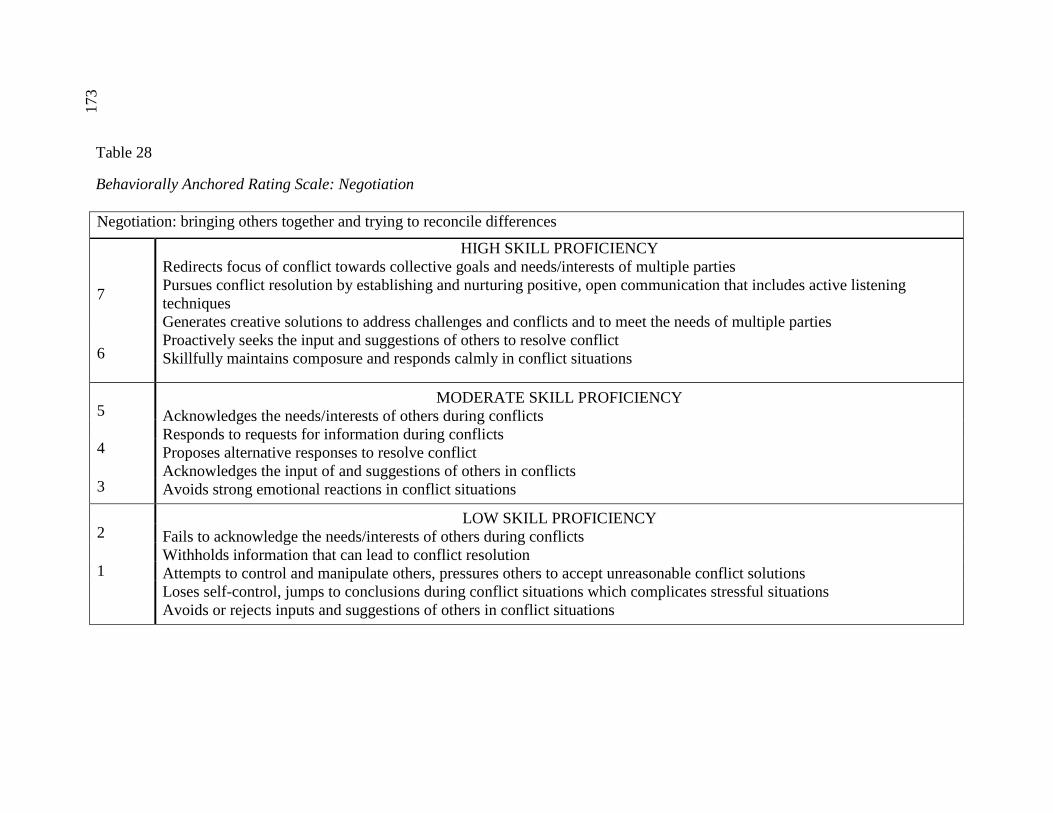
173
Table 28
Behaviorally Anchored Rating Scale: Negotiation
Negotiation: bringing others together and trying to reconcile differences
HIGH SKILL PROFICIENCY
Redirects focus of conflict towards collective goals and needs/interests of multiple parties
Pursues conflict resolution by establishing and nurturing positive, open communication that includes active listening
techniques
Generates creative solutions to address challenges and conflicts and to meet the needs of multiple parties
Proactively seeks the input and suggestions of others to resolve conflict
Skillfully maintains composure and responds calmly in conflict situations
7
6
5 MODERATE SKILL PROFICIENCY
Acknowledges the needs/interests of others during conflicts
Responds to requests for information during conflicts
Proposes alternative responses to resolve conflict
Acknowledges the input of and suggestions of others in conflicts
Avoids strong emotional reactions in conflict situations
4
3
LOW SKILL PROFICIENCY
Fails to acknowledge the needs/interests of others during conflicts
Withholds information that can lead to conflict resolution
Attempts to control and manipulate others, pressures others to accept unreasonable conflict solutions
Loses self-control, jumps to conclusions during conflict situations which complicates stressful situations
Avoids or rejects inputs and suggestions of others in conflict situations
2
1

174
Appendix B
Counterfactual Thinking Reflection Prompt
Often after something happens, we tend to think about what could have been
different that would have brought about a different outcome to the event. For example,
after receiving poor performance feedback on a course project, one may think, “If only
my professor had provided clearer instructions, I could have earned a higher grade.” Or
you may think, “If only I didn’t procrastinate, I could have done a better job with this
project.” You could also think, “At least the project wasn't weighted heavily in my final
course grade, or it would have lowed my GPA.” Think about the performance feedback
you just received. Please use as much or as little of the space below to list any thoughts
about what could have been different to lead to a different performance outcome. Many
participants find it easier to use a bullet-point format to list their thoughts. When sharing
your thoughts, please use complete sentences.
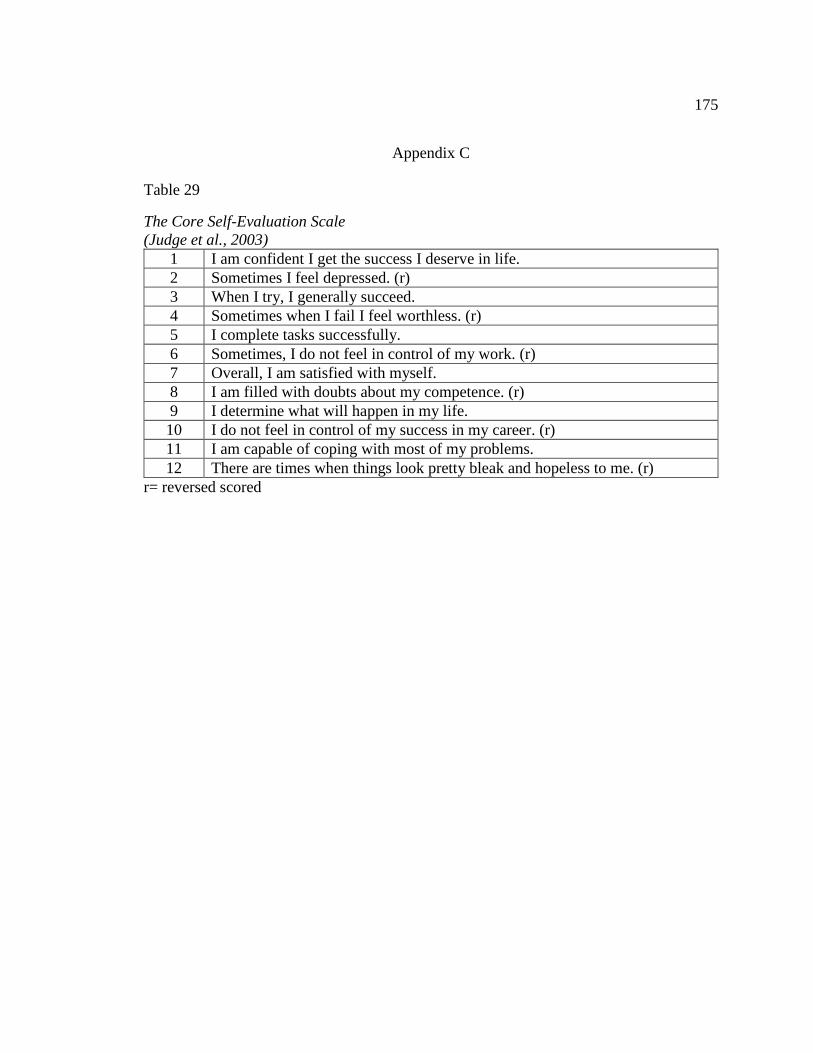
175
Appendix C
Table 29
The Core Self-Evaluation Scale
(Judge et al., 2003)
1 I am confident I get the success I deserve in life.
2 Sometimes I feel depressed. (r)
3 When I try, I generally succeed.
4 Sometimes when I fail I feel worthless. (r)
5 I complete tasks successfully.
6 Sometimes, I do not feel in control of my work. (r)
7 Overall, I am satisfied with myself.
8 I am filled with doubts about my competence. (r)
9 I determine what will happen in my life.
10 I do not feel in control of my success in my career. (r)
11 I am capable of coping with most of my problems.
12 There are times when things look pretty bleak and hopeless to me. (r)
r= reversed scored

176
Appendix D
Table 30
The Efficient Assessment of Need for Cognition
(Cacioppo et al., 1984)
1 I would prefer complex to simple problems.
2 I like to have the responsibility of handling a situation that requires a lot of
thinking.
3 Thinking is not my idea of fun. (r)
4 I would rather do something that requires little thought than something that is
sure to challenge my thinking abilities. (r)
5 I try to anticipate and avoid situations where there is a likely chance I will
have to think in depth about something.
6 I find satisfaction in deliberating hard and for long hours.
7 I only think as hard as I have to. (r)
8 I prefer to think about small, daily projects to long-term ones. (r)
9 I like tasks that require little thought once I’ve learned them. (r)
10 The idea of relying on thought to make my way to the top appeals to me.
11 I really enjoy a task that involves coming up with new solutions to problems.
12 Learning new ways to think doesn’t excite me very much. (r)
13 I prefer my life to be filled with puzzles I have to solve.
14 The notion of thinking abstractly is appealing to me.
15 I would prefer a task that is intellectual, difficult, and important to one that is
somewhat important but does not require much thought.
16 I feel relief rather than satisfaction after completing a task that required a lot
of mental effort. (r)
17 It’s enough for me that something gets done; I don’t care how or why it
works. (r)
18 I usually end up deliberating about issues even when they do not affect me
personally.
r= reversed scored

177
Appendix E
Table 31
Learning Goal Orientation Subscale
(VandeWalle et al., 2001)
1 I prefer challenging and difficult classes so that I’ll learn a great deal.
2 I truly enjoy learning for the sake of learning.
3 I like classes that really force me to think hard.
4 I’m willing to enroll in a difficult course if I can learn a lot by taking it.
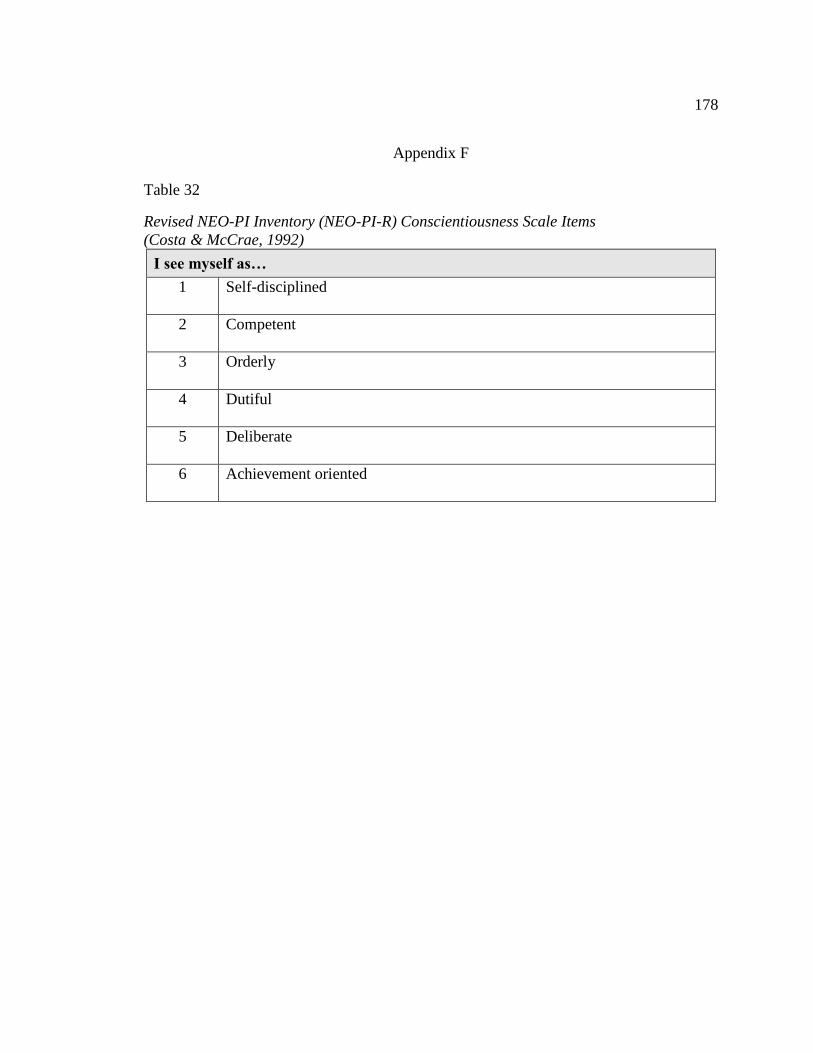
178
Appendix F
Table 32
Revised NEO-PI Inventory (NEO-PI-R) Conscientiousness Scale Items
(Costa & McCrae, 1992)
I see myself as…
1 Self-disciplined
2 Competent
3 Orderly
4 Dutiful
5 Deliberate
6 Achievement oriented

179
Appendix G
Table 33
Task-Relevant Knowledge Scale
In a supervisory role, individuals often engage in many tasks to manage personnel
resources. Several tasks commonly performed to manage personnel resources are
provided below. Please rate the extent to which your professional training and experience
provides you the knowledge to:
1 Create a work environment that recognizes employee goal accomplishment
2 Create a work environment that rewards employee goal accomplishment
3 Create a work environment that shows sensitivity to employee needs
4 Develop employees by recognizing their strengths
5 Develop employees by correcting their weaknesses
6 Develop employees by affirming their sense of competency
7 Assist employees in developing insight that facilitates performance
improvement
8 Assist employees in developing information that facilitates performance
improvement
9 Engage employees in participative decision-making for constructing
development plans
10 Engage employees in participative decision-making for implementing
development plans
11 Utilize communication techniques that create balanced conversations for
constructing and implementing development plans

180
Appendix H
Table 34
Feedback Specificity Manipulation Check
(Goodman et al., 2004, 2011)
1 I received detailed feedback about my performance as a Special Order Manager.
2 I was given specific feedback about my performance as a Special Order Manager.
Table 35
Adapted Manipulation Check for the Current Study
1 I received detailed feedback about my performance as a manager.
2 I was given specific feedback about my performance as a manager.
Note: Adaptations indicated in italics.
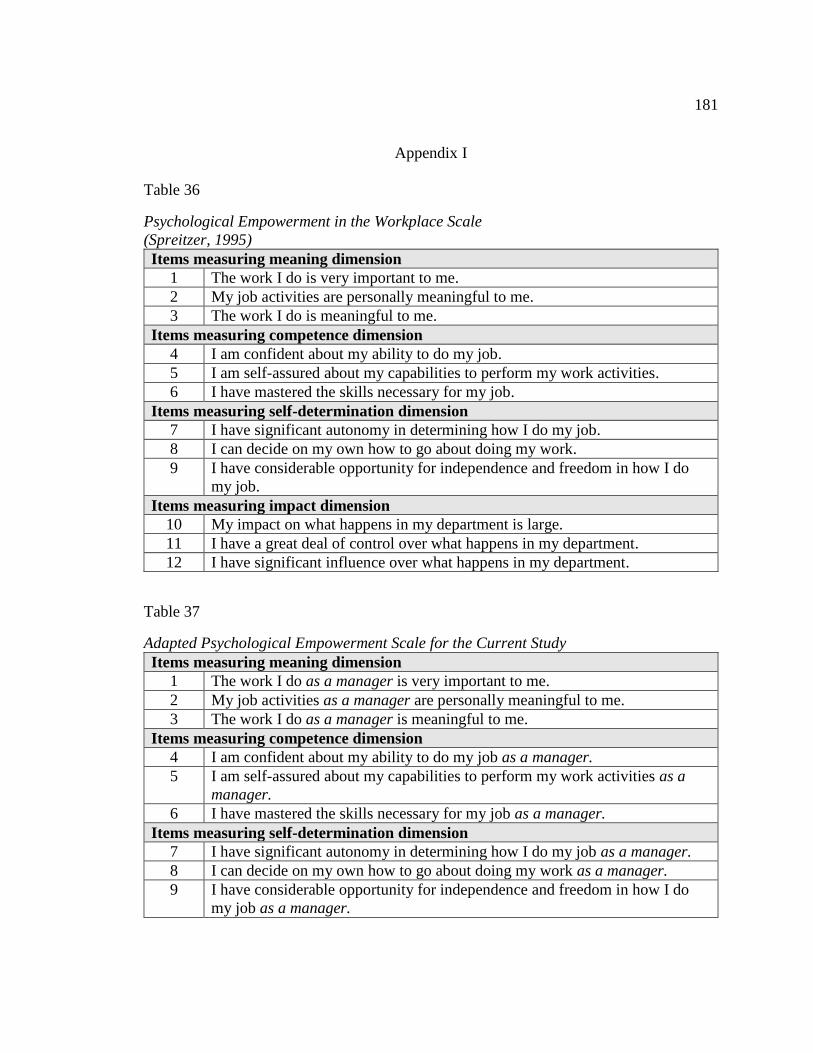
181
Appendix I
Table 36
Psychological Empowerment in the Workplace Scale
(Spreitzer, 1995)
Items measuring meaning dimension
1 The work I do is very important to me.
2 My job activities are personally meaningful to me.
3 The work I do is meaningful to me.
Items measuring competence dimension
4 I am confident about my ability to do my job.
5 I am self-assured about my capabilities to perform my work activities.
6 I have mastered the skills necessary for my job.
Items measuring self-determination dimension
7 I have significant autonomy in determining how I do my job.
8 I can decide on my own how to go about doing my work.
9 I have considerable opportunity for independence and freedom in how I do
my job.
Items measuring impact dimension
10 My impact on what happens in my department is large.
11 I have a great deal of control over what happens in my department.
12 I have significant influence over what happens in my department.
Table 37
Adapted Psychological Empowerment Scale for the Current Study
Items measuring meaning dimension
1 The work I do as a manager is very important to me.
2 My job activities as a manager are personally meaningful to me.
3 The work I do as a manager is meaningful to me.
Items measuring competence dimension
4 I am confident about my ability to do my job as a manager.
5 I am self-assured about my capabilities to perform my work activities as a
manager.
6 I have mastered the skills necessary for my job as a manager.
Items measuring self-determination dimension
7 I have significant autonomy in determining how I do my job as a manager.
8 I can decide on my own how to go about doing my work as a manager.
9 I have considerable opportunity for independence and freedom in how I do
my job as a manager.

182
Items measuring impact dimension
10 My impact on what happens in my department is large.
11 I have a great deal of control over what happens in my department.
12 I have significant influence over what happens in my department. Note: Adaptations indicated in italics.