reduction of non-value added work at essity hygiene and
TRANSCRIPT

Reduction of non-value added work at
Essity Hygiene and Health ABOpportunities for automation and digitalization in Baby products production
at Falkenberg Plant
Lisa Antonsen
Industrial Design Engineering, master's level
2018
Luleå University of Technology
Department of Business Administration, Technology and Social Sciences

ACKNOWLEDGEMENT I would like to thank everyone that have been involved in this project and helped me with this master thesis in Industrial Design Engineering, at Essity Hygiene and Health AB in Falkenberg.
At Essity I first and foremost want to thank Marcus Lehto, my supervisor for guiding me in the right direction and giving me good advices. A huge thanks to thank the operators at Fenix 2 who kindly participated in all my test, interviews, surveys and made me feel welcome to the team. I would also like to thank all the employees at Essity Hygiene and Health AB who participated in interviews and provided me with the information needed for the project. Thank you to Magnus Stenberg, my supervisor at Luleå University of Technology, for giving me great feedback and guid-ance in the right direction.
Last but not least, I would like to thank the most important people in my life. Mom and dad, thank you for always having my back, believing in me and supporting me. You are the best parents imag-inable.
Lisa Antonsen Luleå, June 2018

ABSTRACTToday’s new technology provides endless opportunities to automate and digitize operations. An increasing num-ber of companies replace manual tasks with new technologies, aiming at increasing efficiency and productivity. This master thesis project was made in corporation with Essity Hygiene and Health AB at Falkenberg. In order for Essity to continue to be one of the leading manufacturers and maintain their financial ability, they need to take a step in the right direction towards a more modern production.
The purpose with the project is to propose ways to reduce the amount of manual non-value adding work per-formed by operators, with focus on time losses, ergonomic and safety. The project shall deliver realistic concepts that reduce manual tasks performed by operators through automation, and find new ways to quality-proof the material.
The project has worked according to an iterative work process where the cycle was repeated, until the outcome satisfied the needs. The project started with mapping the current state where Fenix 2, one of the machines, was selected for the mapping. Two weeks was spent in the production to gain understanding of the operators work tasks and working environment. The project did, among other things, observations, interviews, surveys, ergono-mic analysis, flowcharts and spaghetti diagrams. The result from the current state shows that the refill of material is the most time-consuming task for the operators. It was also made clear, based on step counters and spaghetti diagrams that the operators walk a lot. The result from the mapping formed the basis for the development areas. The project chose to proceed with the material refill, walking and the quality and made requirement specifica-tions for each area.
An ideation process was used to generate as many ideas as possible for the chosen areas. The ideas then became early concepts, which were evaluated with weighted matrixes and feedback from employees. The concepts were then further developed into three final concepts, Ground Floor, Second Floor and Integration. The concepts shows that it is possible to reduce the manual working time with 4,5 hour per shift and decrease the walking with better information system. Further recommendation is that Essity proceed with the results, both the mapping and the concepts. The recommendation is to do another evaluation and include the operators in the process and after that use the results in this thesis as the basis for future implementations.
KEYWORD: Production development, Ergonomic, Safety, Automation, Digitalization, Information system, Alarm, Mapping, Waste.
SAMMANFATTNINGDagens teknik medför oändligt med möjligheter till att automatisera och digitalisera verksamheter. Allt fler företag ersätter manuellt arbete med ny teknik i syfte att öka effektiviteten och produktiviteten. Det här exa-mensarbetet har genomförts i samarbete med Essity Hygiene and Health AB i Falkenberg. För att fortsätta vara ledande inom deras bransch och behålla sin konkurrenskraftighet behöver Essity ta ett steg i rätt riktning och modernisera sin produktion.
Syftet med projektet är att föreslå sätt att minska mängden manuellt, icke värdeskapande arbete hos operatörerna med fokus på tid, ergonomi och säkerhet. Projektet ska leverera realistiska koncept som minskar mängden icke värdeskapande arbete hos operatörerna genom att automatisera manuella arbetsmoment och finna nya sätt att kvalitetssäkra materialet.
Projektet har arbetat efter en iterativ arbetsprocess där processen upprepats tills resultatet uppfyllde behoven. Pro-jektet startades med en kartläggning över nuläget där Fenix 2, en av maskinerna valdes ut. Två veckor spendera-des i produktionen för att få förståelse för operatörernas arbetsuppgifter och arbetsmiljö. Projektet gjorde bland annat observationer, intervjuer, enkäter, ergonomiska analyser, flödesscheman och spagetti diagram. Resultatet från nuläget visade på att det är påfyllnaden av material som tar mest tid för operatörerna under ett skift. Baserat på spagettidiaramen och stegräknarna blev det tydligt att operatörerna går mycket. Resultatet från kartläggningen utgjorde grunden för vilka områden som projektet vidareutvecklade. Projektet valde att gå vidare med material-påfyllnad, gående och kvalitet och för dessa områden så upprättades en kravspecifikation.
En idégenerering användes för att skapa så många idéer som möjligt för de olika områdena. Idéerna blev sedan till tidiga koncept som i sin tur utvärderades med hjälp av viktningsmatriser och feedback från anställda. Koncep-ten utvecklades ytterligare till tre slutliga koncept, Första Våningen, Andra Våningen och Integrations konceptet. Koncepten visar att det är möjligt att minska både arbetstiden med 4,5 timmar samt gåendet genom förbättrat informationssystem. Vidare rekommendationer är att Essity fortsätter arbeta med resultaten från både kartlägg-ningen och de slutliga koncepten. Rekommendationen är att göra ytterligare en utvärdering och inkludera operatörerna i utvecklingsprocessen. Efter det bör resultatet i den här rapporten användas som grund för vidare implementering och framtida projekt.
NYCKELORD: Produktionsutveckling, Ergonomi, Säkerhet, Automatisering, Digitalisering, Informationssystem, Kartläggning, Slöserier.
CONTENT 1 INTRODUCTION 2
1.1 Background 21.2 Stakeholders 21.3 Objective and aims 21.4 Project scope 31.5 Thesis outline 3
2 COMPANY DESCRIPTION 5
3 THEORETICAL FRAMEWORK 7
3.1 Industrial design engineering 73.2 Lean manufacturing 73.3 Industry 4.0 93.4 Ergonomics 103.5 Human-machine interaction 113.5.1 Information 113.5.2 Alarm system 113.5.3 Design principles 123.6 User Experience 12
4 METHODE 14
4.1 Process 144.2 Planning 154.3 Mapping of the current state 154.3.1 Non-structured mapping 154.3.2 Structured mapping 164.3.3 Decision 184.4 Literature 184.5 Benchmarking 194.6 Ideation 194.7 Requirement Specification 204.8 Concept evaluation 204.9 Final concept development 204.10 Method discussion 21
5 CONTEXT 24
5.1 Material refill 245.1.1 Glue 245.1.2 Pulp 25
5.1.3 Plastic bags 255.1.4 Cardboard boxes 265.1.5 Second floor 265.2 Quality tests 275.3 Production stop 285.4 Working environment and ergonomics 295.4.1 Incidents rapports 295.5 Analysis of context 295.5.1 Walking 295.5.2 Alarm 315.5.3 Ergonomic analysis 315.6 Survey results 325.7 Benchmarking 325.8 Ongoing projects 335.9 Summary of context 335.10 Requirement specification 34
6 CONCEPT DEVELOPMENT 38
6.2 Early concepts 386.2.1 Glue 386.2.2 Plastic bags 386.2.3 Cardboard boxes 386.2.4 Second floor 396.2.5 Walking/Alarm/HMI 426.2.6 Quality testing 436.3 Concept evaluation 436.3.1 Analysis 456.4 Final Concept development 456.4.1 Ground floor 456.4.2 Second floor 506.4.3 Integration 50
7 DISCUSSION AND CONCLUSION 54
7.1 Discussing the final result 547.2 Relevance 557.3 Recommendation 557.4 Objective and aims 557.5 Conclusion 567.5.1 Research question 1 567.5.2 Research question 2 56
WORKS CITED 57

LIST OF FIGURES Figure 1. Layout over one of the Baby machines, Fenix 2. 5Figure 2. Factors that effect production development. 7Figure 3. Distribution between direct value and waste, according to Sörqvist (2013). 8Figure 4.Human motion according to Pascal (2007). 8Figure 5. Colors meaning according to Osvalder and Ulfvengren (2011). 12Figure 6. Project circle, based on Karlsson et al. (2013). 14Figure 7. Overview over some of the areas in the context. 24Figure 8. Glue tank, closed and opened. 24Figure 9. Flowshart over the change of pulp. 25Figure 10. The conveyor with plastic bags. 25Figure 11. Material on the unwinder and storage on the second floor. 27Figure 12. Flow chart of the work process. 26Figure 13. Tensile strengths. 27Figure 14. Photo taken during a RIS-stop with maintenance. 28Figure 15. Mapping of an operator during 60min. 30Figure 16. Mapping of an operator during 40min. 30Figure 17. Operators movement during a 15 min production stop. 30Figure 18. 30 min work on the second floor. 30Figure 19. Histogram over the steps, converted to eight hours. 30Figure 20. Histogram over steps recorded. 31Figure 21. The yellow areas display where it is possible to directly see the alarm lamp. 31Figure 22. Refilling glue in basket. 31Figure 23. Emptying the basket of glue in the tank. 32Figure 24. Concept Cardboard boxes 1. 39Figure 25. Concept Cardboard boxes 2. 39Figure 26. Concept Cardboard boxes 3. 39Figure 27. The existing layout of Fenix 1 and Fenix 2. 40Figure 28. The new layout with conveyor in the edges. 40Figure 29. Different placements of the robot. 40Figure 30. Layout for the early concept, with extended back and front. 41Figure 31. Early concept Monitor. 42Figure 32. Mobile device scanning a QR-code. 42Figure 33. Example of the alarm lamps. 43Figure 34. Function of the scissor lift. 46Figure 35. Movement of the pallet in the automated system. 46Figure 36. Layout of the second floor. 47Figure 37. Visualization of the two lifts with small conveyors in both ends. 47Figure 38. The two Gantry robots in the front of the second floor. 47Figure 39. Closer view of the gripper. 47Figure 40. Storage (blue box) to avoid contamination. 48Figure 41. Material and operators flow on the second floor. 49Figure 42. Example of control room 50Figure 43. Three of the four glue tanks on the second floor. 50Figure 44. Monitor on the ground floor 50Figure 45. Monitor on the second floor. 51Figure 46. Visualization of the placement of the monitors, and the visibility (yellow areas). 51Figure 47. Alarm lamps in different colors. 51

APPENDICES APPENDIX A. Gantt scheme 1p
APPENDIX B. Number of steps 2p
APPENDIX C. REBA analysis 2p
APPENDIX E. Survey questions 2p
APPENDIX F. Results from survey 6p

1
1INTRODUCTIONThis chapter presents an introduction to this master thesis, including background, stakeholders, objective and aims, project scope and the thesis outline.

2
With today’s higher demands on effective production systems not only the machines, but also operators, must work as efficiently as possible. This master thesis proj-ect was made in corporation with Essity Hygiene and Health AB at Falkenberg Plant. Essity is a leading global hygiene and health company that develops and produc-es solutions within different business areas. Falkenberg Plant produces incontinence products and baby care such as diapers under the brands Libero, Drypers and Pequenin.
Falkenberg Plant has eight highly automated production lines and three operators on each line that monitor, re-fill materials, handle production stops, etc. This project aims at mapping operators’ work with focus on non-val-ue adding work, ergonomic and safety. The project will also focus on material handling, material flow and waste management related to the Baby machines (machines producing diapers).
This master thesis project is part of the Industrial Design Engineering program at Luleå University of Technology. The course, A7009A covers 30 credits and is conducted over 20 weeks in the spring of 2018.
1.1 Background Today’s new technology provides endless opportuni-ties to automate and digitize operations. An increasing number of companies replace manual tasks with new technologies, aiming at increasing efficiency and pro-ductivity. In order for Essity to continue to be one of the leading manufacturers and maintain their financial ability, they need to take a step in the right direction. This project has been planned for a long time but has not been implemented due to time and resource short-age. Essity continuously performs improvement work in their production and they have a great habit of planning and implementing developments.
The operator’s work is sometimes very stressful and they do not have time to do quality checks and improvement work. It is primarily all those moments, non-value add-ed work that they wish to remove. In the future, they want to focus more on improvements and ensure that operators is provided with a less stressful work environ-ment where improvement work is a part of everyday work.
1.2 Stakeholders The stakeholders are divided into primary and second-ary stakeholders. The primary stakeholders are those who will mostly, and directly be affected by the project.
Operators are those who perform many of the manual tasks that hopefully can be automated and digitized in the future. New tasks require operators who need to adapt and probably learn new ways of working and new technologies.
Management will be affected, as they will need to make decisions on how to proceed with the project and possible implementations. They will also be needed to make economical decisions, for example, investment costs and education for the operators.
The secondary stakeholders will be indirectly affected by the project.
Maintenance staffs. New technology may require maintenance staff, like electricians and mechanics to learn new systems. New technology may require ex-tra maintenance and be an additional work task for the maintenance staff.
Suppliers. A new system/product may require suppliers to adapt their product or way of delivering the product.
1.3 Objective and aims The purpose with the project is to propose ways to reduce the amount of manual non-value adding work performed by operators on the Baby machines with pri-ority on time losses, ergonomic and safety. The expect-ed outcomes are proposals around realistic actions that can be taken to reduce the amount of manual tasks per-formed by operators on the Baby machines and provide concepts for better material handling.
Aim 1: The project shall deliver realistic concepts that reduce manual non-value adding tasks performed by operators through automation, and find new ways to quality-proof the material.
Aim 2: The project will optimize material handling with focus on raw materials, material flows and wastes.
1 INTRODUCTION

3
The project will work according to research questions, which will affect the project’s theory and methods. The questions are:
1. How can unsafe and non-ergonomic tasks be elimi-nated using automation and digital systems?
2. How can manual non-value added work be re-moved, and how much time would be saved per shift?
1.4 Project scope The project is ongoing for a limited period of time, and the 20 weeks result in 800 hours of work. As this is a comprehensive survey of work tasks and material flows, delimitations need to be done in order to focus the proj-ect on what is important.
Baby machines. The project will only study the Baby machines and not the machines producing incontinence products. As there are eight different Baby machines, the project will mainly focus on one of them, Fenix 2.
Implementation. The project will not implement any bigger solutions, mainly due to lack of time. Small im-provement proposals may be implemented and tested during the project.
Economy. The project will not make any financial de-cisions about the solutions, only recommendations to Essity. The project will also not take offer suggestions or focus on what the solutions may cost.
1.5 Thesis outline The thesis is structured in the same chronologic order as the project was performed, from this introduction chap-ter to the final result.
Chapter 1 gives an introduction to the project where objectives, aims and project scope are established. The chapter also presents the background to the project as well as the stakeholders that will be affected.
Chapter 2 presents a company description of Essity with focus on Falkenberg plant. The chapter visualizes a lay-out of the Baby machine Fenix 2 together with an ex-planation of the different parts of the machine.
Chapter 3 presents the theoretical framework, which is the scientific foundation of this thesis. The chapter is introduced with a short description of industrial design
engineering followed by relevant theory related to the project.
Chapter 4 describes the process and the planning of the project, followed by the methods used for mapping the current state and relevant literature. The chapter con-tinues to describe the method used for developing con-cepts and evaluation.
Chapter 5 presents the context at Fenix 2, one of the Baby machines, with focus on non-value adding activi-ties. The chapter describes different work tasks followed by the time spent on each task. The chapter ends with an analysis of the context.
Chapter 6 presents the results of the concept develop-ment where ideas are transformed into several more de-tailed concepts. The concepts are then evaluated and the chosen concepts are developed in detail.
Chapter 7 includes a discussion of the final result, the relevance of the project and the recommendation. The chapter also includes a conclusion and how well the project achieved the objectives and aims stated in the beginning of the project.

4
2COMPANY DESCRIPTIONThis chapter presents a description of the company, Falkenberg plant and the Baby machine Fenix 2.

5
Essity used to be a part of the SCA group, founded in 1929, but since June 2017 Essity is an independent company with focus on the essentials for everyday life. Essity is a leading global hygiene and health company with 48000 employees (in 2017). Sells are conducted in 150 countries under the brands Jobost, Leukoplast, Libero, Libresse, Lotus, Nosotras, Saba, Tempo, Vinda and Zewa (Essity, 2018). They develop and produce prod-ucts within their different business areas Personal Care, Costumer Tissue and Professional Hygiene. This project focus on Personal care that includes incontinence prod-ucts, feminine care, baby care and medical solutions. In 2016 Personal Care accounted for 33% of Essity’s net sales, which is approximately SEK 43bn (Essity, 2018). In the end of 2017 Essity had production at 27 plants in 21 countries (Essity, 2018).
Falkenberg plant produces Baby care on eight Baby machines and incontinence products on two inco ma-chines. This thesis focus on the operators work on the Baby machines and the following text will dive deeper into the work at the Baby machines. Falkenberg plant has around the clock production and the operators work in five different shift teams. The shift is based on a schedule where the operators work for seven days in a row followed by five vacant days. The shift varies in time from seven to nine hours, but during their working week they work mostly for eight hours. The around the clock production results in the operators taking turns for break, leaving only two operators at the Baby ma-chine during this time.
The Baby machines consist of a highly automated pro-duction line that assembles the raw material into a di-aper in a high speed. The diapers can be considered a simple product, but it contains twelve different mate-
rials. It is the operators’ responsibility to refill material, do quality checks, monitor, handle production stop and make sure that the machine produces the right order. The variety of work tasks requires a lot of experience, knowledge and good communication with each other. Figure 1 is a visualization of one of the Baby machines, Fenix 2, observe that the picture is not made to scale and just a visualization over the area.
The production line is where the diapers are assembled together. Over the production line is a second floor that holds eleven different materials placed on unwinders (a construction that allows the raw material rolls to ro-tate). The material on the second floor goes through the floor and down to the production line, where the diapers are assembled. After the assembly the diapers are cut into correct size and folded. The Bagfiller takes the folded diapers, sort them, compress them and pack the correct amount of diapers in plastic bags. The plastic bag closes by a welding and the bags leave the Bagfiller on a conveyor. The plastic bags then enters the Casepacker where the plastic bags are packed into cardboard boxes. The boxes then leaves the Casepacker on a conveyor that transports them to a warehouse. The test stations is where the operators perform quality tests.
Green = Container containing different kinds of rub-bish.Red = The HMI (main computers), this is where it is possible to view and reset alarm. Orange = Control panels over specific parts of the ma-chine. Dark grey = Material that the operators refills. Blue = Glue tanks. Yellow = Automatic truck (to pulp refill).
2 COMPANY DESCRIPTION
Figure 1. Layout over one of the Baby machines, Fenix 2.

6
3THEORETICAL FRAMEWORKThis chapter contains the theoretical information that the project concerns. The choice of information is based on the areas of the project and literature in the field of industrial design engineering. The information is presented to support and strength decisions and arguments.

7
3.1 Industrial design engineering The past few decades have, according to Johannesson, Persson and Pettersson (2013), been characterized by new requirements for customization, sustainability, safe-ty and design. Global competition is getting tougher and products are becoming increasingly more complex. Al-ready during the industrialization, the ability to compe-te was important and companies tried to attract custo-mers using appealing design and quality. In the 1950s and 1960s, a new multidisciplinary science was develo-ped, the ergonomics (Johannesson, et al., 2013). Initially, the focus was mostly on human physical characteristics, followed by research on information intake and percep-tion (Johannesson, et al., 2013). Today, the industry has a market-oriented and customer-oriented view and de-velops its products and production system for reasons of competition. The challenge is to give each customer a custom made product with retained efficiency in manu-facturing and maintaining economy.
According to Johannesson et al. (2013) the industrial innovation process includes all activities that must be taken to realize a business opportunity by developing, manufacturing and launching a product on an identi-fied market. This can be a physical product, service or both. According to Bellgran and Säfsten (2005) there are several factors that affect the production system. They talk about external influences, actual options during the development and strategies and fundamental attitudes among the people involved in the development (figure 2).
Figure 2. Factors that effect production development.
The external influences that affect the production sys-tem could be history trends and globalization (Bellgran & Säfsten, 2005). Nationally, a number of important factors affected the transformation of production sys-tems in Sweden. Such factor is, according to Bellgran
and Säfsten (2005), the sociotechnical thoughts that characterize the work content for the operators. By actual options Bellgran and Säfsten (2005) means that the existing technology will affect the outcome of the production development. The company’s strategies and values for the people involved are also crucial for the development of the production system and how the end result turns out.
3.2 Lean manufacturing Lean production is a widespread philosophy with the roots b from the Toyota Production System (Pascal, 2007). Lean is about developing effective flows and creating value for the customers, businesses and orga-nizations in several industries strive to be lean (Sörqvist, 2013). According to Sörqvist (2013), the goal is to achieve high efficiency and maintain satisfied customers. By eliminating non-value-adding work, time is liberated that can be used to create higher customer value. Those who succeed achieve, according to Sörqvist (2013), fine results, but far from everyone achieve success. At first glance, Lean can appear a simple concept, but according to Sörqvist (2013), it’s easy to be fooled, since lean re-quires a lot from the business and is a long-term work.
So why Lean? In today’s business, there is a great-un-tapped potential, where substantial resources are put on things that do not create value for the business customers (Sörqvist, 2013). Lots of time and money are spent due to errors, shortcomings, dissatisfied customers, delays, bad practices and unnecessary work, just to name a few. Lean is a relevant area for this project as Essity strives to minimize waste and get a more lean production.
Waste One fundamental part in lean manufacturing is to re-duce the “seven wastes” also called Muda in Japanese. The wastes are according to Bellgran and Säfsten (2005):
1. Overproduction means producing more than the costumer wants, producing ear-lier than required or producing overlarge batches.
2. Excess inventory means holding more buffers/inventory than required.
3. Waiting means that time is not used ef-fectively in the production and waiting ap-pears as an effect of not having the right conditions.
4. Transportation adds no value to the cos-
3 THEORETICAL FRAMEWORK

8
tumers, except for transportation to the costumer.
5. Unnecessary motion means a motion that does not create value for the product.
6. Over processing means performing more work than the costumer requires.
7. Defect product causes waste and what was not done right at start needs to be cor-rected.
An addition to the seven forms of waste mentioned above is untapped competence (Petersson, Johansson, Broman, Blucher, & Almsterman, 2010). By not using the competence of the employees, there is a risk of loos-ing improvements that would have been possible to im-plement. Muda is the opposite of value, and according to Pascal (2007) the costumers are not willing to pay for wait time, rework, extra inventory or other forms of Muda. According to Sörqvist (2013), a central part of lean work is to systematically review the processes, focusing on identifying non-value-adding work. The outcome of a value-flow analysis often leads to the fact that only a few percent are used for direct value added work (Sörqvist, 2013). Figure 3 illustrates how the time distribution between direct value added work, necessary but non-value added work and waste (Sörqvist, 2013). Sörqvist (2013) divides non-value added work into two parts, where necessary non-value-added activities are required for the value added work to be carried out, but as such does not add a direct value to the custom-er. Waste, on the other hand, neither adds value nor is necessary for other reasons (Sörqvist, 2013). This may include movements and movements that happen unnec-essarily. The necessities of non-value-adding activities are usually more difficult to eliminate because basically they are required for the business to be run. Primarily, it is therefore more common to focus on clean wastes (Sörqvist, 2013).
Human actions or in this case, operators work, can also be divided into three categories described by Pascal (2007), see figure 4.
* Actual work adds value to the product* Auxiliary work supports actual work, usually occurs before or after actual work.* Muda is the motion that creates no value. Wasted human motion is linked to workplace ergo-nomics where poor ergonomic design negatively affects productivity, safety and quality (Pascal, 2007). Produc-tivity suffers when there is unnecessary walking, twist-ing and reaching and the ergonomics has likely the big-gest impact on safety (Pascal, 2007). Pascal (2007) also claims that quality suffers when operators has to strain to process or check a work piece because of twisting and reaching.
JikodaJikoda is a Japanese term ensuring that everything is done correctly from the start of the process, and if some-thing goes wrong the process should stop (Petersson, et al., 2010). Build in quality can be applied in automatic processes where there is a possibility to automatically correct and ensure high quality. According to Petersson
Figure 3. Distribution between direct value and waste, according to Sörqvist (2013).
Figure 4.Human motion according to Pascal (2007).

9
et al. (2010) the most important condition to achieve a high-quality process is to use employees with appro-priate competence that complies with agreed ways of working. An automatic process on the other hand often provides the possibility to correct the process automati-cally in order to ensure high quality.
Poka-yoke is another Japanese term referring to mis-take-proofing which are devices that makes it near-ly impossible for operators to make a mistake/error (Liker, 2004). Poka-yoke means implementing simple and low-cost devises to find abnormal situations be-fore they occur, this reduces the worker’s physical and mental burden (Pascal, 2007). Example of errors could be missing process steps, process errors, missing parts, wrong parts, adjustment errors and equipment not set up properly just to mention a few (Pascal, 2007). A good poka-yoke on the other hand is simple, with long life and low maintenance, high reliability, low cost and de-sign for the workplace conditions (Pascal, 2007). When a poka-yoke notices an error it should according to Pas-cal (2007) either deliver a warning or shut down the machine. Poka-yokes alert abnormalities by activating a warning signal or light or shutting down the machine when operations fails, pieces are incorrectly positioned, sensors fails and so on (Pascal, 2007).
5S 5S is a visual management tool designed to create a work environment that is self-explaining, self-oriented and self-improving (Pascal, 2007). 5S stands for sort, set in order, shine, standardize and sustain (Pascal, 2007). This method is often the staring point when a company strives for a lean production since the method is consid-ered simple to use (Petersson, et al., 2010). A well-orga-nized workplace is the basis for eliminating waste and standardizes work (Petersson, et al., 2010). The first step of visual order is to sort and make sure that the work place does not get overrun with stuff since this impairs the flow of work (Pascal, 2007).
CriticismAccording to Sörqvist (2013), two main reasons can be given to the fact that lean is criticized and questioned. First of all, many lean initiatives do not meet the expec-tations from the companies and therefore the concept is considered to be less successful. Sörqvist (2013) believes that this is due to lack of management support, less well implemented plans, excessive cost focus, poor planning and insufficient resources. Secondly, criticism of lean
is directed to the fact that investments are claimed to have adverse side effects in businesses using the con-cept’s methodology. According to Sörqvist (2013), these effects can be stress, occupational injuries, monotonous work and negative gender perspectives. Chay, Xu, Ti-wari and Chay (2015) on the other hand claims that one of the most critical elements to succeed with a lean transformation is to have a people-orientated produc-tion, something that often fails.
Common barriers that hinder lean transformation are issues surrounding shop floor workers, where companies fail to engage the workers into lean activities. Chay et al. (2015) claims that top-down approaches is the most common approach, and botton-up approaches that em-phasis more of the shop floor workers initiatives often is neglected. The top-down approach often used is insuf-ficient when transforming conventional manufacturer to become lean manufacturer (Chay, et al., 2015). The bottom-up approach is therefore important to succeed and sustain a lean manufacturing/organization. Manag-ers should be more aware of the impacts of Lean pro-duction on complex socio-technical systems and appre-ciate the upside of complexity (Marlon, Tarcisio Abreu, & Michel Jose, 2018). According to Marlon et al. (2018) their study showed that successful lean implementations relied on both increasing and taking advantage of com-plexity, instead of reducing it.
3.3 Industry 4.0 Already in the 1970s, information and communications technology were implemented in industries. Industry 4.0 was presented for the first time in 2011, and be-came a German strategic initiative. Since then, similar strategies have been proposed in other countries under the names like “Factories of the Future”, “Industrial Internet” and “Internet + ” (Mrugalska & K. Wyrwic-ka, 2017). Despite that Industry 4.0 is a widely spread concept there is no formally respected definition for it (Mrugalska & K. Wyrwicka, 2017).
New technology is required in order to convert the ex-isting production system to Industry 4.0.Wang, Wan, Li, and Zhang (2016) states that Internet of Things (IoT), big data, artificial intelligence (AI) technologies and cloud solutions are enabling factors for industry 4.0. Us-ing AI technologies together with powerful micropro-cessors results in smart machines and products, meaning that they communicate, control and compound with each other (Wang, et al., 2016). These smart artifacts are

10
interconnected with each other and the industrial net-work/internet. Cloud computing technology can, to-gether with the server network be used as a resource pool that can provide scalable computing ability to stor-age space on demand for big data analytics (Wang, et al., 2016).
Mrugalska and K. Wyrwicka (2017) describes that In-dustry 4.0 can be defined by three ideas, the Smart Product, the Smart Machine and the Augmented Oper-ator. The Augmented Operator is an interesting area, as the operators at Fenix 2 will be affected by future im-plementations. An Augmented Operator is about auto-mating knowledge and information in order to provide a flexible and adaptive production system. The operators will then be faced with a variety of tasks such as speci-fication, monitoring and verification of the production system. To ease the work the operators could be provid-ed with a mobile user focus assistance system (Mrugal-ska & K. Wyrwicka, 2017). Kolberg and Zühlke (2015) states the same thing as Mrugalska and K. Wyrwicka (2017), who also say that the operators can be equipped with smart watches that receive error messages and error location. Compared to signal lamps, recognizing failure does not depend on the location of the operator (Kol-berg & Zühlke, 2015).
As the technology becomes more complex the impor-tance of good user interfaces increases. Smartphones, Bluetooth, navigations systems are just a few of the system that already exist in our everyday life. This will according to Schmitt, Meixner, Goreck, Seissler and Lo-skyll (2013) change the traditional way of working in the industry. They introduce several different platforms and methods that can be used to improve the interaction as the complexity of the automation increases.
• Smartphones can be used in different ways in the production system. The phone can control diverse field devices via Bluetooth. Information is presented clearly and completed by the respective operators signa-ture. It is also possible to use QR-codes to provide in-formation. By scanning the codes operators are provided with needed information of a specific area, the QR-code contains passive data with needed information and can be decrypted by the phone.
• Seamless Navigation Application displays dif-ferent maps appropriate to the situation. The transition between the different maps happens seamlessly as the
applications continuously provide the current situation of the maintenance to the worker. Locality information can also be used to create innovative maintenance func-tions decreasing the time-consuming search of defective areas.
• Augmented Reality (AR) has a great potential for presenting information and knowledge to support employees. AR uses an extension of the perception of reality by overlaying of virtual objects. This provides task-based information that can be projected interac-tively and immediately to the employee.
Even though the complexity of Industry 4.0 is groov-ing, the system has many advantages and huge potential. According to Mrugalska and K. Wyrwicka (2017) it in-creases competiveness and flexibility, optimizes decision making, increases resource productivity and keeping productive workers for longer as the systems provide flexible and diverse career paths, just to mention a few.
Mrugalska and K. Wyrwicka (2017), believes that Indus-try 4.0 can be linked to Lean production. Augmented Operators can apply Jikoda, a Lean method used for quality controls as they reduce time between failures with help from notifications. The notification should contain information concerning both the error message and error location. The information can then be logged for further analysis as a part of continuously improve-ments (Mrugalska & K. Wyrwicka, 2017).
3.4 Ergonomics Ergonomics is usually considered an important part in the design process (Magrab, Gupta, McCluskey, & Sandborn, 2009). According to Magrab et al. (2009) the product/system should be easy to use and effective-ly communicate its function, which results in a shorter learning time. When designing a workplace it is import-ant to consider the physiology of the human that are going to use the workplace (Hägg, Ericson & Odenrick, 2011). The relationship between a workplace design and the dimensions of the body determines the position of the body that is taken at work. How much your body position is limited depends on how much contact there is between the person and the environment. According to Hägg et al. (2011), the contact may be both physical in the form of furniture or visual in the form of moni-tors. Ergonomic consideration increases the chances of success amongst the users and facilitates maintenance for the end users. Ergonomics play an important role

11
regarding safety and minimizing injury (Magrab, et al., 2009).
Physical loads may be of different character and depend on amplitude, frequency and duration. The human body needs physical loads and rest to maintain the various functions of the body, even varied mental stress and so-cial contacts are needed to maintain normal function-ing and health (Hägg, et al., 2011). Physical loads can in some cases cause damage to the body’s tissues and organs (Hägg, et al., 2011). The work must therefore be carried out to provide load variations with varying light and heavy loads and with sufficient breaks.
3.5 Human-machine interaction The cognitive ability and limitations of human beings in different situations need to be taken into account in the development of interfaces. This applies for both audio and visual information. Design aims at providing a prod-uct with interpretable information using form and color (Johannesson, et al., 2013). Understanding characters is primarily about using our visual sense so that we cor-rectly understand both the basic characters, archetypes and symbols (Johannesson, et al., 2013).
3.5.1 Information Operators get their information in different ways, through information on displays, sounds, lights, indica-tors, etc. When designing user interfaces, the informa-tion presented should enable the operator to make deci-sions and sort information in an easy way. According to Osvalder and Ulfvengren (2011), the operator’s physical and mental properties must be the basis for the design of the user interface. Technical systems are becoming in-creasingly complex and it is through the user interface that the operators communicate with the technology. Osvalder and Ulfvengren (2011) also state that lack of understanding of technology can lead to human error and incidents or, at worst, accidents. According to Os-valder and Ulfvengren (2011), there are data indicating that 60-80% of all accidents in complex technical sys-tems are affected by the human factor.
According to Pascal (2007) there are four types of visual systems and their purpose is to share information at a glance. The most effective way of sharing information is to use a visual indicator for example a street sign, the second most effective way is to use a visual signal for ex-ample a traffic light. On third place is the visual control that limits behavior, for example parking lot lines and on
forth place is, according to Pascal (2007) guarantee that allows correct response only.
According to Osvalder and Ulfvengren (2011), there are three different categories of information, qualitative, quantitative and representative information. Qualitative information devices are suitable for use when only a few different states are displayed. When designing, it is important that the indicators differ as much as possi-ble from each other. Audio indicators can be used as an addition and the advantage is that sound is picked up even though the information device cannot be ob-served. Qualitative information devices are used when operators need numerical and accurate data, the infor-mation should be displayed in digital or analog form. Analog reading is faster to read, but according to Os-valder and Ulfvengren (2011), digital display is preferred when showing exact numbers. In design, it is important that the information device is easy to read and the scales should be as clear as possible. Representative informa-tion displays a picture of reality, such as a machine or process. It is important that symbols are logical and easy to read since representative, alphanumeric, qualitative and quantitative information is often displayed simul-taneously.
3.5.2 Alarm system According to Osvalder and Ulfvengren (2011), the pri-mary purpose of an alarm system is to alert operators to deviations in the system so they can correct the er-rors and handle the interference. According to Thunberg and Osvalder (2008), an optimal alarm system will lead the operator to find the right information and enable early detection of deviations. Osvalder and Ulfvengren (2011), also say that the alarm must give the operators time to respond before it is too late and confirm actions from the operators. The alarm should be prioritized ac-cording to time and consequence.
According to Thunberg and Osvalder (2008), sever-al criteria’s needs to be considered when modernizing alarm systems. Future systems must be flexible and in-formation flow should be adapted to different operat-ing modes. Operators’ cognitive and physical conditions should also not be overloaded. According to Osvalder and Ulfvengren (2011), it is also important to consid-er how the old system looks when designing the new interface, so that both old and new are perceived as a whole.
12
3.5.3 Design principles When designing displays it is important to have knowl-edge of the human cognitive abilities so that the design supports the user with relevant information.
Design principles for attention To increase strengths and reduce weaknesses in human attention, the designer can, according to Osvalder and Ulfvengren (2011), minimize the time it takes to find information. Searching information is time consuming and a waste of resources and therefore should the infor-mation used most often be shown first. Information be-longing to each other should be grouped and found in the same place on all displays (Osvalder & Ulfvengren, 2011). When two or more screens are integrated, atten-tion must be shared and it is not always advantageous to apply closeness between different objects. Instead, Os-valder and Ulfvengren (2011) suggest that putting the same color on things that belong together and linking them with arrows and lines should solve this. For in-formation from multiple sources of information, using both visual and auditory stimuli can facilitate the acqui-sition of information.
Design principles supporting perception Good readability is the basis of good information where high contrast, good lighting and the right viewing angle should be used to succeed. According to Osvalder and Ulfvengren (2011), it is difficult to judge the size, thick-ness or color if the number of levels that the variable can assume exceeds five. There is a greater chance that the information will be interpreted correctly if the same message is presented in several different ways, for exam-ple, messages can be presented both visually and audibly. Osvalder and Ulfvengren (2011) states that similar ob-jects should be avoided since they easily create confu-sion, the objects shown should be clearly distinguishable.
Design principles supporting memory Osvalder and Ulfvengren (2011), states that short-term memory has a limited capacity and very little informa-tion can be kept active and processed at the same time. Furthermore the design of displays should not burden the short or long-term memory for operators, as this makes it harder to solve problems. According to Os-valder and Ulfvengren (2011), current information must be shown on displays so that the short-term memory can focus on problem solving instead. To predict events and think proactively is a difficult cognitive task, if one has to think about the current status of the system. Since
proactive behavior is more effective than retrospective, the interface should support the operator with clear in-formation about expected status (Osvalder & Ulfven-gren, 2011). When designing new interfaces, it should be taken into consideration, for example, the same col-ors should be used throughout the system (Osvalder & Ulfvengren, 2011).
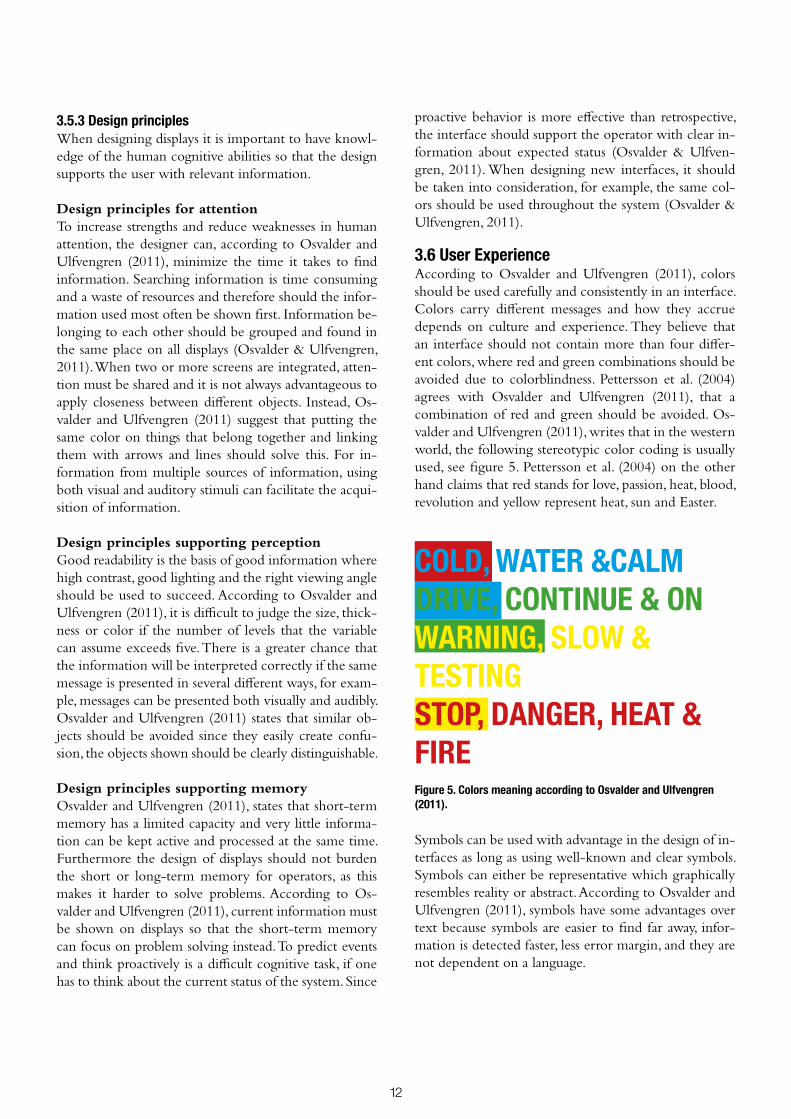
3.6 User ExperienceAccording to Osvalder and Ulfvengren (2011), colors should be used carefully and consistently in an interface. Colors carry different messages and how they accrue depends on culture and experience. They believe that an interface should not contain more than four differ-ent colors, where red and green combinations should be avoided due to colorblindness. Pettersson et al. (2004) agrees with Osvalder and Ulfvengren (2011), that a combination of red and green should be avoided. Os-valder and Ulfvengren (2011), writes that in the western world, the following stereotypic color coding is usually used, see figure 5. Pettersson et al. (2004) on the other hand claims that red stands for love, passion, heat, blood, revolution and yellow represent heat, sun and Easter.
Figure 5. Colors meaning according to Osvalder and Ulfvengren (2011).
Symbols can be used with advantage in the design of in-terfaces as long as using well-known and clear symbols. Symbols can either be representative which graphically resembles reality or abstract. According to Osvalder and Ulfvengren (2011), symbols have some advantages over text because symbols are easier to find far away, infor-mation is detected faster, less error margin, and they are not dependent on a language.
COLD, WATER &CALM DRIVE, CONTINUE & ONWARNING, SLOW & TESTINGSTOP, DANGER, HEAT & FIRE

13
4METHODE This chapter describes an iterative work process, from the first to the last step based on theoretical approaches. Mostly of the work was performed at Essity with continuous meetings and feedback from the supervisor at Essity.
14
4.1 Process The product development process is according to Jo-hannesson et al. (2013) characterized by I3, which are iteration, integration and innovation. This project uses an iterative work process, which means that the project does not follow a linear order. According to Wikberg Nilsson, Ericson, & Törlind (2015), iteration is used to ensure that user needs are met, which means continually returning to the cause of the problem and increasing the understanding of the users situation.
The advantage of the iterative process is that the devel-oper is always ready to rethink and take a step back in the process (Wikberg Nilsson, et al., 2015). According to Karlsson, Osvalder, Rose, Eklund and Odenrick (2011) the workflow for a development work can be seen as a learning cyclical process and can be used for developing products as well as for developing of production systems. They agree with Wikberg Nilsson et al. (2015) that a cyclical way of working leads to a good overall approach in a short period of time and the chance of ending right increases due to the iterative method. The development process can be initiated in a number of steps where each step leads closer to the target. The iteration within each step continues until the evaluation shows that the re-sult is satisfactory. According to Karlsson et al. (2011),
the development work is continuous and parallel, the longer the development work is going on, the more the knowledge increases and the project approaches a more concrete solution.
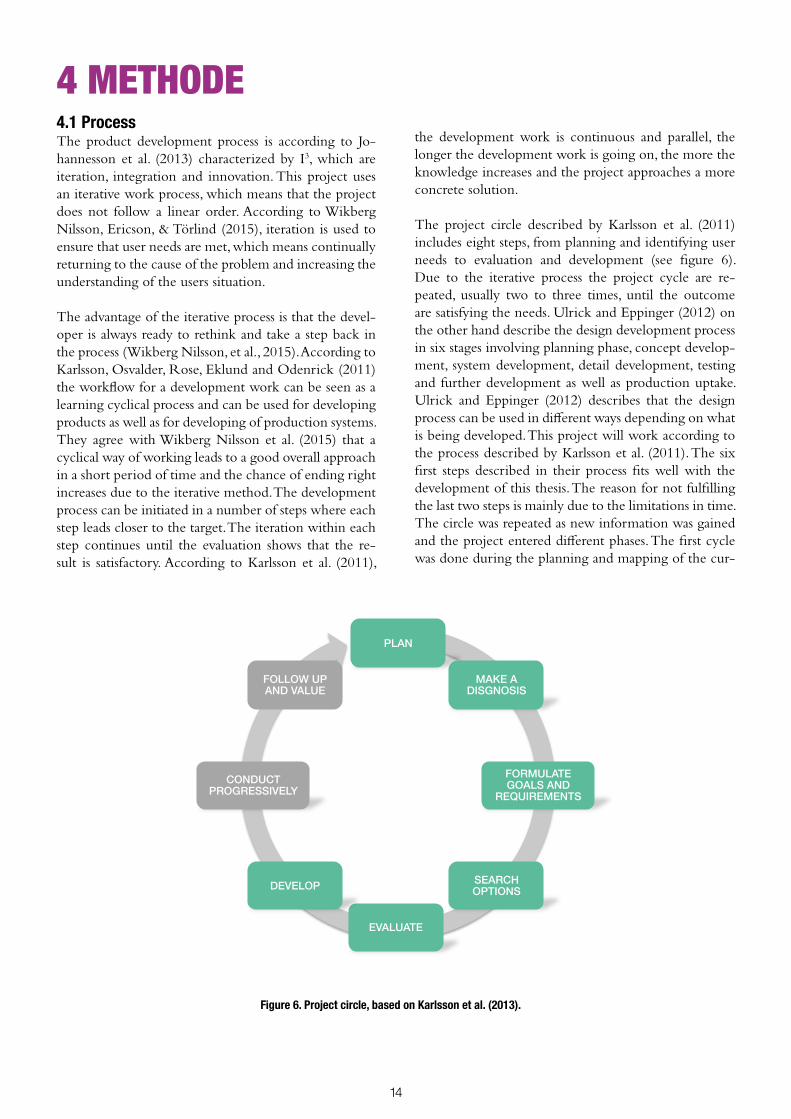
The project circle described by Karlsson et al. (2011) includes eight steps, from planning and identifying user needs to evaluation and development (see figure 6). Due to the iterative process the project cycle are re-peated, usually two to three times, until the outcome are satisfying the needs. Ulrick and Eppinger (2012) on the other hand describe the design development process in six stages involving planning phase, concept develop-ment, system development, detail development, testing and further development as well as production uptake. Ulrick and Eppinger (2012) describes that the design process can be used in different ways depending on what is being developed. This project will work according to the process described by Karlsson et al. (2011). The six first steps described in their process fits well with the development of this thesis. The reason for not fulfilling the last two steps is mainly due to the limitations in time. The circle was repeated as new information was gained and the project entered different phases. The first cycle was done during the planning and mapping of the cur-
4 METHODE
Figure 6. Project circle, based on Karlsson et al. (2013).
PLAN !
MAKE A DISGNOSIS!
FORMULATE GOALS AND
REQUIREMENTS!
SEARCH OPTIONS!
EVALUATE!
DEVELOP!
CONDUCT PROGRESSIVELY!
FOLLOW UP AND VALUE!

15
rent state. The circle was then repeated once the project entered the concept development phase and once again had to go back to square one. The circle was repeated a third time during the final concept development to make sure that the user needs were in focus. The itera-tive work enabled the project to be open to new infor-mation and requirements, from the start until the end.
4.2 Planning During the first week of the project a project plan was established. The plan fills several different purposes, part-ly as a basis for timing, while ensuring that all stake-holders agree on the purpose and goals of the project. The plan included background and cause to the project. The project raised research questions together with Es-sity’s supervisor and charted stakeholders for the project. Skrårbratt (2009) states the importance of good com-munication early in the project. In order to focus the project; delimitations, objectives and goals were clari-fied. There are two types of delimitations, delineations that separate the project from ongoing operations and delineations that separate the project with respect to the subject area, area of activities, target group, geographic area etc. (Nordberg, 2008).
According to Wikberg Nilsson, Ericson and Törnlind (2013), the project plan is a living document that is con-tinuously updated on events in the project. The project plan established a Gantt scheme to visualize the given time for the project, the schedule showed the different phases, presentations and submissions of the project. The Gantt scheme is especially useful when you want to see how different types of activities relate to each other (Nordberg, 2008). According to Nordberg (2008), the Gantt scheme clarifies the intentions of the project plan in a very conspicuous and clear way. The projects Gantt scheme can be displayed in appendix A. The different steps in the project were planned and various milestones were presented and deliverable was established. Mile-stones are an important part of the project and it helps to facilitate good communication (Skårbratt, 2009). The project plan also determined how communication should be done between supervisors and how often.
4.3 Mapping of the current stateCase studies have, according to Martin and Hanington (2012) been proposed as a useful tool for designers. The researcher needs to make initial hypotheses, conduct re-search through interviews, observations and other forms of information (Martin & Hanington, 2012). In order
to find improvement areas and understand the opera-tors everyday lives, it was decided that the project would work with the operators for two weeks. No similar proj-ect has been performed at Essity Falkenberg and the operator’s work had never been analyzed as a whole.
During the two weeks, the project worked the morning shift from 6:00 to 14:00 and was given the opportuni-ty to work with all five shift teams. The reason for this was to see differences and variations in working meth-ods between different shifts and operators. According to Martin and Hanington (2012), there are two different mapping methods called place-centered mapping and individual-centered mapping. In this project a combi-nation of the two have been used. The mapping was done at Fenix 2 (place-centered) by following operators (individual-centered). Below is a description of how the mapping was carried out and how the operators work tasks were analyzed.
4.3.1 Non-structured mapping According to Kraft (2012), it is complex to finding users needs and many different methods is necessary to cover all the different needs. To find the immediate user needs the designer needs to talk to the user, and for example do an interview. Kraft (2012) describes a method called “A-day-in-the-life”, where the designer chooses to map a typical day in the users life, which was done at Fenix 2. This is, according to Kraft (2012), a great method to find latent needs as the designer can follow the user, take notes and photos and see how the user interacts with a product/system.
In the beginning of the two weeks the project focused a lot on understanding the variety of work task among the operators. Notes and photos were taken and the op-erators described the different tasks. By talking to the operators and showing an interest for their opinions a good communication was established and the operators started to share information and be open-minded. The overall and less structured mapping was done during the first week. This was done mainly to keep an open mind and not jump to conclusions about what needs to be investigated.
4.3.2 Structured mapping Based on the result from the non-structured mapping a plan was made for the structured mapping. Mapping is a method that can be used for different aims and ap-proaches, but it is important to be aware of what is in-
16
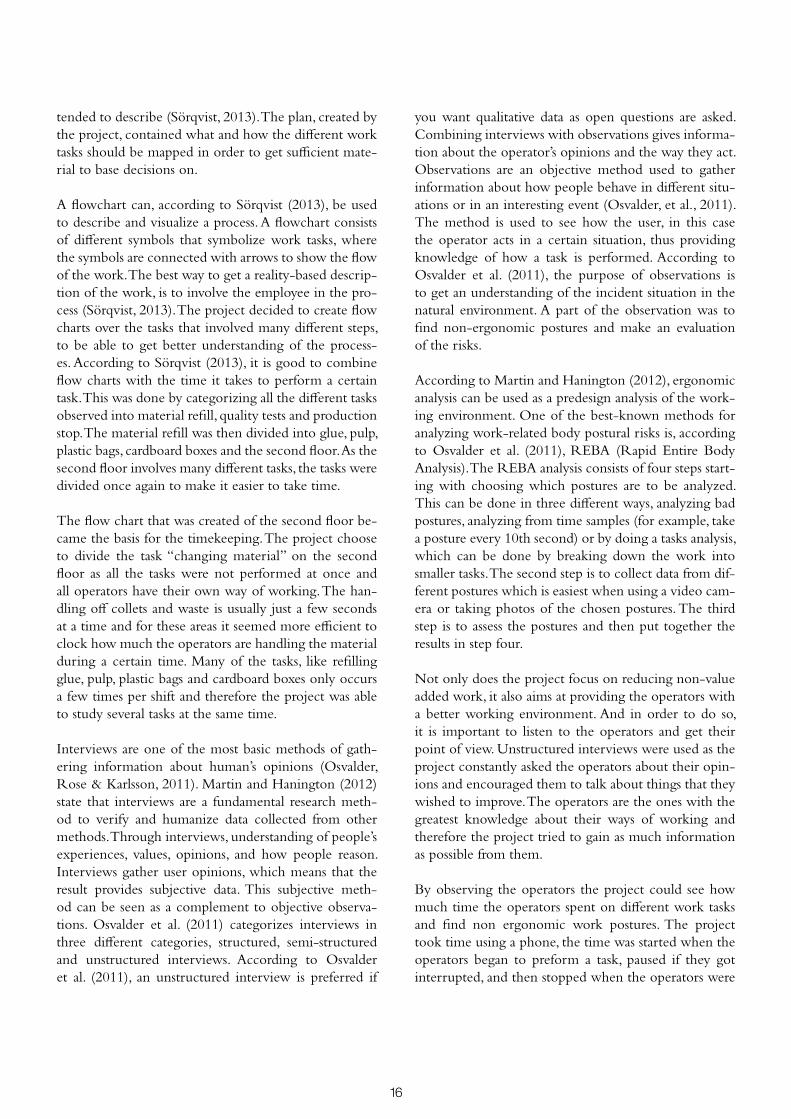
tended to describe (Sörqvist, 2013). The plan, created by the project, contained what and how the different work tasks should be mapped in order to get sufficient mate-rial to base decisions on.
A flowchart can, according to Sörqvist (2013), be used to describe and visualize a process. A flowchart consists of different symbols that symbolize work tasks, where the symbols are connected with arrows to show the flow of the work. The best way to get a reality-based descrip-tion of the work, is to involve the employee in the pro-cess (Sörqvist, 2013). The project decided to create flow charts over the tasks that involved many different steps, to be able to get better understanding of the process-es. According to Sörqvist (2013), it is good to combine flow charts with the time it takes to perform a certain task. This was done by categorizing all the different tasks observed into material refill, quality tests and production stop. The material refill was then divided into glue, pulp, plastic bags, cardboard boxes and the second floor. As the second floor involves many different tasks, the tasks were divided once again to make it easier to take time.
The flow chart that was created of the second floor be-came the basis for the timekeeping. The project choose to divide the task “changing material” on the second floor as all the tasks were not performed at once and all operators have their own way of working. The han-dling off collets and waste is usually just a few seconds at a time and for these areas it seemed more efficient to clock how much the operators are handling the material during a certain time. Many of the tasks, like refilling glue, pulp, plastic bags and cardboard boxes only occurs a few times per shift and therefore the project was able to study several tasks at the same time.
Interviews are one of the most basic methods of gath-ering information about human’s opinions (Osvalder, Rose & Karlsson, 2011). Martin and Hanington (2012) state that interviews are a fundamental research meth-od to verify and humanize data collected from other methods. Through interviews, understanding of people’s experiences, values, opinions, and how people reason. Interviews gather user opinions, which means that the result provides subjective data. This subjective meth-od can be seen as a complement to objective observa-tions. Osvalder et al. (2011) categorizes interviews in three different categories, structured, semi-structured and unstructured interviews. According to Osvalder et al. (2011), an unstructured interview is preferred if
you want qualitative data as open questions are asked. Combining interviews with observations gives informa-tion about the operator’s opinions and the way they act. Observations are an objective method used to gather information about how people behave in different situ-ations or in an interesting event (Osvalder, et al., 2011). The method is used to see how the user, in this case the operator acts in a certain situation, thus providing knowledge of how a task is performed. According to Osvalder et al. (2011), the purpose of observations is to get an understanding of the incident situation in the natural environment. A part of the observation was to find non-ergonomic postures and make an evaluation of the risks.
According to Martin and Hanington (2012), ergonomic analysis can be used as a predesign analysis of the work-ing environment. One of the best-known methods for analyzing work-related body postural risks is, according to Osvalder et al. (2011), REBA (Rapid Entire Body Analysis). The REBA analysis consists of four steps start-ing with choosing which postures are to be analyzed. This can be done in three different ways, analyzing bad postures, analyzing from time samples (for example, take a posture every 10th second) or by doing a tasks analysis, which can be done by breaking down the work into smaller tasks. The second step is to collect data from dif-ferent postures which is easiest when using a video cam-era or taking photos of the chosen postures. The third step is to assess the postures and then put together the results in step four.
Not only does the project focus on reducing non-value added work, it also aims at providing the operators with a better working environment. And in order to do so, it is important to listen to the operators and get their point of view. Unstructured interviews were used as the project constantly asked the operators about their opin-ions and encouraged them to talk about things that they wished to improve. The operators are the ones with the greatest knowledge about their ways of working and therefore the project tried to gain as much information as possible from them.
By observing the operators the project could see how much time the operators spent on different work tasks and find non ergonomic work postures. The project took time using a phone, the time was started when the operators began to preform a task, paused if they got interrupted, and then stopped when the operators were

17
finished. The time it takes to perform a task depends partly on the operator, but also on the work environ-ment that might causes the operators to perform a task faster due to stress. In order to get reliable data, each work tasks were timed several times performed by sever-al operators at different shifts. How many measurements that was done on each tasks varied due to how often it was performed, but a minimum of five measurements was used. The average times was calculated by adding all the times together and then divide the total with the number of measurements.
During the observation it was made clear that many of the work tasks were non-ergonomic, especially the refill of glue. The project decided to make two REBA ana-lyzes on different postures when the operators refilled glue. To investigate the working environment further a meeting was held with two of the safety engineers where the project had the opportunity to ask them about the safety-and ergonomic work at Essity. This was done to make sure that the projects views on the oper-ator’s works tasks agreed with incident reports and the operators’ opinion.
In order to find out how much time the operators spent performing a certain task during one shift the project needed to know how many times each task was per-formed. To get as accurate result as possible the project decided to calculate the time for the material handling instead of manually calculate all the material delivered to Fenix 2. The project contacted the material planners and they provided Excel lists of all the material that had been delivered to and from Fenix 2. The Excel docu-ment from the material planner included data from seven days of production, and the efficiency of Fenix 2 during this time could be seen as “normal production”. The data from the Excel document was divided and grouped, so that, for example all material to the second floor was summed up. After this all material belonging to the same area were added together to get the total material delivered to Fenix 2 during a week. The weekly production was then divided to material delivered/8h. By doing this, general frequency of different material handling per shift could be established. During this time Fenix 2 produced different orders, had its normal RIS-stop and rescheduling. The result of the total time was then summarized in tables.
Even though the project is not focusing in production stop or the causes of mechanical problems, it is still im-
portant to know how much time this takes during a shift. To get the average time of the production stops, both planned and unplanned the project received an excel document from one of the Quality Engineers at Falkenberg. The document included all stops on Fenix 2 from the 1st to the 31st of March. The document in-cluded number of planned stops, number of unplanned stops, average duration of the stops and total stop time per day. The information received were then summed up and presented in the context.
The times collected by the project were analyzed to-gether with Marcus Lehto, to see if the results seemed reasonable and if there was something missing. It was decided that the project should continue with the map-ping, as there was still a lot of time missing compared with the working hours available. The project would look further into the operators walking and how they interact with the alarm/HMI.
A good way of analyzing a flow is to create a so-called spaghetti diagram, which fits well if the flow is un-clear or there are many different ways to perform a task (Sörqvist, 2013). A spaghetti diagram is according to Sörqvist (2013) developed from a graphical image of the environment where the flow is to be analyzed. Next, you draw lines that represent the physical material, product and/or individual flow. Spaghetti diagrams can be supplemented with facts about times and distances of the area (Sörqvist, 2013). Also Pettersson et al. (2010) states that spaghetti diagrams is a great tool to use when mapping activities.
The project decided to do a few spaghetti diagrams to visualize the operators’ movement at Fenix 2. The proj-ect started with making a graphical image of the layout at Fenix 2 using Microsoft PowerPoint, the advantage of using PowerPoint is that a layout can easily be drawn us-ing simple symbols. The layout was not made to scale as the project mainly wanted to show movement and not spend too much time on measuring up everything in detail. Different operators where then observed during a specific time, and the project drew lines as the oper-ators moved around at the Baby machine. The opera-tors were aware that they were being mapped, but they didn’t know what the project was observing. An analyze of the spaghetti diagrams was made together with Mar-cus Lehto and it was decided that this area needs to be investigated further.

18
The project needed to quantify the amount of walk-ing and the operators were therefore provided with step counters. The step counters were given to the opera-tors together with an explanation of the propose with the test. The step counters was left with the operators for a week and they were responsible for using them and in the end of the shift writing down the number of steps, distance and hours worked. The step counters were preset on a step length of 75 cm, which is not what reality looks like since all operators have different step length. This was done, as it would have been to time consuming for the operators to reinstall the step count-ers in the start of each shift. Therefore the analysis was made on the number of steps and since the shift varies in time the project converted the steps into steps per eight hours. After analyzing the results the project felt that it was important to include the operators and hear their opinions about the walking and their overall working environment.
Surveys are a subjective method and can be seen as a type of structured interview, without the interviewer present (Osvalder, et al., 2011). According to Osvalder et al. (2011), when creating a survey, it is important to formulate simple and clear questions as the questions can be interpreted unambiguously. Response options or scales can be used in combination with open questions where respondents can provide more detailed answers. The survey was written in a Word document, printed and handed over to the operators with a description. This was done to ensure that the project had perceived the operator’s situation and opinions in the correct way. As they work in shift the surveys were left in at Fenix 2, giving the operators the possibility to answer when time was available. The project then collected the an-swered surveys after two weeks and complied the results in Google Forms, a tool that automatically analyze the answers and provide charts and statistics. In order to use Google Forms the project needed to transfer the an-swers from the printed document into the digital form manually.
In the survey the operators received questions about the alarm at Fenix 2. Based on the results the project wanted to investigate this further and asked one of the electri-cians for help. He came up with a solution that could calculate how many times the alarm lamp was turned on during each shift. This was done to see if the alarm could be a reason for the amount of walking amongst the operators.
As a final step in the mapping the project also wanted to find out about ongoing projects in Falkenberg. This was done to ensure that the project does not do the same thing as any other project, and that Essity would get out the most of this thesis. Marcus Lehto gave the project names of other people that are involved or responsi-ble for ongoing projects. The project then contacted the people involved for a shorter meeting, in this way the project could gain more information for the project and the current state.
4.3.3 Decision Together with the supervisor at Essity the context was analyzed with focus on both time and ergonomic. A de-cision was made to develop several areas founded in the mapping, with focus on creating improvement concepts for the areas. The tasks that took the most time would be prioritized, as this would benefit the company most. Second priority was to focus on reducing non-ergo-nomic work tasks and improve the environment for the operators.
It was also decided that the project should not develop the concept in detail as Essity will take the interesting areas and concept in this thesis and turn into future proj-ects. The project will instead focus on finding alternative solutions and calculate how much time each solution saves, or how it will improve the working environment for the operators.
4.4 Literature To gain a better understanding of the areas covered by the project, a literary study was carried out. Literature was read at the beginning of the project and then con-tinuously supplemented as new areas became relevant. Reinecker and Stray Jörgensen (2014) believe that lit-erature search can be done using three different basic methods. These methods are called chain search, system-atic search and random search. Chain search means that appropriate literature is found and that one text leads to another text. The strength of this method is that it leads from one good reference to the next, the disadvantage is that the reader gets stuck in one point of view. The systematic search is used when searching for informa-tion about a specific subject. The same search words is used on several different databases to find the request-ed information. Random search, is just what it sounds like, information founded is based on a random search where the reader gets inspired along the way. The ran-dom method fits best at the start of a project (Reinecker

19
& Stray Jörgensen, 2014). The literature review is ac-cording to Martin and Hanington (2012) intended to distill information from published sources and capture the essence of previous research.
The project has used a systematic method and chain increase. The literature research have been in progress for a long period and the keywords have therefore been changed as the project took its course. The project start-ed by searching information on Web of Sience as well as Scopus with the keywords “Industry 4.0”, “Smart fac-tory”, “Operators in Industry 4.0”, “Lean AND Indus-try 4.0”, just to mention a few. The project has applied inclusion and exclusion criteria, this was to focus on scientific articles that were not older than five years.
4.5 Benchmarking A benchmarking was carried out in order to get in-spiration to future concepts and better understanding of available solutions. The benchmarking was carried out through a Skype interview with Robbert Beerens in Gennep, Netherlands. Gennep is another factory in the Essity concern and was chosen because they have a similar production as the one in Falkenberg. An in-terview was held over Skype where the project gave a short introduction to the work and explained the areas that are most interesting to the project. Robbert then provided information about their material handling, quality testing and HMI/alarm. He showed pictures, ex-plained ongoing projects and the current state in their production. Robbert was contacted again after the first interview to supplement with information and reply to questions that had been raised after the interview. The second contact was made over e-mail.
4.6 Ideation A crucial prerequisite for successful creative processes is to correctly formulate the problem (Wikberg Nilsson, et al, 2013). By using creativity, old thinking paths can be broken and participants are encouraged to think a bit “outside of the box”. And the ideas created are a first step towards of a solution to a problem. Brainstorming is a widely used method for generating ideas, and the method is used to develop ideas and suggestions (Os-valder, et al., 2011). Characteristic for the method is that seminars or workshops are often arranged. The method is used to generate as many ideas as possible with the purpose of solving a specific problem (Osvalder, et al., 2011). An important rule is, according to Osvalder et al. (2011), that no criticism or negative comments may
be given during work because it inhibits creativity. All ideas are noted and another person can then build on the ideas presented and it is free to combine ideas. The selection of participants is important for the results to be good and after a brainstorming the ideas should be evaluated (Osvalder, et al., 2011).
The project started by doing a brainstorming area by area, where both text and simple sketches were drawn and documented on post-it notes. The different areas where documented on different colors, for example green post-its were used for ideas for the second floor. After the brainstorming all ideas where put on a wall so the project would be able to see them together and find possible combinations between the areas. By look-ing at all ideas at the same time the project could do a reflection and see if there was any combination or ideas that could become an overall concept for Fenix 2. A few ideas where combined and the brainstorming ended with an analysis of the ideas. The ideas that could be a possible solutions for the different areas where picked out and a second brainstorming was done with focus on finding improvements of the chosen ideas. The sec-ond brainstorming resulted in developments of the first ideas, where the focus was to find alternative layout, placement or digital solution to the first idea.
Measurements of the existing areas were needed to be able to make more detailed concepts. The project asked several people for detailed maps, but finding a map of Fenix 2 including measurements was difficult. The proj-ect then decided to measure relevant areas of Fenix 2 using a laser rangefinder. The measurements were trans-ferred to ShetchUp, a program for drawings in 2D and 3D. SketchUp was used, as the project is familiar with the program from previous courses at the Luleå Uni-versity of Technology and already had the program in-stalled. The ambition with the drawings was to get a bet-ter understanding of the available areas and to visualize the placement of the concepts. The project measured up the construction and all the fixed, and relevant element. Pieces of furniture and material were left out as it would take to long to draw up. The project measured up the second floor and the areas around the Casepacker. When using a sketch with real measurement the project could see what solutions that can fit into a certain area.
The project made some sketches by hand to figure out how the conveyor could be placed and how the two machines could be build together. When the two ma-
20
chines where build together the project focused on how to atomize the material handling. First gantry robots was placed on the already existing construction, and a few poles were added. After this the project tried to figure out how the automatic AGVs should move, where mate-rial should be stored, safety zones and how the operators should move (walkways etc.). The project then focused on how the material could be placed to optimize the available space, different options were tested and mea-surement was done to make sure both the AGVs and the robot could reach the rolls.
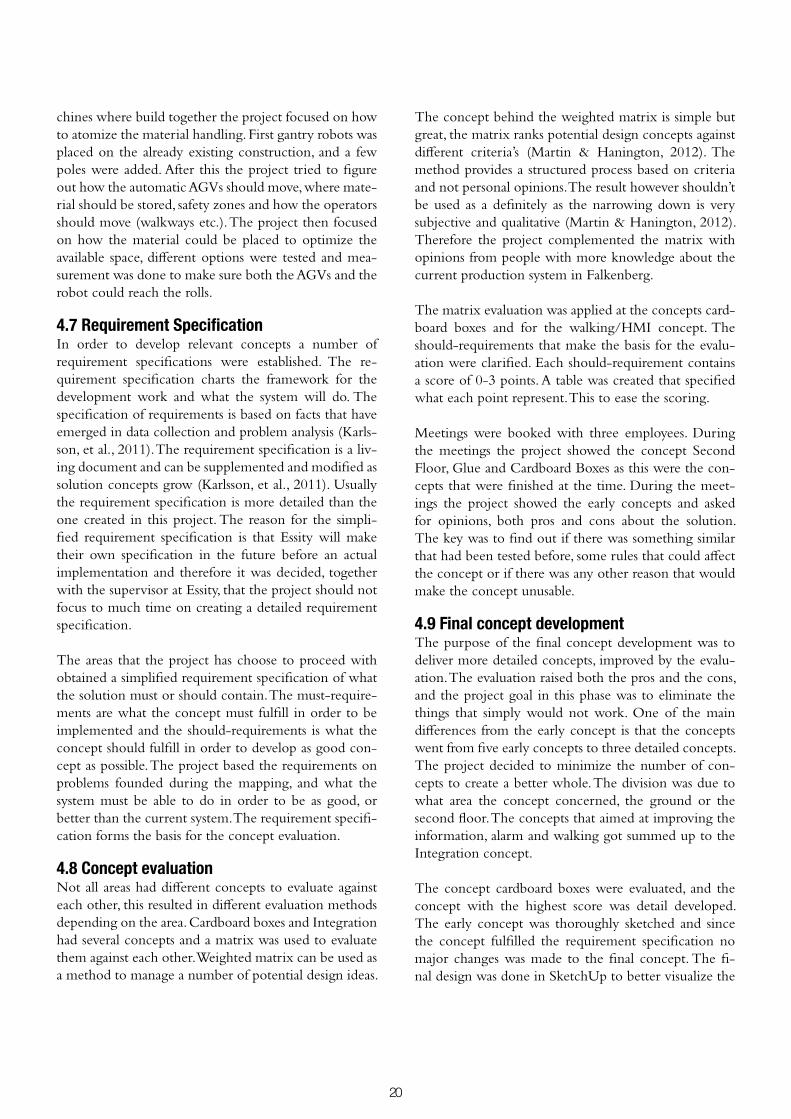
4.7 Requirement SpecificationIn order to develop relevant concepts a number of requirement specifications were established. The re-quirement specification charts the framework for the development work and what the system will do. The specification of requirements is based on facts that have emerged in data collection and problem analysis (Karls-son, et al., 2011). The requirement specification is a liv-ing document and can be supplemented and modified as solution concepts grow (Karlsson, et al., 2011). Usually the requirement specification is more detailed than the one created in this project. The reason for the simpli-fied requirement specification is that Essity will make their own specification in the future before an actual implementation and therefore it was decided, together with the supervisor at Essity, that the project should not focus to much time on creating a detailed requirement specification.
The areas that the project has choose to proceed with obtained a simplified requirement specification of what the solution must or should contain. The must-require-ments are what the concept must fulfill in order to be implemented and the should-requirements is what the concept should fulfill in order to develop as good con-cept as possible. The project based the requirements on problems founded during the mapping, and what the system must be able to do in order to be as good, or better than the current system. The requirement specifi-cation forms the basis for the concept evaluation.
4.8 Concept evaluation Not all areas had different concepts to evaluate against each other, this resulted in different evaluation methods depending on the area. Cardboard boxes and Integration had several concepts and a matrix was used to evaluate them against each other. Weighted matrix can be used as a method to manage a number of potential design ideas.
The concept behind the weighted matrix is simple but great, the matrix ranks potential design concepts against different criteria’s (Martin & Hanington, 2012). The method provides a structured process based on criteria and not personal opinions. The result however shouldn’t be used as a definitely as the narrowing down is very subjective and qualitative (Martin & Hanington, 2012). Therefore the project complemented the matrix with opinions from people with more knowledge about the current production system in Falkenberg.
The matrix evaluation was applied at the concepts card-board boxes and for the walking/HMI concept. The should-requirements that make the basis for the evalu-ation were clarified. Each should-requirement contains a score of 0-3 points. A table was created that specified what each point represent. This to ease the scoring.
Meetings were booked with three employees. During the meetings the project showed the concept Second Floor, Glue and Cardboard Boxes as this were the con-cepts that were finished at the time. During the meet-ings the project showed the early concepts and asked for opinions, both pros and cons about the solution. The key was to find out if there was something similar that had been tested before, some rules that could affect the concept or if there was any other reason that would make the concept unusable.
4.9 Final concept development The purpose of the final concept development was to deliver more detailed concepts, improved by the evalu-ation. The evaluation raised both the pros and the cons, and the project goal in this phase was to eliminate the things that simply would not work. One of the main differences from the early concept is that the concepts went from five early concepts to three detailed concepts. The project decided to minimize the number of con-cepts to create a better whole. The division was due to what area the concept concerned, the ground or the second floor. The concepts that aimed at improving the information, alarm and walking got summed up to the Integration concept.
The concept cardboard boxes were evaluated, and the concept with the highest score was detail developed. The early concept was thoroughly sketched and since the concept fulfilled the requirement specification no major changes was made to the final concept. The fi-nal design was done in SketchUp to better visualize the

21
lift and the movements of the pallets. The concept plas-tic bags fulfilled the requirement specification and no changes was done to the final concept. This was due to the projects relevance compared to the other concepts. This two concept are included in the concept Ground Floor.
The second floor got much feedback from the meetings with employees. The project decided to reduce all the cons and make a different solution that hopefully were more relevant to the company. A new layout was drawn, based on the idea to build the machines together and use the area in the open area down to the ground floor. The elevator was moved from the back (early concept) to the existing position to avoid interfering with the material flow on the ground floor. The project tried to separate the flows of the AGV with the operators, but due to lack of space it was very hard. Different solutions were tested but in one way or another the operators had to cross the AGVs flow or walk under the robots. The project decided that it was better for the operators to cross the AGVs flow rather than walk under the robots. The storage of material was eliminated but the project decided to place the four glue tanks on the second floor. This is already done on the newer Baby machines and the operators have time to perform this task, based on the current state. The second floor together with the glue formed the final concept Second Floor.
Concept Monitor, Mobile device and different colored lamps were merged together into one concept, Integra-tion. The project drew a few suggestions for the moni-tors interface, with focus on what is the most important to display. The current HMIs are not as visible and there-fore the project suggested a placement for the monitors that would improve the visibility. The alarm lamps will attract attention of the operators and make them look at the monitors, and therefore they were kept. No major change was done from the early concept of the alarm lamps or the mobile device.
4.10 Method discussionIn the start of the project the aim was mainly to find the non-value adding work and do an overall analyze of the operators work. The outcome of the project relied on the result from the mapping and therefore the project had to be very open-minded in the start. The iterative work process suited the project well as the project need-ed to go back to the current state several times to gather information. Going back and gather more information
is something that the method encourage and therefore the method suited the project well. In a few cases the project needed help to gather information, which some-times took longer time than expected. This resulted in the project working on several areas at the same time in order to not fall behind schedule too much.
Not much information was received before starting the mapping, and as this was the first time meeting the op-erator the project initially spent a lot of time socializing. During the unstructured mapping the project tried to understand as much of the work tasks as possible and sometimes the project went too much into detail rather than looking at the bigger picture. There is also a risk that the project based interview questions based on own experiences as operator. The experience may also be a benefit as a greater understanding could be gained in shorter time and that the project could pay attention to details.
The mapping took place over a long time, in many steps. At first the project thought that the main areas to look at was the material refill, but when it was made clear that this area was not the only thing to look at the project needed to go back and supplement with more obser-vations. This resulted in the project spending a bigger part than planned for the current state. During this time the project tried to do several things at a time in order to collect as much material as possible. The timekeep-ing was something that was affected by the production and sometimes the project could not stick to the plans due to production stop. The project on the other hand tried to be very accurate and do many measurements on each work task to gain as reliable data as possible. The uncertainty of the timekeeping is that the project missed to map certain tasks and therefore got the overall times wrong. The project tried to avoid this by showing the mapping to more experienced workers. The proj-ect needed data from different people, here the project could have been more consequent and collect data from the same period which was not done. The validity of the time measurement will also be affected by the person taking the time, as the uncertain part of this is when the tasks starts and when it ends.
The project motivated the analyze of glue based on the incident rapports that had been written. The reliability of the incidents reports is difficult to know, and there is a possibility that other critical areas have not been noticed as much. The REBA analysis that was carried

22
out was only done at one operator, due to the difference in working, another operator might had performed this task in another way. The spaghetti diagram was a great tool to visualize the walking, but the project could have been more consequent. The project did not have the same time for all the diagrams, which makes it hard to compare them. The project intended to have the same time, but sometimes the operators had to leave the ma-chine or rotate work tasks and the measurement got in-terrupted.
The operators were responsible for writing down their own results from the step counters, there is a risk that they wrote down something else than what the step counter displayed. The project also heard that some operators had competed with each other about who walked the most, this was not the purpose since it can lead to misleading results. On the other hand was this hard to affect as the project needed to rely on the op-erators.
The questions in the survey were based on the informa-tion gathered during the mapping and therefore the sur-vey contained certain types of questions. There is several uncertainties in a survey, the questions may be interpret-ed wrong or be wrongly formulated, the survey might miss to ask important questions, the answers might not be truthful or the participation might affect the answer.
The benchmarking was carried out as the project was curious to see alternative solutions in other factories. The benchmarking to Gennep resulted in good infor-mation about their current state, and also about their future plans. In the beginning of the project the idea was to start with Fenix 2, but then look more into the other production lines in Falkenberg as they all differ a bit from each other. Since the mapping took longer than expected this part had to be cut down, something that might would have benefited the project.
The brainstorming session were made by the project alone which affects both the number of ideas and the outcome. Creative methods woks best in teams but in this case the project had to proceed alone in order to not fall behind schedule. TThe ideas generated were affected by the information gathered from the mapping. Involv-ing more experienced employees might have lead to a different result as they know more about the operators work. In order to compensate, the project decided to show the early concept for responsible people and let
them come with feedback and be a part of the evalua-tion. The advantage with this method is that people that are not used to work with creative methodes often feel that it is easier to give feedback on an already though through concept.
The plan was not to use SketchUp in the early concept stage, but as no map could be found it was necessary to measure the areas by hand. This was done to make sure that there was enough space for certain concepts, and it would also be needed for the final concept. However the project assumed that there would exist a map, and therefore the measuring was not a part of the plan, re-sulting in the project falling a bit behind schedule.
The result from the early concepts resulted in some areas having more concepts than others. For example ,cardboard boxes had three early concepts and the sec-ond floor only one, affecting the evaluation. When the concept included several ideas a matrix could be used to evaluate the concepts, but when the project only got one the matrix was not applicable. This resulted in dif-ferent methods for the different areas. Evaluating them differently may affect the outcome and the concepts chosen. Due to lack of time, the project was not able to get feedback from employees on all the concept, some-thing that may resulted in the project proceeding with non relevant solutions.
The final development of the concepts was done to im-prove and better visualize the early concepts. Some areas were more developed than others, which was due to feedback and how detailed the early concept were. The final development was done by the project alone and no creative method was used to find improvements. This might affected the outcome, if the project would have done a creative method together with employees the final design might have another outcome.

23
5CONTEXT An important part of production developing is to understand the current state. This context primarily describes the work on Fenix 2, one of the Baby machines in Falkenberg. Fenix 2 was chosen as a suitable machine to study as no major production stop was planned during this time. This chapter describes operators’ daily work and focus on non-value added activities and working environment.

24
5.1 Material refillOperators are responsible for refilling material to the respective Baby machine. Material refill takes a lot of time and can be seen as the most time consuming task for the operators. The material refill described is the one performed most often by the operators.
5.1.1 GlueThere are six different glue tanks at Fenix 2, five of them are manually refilled by dropping glue blocks into a heated containers (figure 8) and one of them is re-filled using a truck. The glue is then melted down and pumped into pipes into the production line. Filling glue is done several times per shift and operators get an alarm when the glue levels are low. There are four glue tanks on the front (spray glue, construction glue, wet indica-tor glue and cardboard box glue) and two on the back (CU/CL glue and TA glue). The operators usually fill more than just one tank at a time, even though it is only one of the tanks that alert about low level, this is done mainly to save time. Some operator choose to refill the glue both on the front and the back at the same time,
while some choose to separate the refill and take the back when needed and the front when needed. When refilling the back of the line the operators cannot see what happens in the production line, which is perceived stressfully. Table 1 shows the time it takes to refill the tanks. The table only shows the smaller glue tank and not the big containing construction glue, that refills less often using a truck.
5 CONTEXT
Figure 7. Overview over some of the areas in the context.
Figure 7 visualizes the ground floor at Fenix 2 and some of the areas where the project did the mapping.
Bagfiller
Casepacker
Quality station
Pulp
Glue - back
Figure 8. Glue tank, closed and opened.

25
Table 1. Average time to refill glue.
Refill glue Back Front Average time (min) 4 2Times/8h 6 4Result 24 min 8 min
During the two weeks the project spent in production a new glue type was tested on the back, called CU/CL. The operators experienced that the new glue needed to refill more often which is believed to be due to the packaging. The new glue bag contains more air than the previous bag of glue and is not as compact.
5.1.2 PulpTo achieve good absorption capacity, the core of the dia-per contains paper pulp. The pulp is delivered to the Baby machine by automatic truck and each package contains two rolls. Operators take off the plastic and move the roll using an electric hand truck to the pulp rack. The pulp is placed in the correct position and locked. Finally, the operator tape together the old pulp with the new one using a machine placed on a rail in the ceiling. Fig-ure 9 represents a flowchart over the change. It takes an average of 6 minutes to change the pulp. The warehouse delivers an average of 2.6 packages (5.3 rolls) per 8h, giving a handling time of approximately 32 min/8h.
5.1.3 Plastic bags Depending on the order, the diapers are packed in dif-ferent plastic bags. The bags are delivered in bundles of 100 bags, connected with a plastic clip. The operators load the bundles on a small conveyor that are automat-ically fed into the Bagfiller. The conveyor can hold a
total of seven bundles (700 bags) where two bundles are placed in the machine and five are possible to reload, see figure 10. When the bags are running low a sensor trig-gers the alarm, and the lamp lits. How often operators need to load bags depends on the number of diapers in each bag, the bigger bags the more rarely they need to refill. Sometimes the operators fill in as much material as possible, but if it is stressful and a lot to do in other areas they only fill a few bundles. It takes average 70 seconds to load bags, in table 2 is the total time spent on handling bags calculated. It also takes about 4 minutes to change a pallet and it is done once /8h.
Figure 9. Flowshart over the change of pulp.
Size Diapers/min Bags/min 500 (100*5) bags lasts Refill/8h Total time Average time
Size A 850 850/22= 38,64 500/38,64 = 12,94 min 37 43 min 30 min Size B 850 850/56 = 15,18 500/15,18 = 32,94 min 15 17min
Table 2. Time spent on refilling plastic bags.
ORDER PULP!
REMOVE OLD
COLLET!GET THE TRUCK!
REMOVE PLASTIC!
MOVE WITH
TRUCK!
PLACE ON UN-
WINDER!CUT! FEED
MATERIAL!
Figure 10. The conveyor with plastic bags.

26
5.1.4 Cardboard boxes How often operators need to refill the cardboard boxes depends on the size of the plastic bags and how many bags that are packaged in each box. When using small cardboard boxes Casepacker often stop and operators spend a lot of time restoring alarms and removing mis-placed boxes. When operators refill the boxes, they can-not see what’s happening on the Baby machine or if the alarm goes off. When the alarm lamp is flashing, oper-ators can only see weak reflections in the plexiglas. The operators often choose to refill about 100 boxes, which is half of what is possible. The machine alerts when the level of boxes are down to approximately 50 boxes, and the operators refill to 150. It takes 3 min to refill carton boxes and table 3 visualizes an example of how much time is spent refilling small boxes compared to small boxes. It also takes about 4 minutes to change the pallet which, on average, is 5,7 times/8h, resulting in approxi-mately 23 minutes / 8h.
5.1.5 Second floorThe eleven different materials placed on the second floor are ordered from the central warehouse and delivered with an automatic truck. Operators are responsible for placing the material in the correct storage location and then continually filling the materials on the unwinders (figure 11). When the machine is rolling, there is always one operator on the second floor since the work is more or less continuously. How high the workload is depends on the size of the diapers, larger diapers require more material and the rollers then need to be replaced more often. Sometimes the material breaks or folds and it is the operators task to fix this. To better understand the work process on the second floor, see the flow chart in figure 12.
Size Diapers/ min
Boxes/min 100 boxes lasts Refill/8h Total time
Average time
Size C 850 850/176= 4,83 100/4,83 = 20,7 min 23 69 min 61 minSize D 850 850/224 = 3,79 100/ 3,79 = 26,4 min 18 54 min
Table 3. Time spent on refilling cardboard boxes.
Figure 12. Flow chart of the work process.
Task Material to stor-age (and back)
Place on unwinder (carry)
Place on un-winder (manual crane)
Place on un-winder (over-head crane)
Scan material
Threadunwinder
Average time (s)
140 15 38 60 10 42
Times/8h 15*2 =30 11,1 38,5 47,4 47 97Result 70 min 2,7min 24min 47,4 min 8 min 68 min
Table 4. Required time for different tasks.

27
Figure 11. Material on the unwinder and storage on the second floor.
Work on the second floor also involves handling pack-aging and sorting garbage. During a time of 15 min the operator spends approximately 90 seconds handling collets, which results in 6 min/hour and 48 min/shift during full production. During a time of 15 min they also spent approximately 40 seconds handling packag-ing and waste, which results in 21 min/shift during full production.
5.2 Quality testsTo ensure the quality of the products, operators perform continuous quality tests during their shift. The diapers are taken directly from the production, both before and after they are packed to make sure that the products do not get damaged in the packaging process. What needs to be done on each test is described in a digital docu-ment, which is signed once the test is done.
Test 1. Four times an hour, the machine alerts that it is time for control. Operators take out one or two diapers and examine them visually and strain them to see that the strength is good.
Test 2. Every hour the operators do a more extensive quality check where 15 diapers are examined. They check product mark, welding, placement, holes and scratches, and so on.
Test 3. At the beginning of each shift, a larger test is made. Five diapers are selected from a package where tensile strengths are carried out on the edg-es of the diaper to check that the adhesive holds (see figure 13). The diapers are weighed and the welding of five plastic bags is measured and checked. Is there a lot to do when operators get to their shift, the op-erators leave the test until time is given. Table 5 sum-marize the time spent on the different test each shift.
Figure 13. Tensile strengths.
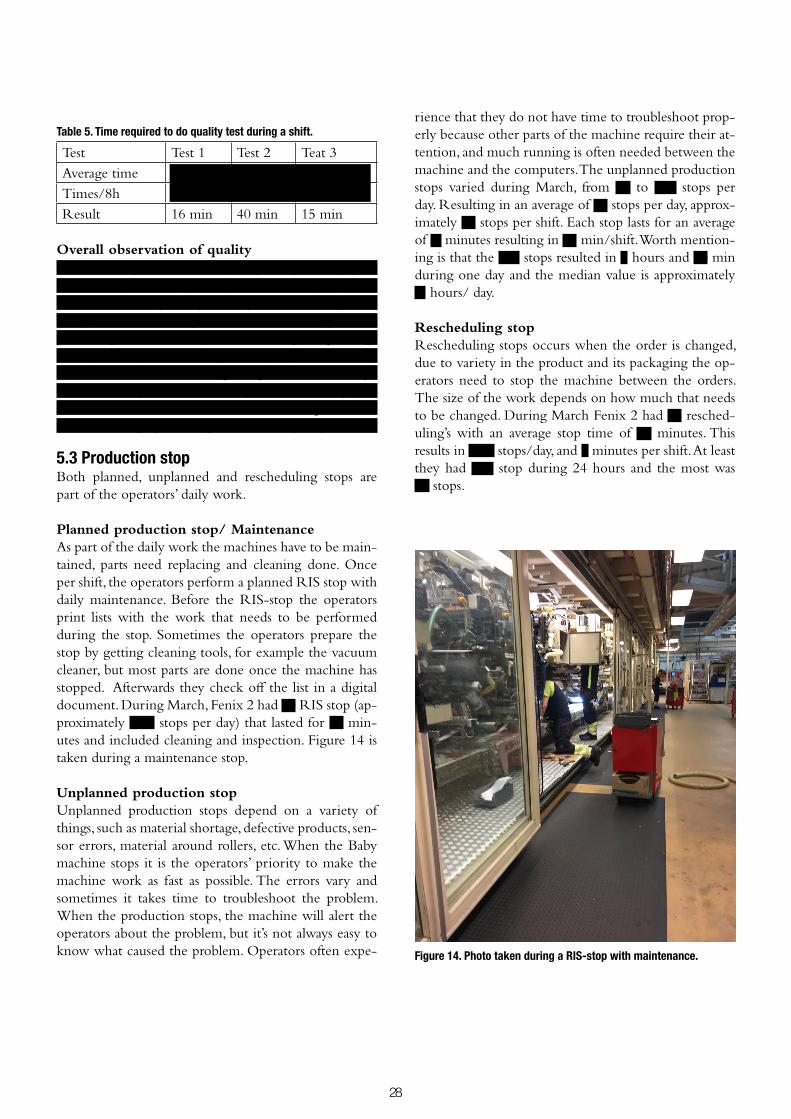
28
Table 5. Time required to do quality test during a shift.
Test Test 1 Test 2 Teat 3 Average time 30 s 5 min 15 minTimes/8h 32 8 1Result 16 min 40 min 15 min
Overall observation of quality When the operators are busy, especially during pro-duction stop or unexpected problems the quality tests becomes second priority. The operators often get in-terrupted when making the tests. The welding on the plastic bags does not always work, leading to open bags leaving the Optima. Usually the bags get sorted away because the have the wrong weight, but not always. Sometimes bags with bad welding makes it to the Jomet Case Packer and it can be stressful for the operators to find the damage plastic bag since it is very easy to miss.
5.3 Production stop Both planned, unplanned and rescheduling stops are part of the operators’ daily work.
Planned production stop/ Maintenance As part of the daily work the machines have to be main-tained, parts need replacing and cleaning done. Once per shift, the operators perform a planned RIS stop with daily maintenance. Before the RIS-stop the operators print lists with the work that needs to be performed during the stop. Sometimes the operators prepare the stop by getting cleaning tools, for example the vacuum cleaner, but most parts are done once the machine has stopped. Afterwards they check off the list in a digital document. During March, Fenix 2 had 70 RIS stop (ap-proximately 2,26 stops per day) that lasted for 20 min-utes and included cleaning and inspection. Figure 14 is taken during a maintenance stop. Unplanned production stopUnplanned production stops depend on a variety of things, such as material shortage, defective products, sen-sor errors, material around rollers, etc. When the Baby machine stops it is the operators’ priority to make the machine work as fast as possible. The errors vary and sometimes it takes time to troubleshoot the problem. When the production stops, the machine will alert the operators about the problem, but it’s not always easy to know what caused the problem. Operators often expe-
rience that they do not have time to troubleshoot prop-erly because other parts of the machine require their at-tention, and much running is often needed between the machine and the computers. The unplanned production stops varied during March, from 11 to 117 stops per day. Resulting in an average of 51 stops per day, approx-imately 17 stops per shift. Each stop lasts for an average of 5 minutes resulting in 85 min/shift. Worth mention-ing is that the 117 stops resulted in 9 hours and 30 min during one day and the median value is approximately 4 hours/ day.
Rescheduling stopRescheduling stops occurs when the order is changed, due to variety in the product and its packaging the op-erators need to stop the machine between the orders. The size of the work depends on how much that needs to be changed. During March Fenix 2 had 76 resched-uling’s with an average stop time of 11 minutes. This results in 2,45 stops/day, and 9 minutes per shift. At least they had one stop during 24 hours and the most was 11 stops.
Figure 14. Photo taken during a RIS-stop with maintenance.

29
5.4 Working environment and ergonomics Safety and ergonomics are something that Essity is con-stantly working with and protective equipment should be used properly when needed. Below are a few points noted during the observation and interviews.
Stress. The stress level of the work depends mainly on how well the machine is running and which orders are running. Baby machines run 24 hours a day and opera-tors themselves are responsible for planning their breaks. When they work from 6.00 to 14.00, each operator usu-ally takes 30 min breakfast and 30 min lunch. This re-sults in the only two operators on the Baby machine for three hours per shift. When there are only two people, one operator is stationed on the second floor and the other one on ground level.
Bad vision. Operators go a lot back and forth on the production line, as they do not see what happens at posi-tion B if they are in position A. This occurs, for example, at start-ups after a stop. Operators may want to trou-bleshoot a specific part and at the same time do not see what is happening elsewhere, this is often stressful and there is a risk that they do not pay attention to all prob-lems. At one point, an operator debugged the Bagfiller to detect why the vacuum to the bags did not work. The operator did not see that the Casepacker had stopped behind him, he only saw the alarm lamp flashing and had to go to the HMI to find out that the problem was just behind him.
Sound level. Due to high ventilation and noise from the production line, operators are required to use hear-ing protection. In order to communicate with each oth-er, com-radio is used, which facilitates communication and contributes to a more social work environment. Sometimes it can be difficult to hear what is being said and longer conversations cannot occur over the radio.
Dust. The diapers consist of several components that are assembled to optimally absorb liquid and provide com-fort. Material fibers are broken down in the machine and dust occurs. Therefore, when cleaning and blowing with air pressure, a protective facemask is used. However, operators are exposed to dust when they enter the ma-chine during production shutdowns.
The doors. Many of the sliding doors that protect the machine are difficult to open and close. When cleaning,
several doors can be pulled to the side and it may be difficult to pull them back to the right position.
Superabsorbent. Superabsorbent is a small grain that absorbs liquid and swells, and the material is placed in the core of the diaper. When handling the core, there is a risk of superabsorbent spatter up in the eyes. The usual protective glasses do not help and some operators have experienced superabsorbent in the eyes, even though they wore glasses.
5.4.1 Incidents rapports Most operators say they consider much of the safety equipment as unnecessary and some choose to skip parts of the protection. This applies especially to the handling of glue. One operator also said that they sometimes avoid writing incidents reports of fear for even more protection. Operators feel they do not get good feed-back on the incidents that are written, and want better follow-ups.
According to two safety engineers at Essity, most inci-dents are related to glue and waste management. Sever-al actions have already been taken on the glue. To ini-tially avoid the use of protective equipment, specially designed lids with smaller holes were made to prevent the glue from splashing out. However, this meant that it took a lot more time to refill since operators could not throw in several glue blocks at the same time. To improve the lifting of glue from pallet to glue container, they have changed position on the pallet and have a pal-let openable on one side. To assess how heavy workloads are, they use different assessment programs.
5.5 Analysis of contextThe analysis of the context aims at finding as much of the non-value adding work as possible and the causes of unnecessary and non-ergonomic work tasks.
5.5.1 WalkingThe machine is approximately 45 meters long and since the operators work on different areas it requires them to walk a lot back and forth. This chapter visualizes and quantifies the walking.
Spaghetti diagram Below in figure 15 is a spaghetti diagram of an opera-tor’s movement when the production worked as normal. The operator was alone on the lower floor and was not aware that they were being tracked. Figure 15 shows one

30
operator during 60min, the spaghetti diagram visualize a normal workload for the operator.
Figure 15. Mapping of an operator during 60min.
Figure 16 is a spaghetti diagram of another operator during 40 min. During this time the operator did an hourly sample, two 15min samples, refilled glue on the backside, switched pulp, filled cardboard boxes and han-dled a smaller stop.
Figure 16. Mapping of an operator during 40min.
Figure 17 shows how an operator moved during a pro-duction stop. The measurement was made for 15 min-utes and the operator was alone in handling the produc-tion stop. It is clearly seen that there is much running to reset alarms, ensure the quality of the material, while trying to troubleshoot and reboot the machine.
Figure 17. Operators movement during a 15 min production stop.
Figure 18 shows an example of the movement on the second floor, the measurement was done during 30min and the workload was normal.
Figure 18. 30 min work on the second floor.
Steps To measure the number of steps, the operators were wearing step counters for a week (14/2-21/2-2018), re-sulting in 62 measurements. The measurement was vol-untary and all operators chose to participate (only one measurement was missing). The result from the mea-surement is displayed in appendix B. For simplicity, all operators had the counters set to the same step length, even though this is not the reality. The measured dis-tance is therefore not as correct as the number of steps, therefore all data will be based on the number of steps and not the distance.
The operators’ shift varies between seven and nine hours, and in order to compare the results the steps were con-verted to steps taken during eight hours. This was done by dividing the steps with the number of hours worked and multiplying by eight. Figure 19 shows a histogram of the 63 measured values. The x-axis shows intervals of steps and the y-axis shows how many of the 63 measure-ments that each interval contains.
Figure 19. Histogram over the steps, converted to eight hours. Below , in figure 20 is a histogram of the different steps

31
that were measured, i.e. before they were converted to eight hours.
Figure 20. Histogram over steps recorded.
To see if the different shift differs from each other, all steps from the morning pass, afternoon pass and night pass were summed up. On average, the operators went 8412 steps during the morning pass, 8189 steps in the afternoon and 7122 steps during the night.
5.5.2 Alarm The alarms are categorized according by importance, where the red alarms are most critical. Most of the red alarms start an orange lamp placed at the main comput-ers, this to attract extra attention. The lamp, however, lights up very often and operators feel that they lose respect for the lamp’s value when used so frequently. The alarm resets on one of the three computers. The computers are relatively centered on the front of the machine, which results in operators may need to walk from the other side of the line to the computer, only to walk back to the first position when realizing that the problem was there all along. Figure 21 visualizes the areas where it is possible to directly see the alarm lamp.
Figure 21. The yellow areas display where it is possible to directly see the alarm lamp.
During the observations it was clear that the operators often got disrupted and spent a lot of time walking back and forth to reset and check alarms. To quantify how of-ten the alarm goes off a measurement was done. During a period from April 2nd (06.00) to 19th of April (09.30),
the orange lamp alarmed 6450 times. Resulting in an avarage of 126 alarm per shift, and almost 16 times per hour.
5.5.3 Ergonomic analysis The machine is compactly built, from floor to ceiling. Working on the machine is not easy and operators are exposed to many non-ergonomic work positions. The glue is heavy to lift and many incidents have been writ-ten on the handling of glue. This is also one of the things that the operators wish to improve. A REBA was car-ried out on the refill of glue. Figure 22 shows an oper-ator refilling glue blocks in a basket, this posture scored six points and indicates a medium risk. A medium risk means that the task should be investigated further and be changed soon. The assessment worksheet is displayed in appendix C. Figure 23 shows the posture when the operators empty the basket. This posture scored a seven in the REBA analysis, and also gets a medium risk with the same recommendation. The assessment worksheet is displayed in appendix D.
Figure 22. Refilling glue in basket.
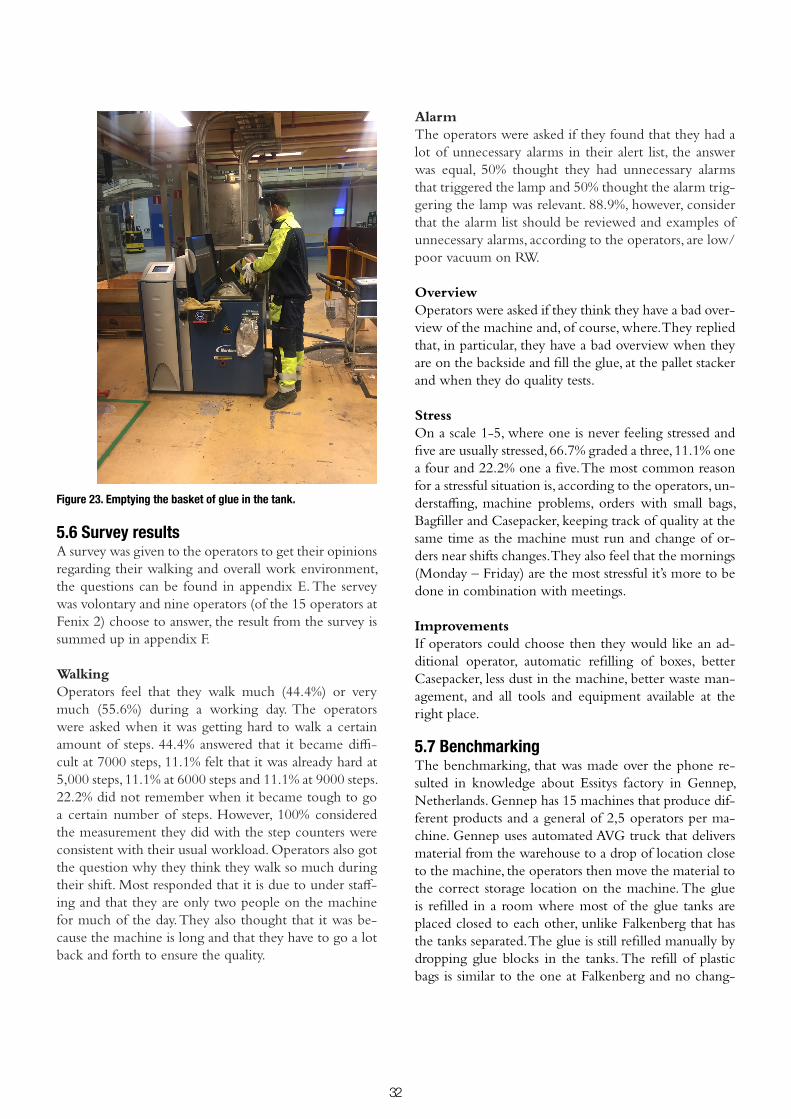
32
Figure 23. Emptying the basket of glue in the tank.
5.6 Survey results A survey was given to the operators to get their opinions regarding their walking and overall work environment, the questions can be found in appendix E. The servey was volontary and nine operators (of the 15 operators at Fenix 2) choose to answer, the result from the survey is summed up in appendix F.
WalkingOperators feel that they walk much (44.4%) or very much (55.6%) during a working day. The operators were asked when it was getting hard to walk a certain amount of steps. 44.4% answered that it became diffi-cult at 7000 steps, 11.1% felt that it was already hard at 5,000 steps, 11.1% at 6000 steps and 11.1% at 9000 steps. 22.2% did not remember when it became tough to go a certain number of steps. However, 100% considered the measurement they did with the step counters were consistent with their usual workload. Operators also got the question why they think they walk so much during their shift. Most responded that it is due to under staff-ing and that they are only two people on the machine for much of the day. They also thought that it was be-cause the machine is long and that they have to go a lot back and forth to ensure the quality.
Alarm The operators were asked if they found that they had a lot of unnecessary alarms in their alert list, the answer was equal, 50% thought they had unnecessary alarms that triggered the lamp and 50% thought the alarm trig-gering the lamp was relevant. 88.9%, however, consider that the alarm list should be reviewed and examples of unnecessary alarms, according to the operators, are low/poor vacuum on RW.
Overview Operators were asked if they think they have a bad over-view of the machine and, of course, where. They replied that, in particular, they have a bad overview when they are on the backside and fill the glue, at the pallet stacker and when they do quality tests.
StressOn a scale 1-5, where one is never feeling stressed and five are usually stressed, 66.7% graded a three, 11.1% one a four and 22.2% one a five. The most common reason for a stressful situation is, according to the operators, un-derstaffing, machine problems, orders with small bags, Bagfiller and Casepacker, keeping track of quality at the same time as the machine must run and change of or-ders near shifts changes. They also feel that the mornings (Monday – Friday) are the most stressful it’s more to be done in combination with meetings.
Improvements If operators could choose then they would like an ad-ditional operator, automatic refilling of boxes, better Casepacker, less dust in the machine, better waste man-agement, and all tools and equipment available at the right place.
5.7 Benchmarking The benchmarking, that was made over the phone re-sulted in knowledge about Essitys factory in Gennep, Netherlands. Gennep has 15 machines that produce dif-ferent products and a general of 2,5 operators per ma-chine. Gennep uses automated AVG truck that delivers material from the warehouse to a drop of location close to the machine, the operators then move the material to the correct storage location on the machine. The glue is refilled in a room where most of the glue tanks are placed closed to each other, unlike Falkenberg that has the tanks separated. The glue is still refilled manually by dropping glue blocks in the tanks. The refill of plastic bags is similar to the one at Falkenberg and no chang-
33
es are planned. They have two different system for the cardboard boxes, one manually and one fully automat-ed. The automated solution picks the boxes and places them in the Casepacker in stack of 10-15 or one by one. The material on the second floor works the same as in Falkenberg, but Gennep has plans to automate and minimize the manual work. They are planning on in-stalling an automated crane in the sealing that picks the rolls from the stock (on the second floor) and then place them on the unwinders. The difficulties with this solu-tion are not the crane but to manage to automatize the Splice that require precision and correct placement of the material.
In Gennep the operators make manually quality testing, similar as the ones performed in Falkenberg. When it comes to the integration, Gennep uses big TV monitors that displays relevant information to the operators. They are planning to provide the operators with a mobile device (smartphone/tablet) in the end of Q2 (2018). The mobile device would provide the operators with manuals and documents and the idea is that QR-codes will be placed on different areas of the machine. When a problems in that area occurs the operators can scan the QR-code and easy get all the manuals on that area.
5.8 Ongoing projects Glue. The improvement on glue has been an ongoing project for a long time, many small changes has been made to increase the ergonomic. The aim is still to fully atomize the refill and suppliers have been contacted in order to come up with solutions to this.
Quality. Falkenberg has at the moment two quality projects running, IRIS and Lighthouse. Lighthouse is a project, partly installed at Fenix 7 where they have in-stalled five cameras to measure the placement materials in the diaper. This solution will reduce the quality test-ing for the operators, as they will no longer need to look at the placement of materials when testing. The future vision is that cameras will be able to scan all diapers and the operators will only test tensile strength and look for contamination and damage in the material. IRIS is a project focusing on ensuring quality on the welding of the plastic bags. This solution will be able to see if the welding is not correct and eliminate the bags before be-ing sent of to consumers.
5.9 Summary of context Describing the operators’ daily work is complex due to the variation in duties and work tasks. Operators ex-perience a relatively stressful work environment where most people want an additional operator per shift, while the measured times indicates that there should be plenty of time left. What causes the stressful situations depends on several factors, the type of order they run (such as small plastic bags), rescheduling, machine problems or non-regular staff. The analysis of the mapping points out that there is not only one, but several problem or development areas that needs to be developed in order to minimize time waste and improve the working en-vironment.
By analyzing the times gathered from the context in table 6, it was made clear that the material refill is the most time consuming task. Refilling material on the second floor is most time consuming. The cardboard boxes was the second most time consuming task, and also something that the operators wanted to improve. The operators wanted to improve the Casepacker and some thought that the refill of boxes was heavy to per-form. The refill of glue, plastic bags and pulp takes al-most the same time to perform. The refill of glue causes ergonomic problems and the plastic bags causes stress, especially with orders including small bags. The refill of pulp did not cause any ergonomic problems or took very long time to perform, neither did the operators comment on this task.
Table 6, summarizes the times from the mapping. The times that are not depending on order are presented in the column Average and the Min/Max represents the times that are affected by the order. The total time in the Average columns has not included the times in pa-rentheses, as they are included in the summary max/min. Each shift has three operators during eight hours, resulting in 24 available working hours. Each operators then have one hour break resulting in 21 working hours at the machine. Table 6, shows that the variety in orders, together with production stop and rescheduling leads up to 21,4 working hours. Bear in mind that the amount of production stop in combination with the rescheduling is a bit extreme and not representative for the opera-tor’s everyday. The walking was not quantified by time but with number of steps taken by the operators. This is something that has not been investigated before, and it thought to take a lot of time for the operators.

34
Table 6. Result from context.Work task Average Min Max
Material refill
Second floor 290
Glue 32
Pulp 32
Plastic Bags (30) 17 43
Cardboard boxes (61) 54 69
Test
Test 1 16
Test 2 40
Test 3 15
Stop
RIS 20
Unplanned (85) 55 570
Rescheduling (9 ) 0 60
Other
Change pallet - Plastic bags 4
Change pallet - Cardboard boxes 23
Waste - second floor 21
Collets - second floor 48
Total time 541 126 742
Summary max/min time
667min = 11,1 hour
1283min =21,4 hour
5.10 Requirement specification Based on the result from the mapping a requirement specification was established for the areas that the proj-ect decided to proceed with. The requirement specifica-tion, in table 7 includes both should-and must require-ments for the areas.

35
Requirements Explanation
GLUE
1 The new glue system must work with dif-ferent suppliers.
Different suppliers deliver different kinds of glue, some pellets and others in blocks that vary in sizes. The system can therefore not rely on only one supplier/size.
2 The new glue system should reduce time for the operators.
Reducing time is a central part of the project and it en-ables the operators to spend their time on other tasks.
3 The new glue system should provide the operators with a better and more ergonomic work task.
The current system has lead to a lot of incident rapports, and this is something that the new system should elimi-nate.
PLASTIC BAGS
4 The new system must work with different sizes of the plastic bags.
The diapers are packed in different ways depending on order.
5 The new system should reduce time for the operators.
Reducing time is a central part of the project and it en-ables the operators to spend their time on other tasks.
CARDBOARD BOXES
6 The new system must work with different sizes of the cardboard boxes.
The plastic bags are packed in different ways depending on order.
7 The new system should be able to refill the boxes automatically.
An automatic system saves time.
8 The new system should make it easy to change order.
The new system should make it easier for the operators to change pallets.
9 The new glue system should reduce time for the operators.
Reducing time is a central part of the project and it en-ables the operators to spend their time on other tasks.
SECOND FLOOR
10 The system must be able to handle the dif-ferent materials that are placed on the second floor today.
If the system cannot handle the material, another solution is required.
11 The system must be able to handle the weight of the rolls.
The gripper and construction must be able to handle the rolls.
12 The new glue system should reduce time for the operators.
Reducing time is a central part of the project and it en-ables the operators to spend their time on other tasks.
13 The new system should not aggravate the operators ergonomic.
Operators spent a lot of time on the second floor and it is important to maintain a good work environment.
WALKING/ALARM
14 The new system should give the operators a better overview of the production line.
Today the operators have a hard time overviewing the production line, which result in a stressful environment and risk for making mistakes.
15 The new system should be easy to under-stand and interact with.
Easy systems saves time for the operators and minimize the chances of misunderstanding.
16 The new system should provide the oper-ators with relevant information at the right time.
Unnecessary and wrong information can cause extra work for the operators and increases the chances of making a mistake.
Table 7. Requirement specification.
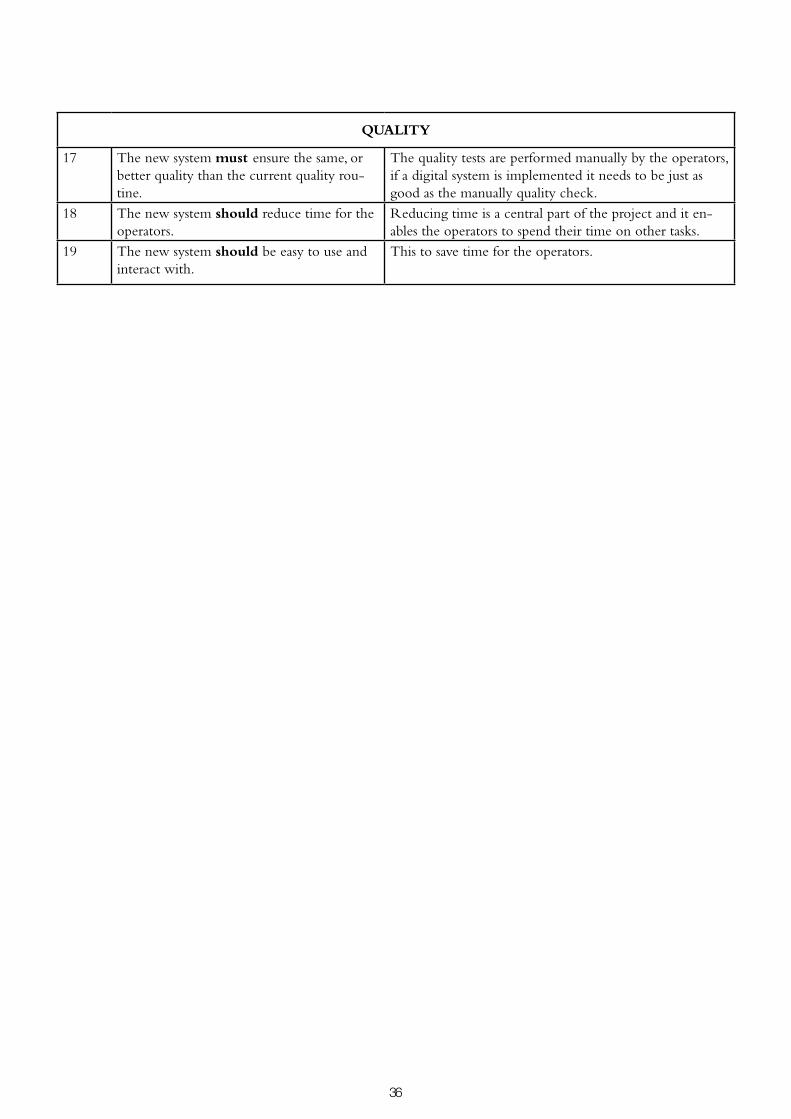
36
QUALITY
17 The new system must ensure the same, or better quality than the current quality rou-tine.
The quality tests are performed manually by the operators, if a digital system is implemented it needs to be just as good as the manually quality check.
18 The new system should reduce time for the operators.
Reducing time is a central part of the project and it en-ables the operators to spend their time on other tasks.
19 The new system should be easy to use and interact with.
This to save time for the operators.

37
6CONCEPT DEVELOPMENT This chapter presents the concept development of the areas glue, plastic bags, cardboard box-es, second floor and alarm/HMI. The concept development phase is a creative phase that con-tains the main idea work and constitutes the basis for the solutions. The development of con-cepts is based on different methods where number of ideas are generated and evaluated until a satisfying concept is reached.

38
6.1 Ideation The first brainstorming resulted in 40 ideas for the dif-ferent areas at Fenix 2. The project did a brainstorming area by area, resulting in new points of views. For ex-ample, one idea for the second floor was to extend the floor area in front of the machine (build a floor over the Bagfiller) to be able to store material and use an auto-matic truck on the second floor. Ideas around different robot solutions came up to place the material on the unwinder, one idea was to use a gantry robot (a robot placed on a construction) that loads the rolls.
For the alarm/integration with the machine, several ideas came across. One of them was to use mobile de-vices that inform the operators about the state of the machine. Another idea was to use different colors for the alarm lamp, for example a yellow lamp for the Bagfiller, a green for Casepacker and a red for the production line. To decrease the stress one idea was to use a display that shows how much time it is left before material needs to refill.
It would be ideal if the refill of cardboard boxes could be as automated as possible. Therefore many of the ideas were focusing on different robot solutions and how to use the available area in the best way. One idea was to make an automatic truck deliver a pallet of boxes next to the Casepacker and have a robot with a vacuum grip that pick the boxes and place them in the Casepacker. Another idea was to use the area where the operators do the quality tests to install a robot, if there would be a lack of space.
The brainstorming also resulted in ideas around the handling and refill of glue. One idea was to create a big central where it would be possible to store glue in large tanks that could provide several machines with glue. Another idea was to group the glue tanks at each machine so the operators did not have to walk so much. By combining the ideas from the brainstorming more ideas were generated. One combination was to use the different colored alarm lamps to the second floor, the lamps could then indicate when an unwinder needs to be refilled and help the operator get better overview. Another idea was to use a display with how much time is left before the rolls needs to refill. The second brain-storming resulted in improvements of the existing ideas. The project focused, among other things, on different layout options. On the second floor the project focused
on how to build two or more machines together and how the area could be divided in different safety zones (due to robot solutions). The project also brainstormed around the refill of cardboard boxes and where a robot
could be placed.
6.2 Early concepts The ideas from the ideation were put together into more detailed concepts. The concepts are presented, area by area.
6.2.1 GlueAfter speaking to employees involved with the devel-opment of glue, it was made clear that due to the com-plexity of the glue and its material properties a central station was not possible. The project was told that they are looking at an automatic refill of glue and have al-ready contacted suppliers for suggestions. Since this area is already an ongoing project a decision was made to not focus on the technical aspects of how an automatic refill should work but more on layouts and alternative solutions to streamline the refill. The placement of the glue was therefore a more interesting angle of incidence. By placing the glue tanks together it would allow the operators to refill several tanks at the same time, provid-ed that the refill is still manual. Or alternative make two stations where the glue is grouped based on where the glue enters the production line. Since the glue hoses are expensive the best thing would be to place the tanks as close to the production line as possible.
6.2.2 Plastic bags Concept Plastic Bags were created to minimize the time spent on refilling plastic bags. Since the plastic bags is not the most time consuming work task, or something that the operator perceived as a problem the project has created a simpler concept. The concept is based on the idea that the operators should refill the bags in the same way, but twice as much each time. Today the operators refill bundles of 100 bags, by increasing the number of bags in each bundle the operators would not have to spend as much time refilling bags. This type of solution may require a rebuilding of the machine and making sure that the suppliers can increase the number of bags in each bundle.
6.2.3 Cardboard boxes Concept “Cardboard boxes 1” (figure 24) uses a Gantry robot to pick boxes and place them in the Casepacker.
6 CONCEPT DEVELOPMENT

39
The idea is that an AGV places a pallet of boxes on the conveyor, the conveyor then transport the pallet clos-er to the Casepacker where the pallet enters a lift. The lift, for example a scissor lift, positions the boxes in the same height as the area that feeds the boxes into the Casepacker. The Gantry robot can then pick and place the boxes using a suitable gripper, for example a vacu-um-gripper. When the pallet is empty its transported to the end of the other conveyor and then back to the first position. The AGVs can then transport away the empty pallets.
Concept “Cardboard boxes 2” (figure 25) uses a robot arm to pick and place the boxes in the Casepacker. This concept uses one conveyor that transports the pallet back and forth, allowing the AGV to leave a full pallet and pick up the empty pallets in the same place.
Concept “Cardboard boxes 3” (figure 26) has the robot placed in-between the pallet and the Casepacker. The concept is similar to concept Cardboard boxes 2 but the placement of the robot is different. This solution also
shows the possibility to use a smaller robot placed on an elevation.
6.2.4 Second floorThe concept on the second floor is based on the pos-sibility to build two machines together and use as high degree of automation as possible. Today the conveyor transporting boxes are placed in-between the machines (figure 27), something that makes it very tediously for the operators to walk between the machines.
The new concept (figure 28), has the conveyors placed in the edges, allowing an open area between the ma-chines. The machines are built together with an expand-ed floor in the front, in the middle and in the back of the machine. The project decided to keep the open area down to the first floor so the operators would still have the possibility to look down at the rest of the machine. With the lift in the back and front of the machines the AGVs will hopefully not interfere with the workflow on the first floor.
Figure 24. Concept Cardboard boxes 1.
Figure 25. Concept Cardboard boxes 2. Figure 26. Concept Cardboard boxes 3. Figure 28. The new layout with conveyor in the edges.
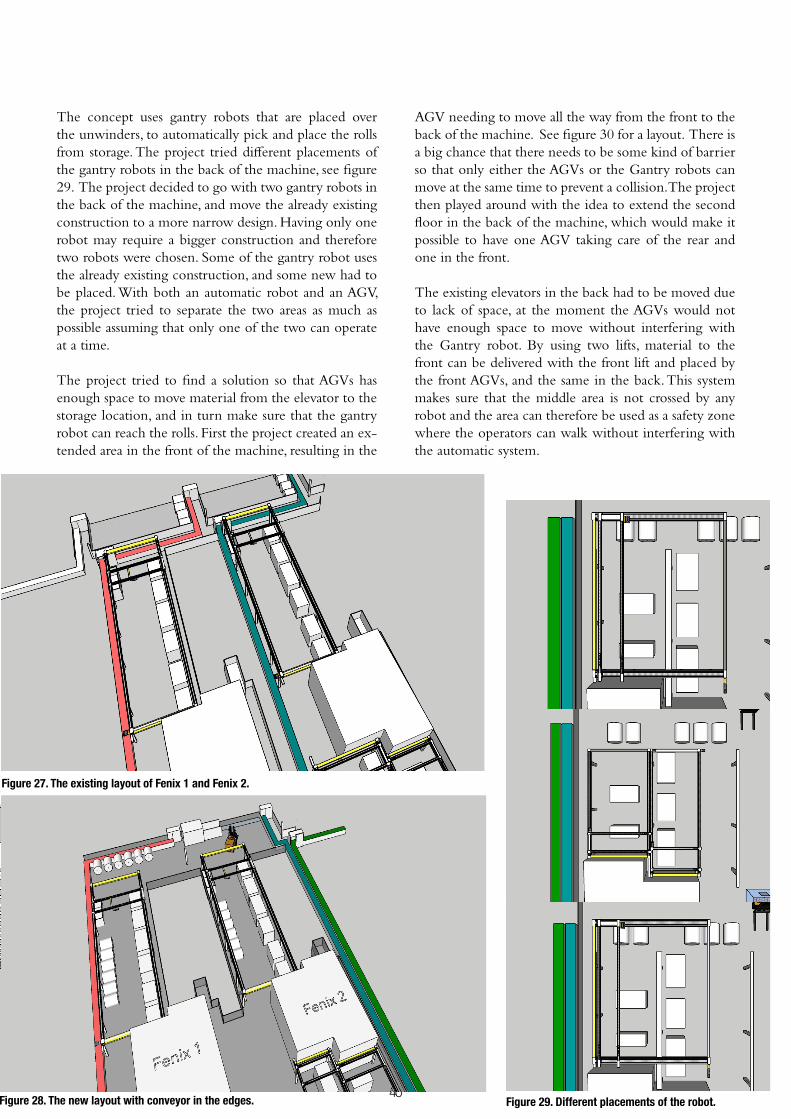
40
The concept uses gantry robots that are placed over the unwinders, to automatically pick and place the rolls from storage. The project tried different placements of the gantry robots in the back of the machine, see figure 29. The project decided to go with two gantry robots in the back of the machine, and move the already existing construction to a more narrow design. Having only one robot may require a bigger construction and therefore two robots were chosen. Some of the gantry robot uses the already existing construction, and some new had to be placed. With both an automatic robot and an AGV, the project tried to separate the two areas as much as possible assuming that only one of the two can operate at a time.
The project tried to find a solution so that AGVs has enough space to move material from the elevator to the storage location, and in turn make sure that the gantry robot can reach the rolls. First the project created an ex-tended area in the front of the machine, resulting in the
AGV needing to move all the way from the front to the back of the machine. See figure 30 for a layout. There is a big chance that there needs to be some kind of barrier so that only either the AGVs or the Gantry robots can move at the same time to prevent a collision. The project then played around with the idea to extend the second floor in the back of the machine, which would make it possible to have one AGV taking care of the rear and one in the front.
The existing elevators in the back had to be moved due to lack of space, at the moment the AGVs would not have enough space to move without interfering with the Gantry robot. By using two lifts, material to the front can be delivered with the front lift and placed by the front AGVs, and the same in the back. This system makes sure that the middle area is not crossed by any robot and the area can therefore be used as a safety zone where the operators can walk without interfering with the automatic system.
Figure 27. The existing layout of Fenix 1 and Fenix 2.
Figure 28. The new layout with conveyor in the edges. Figure 29. Different placements of the robot.

41
Figure 30. Layout for the early concept, with extended back and front.

42
6.2.5 Walking/Alarm/HMI The project found several concepts regarding the flow of information at the machine. According to Osvalder and Ulfvengren (2011) the information presented should enable the operators to make easy decisions and sort information in an easy way.
Monitors In order to provide the operators with a clear overview over the machine and the alarm, a concept is to use big screens. The screens would make it easy for the opera-tors to see the current status of the machine and pro-vide information in an easy way. The screens could be used for different purposes, for example to show qual-ity, alarms and how much time it is left before material needs to be refilled. This would, according to Osvalder and Ulfvengren (2011) provide the operators with qual-itative information as only a few different states are dis-played. The screen, or screens would be placed where they can be seen easily and the text/icons should be easy to understand. Figure 31 displays an example of a display where different types of information are showed.
Figure 31. Early concept Monitor.
Mobile device One of the concepts is to use a portable display that allows the operator to monitor alarm so that they do not need to walk to the existing computers. The porta-ble device would make the operators work a lot more flexible as they can reset and monitor the machine from different locations. This would decrease the stress that occurs when the operators refill glue on the back, or when they troubleshoot the machine. The design of the mobile device could vary depending on the required size of the display. The mobile device could contain
checklist for the rescheduling’s/RIS - stop so the oper-ator does not need do printout the lists, something the operators complained about. The mobile device could also contain information about the machine and make it possible for the operators to change settings on the ma-chine. Qualitative information devices are, according to Osvalder and Ulfvengren (2011), used when operators need numerical and accurate data, and they claim that a digital display is preferred when showing numerical and accurate data.
QR-codes can be used to provide information about a certain area of the machine, inspiration was taken from the factory in Gennep where they use QR-codes. The QR-codes could be used together with the mobile de-vice to provide the operators with relevant information. The codes can be placed on different positions on the Baby machines and be scanned when the operator needs extra help/information. When scanning the code the operators would gain access to manuals and documents required to fix production stop/rescheduling, see figure 32.
Figure 32. Mobile device scanning a QR-code.
Different colored lamps To increase strength and reduce weaknesses in the op-erator’s attention, one can minimize the time it takes to find information. Searching for information is, accord-ing to Osvalder and Ulfvengren (2011) a waste of re-sources and therefore the operators should be alert fast, in a way that does not stress their cognitive condition. One concept is to use different colored lights to indicate where the problems are and to attract attention. Each

43
area of the machine would have a specific color instead of the orange alarm lamp that represent all areas today. By using different colors the operators can walk directly to the part of machine that has the problem. Since the production line is very long, it would be best to use sev-eral lamps instead of one. This would narrow down the area with the problem. According to the survey, many operators wanted to sort the alarm list to make sure that just the most relevant alert the orange lamp. Figure 33 shows an example of two types of lamps. To the left are the lamps that will be placed on the specific machine, for example a pink lamp at the Casepacker . To the right are all the lamps combined where the area with problem lights up.
Figure 33. Example of the alarm lamps.
6.2.6 Quality testing The operators said that they often got interrupted when making the quality tests, this is hopefully something that will decrease as the degree of automation increases at the machine. Since there are two ongoing projects regarding quality, the project decided not to focus too much on the concept development of quality testing. The proj-ect decided to focus more on how to ease the quality work that will still remain after the cameras are installed. When the new cameras are installed at Fenix 2 they will be able to detect misplacing of material, something that the operator are doing manually today. This will reduce the time spent on the quality tests and this concept as-sume that future quality plans will be implemented.
The operators get stressed, and often interrupted when doing the quality test. This concept is based on giving the operator a less stressful environment, which will probably result in more focused operators and better tests. The Quality Concept is based on providing infor-
mation to the operators while doing the quality test, this to prevent them from running back and forth to the machine. Another thing to look at is to connect the tensile strength machine to the computer, today the op-erators fill in the values manually something that could easily be fixed and reduce one small task.
6.3 Concept evaluationThis section analyses the different concepts that were created in the previous step. The evaluation is based on the requirement specification and feedback from em-ployees. The requirement specification includes both should-and must requirements. As this project develops several areas they will be evaluated separately.
GlueConcept “Glue” is based on gathering the glue tanks and finding a better position. Changing the position does not increase the ergonomic or reduce time therefore it does not fulfill the should-requirements. Hopefully is this something that will improve once they find an au-tomatic refill. The feedback given to the concept was that it is expensive to change the position of the glue tanks, but possible. One idea was to move the glue tanks in the back of the machine, that causes the most stress, to the second floor. This idea got positive feedback, the only problem was to make sure that the operators would have sufficient time to do the refill.
Plastic bagsConcept “Plastic bags” fulfills the requirement specifi-cation, based on the idea that the suppliers can deliver a bigger batch. The machine also needs to be able to handle a bigger amount of bags. The feedback regard-ing this concept was that it was an interesting concept to look further into, as it would easily reduce the time spent on refill.
Cardboard boxes The concepts “Cardboard boxes” includes three differ-ent layouts and in order to decide which one of them that is best suited a weighting was done based in the re-quirement specification. Table 8 shows what the concept needs to fulfill in order to get the respective point.
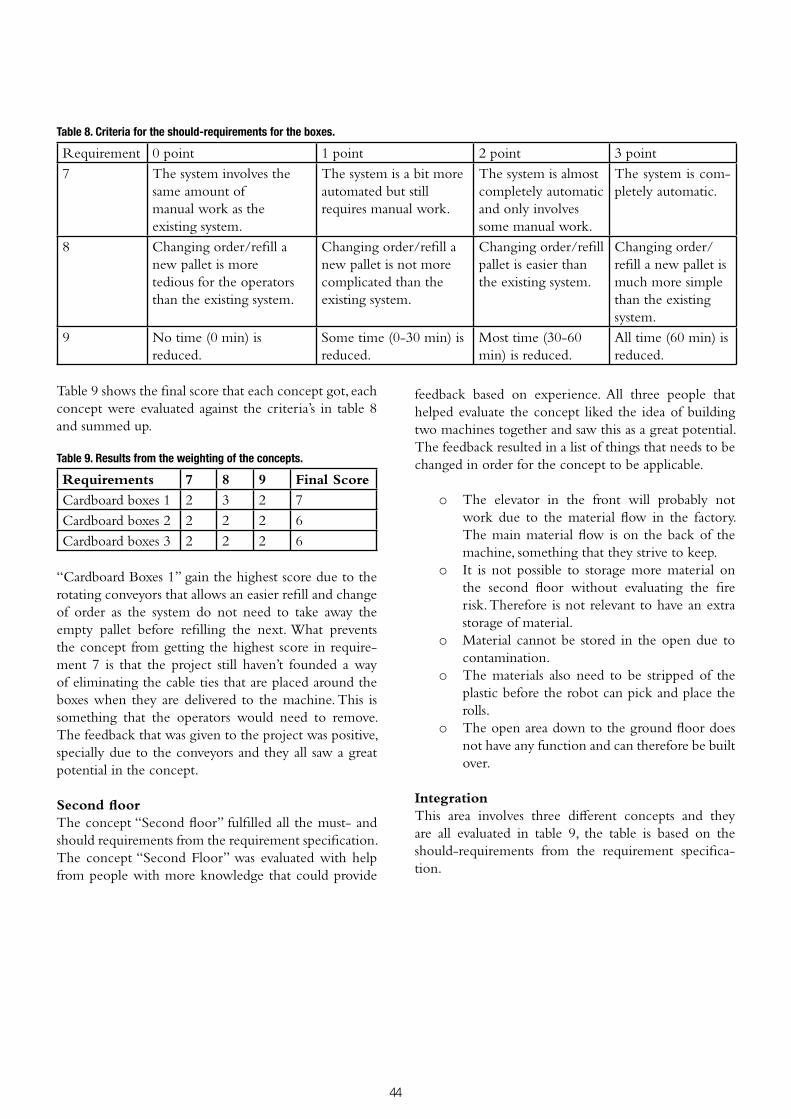
44
Table 8. Criteria for the should-requirements for the boxes.
Requirement 0 point 1 point 2 point 3 point7 The system involves the
same amount of manual work as the existing system.
The system is a bit more automated but still requires manual work.
The system is almost completely automatic and only involves some manual work.
The system is com-pletely automatic.
8 Changing order/refill a new pallet is more tedious for the operators than the existing system.
Changing order/refill a new pallet is not more complicated than the existing system.
Changing order/refill pallet is easier than the existing system.
Changing order/refill a new pallet is much more simple than the existing system.
9 No time (0 min) is reduced.
Some time (0-30 min) is reduced.
Most time (30-60 min) is reduced.
All time (60 min) is reduced.
Table 9 shows the final score that each concept got, each concept were evaluated against the criteria’s in table 8 and summed up.
Table 9. Results from the weighting of the concepts.
Requirements 7 8 9 Final Score
Cardboard boxes 1 2 3 2 7Cardboard boxes 2 2 2 2 6Cardboard boxes 3 2 2 2 6
“Cardboard Boxes 1” gain the highest score due to the rotating conveyors that allows an easier refill and change of order as the system do not need to take away the empty pallet before refilling the next. What prevents the concept from getting the highest score in require-ment 7 is that the project still haven’t founded a way of eliminating the cable ties that are placed around the boxes when they are delivered to the machine. This is something that the operators would need to remove. The feedback that was given to the project was positive, specially due to the conveyors and they all saw a great potential in the concept.
Second floor The concept “Second floor” fulfilled all the must- and should requirements from the requirement specification. The concept “Second Floor” was evaluated with help from people with more knowledge that could provide
feedback based on experience. All three people that helped evaluate the concept liked the idea of building two machines together and saw this as a great potential. The feedback resulted in a list of things that needs to be changed in order for the concept to be applicable.
o The elevator in the front will probably not work due to the material flow in the factory. The main material flow is on the back of the machine, something that they strive to keep.
o It is not possible to storage more material on the second floor without evaluating the fire risk. Therefore is not relevant to have an extra storage of material.
o Material cannot be stored in the open due to contamination.
o The materials also need to be stripped of the plastic before the robot can pick and place the rolls.
o The open area down to the ground floor does not have any function and can therefore be built over.
IntegrationThis area involves three different concepts and they are all evaluated in table 9, the table is based on the should-requirements from the requirement specifica-tion.

45
Requirement 0 point 1 point 2 point 3 point14 The system does not
provide better over-view.
The system provides fairly better overview.
The system provides better overview.
The system provides much better overview.
15 The system is compli-cated.
The system is fairly easy to understand.
The system is easy to understand.
The system is very easy to understand.
16 The system does not provide relevant infor-mation.
The system provides some relevant informa-tion.
The system provides relevant information.
The system provides much relevant informa-tion.
Table 11 shows the final score that each concept got, the concepts were evaluated against the criteria’s in table 10.
Table 11. Results from the weighting of the integration concepts.
Requirements 14 15 16 Total
Concept Monitor 2 3 2 7Concept Mobile device 3 2 3 8Concept Different colored lamps
1 3 2 6
All concepts got almost the same score, where the Mo-bile device got the highest score. The strength of the concept Monitor is that it is easy to understand based on a good interface, since the operators just need to look at it. The Mobile device on the other hand, provides rele-vant information at the right time and is great for many different purposes. The concepts complement each oth-er and if used right they could provide the operators with an overall information system. At the moment none of the concept scored a three on requirement 14, but if used together they will provide a better overview of the machine.
QualityConcept Quality focuses on reducing stress by provid-ing information to the operators while doing the quality tests. If the concepts Monitor and Mobile device will be placed at the quality station, the should-requirements from the requirement specification would be fulfilled. Regarding the must-requirement, increased information to the operators would not directly affect the quality but it might improve the operators focus so that they pay better attention. Lining together the tensile strength to the computer would minimize the risk of the operators writing down the wrong value.
6.3.1 Analysis All concepts had individual strengths and weaknesses, and until now they have been treated as separate areas.
By changing perspective and picking the best parts of each solution three new concepts were created, Ground Floor, Second Floor and Integration. During the evalu-ation it was made clear that some of the concept com-plemented each other and the project wanted to take advantage of the best part in each concept.
The Ground Floor will contain solutions for the boxes and plastic bags. The Second Foor will contain the sec-ond floor, improved by the feedback given. It will also include the handling of the glue tanks that are currently placed on the back. Integration will include Monitors, Mobile Device and Different colored Lamps. This con-cept will be detail developed as a whole, and the differ-ent concepts can then complement each other.
6.4 Final Concept development This part presents the final result of the final concepts Ground Floor, Second Floor and Integration. The final concept development describes the concept more thor-oughly and detailed.
6.4.1 Ground floor The final concept result aims at reducing time and pro-viding a less stressful working environment for the op-erators. The new refill of cardboard boxes will reduce the time spent on refill. The AGV drops of a pallet on a conveyor that moves it to a position under the robot, placed on a scissor lift. The lift makes sure that the top of the pallet constantly is in the same position. This en-ables the use of a gripper that can pick the boxes from the same height, instead of using a gripper that needs to move all the way down to the ground. The gripper should move the boxes with vacuum, one by one. The boxes will be needed to move from horizontal to verti-cal before being unfolded. This could either be done by the gripper or by placing the boxes vertical and flipping them up in the Casepacker. It is suggested to have a smaller buffer of boxes in the Casepacker , but might not as many as they use today (100-150 boxes). The buffer
Table 10. Criteria’s for the should requirements, integration concepts.
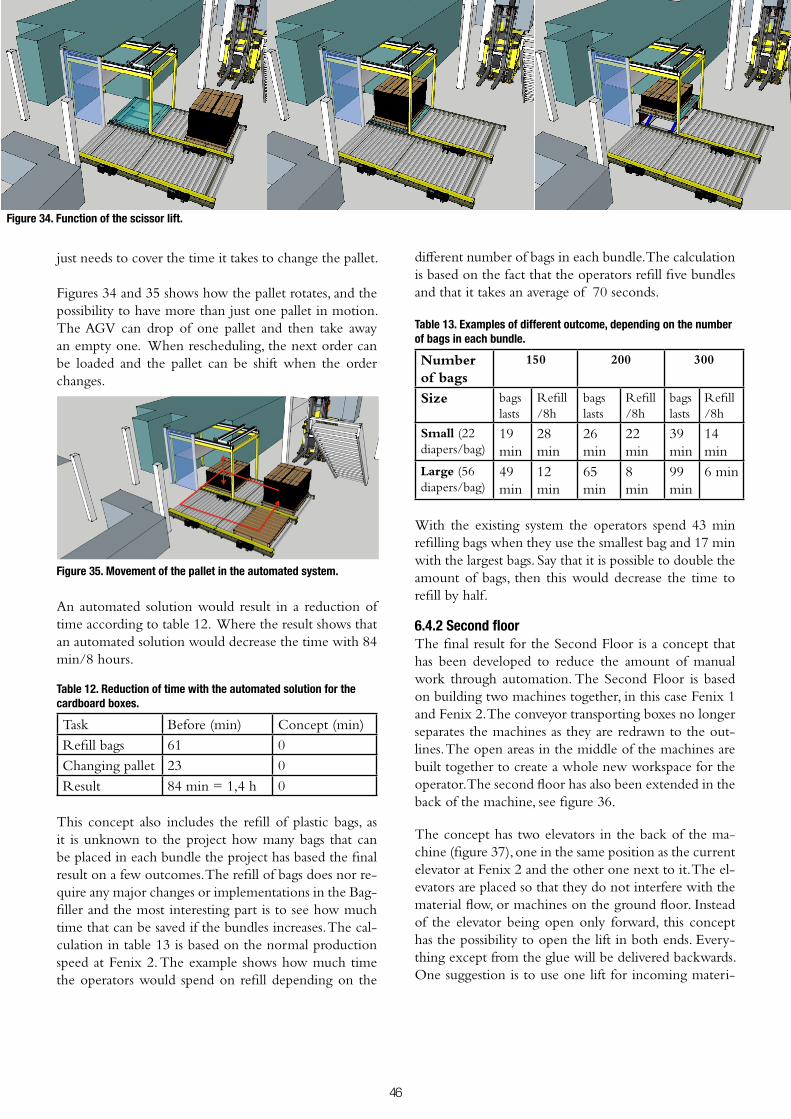
46
just needs to cover the time it takes to change the pallet.
Figures 34 and 35 shows how the pallet rotates, and the possibility to have more than just one pallet in motion. The AGV can drop of one pallet and then take away an empty one. When rescheduling, the next order can be loaded and the pallet can be shift when the order changes.
Figure 35. Movement of the pallet in the automated system.
An automated solution would result in a reduction of time according to table 12. Where the result shows that an automated solution would decrease the time with 84 min/8 hours.
Table 12. Reduction of time with the automated solution for the cardboard boxes.
Task Before (min) Concept (min)Refill bags 61 0Changing pallet 23 0Result 84 min = 1,4 h 0
This concept also includes the refill of plastic bags, as it is unknown to the project how many bags that can be placed in each bundle the project has based the final result on a few outcomes. The refill of bags does nor re-quire any major changes or implementations in the Bag-filler and the most interesting part is to see how much time that can be saved if the bundles increases. The cal-culation in table 13 is based on the normal production speed at Fenix 2. The example shows how much time the operators would spend on refill depending on the
different number of bags in each bundle. The calculation is based on the fact that the operators refill five bundles and that it takes an average of 70 seconds.
Table 13. Examples of different outcome, depending on the number of bags in each bundle.
Number of bags
150 200 300
Size bags lasts
Refill /8h
bags lasts
Refill/8h
bags lasts
Refill /8h
Small (22 diapers/bag)
19 min
28 min
26 min
22 min
39 min
14 min
Large (56 diapers/bag)
49 min
12 min
65 min
8 min
99 min
6 min
With the existing system the operators spend 43 min refilling bags when they use the smallest bag and 17 min with the largest bags. Say that it is possible to double the amount of bags, then this would decrease the time to refill by half.
6.4.2 Second floorThe final result for the Second Floor is a concept that has been developed to reduce the amount of manual work through automation. The Second Floor is based on building two machines together, in this case Fenix 1 and Fenix 2. The conveyor transporting boxes no longer separates the machines as they are redrawn to the out-lines. The open areas in the middle of the machines are built together to create a whole new workspace for the operator. The second floor has also been extended in the back of the machine, see figure 36.
The concept has two elevators in the back of the ma-chine (figure 37), one in the same position as the current elevator at Fenix 2 and the other one next to it. The el-evators are placed so that they do not interfere with the material flow, or machines on the ground floor. Instead of the elevator being open only forward, this concept has the possibility to open the lift in both ends. Every-thing except from the glue will be delivered backwards. One suggestion is to use one lift for incoming materi-
Figure 34. Function of the scissor lift.

47
Figure 36. Layout of the second floor.
Figure 37. Visualization of the two lifts with small conveyors in both ends. Figure 38. The two Gantry robots in the front of the second floor.
Figure 39. Closer view of the gripper.
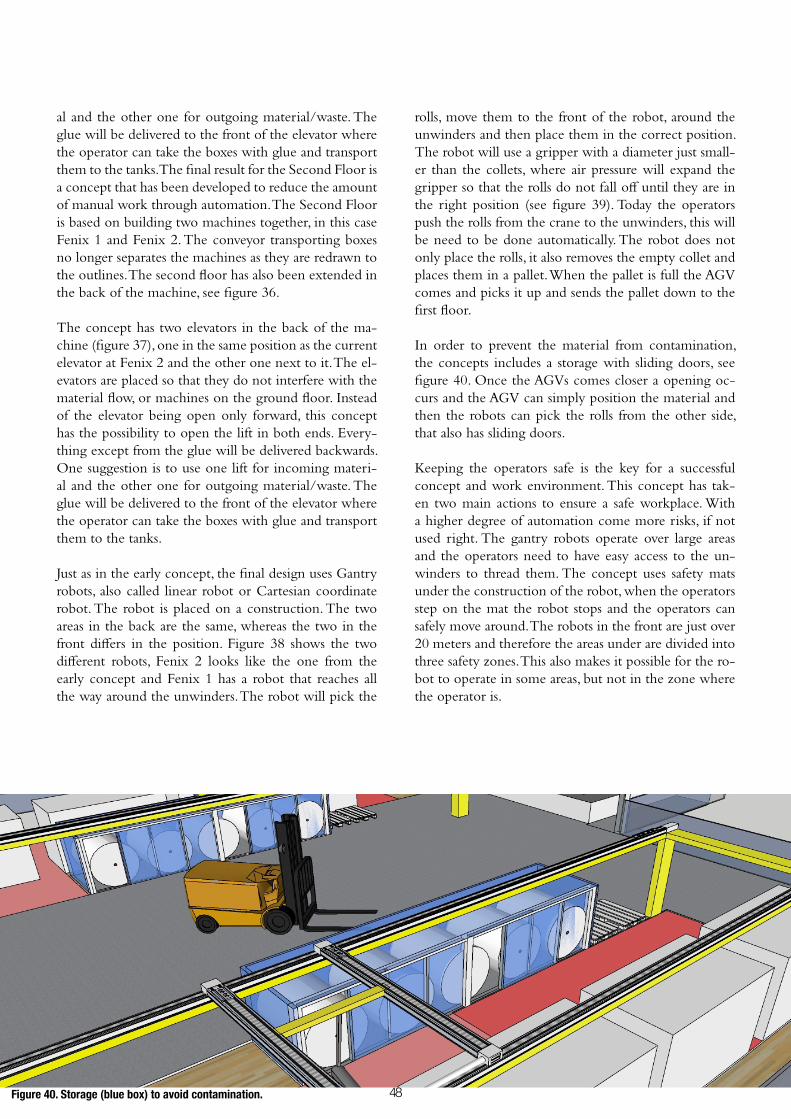
48
al and the other one for outgoing material/waste. The glue will be delivered to the front of the elevator where the operator can take the boxes with glue and transport them to the tanks. The final result for the Second Floor is a concept that has been developed to reduce the amount of manual work through automation. The Second Floor is based on building two machines together, in this case Fenix 1 and Fenix 2. The conveyor transporting boxes no longer separates the machines as they are redrawn to the outlines. The second floor has also been extended in the back of the machine, see figure 36.
The concept has two elevators in the back of the ma-chine (figure 37), one in the same position as the current elevator at Fenix 2 and the other one next to it. The el-evators are placed so that they do not interfere with the material flow, or machines on the ground floor. Instead of the elevator being open only forward, this concept has the possibility to open the lift in both ends. Every-thing except from the glue will be delivered backwards. One suggestion is to use one lift for incoming materi-al and the other one for outgoing material/waste. The glue will be delivered to the front of the elevator where the operator can take the boxes with glue and transport them to the tanks.
Just as in the early concept, the final design uses Gantry robots, also called linear robot or Cartesian coordinate robot. The robot is placed on a construction. The two areas in the back are the same, whereas the two in the front differs in the position. Figure 38 shows the two different robots, Fenix 2 looks like the one from the early concept and Fenix 1 has a robot that reaches all the way around the unwinders. The robot will pick the
rolls, move them to the front of the robot, around the unwinders and then place them in the correct position. The robot will use a gripper with a diameter just small-er than the collets, where air pressure will expand the gripper so that the rolls do not fall off until they are in the right position (see figure 39). Today the operators push the rolls from the crane to the unwinders, this will be need to be done automatically. The robot does not only place the rolls, it also removes the empty collet and places them in a pallet. When the pallet is full the AGV comes and picks it up and sends the pallet down to the first floor.
In order to prevent the material from contamination, the concepts includes a storage with sliding doors, see figure 40. Once the AGVs comes closer a opening oc-curs and the AGV can simply position the material and then the robots can pick the rolls from the other side, that also has sliding doors.
Keeping the operators safe is the key for a successful concept and work environment. This concept has tak-en two main actions to ensure a safe workplace. With a higher degree of automation come more risks, if not used right. The gantry robots operate over large areas and the operators need to have easy access to the un-winders to thread them. The concept uses safety mats under the construction of the robot, when the operators step on the mat the robot stops and the operators can safely move around. The robots in the front are just over 20 meters and therefore the areas under are divided into three safety zones. This also makes it possible for the ro-bot to operate in some areas, but not in the zone where the operator is.
Figure 40. Storage (blue box) to avoid contamination.

49
Even though the AGVs are equipped with sensors the project wanted to separate their flows from the oper-ators as much as possible. A transportation system was created in the outline of Fenix 2. Figure 41, shows an example of the material flow, the orange lines represents the movement of the AGV, from the lift until the mate-rial is in position. The AGV takes the material from the elevator and then transport it up to the front, or trans-port the material to the closer material positions in the back. The idea is that the AGVs only operate in the grey areas. The purple line represents the boxes of glue that the operators move. The blue lines shows one of many possible flows for the operators. The operators will need to cross the dark grey area (where the AGVs are) in or-der to move around.
In order to improve the environment for the operator a smaller control room was created, see figure 42. The room can keep a nice temperature, especially during the summers and be soundproof. In here the operators can monitor the second floor, plan for rescheduling’s and or-der material. In order for this concept to work with the Integration concept the second floor needs to become “smart”. That means, for example, to installing sensors on the unwinders that can indicate the operators when the materials are running low. This decreases the stress and the operators do not need to run around to make sure that they have control.
The second floor also includes four glue tanks, both from the backsides of Fenix 1 and 2. The tanks contains
CU/CL glue and TA glue, two of each. The advantage of placing the glue tanks on the second floor is that it gives the operators on the first floor, that have a greater responsibility, more time. Based on the context, the op-erator on the second floor have time to perform more work tasks and the refill of glue would be a suitable. Another advantage is that the glue tanks will not be moved further away from the production line, as it will be placed above. Based on the knowledge gained about the fire safety, the project only moved the glue tanks on the back. Assumption mas made that moving all the glue tanks, with respective pallet of glue for refill, would be too much. There is always a possibility to move all tanks, as there is available space on the second floor. Figure 43, shows three of the glue tanks placed on the opposite side of the control room.
In the end, the concept strives at saving as much time as possible and reduce non-value added work. Table 13 shows how much time that was spent before and how much time the new tasks will take. Observe that table 13 is based on one machine and not two. The measure-ments is from the mapping at Fenix 2 and there is a possibility that the tasks between Fenix 1 and 2 differs in time. The table shows the direct time it takes to per-form a task, and does not include walking between the workstations.
Figure 41. Material and operators flow on the second floor.

50
The results in table 14 shows that it is possible for one operator to handle the second floor and all the un-winders. The operators would work efficiently for approximately four hours and then have time to han-dle minor stops, reschedulings and take of the plas-tic from the rolls once they arrive to the machine.
Task Before (min)
Concept (min)
Material to storage (back and forth)
70 0
Place material on unwinder
75 0
Handling collets 48 0Thread unwinder 68 68 Waste 21 21Glue 0 24Result one machine 282 min =
4,7 h113 min = 1,9 h
Figure 42. Example of control room
Table 14. Timed saved with the automated solution on the second floor.
Figure 43. Three of the four glue tanks on the second floor.
6.4.3 Integration Providing the operators with right information at the right time is the key to a successful information system. This concept consists of three different parts, each of which complements each other, but can be used sepa-rately.
The first part is the monitors that will be placed on the machine in order to provide status, relevant informa-tion and alarms. The monitor’s main purpose is to make it easy for the operators to overview the machine and quickly gain information. The monitors displays super-ficial and fast information to get the operators to act in time, and quickly guide them to the right place without needing to walk past the HMI. Since the machine covers a big area the information needs to be presented largely and clear. No more information than just the essentials should be shown. Figure 44 shows an example of infor-mation that could be displayed on the monitor, on the ground floor. The alarm is the most important informa-tion to display and this should be done by a structured and clear list. Before the monitor is installed the alarm list should be sorted, and unnecessary alarm removed.
The Baby machine will be equipped with multiple sen-sors that will deliver information about low material level. The sensors will be used to inform the operators about how much time it is left before they need to refill. This is something that Osvalder and Ulfvengren (2011) stated as a key element in an alarm system. They also claims that the operator should have enough time to re-spond to the alarm, and the alarm should be prioritized after time and consequence. The monitor could also show the current order and time left before resched-uling.
Figure 44. Monitor on the ground floor
ALARM - LISTREFILL 15 - Bags21 - Glue
ORDER

51
To call for attention, alarm lamps is used as a comple-ment to the monitors. The monitors continuously dis-play information and it would be very stressful if they constantly needed to look at them to make sure that they do not miss any information. The second part of this concept is therefore the different colored lamps ex-plained in the early concept. One color for the Bagfill-er, one for Casepacker, one for the production line and one regarding all other alarms. Based on Petterson et al. (2004) and Osvalder and Ulfvengren (2011), a combi-nation of red and green should be avoided. The lamps should not include the colors red, yellow or green as because they are often used to assess the status of the machine, for example “Stop”, “ Testing” and “On”. This may cause misleading information and therefore it is better to use other colors, like in figure 47.
Figure 47. Alarm lamps in different colors.
The third part is to provide the operators with smart-phones including several functions. Providing the oper-ators with smart devices is a step towards the so-called Augmented Operator, which is one of the three ideas in Industry 4.0 (Mrugalska & K. Wyrwicka, 2017). The monitors provide superficial and fast information and the phones provide more detailed information. Once the operators sees the monitors or alarm they can walk straight to the required area, fix the problem, and then reset the alarm in the phone. This provides the operators from constantly walking to the HMI, and if they are in an area where the alarms/monitors do not reach they can use their phone to monitor the machine. Schmitt et al. (2013) states that smart phones can be used as a con-trol device using, for example Bluetooth. The possibility to reset alarms and monitor the machine in the phones makes the operators work much more flexible.
QR-codes will be placed on different position of Fenix 2, when scanning the QR-codes, manuals and informa-tion about the machine will appear. This is a great way of getting the right information fast and this will also ease for new employees. Schmitt et al. (2013) says that the QR-codes contain passive data with needed infor-mation that can be decrypted by the phone. The QR-codes can work as learning equipment and might help non-ordinary staff to troubleshoot the machine, and
Good readability is based on high contrast, good light-ning and the right viewing angle (Osvalder & Ulfven-gren, 2011). Osvalder & Ulfvengren, 2011 also claims that an interface should not contain more than four col-ors and all displays should use colors and symbols con-sequent to avoid mistakes. The colors on the monitors are just one example of combinations. Figure 45 shows the monitor that will be placed on the second floor. This monitor provides information about the refill of glue, current order, next order and a rough layout of the gantry robots. Each robot is represented with a block, a green color indicated that both rolls on the unwinder is thread and one is rolling. Orange colors mean that only one of the unwinder is thread and red means that the last roll will shortly run out (causing production stop).
Figure 45. Monitor on the second floor.
The monitors will be placed where they are the most visible, figure 46 displays three suggested areas on the ground floor where the grey boxes are the monitors and the yellow area are where the monitors can be visual-ized. Two monitors in the middle of the production line, one in the front of the line and one at the quality station. On the second floor it is suggested to put the monitor in the control room and outside where it is easy to see.
Figure 46. Visualization of the placement of the monitors, and the visibility (yellow areas).
ORDER
REFILL
21 - Glue tank 49 - Glue tank 1

52
work more independently. During the Rescheduling/RIS the operators will use their phone to open the checklists and sign the tasks when they are finished. If some tasks have not been checked during the stop, a notice will appear once they start the machine. This is to ensure the quality and re-duce the risk of small mistakes that can cause trouble.
The new Integrations system can hopefully help reduce waste, improve quality and minimize the walking. Ac-cording to Mrugalska and K. Wyrwicka (2017) Industry 4.0, and the Augmented Operator, is linked to the Lean production. With help from these digital systems the op-erators will gain the tools required for minimizing their walking and reduce waste.

53
7DUSCUSSION AND CONCLUSION This chapter discusses the result of the project, and how the outcome is linked back to the theo-retical framework. It also discusses the relevance of the work, my own reflections, and how the project responds to its objective and aim, together with the research questions.
54
7.1 Discussing the final result This project presents two results, the results of the cur-rent state and the results from the detailed concepts.
The results from the mapping are hard to interpret, the workload for the operators varies much from one day to another and many factors affect this. The operators claim that they have a stressful environment, but the mapping indicates that they should have much available time. Due to the variation spent on reschedulings and stops it is impossible to establish the workload. In order to get the most correct interpretation, one has to isolate the work tasks and analyze them in smaller parts. For example, the refill of material can be timed and calcu-lated, therefore the result is relatively accurate. The result from the walking/alarm, on the other hand, is harder to analyze. The result showed a certain number of steps and alarms during one shift, but the analyze is based on what is thought to be much. The number of steps was to be categorized as “much walking”, but someone else could do another evaluation based on experience. The analy-sis resulted in the areas that were considered the most time consuming and non-ergonomic. The project has in that way been very Lean orientated, as the reduction of waste is a fundamental part in the Lean philosophy (Bellgran & Säfsten, 2005). The project based develop-ment areas on the current state and the areas that were founded during the mapping. Sörqvist (2013) and Pascal (2007) both shows example on how to categorize and distribute the waste. The result from the current state does not categorize the different types of waste, resulting in many tasks being called “non-value adding” instead of “necessary but not value adding” as they may be. Not engaging the employees is also waste according to Lean, and the operators were included as much as possible. The participation of the operators was greatest at the beginning and slowed towards the end of the project. Unfortunate there was no time to include the operators in the final result and the outcome might have been different if they were a part of it.
Pascal (2007) claims that the productivity suffers when there is unnecessary walking, which is something that the Integration concept aims at improving. The Inte-gration concept will give the operator the possibility to work more flexible as they are not depending on loca-tion with help of the mobile device. A mobile device is according to Kolberg and Zühlke (2015) more effec-tive than signal lamps, like they use today. The project
has decided to keep the not so modern signal lamps as Thunberg and Osvalder (2008) claims that alarm sys-tems should consider the cognitive condition, and make sure that the operators are not being overloaded. The alarm lamps will quickly alert the operators about de-viations and thereby reduce some of the stress in there working day, as they will not have to worry about not seeing the alarm lamp or walking more than necessary. A system without the lamps would either require the operators to constantly look at the monitors, or have an audibly alarm. Essity wanted the project to use the latest technology and this is something the project did not really succeed with. The Integration concept is based on newer technique than the existing, but not the new-est. Today’s technology offers endless with possibility to connect and integrate with the environment. This proj-ect did not research all of the newest techniques and trends, but focused instead on finding a more simple, easy-implemented concept. The research behind the in-tegration concepts, or all concepts, affects the outcomes as inspiration and knowledge is taken from the theory. Using new technology can, on the other hand, cause disadvantages that are difficult to take into consider-ation, just because they have not been discovered yet.
The result of the concepts shows that there are ways to reduce operators’ non-value added work by providing automated solutions and new technologies. The idea was that the concept would work to increase the economic and safety and not just reduce time. From the company’s perspective the outcome of the result shows that they can reduce staff through automation, the operators will be highly affected by a change like this. They will have to learn to operate new technique and find new ways of working. A reduction of staff to, example 2,5 em-ployees per machine (second floor has one operator per two machines) will put bigger responsibilities, especially when they are not the ordinary staff. The results of the project is however one, of many results. If the ideation work had been done by someone else, in another way the result would probably not have been the same. These concepts are partly affected by my knowledge, work ex-perience and previous courses.
Initially I assumed that the current state would be a frac-tion of the project, just enough to gain the important information about what areas that were the most crit-ical. It then turned out that the current state analysis only grew and grew, the more information I received
7 DISCUSSION AND CONCLUSION

55
the more areas became interesting. What caused the project to fall behind schedule was partly that I need-ed help from employees to gain information, and that information formed the basis for the next step. For ex-ample, before I could decide if the operators walked a lot, I needed to have data from the step counters. Even though I tried to work in several areas at the same time, the project partly stopped. When the result came after a week, I needed to understand the reason for the walk-ing in order to solve the problem. It took another two weeks for the survey to be answered by the operators and another few weeks before I found out the number of alarms on the machine/day. This resulted in the proj-ect falling behind schedule and less time than planned was spent on the concepts.
7.2 Relevance In order for Essity to maintain its competitiveness, they need to keep up with technical developments and find new ways to automate and digitize their factory. This project is relevant to Essity as they increase the aware-ness of their current state. The mapping of the current state shows where operators spend most time and where the biggest waste occurs. The overall mapping is of great relevance to the company, as it may constitute deci-sion-making material for future projects.
Not only the mapping, but also the final results is rele-vant to Essity in Falkenberg as they wanted to find ways to reduce the amount of manual work non-value add-ing work. The final concepts show that it is possible to decrease manual work and increase automation and still maintain the same production volume.
7.3 Recommendation It was stated early in the process that this project should increase awareness about the operators work and be-come the basis for future implementations. The recom-mendation is that the managers at Essity proceed with the results, both the mapping and the concepts. The results from the mapping can vary depending on who is performing the measurements, therefore it might be interesting to make additional measurement if they want to have detailed time measurements. Due to limitations in time, not all tasks were mapped and this might also be interesting to complement the mapping with.
The automation of the second floor and the cardboard boxes shows that it is possible to decrease the amount of manual work, and the staff. Automating work tasks
and reducing staff can lead to problems. The operators claimed, according to the survey, that they felt under-staffed and wanted an extra operator. In order to suc-cessfully implement this concept it is of great deal that the operators are involved in the process. The project also recommends that the managers start by implement-ing the Integration concept, allowing the operators to learn the new information system before the automated solutions. If the opposite is done, there is a great risk that the operators perceive the implementations as more stressful.
Further recommendations for the concepts are to do another evaluation and include the operators in the pro-cess. Their knowledge and opinions is the key to a suc-cessful concept, and participation is a key for a successful implementation. The concepts are not developed in de-tail and before any implementations the managers need to make a more detailed requirement lists and modify the concepts so they fulfill the requirements. It is also possible to implement one of the concepts at a time, as they are not depending on each other. The concepts shows that there is a possibility to decrease the manual work and take the next step towards a more automated and digitalized factory. And therefore the projects overall recommendation is to use the information gathered in this rapport as a basis for further projects.
7.4 Objective and aims The objective was to propose ways to reduce the amount of manual non-value adding work performed by opera-tors on the Baby machines with priority on time losses, ergonomic and safety. In the current state analysis areas that were most critical to develop with respect to the objective were found. The objective was met by the final concept that purposed ways to reduce non-value adding work. The project did not manage to deliver concrete improvements for the safety and ergonomic, but took it into account when designing all concepts. The In-tegration concept will hopefully decrease the walking and provide the operators with better information that will result in a less stressful environment. A less stressful environment can prevent the operators from not paying enough attention, or doing non-ergonomic lifting be-cause it is faster.
The first aim was that the project should deliver realis-tic concepts that reduce manual non-value adding tasks performed by operators through automation, and find new ways to quality-proof the material. This was met
56
by delivering a result involving automated solutions that reduce the manual work. During the project it was made clear that the quality was already an ongoing proj-ect, and therefore that part is not as developed. The qual-ity will hopefully improve as the operators can do the quality test in peace as they are provided with monitors and information at the quality station.
The second aim was that the project should optimize material handling with focus on raw materials, material flows and wastes. All concepts relating to material refills affect in one way or another the flows and waste. Due to time limits, there was no time to improve the material handling. The project instead delivers final concepts that takes the material handling into account in a way that does not impairs the handling.
7.5 Conclusion This part discusses how the project responds to the re-search question stated in the fist chapter.
7.5.1 Research question 1
How can unsafe and non-ergonomic tasks be eliminated using automation and digital systems?
The ergonomic aspect is not only physical, but also mentally. The Integration concepts can hopefully re-duce stress in both areas. By implementing the Integra-tion concept the operators will be provided with better overview and information. This will most likely decrease the stress, give the operator better tools to work more systematically and prevent them from unnecessary walk-ing. A less stressful environment prevents the operators from making human errors and unsafe tasks. By re-placing operators’ manual work with robots (cardboard boxes and second floor), the physical load decreases. The refill of glue, that was one of the most critical non-er-gonomic tasks have not been eliminated by this project since there are already ongoing projects in this area.
7.5.2 Research question 2
How can manual non-value added work be removed, and how much time would be saved?
There are endless possibilities when it comes to plan-ning a layout, choosing digital solutions or, for example, deciding what robot to use. The concept presented in this raport shows how it is possible to decrease the walk-
ing, work on the second floor and refill of cardboard boxes and plastic bags. Automating the second floor would save approximately 190 min/shift, and the refill of boxes approximately 85 min. If it would be possible to double the amount of plastic bag in each bundle, the concept would save approximately 20 min on the small bags and 8 min on the large. The concepts proposed by the project would save approxiamatly 4,5 hours (based on average time for the bags). The required working time on the second floor is 113 min, this shows that one operator easily can maintain two machines at a time since this will be approximately 3 hours and 46 min. The staff can therefore be reduced to 2,5 operators/ Baby machine. The unnecessary walking will most likely be reduced by the Integration concept, but how much time is hard to estimate.

57
WORKS CITEDBellgran, M., & Säfsten, K. (2005). Produktionsutveckling, Utveckling och drift av produktionssystem.
Lund: Studentlitteratur AB.
Bohgard, M., Karlsson, S., Lovén, E., Mikaelsson, L.-Å., Mårtensson, L., Osvalder, A.-L., et al. (2011). Ar-bete och teknik på människans villkor (Vol. 2:1). Stockholm: Prevent.
Chay, T., Xu, Y., Tiwari, A., & Chay, F. (2015). Towards lean transformation: the analysis of lean implemen-tation frameworks. Journal of Manufacturing Technology Management , 27 (7), 1031-1052.
Johannesson, H., Persson, J.-G., & Pettersson, D. (2013). Produktutveckling: Effektiva metoder för kon-struktion och design. Stockholm: Liber.
Kraft, C. (2012). User Experience Innovation. Berkely, CA: Apress.
Kolberg, D., & Zühlke, D. (2015). Lean Automation enabled by Industry 4.0 Technologies. Elviser , 1870-1875.
Liker, J. (2004). The Toyota Way: 14 Management Principles from the World’s Greatest Manufacturer. Uni-ted States of America.
Magrab, E., Gupta, S., McCluskey, F., & Sandborn, P. (2009). Integrated Product and Process Design and Development: The product Realization Process. New York: CRC Press.
Marlon, S., Tarcisio Abreu, S., & Michel Jose, A. (2018). The impacts of lean production on the complexity of socio-technical systems. INTERNATIONAL JOURNAL OF PRODUCTION ECONOMICS , 197, 342-357.
Martin, B., & Hanington, B. (2012). Universal Methides of Design. Beverly: Rockport Publisher.
Mrugalska, B., & K. Wyrwicka, M. (2017). Towards Lean Production in Industry 4.0 . Procedia Engine-ering , 466 – 473 .
Nordberg, K. (2008). Projekthandboken: Planera, leda och värdera projekt . Lund: Förlags AB Björnen.
Pascal, D. (2007). Lean Production Simplified: A plain-Language Guide to the World’s Most Powerful Production System. New York: Productivity Press.
Petersson, P., Johansson, O., Broman, M., Blucher, D., & Almsterman, H. (2010). Lean: Turn Deviation into success. Stockholm: Part Development AB.
Pettersson, R., Frank, L., Frohm, J., Holmberg, S., Johansson, P., Meldert, M., et al. (2004). Bild & Form för informationsdesign. Lund: Studentlitteratur AB.
Reinecker, L., & Stray Jörgensen, P. (2014). Att skriva en bra uppsats. Stockholm: Samfundslitteratur och Liber AB.
Schmitt, M., Meixner, G., Goreck, D., Seissler, M., & Loskyll, M. (2013). Mobile Interaction Technologies in the Factory of the Future. Elsevier , 536-542.
Skårbratt, L.-G. (2009). Att driva projekt: Enkel projektstyrning för stora och små projekt. Västra Frölunda: Oppenheim förlag.
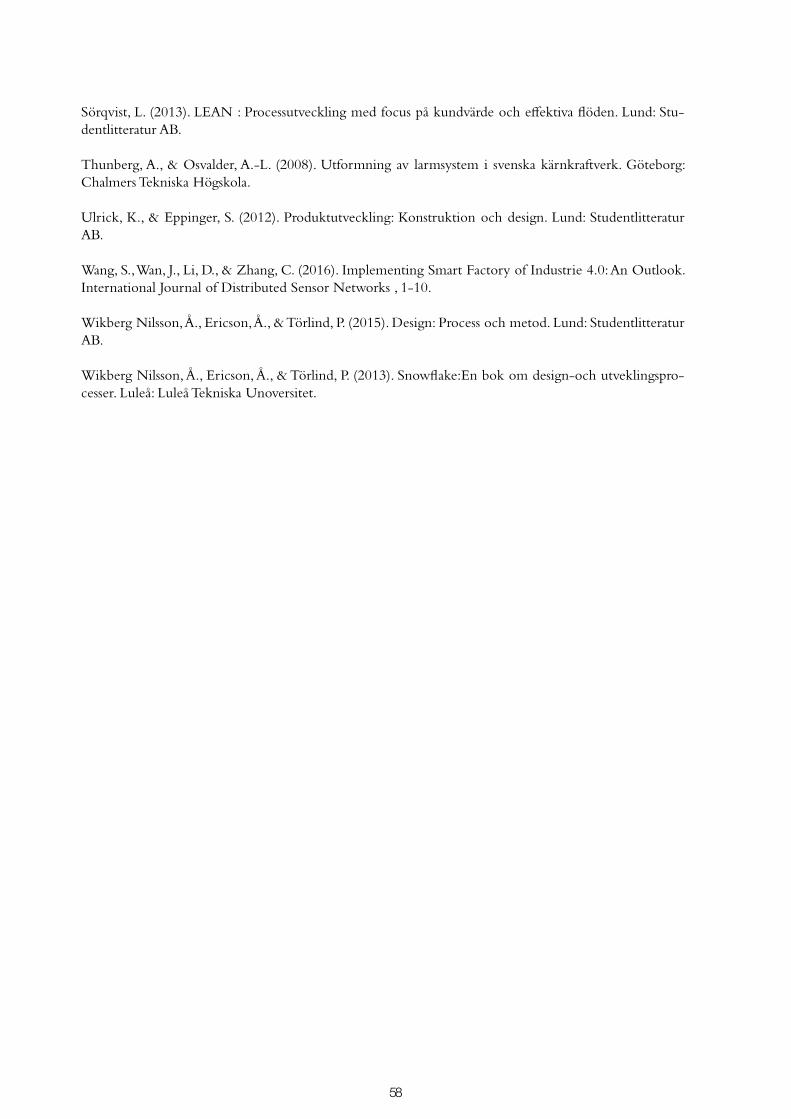
58
Sörqvist, L. (2013). LEAN : Processutveckling med focus på kundvärde och effektiva flöden. Lund: Stu-dentlitteratur AB.
Thunberg, A., & Osvalder, A.-L. (2008). Utformning av larmsystem i svenska kärnkraftverk. Göteborg: Chalmers Tekniska Högskola.
Ulrick, K., & Eppinger, S. (2012). Produktutveckling: Konstruktion och design. Lund: Studentlitteratur AB.
Wang, S., Wan, J., Li, D., & Zhang, C. (2016). Implementing Smart Factory of Industrie 4.0: An Outlook. International Journal of Distributed Sensor Networks , 1-10.
Wikberg Nilsson, Å., Ericson, Å., & Törlind, P. (2015). Design: Process och metod. Lund: Studentlitteratur AB.
Wikberg Nilsson, Å., Ericson, Å., & Törlind, P. (2013). Snowflake:En bok om design-och utveklingspro-cesser. Luleå: Luleå Tekniska Unoversitet.

APPENDIX A. Gantt schemePAGE 1 (1)

APPENDIX B. Number of steps PAGE 1 (2)
Step Km Hours Step/8h
14-feb 7202 5,4 8 7202
14-feb 9871 7,4 8 9871
14-feb 9199 6,8 8 9199
14-feb 8470 6,3 8 8470
14-feb 8617 6,4 8 8617
14-feb 4114 3 8 4114
15-feb 8402 6,3 9 7468,444
15-feb 9289 6,9 9 8256,889
15-feb 8235 6,1 7 9411,429
15-feb 6139 4,6 7 7016
15-feb 8835 6,6 7 10097,14
15-feb 5658 4,2 7 6466,286
15-feb 4959 3,7 8 4959
15-feb 8755 6,5 8 8755
15-feb 7337 5,5 8 7337
16-feb 3977 2,9 8 3977
16-feb 9262 6,9 8 9262
16-feb 9150 6,8 8 9150
16-feb 9075 6,7 8 9075
16-feb 8064 6 8 8064
16-feb 8993 6,7 8 8993
16-feb 7167 5,3 8 7167
16-feb 6507 4,8 8 6507
16-feb 7051 5,2 8 7051
17-feb 9057 6,7 8 9057
17-feb 9331 6,9 8 9331
17-feb 10296 7,7 8 10296
17-feb 8766 6,5 8 8766
17-feb 7691 5,7 8 7691
17-feb 7368 5,5 8 7368
17-feb 7524 5,6 8 7524
17-feb 8205 6,1 8 8205
18-feb 10177 7,6 9 9046,222
18-feb 10494 7,8 9 9328
18-feb 8127 6,1 9 7224
18-feb 6976 5,2 7 7972,571
18-feb 7392 5,5 7 8448
18-feb 6800 4,6 7 7771,429
18-feb 6231 4,6 8 6231
18-feb 7378 5,6 8 7378
18-feb 7897 5,9 8 7897
19-feb 7440 5,5 8 7440
19-feb 6962 5,2 8 6962
19-feb 8480 6,3 8 8480
19-feb 8291 6,2 8 8291
19-feb 6490 4,9 8 6490

APPENDIX B. Number of steps PAGE 2 (2)
19-feb 10053 7,5 8 10053
19-feb 6591 5 8 6591
19-feb 6551 4,9 8 6551
19-feb 7220 5,4 8 7220
20-feb 9507 7,1 8,5 8947,765
20-feb 10032 7,5 9 8917,333
20-feb 10625 8 9 9444,444
20-feb 6706 5 6,5 8253,538
20-feb 6500 4,9 7 7428,571
20-feb 6529 4,8 7 7461,714
20-feb 5578 4,1 8 5578
20-feb 6710 5 8 6710
20-feb 9585 7,1 8 9585
21-feb 7660 5,8 8 7660
21-feb 8667 6,5 8 8667
21-feb 7297 5,4 7 8339,429

APPENDIX C. REBA analysis PAGE 1 (1)

APPENDIX D. REBA analysisPAGE 1 (1)

APPENDIX E. Survey questionsPAGE 1 (2)
1. Tycker du att stegen som du mätte upp med stegräknare representerar din vardagliga belast-ning? Ringa in svaret
Ja Nej Vet inteOm Nej, vad var det som gjorde att stegen inte var representativa.
2. Upplever du att du går mycket under en generell arbetsdag? Ringa in svaret 1-5
Jag tycker inte att jag går myck-et under en arbetsdag 1 2 3 4 5
Jag tycker att jag går väldigt mycket under en arbetsdag
3. När ni gjorde mätningen med stegräknare, när upplevde du att det började bli slitsamt/jobbigt att gå ett visst antal steg? Ringa in svaret
5000 steg 6000 steg 7000 steg 8000 steg 9000 steg 10 000 steg 11 000 stegKommer inte ihåg
Blev aldrig jobbigt
4. Finns det verktyg/städredskap/skyddsutrustning som du önskar var bättre placerade? Om ja, vilken utrustning och vart skulle du önska att den var placerad?
5. Upplever du att ni har mycket onödiga larm i er larmlista som startar saftblandaren, dvs att saft-blandaren larmar om larm som inte är så kritiska?
Ringa in svaretJa Nej Ingen åsikt
Om ja, kan du ge exempel på sådana larm.
6. Anser du att larmlistan borde ses över? Ringa in svaret
Ja Nej Ingen åsikt7. Brukar du bli avbruten när du utför arbetsuppgifter för att andra delar på maskinen påkallar din
uppmärksamhet? Tex att du påbörjar ett kvalitetstest och maskinen larmar. Ringa in svaret
Jag blir aldrig avbruten 1 2 3 4 5 Jag blir alltid avbruten Kan du ge exempel på vad det är som brukar påkalla din uppmärksamhet och ”störa” pågående arbete.
8. Finns det områden vid Fenix 2 där du känner att du inte har koll på vad som händer på maski-nen? Om ja, på vilka ställen skulle du vilja ha bättre överblick och vilken information skulle du vilja ha på respektive ställe.
9. Vilka dagar upplever du att det är som mest att göra och vad är den bidragande faktorn till det-ta? Dvs de dagar som det går i ett och lite tid finns för att sitta ner.
10. Brukar du känna dig stressad på jobbet?
Jag känner mig aldrig stressad 1 2 3 4 5 Jag känner mig ofta stressad Vad tycker du är den vanligaste orsaken till en stressig situation?
11. Finns det arbetsmoment som du tycker är påfrestande/tunga/jobbiga att utföra? Om ja, vilka moment anser du är jobbiga och varför.

APPENDIX E. Survey questionsPAGE 2 (2)
12. Vad tror du är största anledningen till att ni går så mycket under ett skift?
13. Vad skulle du vilja förbättra/ändra på din arbetsplats, skriv gärna alla områden stora som små. Kan tex handla om arbetsmiljö, ny utrustning, positionering av maskiner eller material, arbetssätt osv. Om ni har förbättringsförslag får ni gärna skriva de också! Den här frågan har ingen direkt koppling till stegräknarna, så skriv allt ni kan komma på.
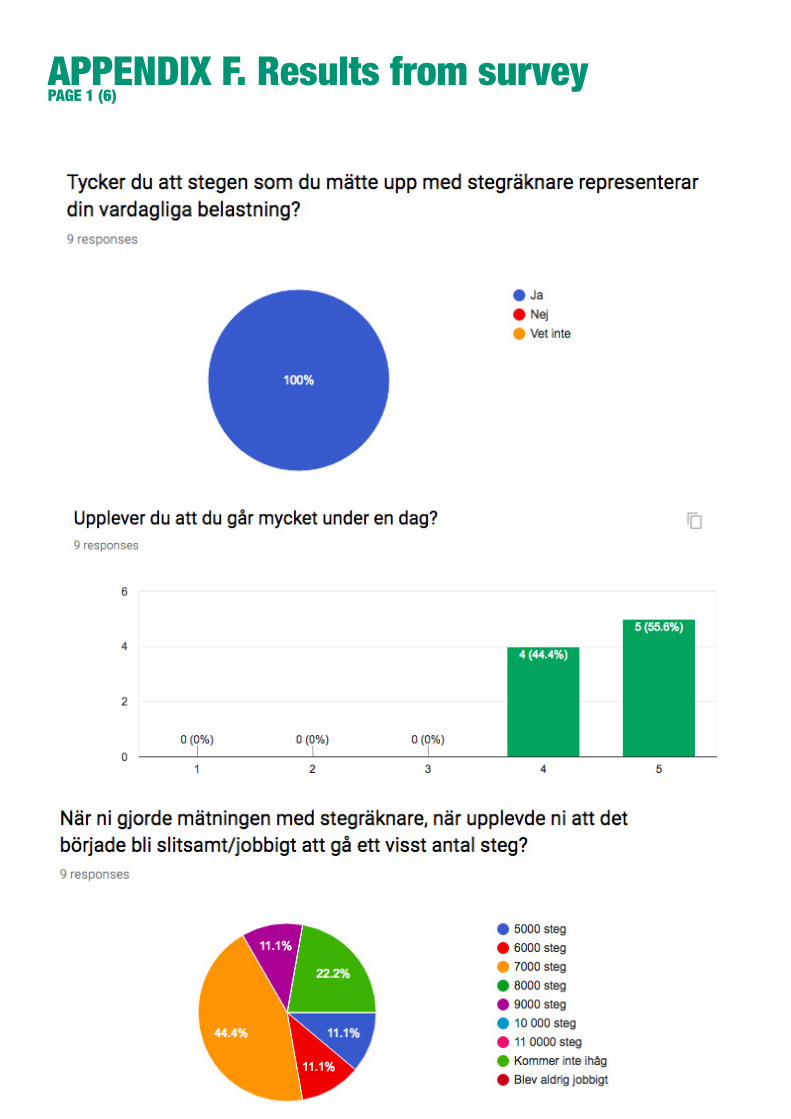
APPENDIX F. Results from surveyPAGE 1 (6)

APPENDIX F. Results from surveyPAGE 2 (6)

APPENDIX F. Results from surveyPAGE 3 (6)
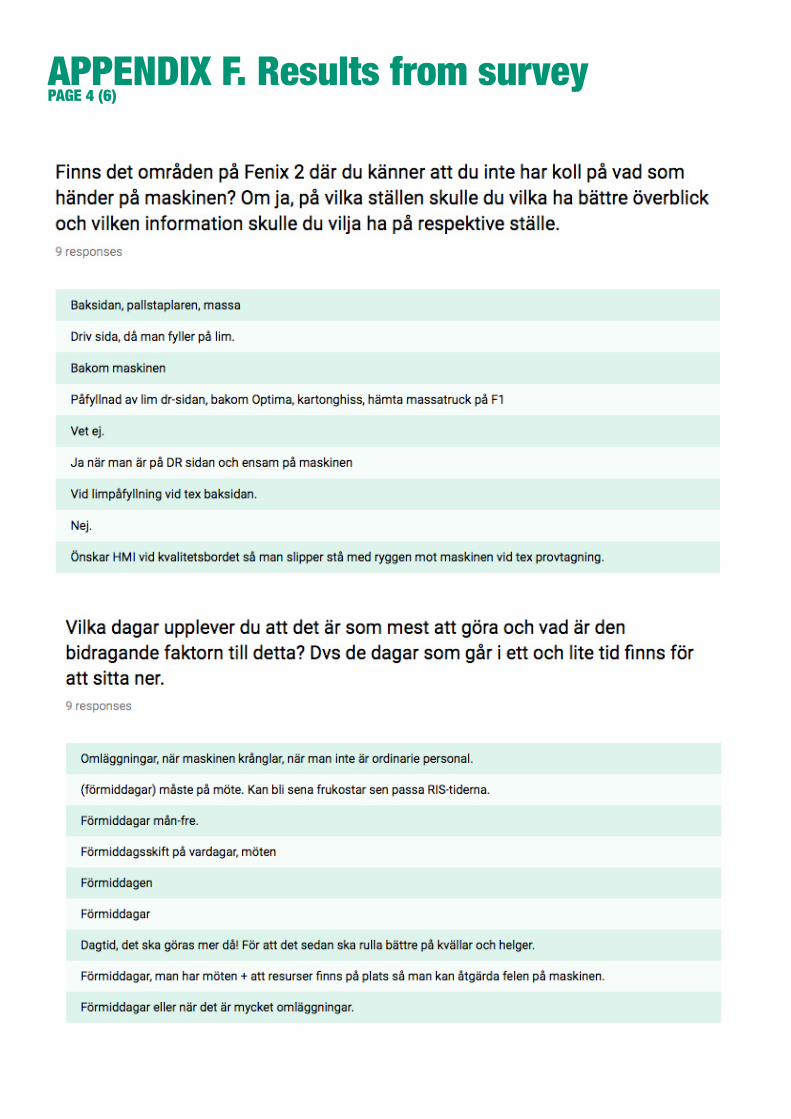
APPENDIX F. Results from surveyPAGE 4 (6)

APPENDIX F. Results from surveyPAGE 5 (6)
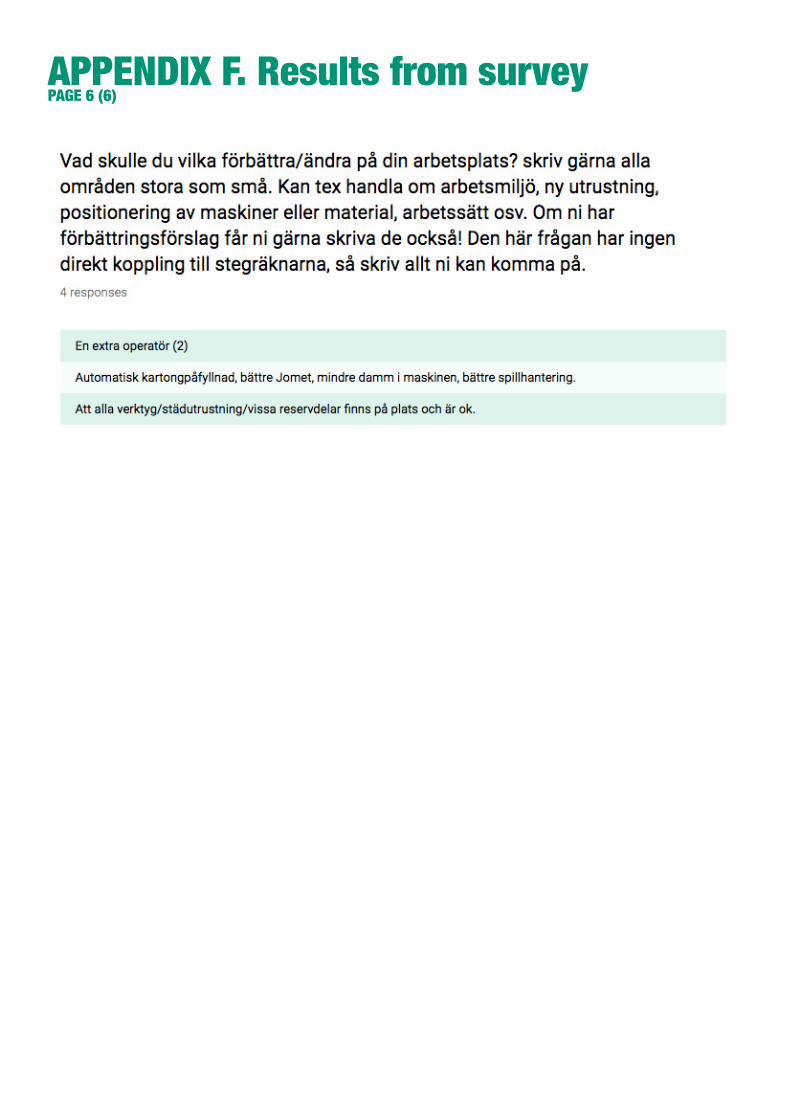
APPENDIX F. Results from surveyPAGE 6 (6)