essity year-end report 2018 - masdpstatic.azureedge.net · professional hygiene: -390 bps 1)...
TRANSCRIPT

Year-end Report2018

January 31, 2019 Year-end Report 20182
This presentation may contain forward-looking statements. Such
statements are based on our current expectations and are subject
to certain risks and uncertainties that could negatively affect our
business. Please read our most recent annual and sustainability
report for a better understanding of these risks and uncertainties.

Summary
Year-end Report 20183 January 31, 2019
1) Net sales which excludes exchange rate effects, acquisitions and divestments2) Excluding items affecting comparability3) Excluding items affecting comparability, currency translation effects and acquisitions
Organic Net Sales1)
Adjusted EBITA2)Net Sales
SEK
118,500m
+8.5%
SEK
12,935m
-4%
x%
+3.1%excl lower sales of
mother reels
Adjusted EBITA Margin2)
10.9%
-140 bps
-11%3)
Organic Adjusted EBITA Operating Cash Flow
SEK
12,324m+2.6%incl lower sales of
mother reels
▪ Higher organic net sales1) in all
business areas
▪ Strong organic sales growth in
emerging markets
▪ Higher prices and better mix
▪ Higher volumes
▪ Strong contribution from cost savings
of above SEK 1bn
▪ Significantly higher raw material- and
energy costs with negative impact on
adjusted EBITA margin of -420 bps
2018 vs 2017
Summary
Year-end Report 2018January 31, 20194
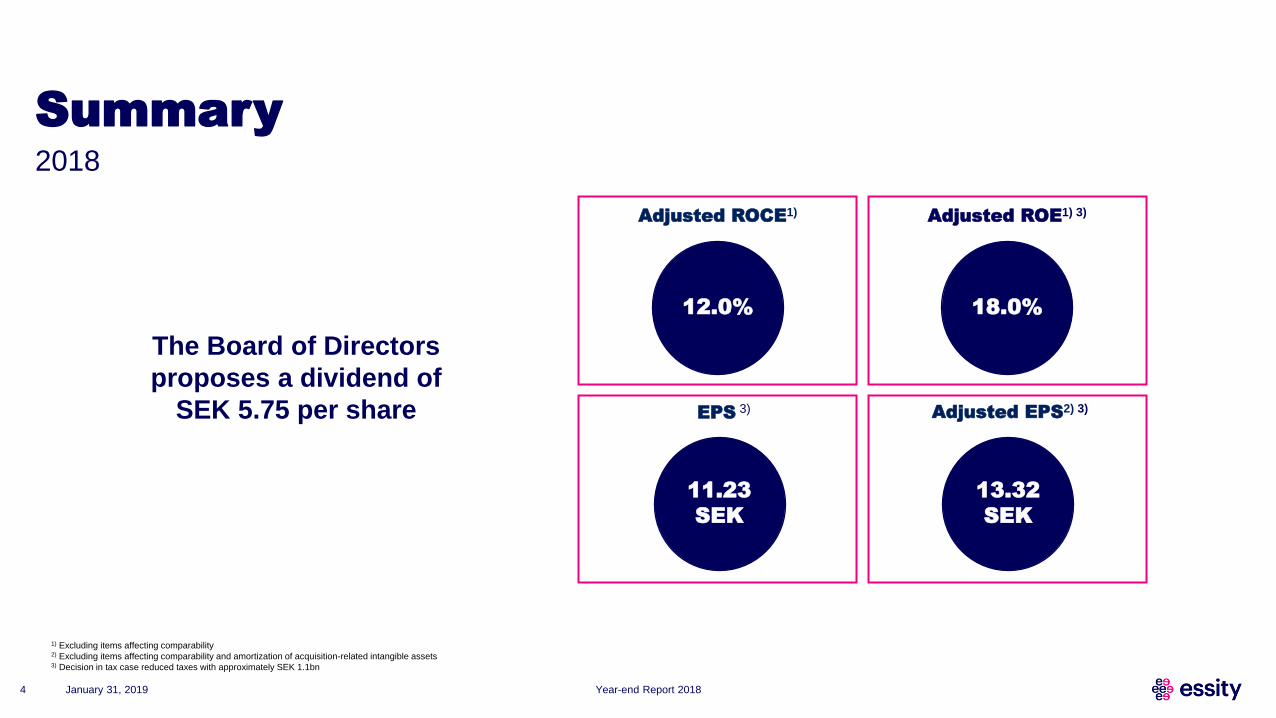
SEK x
Adjusted ROCE1)
12.0%
SEK x11.23
SEK
13.32
SEK
18.0%
1) Excluding items affecting comparability2) Excluding items affecting comparability and amortization of acquisition-related intangible assets3) Decision in tax case reduced taxes with approximately SEK 1.1bn
Adjusted ROE1) 3)
EPS 3) Adjusted EPS2) 3)
The Board of Directors
proposes a dividend of
SEK 5.75 per share
2018

Successful InnovationsLaunched 29 Innovations in 2018
Year-end Report 2018January 31, 20195

Initiatives and Awards
▪ Industry leader in Dow Jones Sustainability Index
▪ New targets for reduction of greenhouse gas emission
approved by Science Based Targets initiative
▪ Joined the Ellen MacArthur Foundation’s New Plastic
Economy global commitment, “A line in the sand”
▪ Awards at 2018 European Cleaning & Hygiene Awards
─ Technical Innovation of the Year: Tork EasyCube®
─ Best Practice – Sustainability: Tork PaperCircle™
▪ ~2.5 million people educated by Essity in hygiene and
health
Year-end Report 2018January 31, 20196

SummaryQ4 2018 vs Q4 2017
Year-end Report 20187 January 31, 2019
1) Net sales which excludes exchange rate effects, acquisitions and divestments2) Excluding items affecting comparability3) Excluding items affecting comparability, currency translation effects and acquisitions
Organic Net Sales1)
Adjusted EBITA2)Net Sales
SEK
31,112m
+8.5%
SEK
3,451m
-5%
x%
+4.0%excl lower sales of
mother reels
Adjusted EBITA Margin2)
11.1%
-150 bps
-11%3)
Organic Adjusted EBITA Operating Cash Flow
SEK
3,923m
▪ Higher organic net sales1) in all business areas
▪ Strong organic sales growth in emerging
markets
▪ Higher prices in all business areas
▪ Higher volumes
▪ Strong contribution from cost savings
▪ Significantly higher raw material- and energy
costs with negative impact on adjusted EBITA
margin of -480 bps
▪ Higher distribution costs
▪ Decision in tax case reduced taxes with
approximately SEK 1.1bn
+3.3%incl lower sales of
mother reels

SummaryQ4 2018
Year-end Report 20188 January 31, 2019
SEK x
Adjusted ROCE1)
12.7%
Adjusted ROE1) 3)
EPS 3)
SEK x4.85
SEK
Adjusted EPS2) 3)
4.97
SEK
26.7%
1) Excluding items affecting comparability2) Excluding items affecting comparability and amortization of acquisition-related intangible assets3) Decision in tax case reduced taxes with approximately SEK 1.1bn

Net Sales
Year-end Report 2018January 31, 20199
Q4 2018 vs Q4 2017
Net SalesQ4 2017
Price/Mix Volume Acquisitions Currency Net SalesQ4 2018
+2.8%
+4.5%
+0.5% +0.7%
+8.5%
Organic Net Sales1) +3.3%
SEK 28,664m
SEK 31,112m
1) Net sales which excludes exchange rate effects, acquisitions and divestments
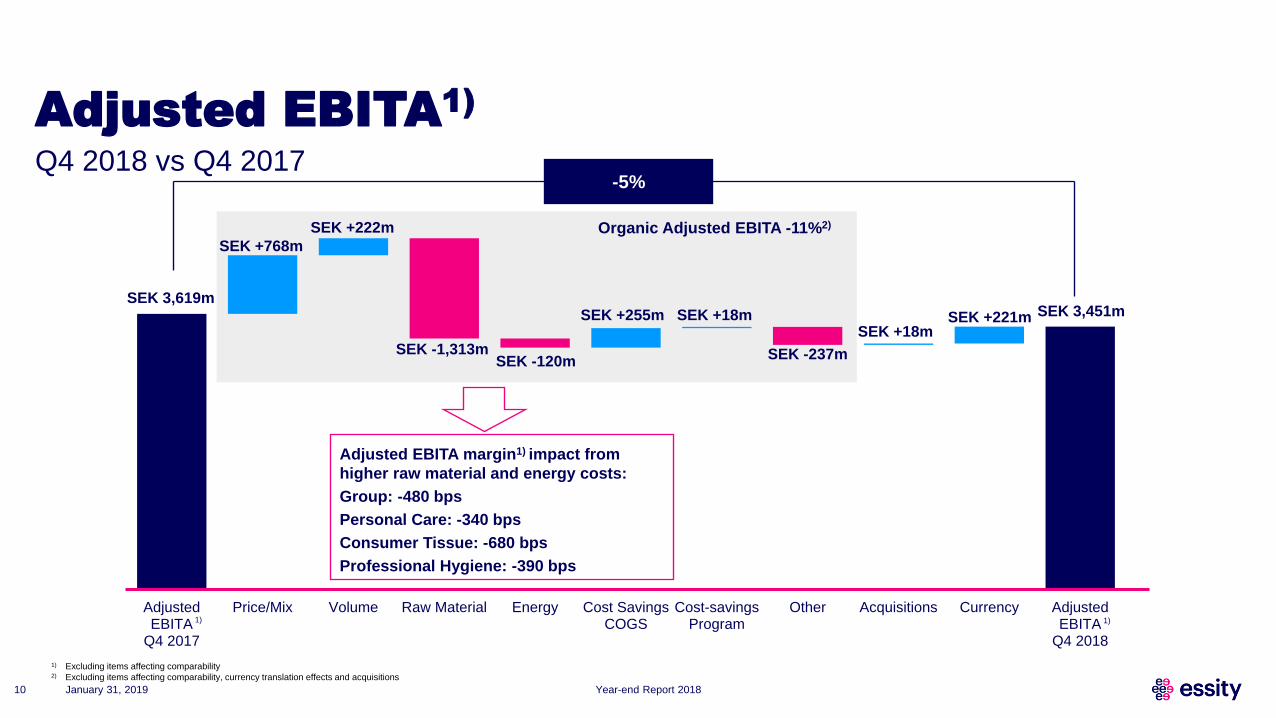
Adjusted EBITA1)
Q4 2018 vs Q4 2017
Year-end Report 2018January 31, 201910
AdjustedEBITA
Q4 2017
Price/Mix Volume Raw Material Energy Cost SavingsCOGS
Cost-savingsProgram
Other Acquisitions Currency AdjustedEBITA
Q4 2018
Organic Adjusted EBITA -11%2)
SEK 3,619m
-5%
SEK +768m
SEK +222m
SEK -1,313mSEK -120m
SEK +255m
SEK -237m
SEK +18mSEK +221m SEK 3,451m
1) 1)
Adjusted EBITA margin1) impact from
higher raw material and energy costs:
Group: -480 bps
Personal Care: -340 bps
Consumer Tissue: -680 bps
Professional Hygiene: -390 bps
1) Excluding items affecting comparability2) Excluding items affecting comparability, currency translation effects and acquisitions
SEK +18m

Cost SavingsQ4 2018 vs Q4 2017
Year-end Report 2018January 31, 201911
▪ Tissue Roadmap
─ Closure of production capacity
─ Headcount reduction
▪ Operational efficiency improvements
▪ Material rationalization
▪ Sourcing savings
SEK 255m
COGS Savings
▪ Reduction of travel and hiring costs
▪ Reduced office costs
▪ Headcount reduction
▪ Improved A&P efficiency
-50 bps to 16.4% of sales
SG&A Savings

Cost-Savings Program
Year-end Report 2018January 31, 201912
▪ Expected annual cost-savings of approx SEK 900m
with full effect at the end of 2019
─ Q4 2018: SEK 18m
─ Year-end 2018 annualized run-rate cost-savings
approx SEK 150m
▪ Reduce the cost base related to COGS and SG&A
primarily through headcount reduction of approx
1,000 positions
─ Q4 2018: 210 cancelled positions
▪ Expected restructuring costs of approx SEK 700m
─ Q4 2018: SEK 130m
▪ Enhanced organizational structure

Raw Material Development
Year-end Report 2018January 31, 201913
75
100
125
150
Jul-17 Sep-17 Nov-17 Jan-18 Mar-18 May-18 Jul-18 Sep-18 Nov-18
Polypropylene, EUR Propylene, EUR
75
100
125
150
Jul-17 Sep-17 Nov-17 Jan-18 Mar-18 May-18 Jul-18 Sep-18 Nov-18
Fluff NBSK EUCA
75
100
125
150
Jul-17 Sep-17 Nov-17 Jan-18 Mar-18 May-18 Jul-18 Sep-18 Nov-18
SOP US SOP EU
Source: FOEX, Fast Markets RISI, VDP, Macrobond, Epexspot, ICIS-LOR
Oil-based Raw Materials2)
Market Pulp in USD, Europe Paper for Recycling1)
75
100
125
150
175
200
Jul-17 Sep-17 Nov-17 Jan-18 Mar-18 May-18 Jul-18 Sep-18 Nov-18
Electricity, EUR Natural Gas, EUR
Energy Prices3)
Index 100 = July 2017
1) Sorted Office Paper. Index in local currencies. EU refers to Germany
2) Polypropylene major feedstock of non-woven material, Propylene major feedstock of SAP material
3) Electricity Germany. Natural Gas, TTF Index
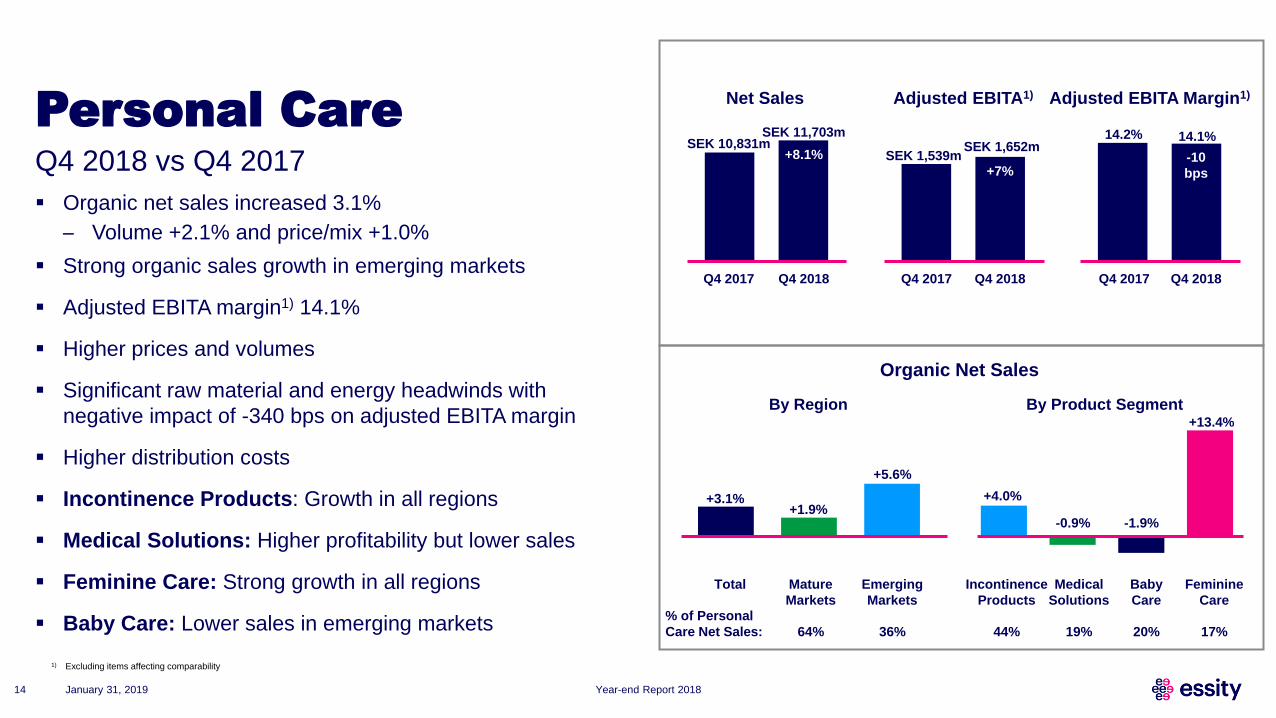
Personal Care
▪ Organic net sales increased 3.1%
─ Volume +2.1% and price/mix +1.0%
▪ Strong organic sales growth in emerging markets
▪ Adjusted EBITA margin1) 14.1%
▪ Higher prices and volumes
▪ Significant raw material and energy headwinds with
negative impact of -340 bps on adjusted EBITA margin
▪ Higher distribution costs
▪ Incontinence Products: Growth in all regions
▪ Medical Solutions: Higher profitability but lower sales
▪ Feminine Care: Strong growth in all regions
▪ Baby Care: Lower sales in emerging markets
Q4 2018 vs Q4 2017
Year-end Report 2018January 31, 201914
SEK 11,703mSEK 10,831m
Q4 2017 Q4 2018 Q4 2017 Q4 2018 Q4 2017 Q4 2018
SEK 1,652mSEK 1,539m
Net Sales Adjusted EBITA1) Adjusted EBITA Margin1)
+7%
+8.1% -10
bps
14.2% 14.1%
+3.1%
Total Mature
Markets
Incontinence
Products
By Region By Product Segment
Emerging
Markets
+1.9%+4.0%
-1.9%
+13.4%
Baby
Care
Feminine
Care% of Personal
Care Net Sales: 64% 36% 44% 19% 17%20%
-0.9%
+5.6%
Medical
Solutions
Organic Net Sales
1) Excluding items affecting comparability

Consumer Tissue
▪ Organic net sales increased 4.6%
─ Volume -0.5% and price/mix +5.1%
▪ Strong organic sales growth in emerging markets
▪ Lower volumes due to mother reels
▪ Adjusted EBITA margin1) 6.9%
▪ Higher prices in Asia, Europe and Latin America
▪ Better mix
▪ Significant raw material and energy headwinds with
negative impact of -680 bps on adjusted EBITA margin
▪ Higher distribution costs
Q4 2018 vs Q4 2017
Year-end Report 2018January 31, 201915
SEK 12,094m
SEK 11,026mSEK 840m
SEK 900m
Net Sales Adjusted EBITA1) Adjusted EBITA Margin1)
+9.7%-130
bps
8.2%
6.9%
Q4 2017 Q4 2018 Q4 2017 Q4 2018 Q4 2017 Q4 2018
+4.6%
Total Mature
Markets
Organic Net Sales By Region
Emerging
Markets
+1.8%
% of Consumer
Tissue Net Sales: 53% 47%
+8.5%
-7%
1) Excluding items affecting comparability
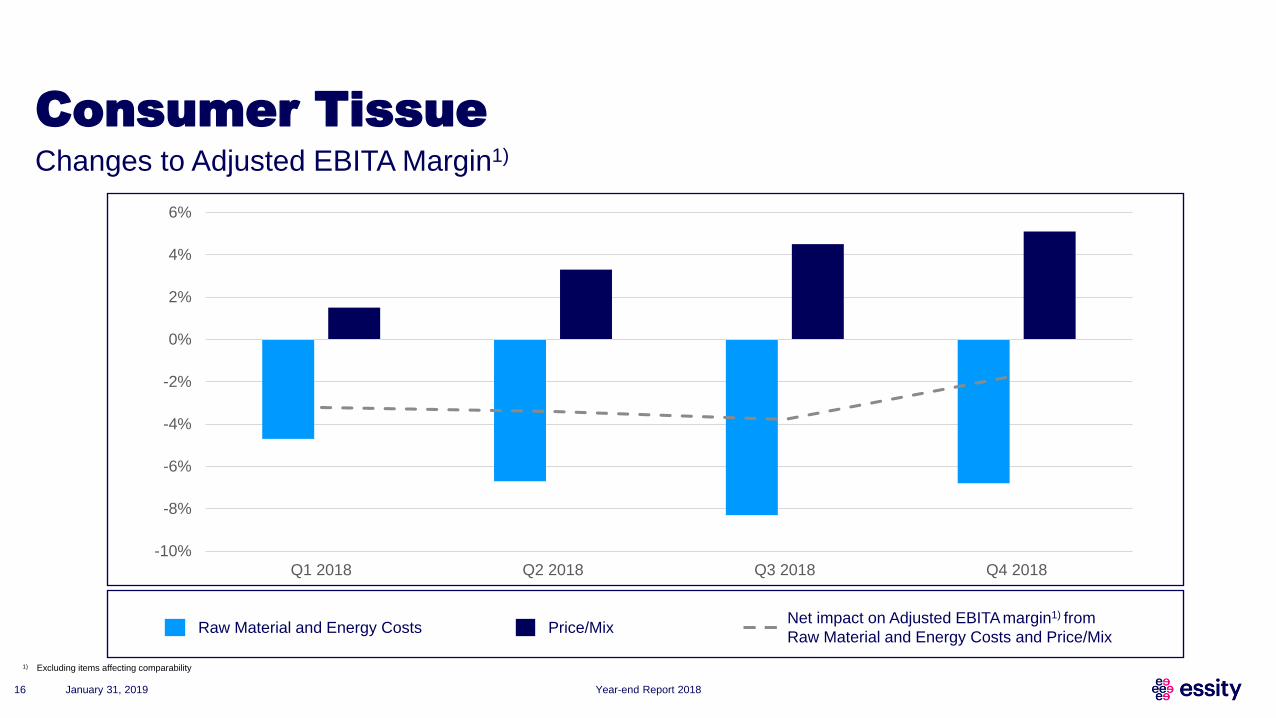
Consumer Tissue
-10%
-8%
-6%
-4%
-2%
0%
2%
4%
6%
Q1 2018 Q2 2018 Q3 2018 Q4 2018
Changes to Adjusted EBITA Margin1)
Year-end Report 2018January 31, 201916
Raw Material and Energy Costs Price/MixNet impact on Adjusted EBITA margin1) from
Raw Material and Energy Costs and Price/Mix
1) Excluding items affecting comparability
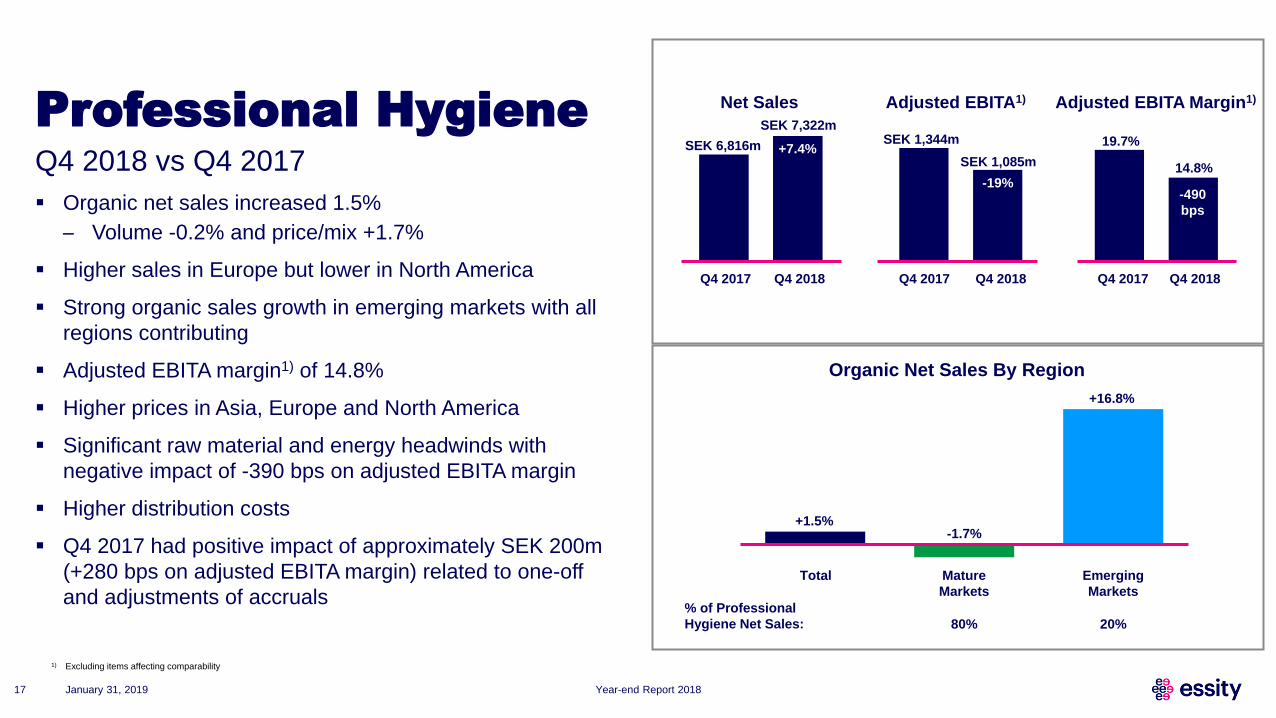
Professional Hygiene
▪ Organic net sales increased 1.5%
─ Volume -0.2% and price/mix +1.7%
▪ Higher sales in Europe but lower in North America
▪ Strong organic sales growth in emerging markets with all
regions contributing
▪ Adjusted EBITA margin1) of 14.8%
▪ Higher prices in Asia, Europe and North America
▪ Significant raw material and energy headwinds with
negative impact of -390 bps on adjusted EBITA margin
▪ Higher distribution costs
▪ Q4 2017 had positive impact of approximately SEK 200m
(+280 bps on adjusted EBITA margin) related to one-off
and adjustments of accruals
Q4 2018 vs Q4 2017
Year-end Report 2018January 31, 201917
Q4 2017 Q4 2018
SEK 7,322m
SEK 6,816m
Net Sales Adjusted EBITA1) Adjusted EBITA Margin1)
-19%
+7.4%
-490
bps
19.7%
14.8%
SEK 1,344m
SEK 1,085m
Q4 2017 Q4 2018 Q4 2017 Q4 2018 Q4 2017 Q4 2018
+1.5%-1.7%
% of Professional
Hygiene Net Sales:
+16.8%
Total Mature
Markets
Emerging
Markets
80% 20%
Organic Net Sales By Region
1) Excluding items affecting comparability

Priorities 2019
▪ Invest in our strong brands
▪ Innovations for people and nature
▪ Price increases
▪ Efficiency improvements
▪ Deliver on Group-wide cost-savings program
▪ Grow all high margin categories
▪ Accelerate the digital transformation
Year-end Report 2018January 31, 201918

Q&A
