reducing the fuel costs of small fishing boats - bobp/wp/27 · the fuel consumption performance of...
TRANSCRIPT


BAY OF BENGAL PROGRAMME BOBP/WP/27Development of Small-Scale Fisheries GCP RAS 040 SWE
REDUCING THE FUEL COSTS OF SMALL FISHING BOATS
by 0. GulbrandsenConsultant (Naval Architect),Bay of Bengal Programme
Executing Agency : Funding Agency
Food and Agriculture Organization Swedish Internationalof the United Nations Development Authority
Development of Small-Scale Fisheries in the Bay of Bengal. Madras, India, July 1986.Mailing Address : Post Bag 1054, Madras 600 018, India.Street Address 91 St. Mary’s Road, Abhiramapuram, Madras 600 018, IndiaCables : FOODAGRI Telex MS-311 FISH Phones 71294, 71296, 71587, 77760

The first part of this paper describes the principles of power requirements for smaTl fishing boatsand details ways of saving fuel which can be applied both with existing boats and new boats. Italso illustrates by example how to estimate the savings from measures to conserve fuel.
The second part of the paper describes fuel consumption trials carried out in Sri Lanka. Duringthe trials the two most common Sri Lankan boats — the 18 footer and 28 footer — were usedwith different engines, propellers and hull conditions, and actual fuel consumption was recorded.The fuel consumption performance of two BOBP craft — SRL-14 and SAL-iS — was testedin comparison with that of the standard 28-footer of Sri Lanka; the fuel performance of anotherBOBP craft, SRL-17, was compared with that of Sri Lanka’s standard 18-footer. The results ofthe trials confirmed the validity of the principles and fuel-saving recommendations describedin the first part.
The trials were conducted in 1982 at the request of the Ministry of Fisheries, Sri Lanka. A reportwas submitted to the Ministry soon after the trials.
This paper, and the trials it describes, are activities of the small-scale fisheries project of the Bayof Bengal Programme (BOBP). Begun in 1979, the project is funded by SIDA (the SwedishInternational DevelopmentAuthority) and executed by the FAO (Food and AgricultureOrganizationof the United Nations), and covers five countries bordering the Bay of Bengal—Bangladesh, India,Malaysia, Sri Lanka and Thailand. It is a multi-disciplinary project, active in fishing craft and gear,aquaculture and extension. The project’s main goals are to develop, demonstrate and promoteappropriate technologies and methodologies to improve the conditions of small-scale fisherfolkin the BOBP’s member countries.
This document is a working paper and has not been cleared either by the government concernedor by the FAO.
[iii]

CONTENTS
Page
Part I : Methods of fuel saving 1
1. Introduction 1
1.1 Alternative fuel saving measures 1
2. Main factors influencing fuel consumption 2
2.1 Speed 2
2.2 Hull design 3
2.3 Engine power and operating range 4
2.4 Reduction gear and propeller 6
2.5 Type of engine 6
2.6 Use of sail 7
2.7 Hull fouling 8
2.8 Engine maintenance 8
2.9 Mode of operation 8
Part II: Fuel consumption trials in Sri Lanka 9
1. Types of boats tested and measuring method 9
2. Results of trials 9
2.1 Outboard powered craft 9
2.2 Diesel powered craft 10
Figures1. Power-speed diagram 11
2. Estimated fuel consumption 12
3. Engine power and operating range 13
4. Minimum clearance:propeller/hull 14
5. Outboard kerosene engine versus inboard diesel engine 15
6. The IND-20B design with Gunter rig 16
7. 18 ft. Sri Lankan (5.5 m) boat 17
8. 28 ft. Sri Lankan (8.5 m) boat 18
9. Fuel consumption measuring device 19
10. 18 ft. boat and SRL-17 : fuel consumption per nautical mile 20
11. 28 ft. boat, SRL-14 and SRL-15: fuel consumption per nautical mile 21
12. 28 ft. boat with 30 hp engine fuel consumption per nautical mile
Appendices1. Cost comparison between outboard kerosene engine and diesel inboard
engine for a 18 ft. FRP boat in Sri Lanka 23
2. Main particulars of the boat tested 24
3. Fuel consumption data sheet 25
Publications of the Bay of Bengal Programme 26
iv

SUMMARY
The first part of this paper deals with the principles of power requirements for small boats (below12 m in length) and how they vary with speed, displacement, shape of hull, propellers, etc. Ninedifferent ways of saving fuel are identified which to a varying degree can be applied to new andexisting boats. Examples of how to estimate savings by the use of a standard diagram are given.
The most effective fuel saving measure is the selection of a low-powered engine, which also saveson capital investment, and reduces operating speed.
As a guideline it is suggested that the installed engine power should not exceed 5 hp(maximumcontinuous rating) per tonne (t) of displacement. The engine should be operated at 3 hp actualoutput per tonne at about 80% of maximum rev/mm.
It is also suggested that the best criterion for comparison is the fuel consumption per nautical mile,i.e., mileage. For a 8 m long boat with 3.5 t displacement the following fuel saving possibilitieswere estimated.
Fuel economy measures Approximatesaving
Speed reduction from 7 to 6 knots (kn) 37%
Longer hull from 8 to 10 m (by design) 23%
Lighter displacement from 3 to 2.5 t (by material) 19%
Increase engine gear reduction ratio from 2 to 4 14%Removal of barnacles from a badly fouled hull to 40%
Regular engine maintenance as compared to no maintenance up to 30%
From a case study of an 18 ft boat in Sri Lanka, it was also concluded that at 1985 prices, andwith 600 hours per year operation, the use of a small diesel inboard engine does not mean loweryearly costs than use of a kerosene outboard engine. Petrol outboard engines have 20% higheryearly costs. The advantage of a diesel engine becomes greater with increased operation time.
Two examples of the use of sail are given. The net gain will depend on the degree of utilizationof the sail and on the costs of sail and rig.
The second part of the paper is a summary record of fuel saving trials in Sri Lanka using two ofthe most common boats i.e., the 18-footer powered by 7-12 hp outboard kerosene engine andthe 28-footer (3.5 tonner) powered by 30 hp inboard diesel engine. In addition three new designs— SRL-14, SRL-15 and SRL-17 — have been tested to determine the potential for fuel saving.
The trials by and large confirm the general considerations in Part I.
For the 18 ft. outboard powered boat it was found that using the 7 hp instead of the 12 hp outboardengine reduces the fuel consumption per nautical mile by 29%.
The SRL-17 outrigger canoe with a 7 hp outboard engine has 25% lower fuel consumption thanthe 18 ft boat.
For the diesel powered boats — the 28 ft. boat and the new SRL-14 and SRL-15 — the fuel savingfrom reducing the speed fwm 7.5 to 6.5 kn ranges from 35 to 55%.
The new designs SRL-14 and SRL-15 with a 20 hp engine have, at a speed of 6.5 kn, between38 to 40% lower fuel consumption than the existing 28 ft boat with a 30 hp engine.
(vi)
Part I. Methods of Fuel Saving
1. INTRODUCTIONMechanized fishing is an energy consuming way of producing food. The construction andmaintenance of fishing boats and fishing gear requires some energy but between 80% and 90%of the total energy input is in the form of fuel for the propulsion machinery.
The amount of fuel required to catch one kilogram of fish depends very much on the fishing methodemployed. The table below illustrates the present situation in Scandinavia
Fishing method Kg of fuel needed to catchone kg of fish
Trawling 0.8Longlining and gillnetting 0.15 - 0.25
Purse Seining 0.07
Because of the high fuel consumption for trawlers, there has been considerable development towardsthe use of large reduction gears, large diameter propellers and nozzles to improve efficiency.
This paper outlines ways of reducing the fuel consumption of coastal fishing vessels below 12 m(40 ft) in k9ngth, using passive gear such as gillnets, longlmnes and handlines.
The first part of the paper gives background material and shows various principal approaches tofuel saving. The second part describes some investigations carried out on motorized fishing craftin Sri Lanka.
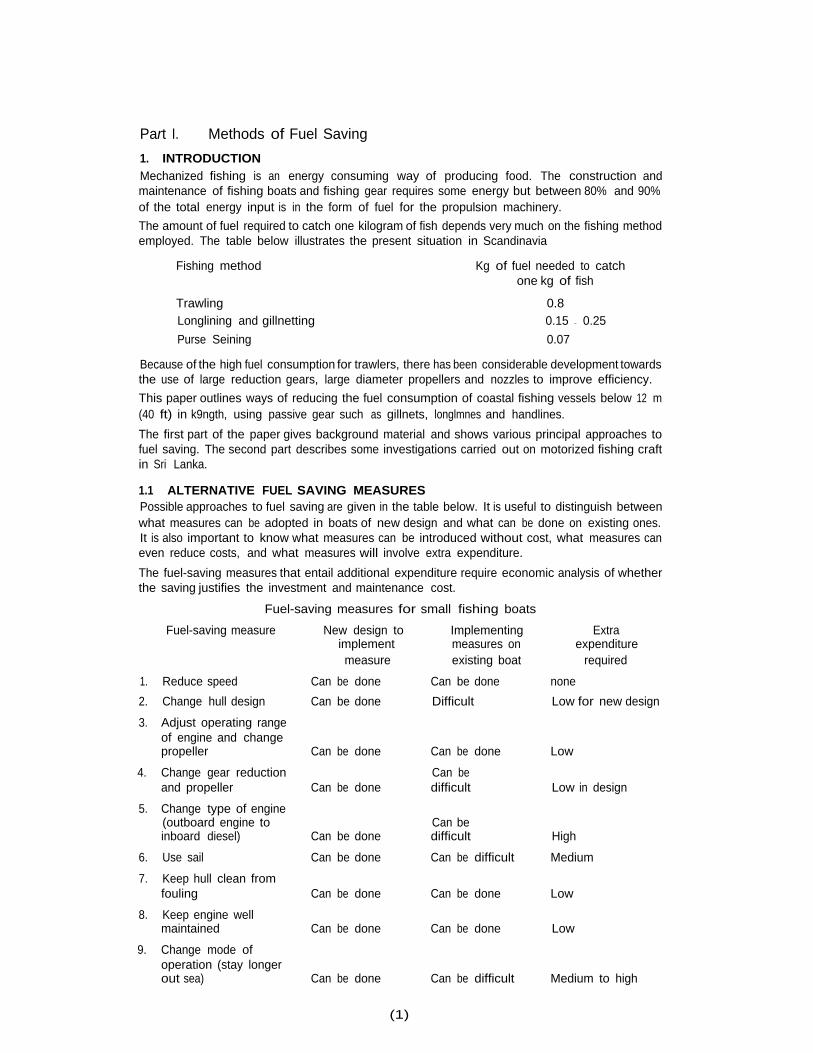
1.1 ALTERNATIVE FUEL SAVING MEASURESPossible approaches to fuel saving are given in the table below. It is useful to distinguish betweenwhat measures can be adopted in boats of new design and what can be done on existing ones.It is also important to know what measures can be introduced without cost, what measures caneven reduce costs, and what measures will involve extra expenditure.
The fuel-saving measures that entail additional expenditure require economic analysis of whetherthe saving justifies the investment and maintenance cost.
Fuel-saving measures for small fishing boats
Fuel-saving measure New design to Implementing Extraimplement measures on expendituremeasure existing boat required
1. Reduce speed Can be done Can be done none
2. Change hull design Can be done Difficult Low for new design
3. Adjust operating rangeof engine and changepropeller Can be done Can be done Low
4. Change gear reduction Can beand propeller Can be done difficult Low in design
5. Change type of engine(outboard engine to Can beinboard diesel) Can be done difficult High
6. Use sail Can be done Can be difficult Medium
7. Keep hull clean fromfouling Can be done Can be done Low
8. Keep engine wellmaintained Can be done Can be done Low
9. Change mode ofoperation (stay longerout sea) Can be done Can be difficult Medium to high
(1)

2. MAIN FACTORS INFLUENCING FUEL CONSUMPTION
2.1 Speed
The po..ver required to propel a boat is mainly a function of— Speed— Length of waterline— Displacement i.e. weight of the boat including crew, fishing gear, fish and ice.
The relationship is shown in Fig. 1 which is valid for boats with reasonably good hull shapes andfor average propulsion efficiencies. A simple graph cannot cover all types and shapes of boats,but plotting of actual performance data of fishing vessels has shown that Fig. 1 gives a good pictureof the relationship between the main parameters influencing the power.
The lower curve is for calm water and no fouling on the bottom. This curve corresponds to thetrial condition.
In service condition, however, the boat operates in waves and with some fouling on the bottom.This leads to an increase in power requirement. It is not possible to give exact figures for this powerincrease, but the upper curve gives an estimated average value. The use of Fig. 1 is best shownby an example
A boat has a waterline length of 8.0 m and a displacement in service condition of 3.5 t. Whatwill be the approximate power requirement and fuel consumption in service condition?
We first enter the lower graph along the line of LWL = 8.0 m until we meet the required speedand then go vertically upwards to the upper graph and read off the values for the hp per tonnedisplacement on the upper curve for service condition.
The values can be entered in a table as shown below
Fuel consumption
Speed in knots hp/t per tonne hp (Displ. = 3.5) I/h
5.0 1.9 6.7 1.75.5 2.3 8.0 2.06.0 3.0 10.5 2.66.5 4.0 14.0 3.57.0 5.5 19.2 4.87.5 7.2 25.2 6.3
The fuel consumption in litres (I) per hour (h) is calculated by assuming that the engine burns 0.25I/h of fuel for each hp it develops. This figure actually varies with the engine rpm and the propellerselected, but 0.25 I/hp/h is close enough for estimation. The result is plotted in Fig. 2.
With the above table it is possible to find what effect the speed has on fuel consumption. Wecan for example find out what saving in fuel will be possible by reducing the service speed from7.0 knots (kn) to 6.0 kn. and 5.0 kn.
Fuel consumptionSpeed in kn
I/h I/n mile
5.0 1.7 0.346.0 2.6 0.437.0 4.8 0.69
When reducing the speed from 7.0 kn to 6.0 kn, the saving in fuel consumption is (4.8 — 2.6)= 2.2 I/h. This is a saving of (2.2/4.8) x 100 = 46%. But this is not the true fuel saving. Witha speed of 7 kn, we will be able to travel 7 n miles in one hour while with a speed of 6 kn only6 n miles will be covered. To get the true fuel saving we therefore have to find out how muchfuel is consumed for one n mile travelled expressed in litres per nautical mile (I/n mile). This isfound by dividing the fuel consumption in litres per hour with the number of n miles travelled in
(2)

one hour which is the same as the speed expressed in knots. This is shown in the last columnin the example above. The true fuel saving is therefore
0.69 I/n mile — 0.43 I/n mile = 0.26 I/n mile — which is a saving of (0.26/0.69) x 100 = 37%.
The true fuel saving is therefore 37% and not 46% as found by considering only fuel consumptionin litres per hour.
From the above example it is clear that there is a good potential for fuel saving by reducing thespeed. Slower speed means that it takes longer to cover a certain distance. Will the saving in fuelbe worth the extra time? This can only be answered by a case study.
Example : The boat in the previous example has to travel daily to a fishing ground situated 20n miles from the harbour. (Total daily distance = 40 n miles). What will be the fuel saving andextra daily time required with alternative speeds? The fuel cost is 0.35 $/1.
Speed Fuel consumption Fuel cost Fuel cost Travelling time(kn) (I/n. mile) 1$/n mile) per day per day
($) (h)
5.0 0.34 0.12 4.80 8.06.0 0.43 0.15 6.00 6.7
7.0 0.69 0.24 9.60 5.7
We will now consider two alternatives for saving fuel
Fuel saving per day Extra time per day(US$) (h)
Step 1: Reduce speed from 7.0 kn to 6.0 kn 3.60 1.0Step 2: Reduce speed from 6.0 kn to 5.0 kn 1.20 1.3
We have to consider whether in Step 1 the extra hour spent travelling is worth the $ 3.60 in fuelsaving. By reducing the speed down to 5.0 knots, as in Step 2, it is possible to further increasethe saving by $ 1.20 but we have to spend 1 hour and 20 minutes more at sea than in Step 1.We therefore have to consider how much the extra time spent travelling is worth, compared withwhat we save.
2.2 Hull design
Fig. 1 shows that reduction in power can be achieved by
— Increasing the length of the waterline (LWL)
— Reducing the displacement.
Increasing the length of the waterline while keeping other dimensions the same, will also makeit possible to obtain a sharper bow and thereby reduce the resistance. Although the weight ofthe boat itself is increased by the greater length, the overall effect on the hull resistance is beneficial.The limiting factor is the cost increase of the hull which must be balanced against thefuel saving.There has been a trend over the last 20-30 years towards beamy vessels with a blunt bow coupledwith a large increase in engine power.
Trials in Norway and Denmark have shown a 15% to 25% reduction in resistance by fitting a sharperbow and increasing waterline length on existing vessels.
(3)

Example:
A boat has the following characteristics
Length of waterline = 8.0 m
Displacement = 3.5 t
Weight of hull excluding engine = 2.0 t
Service speed = 6.5 kn
What would be the saving in fuel keeping the beam and depth the same, but increasing the lengthof waterline to 10.0 m?
Weight of 10.0 m hull = 2.0 t x (10.0/8.0) = 2.5 t
Displacement of 10.0 m hull = 2.5 + 1.5 = 4.0 t
From Fig. 1, at a service speed of 6.5 kn
Length ofDisplacement Power Fuel saving
waterline(m) (hp/t) (t) (hp) (%)
8.0 4.0 3.5 14.0 —
10.0 2.7 4.0 10.8 23%
If a 8.0 m boat spends $ 1,000 on fuel yearly, the saving in fuel with the 10.0 m hull would be$ 230. This saving has to be balanced against the increased construction cost. The 8.0 m hull costsUS $ 4,000. The 10.0 m hull will cost approximately $ 4,000 x (10.0/8.0) = $ 5,000.
The increase in the investment is $1,000. The yearly fuel saving of $230 gives a return on theinvestment of (230/1000) x 100 = 23%. In this case the longerhull would be a reasonablygoodinvestment.
Reduction in displacementwould contribute to a lower fuel consumption. Hulls built of aluminium,FRP and plywood will be lighter than those built of steel, ferro-cement or conventional wood plankconstruction.
Example:
What would be the fuel saving if the hull weight of the 8m boat given in the example above was
reduced from 2.0 t to 1.5 t and hp/t = 4.0?
Hull Weight Displacement Power at 6.5 kn Fuel Saving(t) (t) (hp) (%)
Old hull 2.0 3.5 14.0 0New hull 1.5 3.0 12.0 14
The monetary advantage of the fuel saving might be absorbed by the higher construction costof the new hull, but lower maintenance cost and longer service life are also factors that have tobe considered
The real saving in weight can only be determined in each particular case. The lower hull weightmight lead to more uncomfortable movements when the sea is rough. It is quite common, for thisreason, to put concrete ballasts in fishing boats made of FRP in which case there may be no weightsaving.
2.3 Engine power and operating range
From Fig. 1 we had found that a service speed of 6 kn and a waterline length of 8.0 m wouldrequire 3.0 hp/t displacement or 10.5 hp for a displacement of 3.5 t. Obviously it would not be wiseto go and buy an 11 hp engine and run it at full throttle. A power margin is necessary. The questionis : How big should the power margin be?
First of all, when talking about engine power we must be sure in what way the engine manufacturerhas measured the power. For fishing boats we are only interested in continuous power; that is
(4)

what the engine can deliver for an unlimited time. This should be clearly marked on the enginepower curve shown in the manufacturers’ leaflet. A common standard is DIN 6270 “A” for heavyduty commercial application. The DIN 6270 “B” standard is for light duty pleasure boats and gives10% more power than the “A” rating. Since customers are used to comparing “horsepower”,many manufacturers use the “B”rating when selling engines. A 20 hp engine would then only give18 hp continuous power.
In a tropical climate with high humidity and temperature, a 6% reduction in power output shouldbe assumed from the manufacturer’s claim. With loss in shaft bearing, available power at thepropeller is about 10% lower than is shown in the manufacturers’ leaflet for continuous duty.
An internal combustion engine does not operate at peak efficiency throughout the whole rangeof rev/mm and power output. From the specific fuel consumption curve, which shows how muchfuel is burned foreach hp developed (usually given in g/hp/h), we will see that most engines havea minimum specific fuel consumption in the range 70-80% of maximum rev/mm (see Fig. 3). Thisis where the engine is burning the fuel most efficiently, and should be selected as the operatingrange in service condition.
Figure 3 shows that the propeller should be designed to allow the engine to operate in the areaof the lowest specific fuel consumption. The propeller should in service condition absorb 60% ofmaximum power (DIN 6370 “A”) and at an engine rev/mm close to the minimum point on thespecific fuel consumption curve, which isoften about 80% of maximum continuous rev! mm. Thepropeller demand curve “A” satisfies this criteria. This means that when the power to maintainservice speed has been determined from Figure 1, we need to install an engine of 1.6 to 1.7 timesthis power when rated to DIN 6270 “A”. The propeller designed for 60% power and 80% rev/mmcurve “A” in Fig. 3 will not allow the engine to reach full rev/mm, but it will achieve maximumfuel economy in service condition.
If a propeller is selected to absorb 100% of continuous power at 100% rev/mm (Curve “B” inFig. 3), the propellerwill not allow the engine to operate in the optimum specific fuel consumptionarea in service condition. The specific fuel consumption might be 5-7% higher as shown on thelower curve and the propeller efficiency reduced because the propeller. is turning at a higher rev/mm.
Example: A boat has a waterline length of 8.0 m and a displacement of 3.5 t. The service speedshould be 6.0 kn. What size of engine is required to achieve this speed?
From Fig. 1:
hp/t = 3.0
hp = 3.0 x 3.5 t = 10.5 hp.
An engine of about 1.6 to 1 .7 times this power needs to be selected if the manufacturers’ ratingis DIN 6270 “A”, that is about 17 to 18 hp continuous duty.
After a market survey, an engine developing 18 hp at maximum 2600 rev/mm, with a 3 : 1 reduc-tion gear, is selected. Theengine should be run in service condition at 2600 x 0.80 = 2100 rev/mm.
The propeller will turn at 700 rev/mm.
The propeller should be designed to absorb 10.5 hp at 700 rev/mm for a vessel speed of 6.0 knor a propeller advance speed of 5.4 kn.The important decision regarding engine power is often based on the urge to go a bit faster thanother fishermen. The justification is sometimes the need to be first back to the market to obtainthe highest price for the fish. The effect has been the same in all fishing countries : an escalationof engine power and a corresponding increase in costs which have hurt first of all the fishermenthemselves. Governments could by regulation or through subsidy and credit schemes limit the sizeof engine that can be used on a particular boat and in this way prevent waste.
As a guideline for economical powering of small fishing vessels except trawlers, one should notinstall engines larger than 5 hp/t displacement (continuousduty DIN 6270 “A”). The engines shouldbe operated in service condition at about 3 hp per tonne actual outputat about 80% of maximumrev/mm. -
(5)
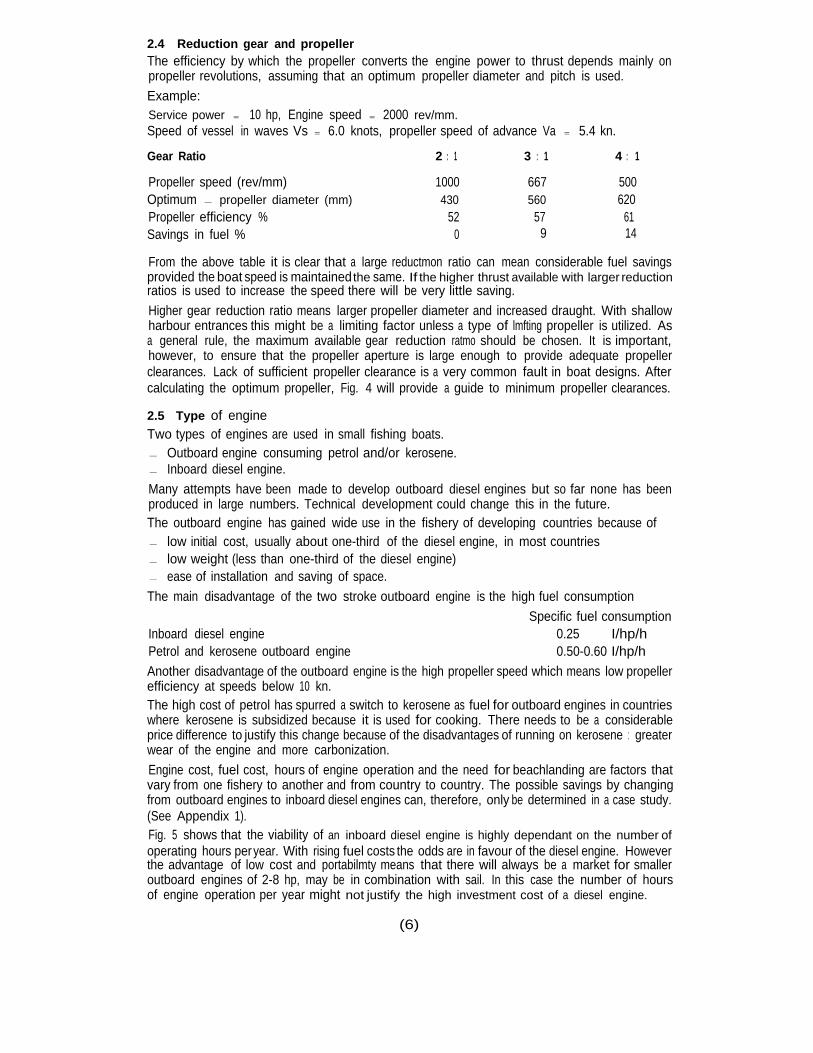
2.4 Reduction gear and propellerThe efficiency by which the propeller converts the engine power to thrust depends mainly onpropeller revolutions, assuming that an optimum propeller diameter and pitch is used.
Example:Service power = 10 hp, Engine speed = 2000 rev/mm.Speed of vessel in waves Vs = 6.0 knots, propeller speed of advance Va = 5.4 kn.
Gear Ratio 2 : 1 3 : 1 4 : 1
Propeller speed (rev/mm) 1000 667 500Optimum — propeller diameter (mm) 430 560 620Propeller efficiency % 52 57 61Savings in fuel % 0 9 14
From the above table it is clear that a large reductmon ratio can mean considerable fuel savingsprovided the boat speed is maintainedthe same. If the higher thrust available with larger reductionratios is used to increase the speed there will be very little saving.
Higher gear reduction ratio means larger propeller diameter and increased draught. With shallowharbour entrances this might be a limiting factor unless a type of lmfting propeller is utilized. Asa general rule, the maximum available gear reduction ratmo should be chosen. It is important,however, to ensure that the propeller aperture is large enough to provide adequate propellerclearances. Lack of sufficient propeller clearance is a very common fault in boat designs. Aftercalculating the optimum propeller, Fig. 4 will provide a guide to minimum propeller clearances.
2.5 Type of engineTwo types of engines are used in small fishing boats.— Outboard engine consuming petrol and/or kerosene.— Inboard diesel engine.
Many attempts have been made to develop outboard diesel engines but so far none has beenproduced in large numbers. Technical development could change this in the future.The outboard engine has gained wide use in the fishery of developing countries because of— low initial cost, usually about one-third of the diesel engine, in most countries— low weight (less than one-third of the diesel engine)— ease of installation and saving of space.
The main disadvantage of the two stroke outboard engine is the high fuel consumption
Specific fuel consumptionInboard diesel engine 0.25 I/hp/hPetrol and kerosene outboard engine 0.50-0.60 I/hp/h
Another disadvantage of the outboard engine is the high propeller speed which means low propellerefficiency at speeds below 10 kn.The high cost of petrol has spurred a switch to kerosene as fuel for outboard engines in countrieswhere kerosene is subsidized because it is used for cooking. There needs to be a considerableprice difference to justify this change because of the disadvantages of running on kerosene : greaterwear of the engine and more carbonization.
Engine cost, fuel cost, hours of engine operation and the need for beachlanding are factors thatvary from one fishery to another and from country to country. The possible savings by changingfrom outboard engines to inboard diesel engines can, therefore, only be determined in a case study.(See Appendix 1).Fig. 5 shows that the viability of an inboard diesel engine is highly dependant on the number ofoperating hours peryear. With rising fuel costs the odds are in favour of the diesel engine. Howeverthe advantage of low cost and portabilmty means that there will always be a market for smalleroutboard engines of 2-8 hp, may be in combination with sail. In this case the number of hoursof engine operation per year might not justify the high investment cost of a diesel engine.
(6)

2.6 Use of sailWhen considering the use of sail for fuel saving on a fishing boat, the following factors need tobe taken into account— The use of sail depends on satisfactory stabilityof the boat. The Righting Moment at a heeling
angle of 30 degrees is often used by Naval Architects as a criterion to determine the maximumallowable sail area. Ballast will often be required to permit a sufficmently large sail area to becarried. The weight of ballast increases resistance and thereby fuel consumption when underpower.
— Windward ability depends on a deep and effective keel area. The increased draught causesproblems in shallow areas.
— Windward ability requires sails set on a high mast to be effective. The wire rigging often interfereswith the fishing operation. The wind resistance of mast and rigging will increase fuel consumptionwhen under power in a head wind.
— Only a case by case study will determine whether the cost of the sail and rigging is justifiedby the saving in fuel. The critical factor is the motivation of the fishermen for the use of sail.
Example:A boat with a displacement of 3.5 t has a fuel cost per year of $ 1,000. The boat is to be fittedwith a sail rig with the following investment cost and yearly capital cost
Investment cost Service life Yearly capital costat 15% interest
$ (yr) $
Mast and standing rig 500 10 100
Sails and running rig 300 4 105
Ballast 100 10 20
Total 900 225
The Naval Architect determines on the basis of stability data that a ballast of one tonne is requiredto make the boat safe under sail. The ballast keel increases the displacement from 3.5 to 4.5 t
and the corresponding increase in fuel consumption can be estimated as roughly proportionalwith the displacement. Assuming that the engine is used 60% of the time without sails, the increasein fuel consumption = $ 1,000 x 0.6 x 4.5/3.5 = $ 77.00.
Total yearly cost is therefore $ 302 which corresponds to 30% of the yearly fuel cost of the boatwithout sail and ballast. This means that to make sense economically the sails must be used atleast 30% of the time with the engine stopped or 60% of the time with engine running at the halfpower, to justify the investment. This is probably unlikely to be achieved in practice.
Small fishing boats do not necessarily need extra ballast if heavy fishing gear such as large meshdriftnets are stored low in the hull and the crew can act as “live ballast” to increase the rightingmoment. The cost of the sailing rig can be kept low by making mast and spars of timber, grownlocally.
Example:A beachlanding boat in India of 8.5 m LOA and a displacement of 1.6 t was fitted with a sail areaof 26 m2 (see Fig. 6). The boat is fishing with large mesh driftnets. The driftnets weigh 600 kgand are stowed low in the hull.
The cost of the sailing equipment including lee board, rudder, mast and cotton sails was $ 250in 1983. The boat is fitted with an engine of 8 hp consuming about 1.5 I of fuel, at a service speedof 6 kn. Yearly capital cost of the sail rig is calculated in the same way as in the above exampleto $ 75. With a fuel price of 0.30 s/I, the cost of the sailing rig would be covered in 170 h of sailingper year with the engine stopped. This is 17% of the total travelling time per year (1000 h) andthe sail rig in this case seems well justified.
If sail is used as the main propulsion, one can reduce the size of the engine to what is requiredfor manoeuvring in and out of harbours and on the fishing ground, and on days with unfavourable
(7)

wind. The minimum speed satisfactory for this purpose is about 5.0 kn and a relatively small enginewould provide this speed. Based on Figure 1 we find that a boat with 8 m waterline length and3.5 t displacement will require 6.5 hp to achieve a service speed of 5 kn. If an engine of around11.00 hp is installed, it would considerably bring down investment cost, compared with the 16-18hp engine necessary if only engine were to be used. The fishermen must however be willing toaccept the slower speed compared with a “normal” powered boat when going against wind andwaves. In countries with a living tradition in the use of sails, the low powered fishing boat withefficient sails could be an attractive alternative. Another case is when fuel and spare parts are inshort supply; a sailing boat will then be able to continue fishing.
Sail is often necessary as a safety measure in case of engine breakdown. In this case a simpledipping lug rig will be satisfactory.
2.7 Hull foulingThe rate of fouling depends on local conditions and temperature. In the tropmcs the increase insurface friction due to fouling has been estimated to be between 0.6% and 1.5% per day. Assuminga figure of 0.7% per day as average and that the friction resistance is about 35% of the totalresistance at the normal operating speed of fishing vessels, the effect on fuel consumption willbe as follows
Period of fouling Increase in fuel consumption
1.month 7%6 months 44%12 months 88%
From the above figures it is clear that hull fouling can mean a substantial increase in fuel consumptionif no anti-fouling paint/s used or if the boat is not taken out of the water for removal of barnaclesand shells at intervals of 1 to 2 months. If this is not done, the extra cost in fuel can be considerablymore than the cost of the anti-fouling paint.
2.8 Engine maintenanceThe loss in efficiency of a badly maintained engine can be as high as 30%. To prevent this it isnecessary to clean or replace injectors regularly and perform oil changes at intervals recommendedby the engine manufacturer. With fuel contaminated by dirt and water, there is a need to installan extra fuel filter and water separator between the fuel tank and the engine.
2.9 Mode of operationInstead of travelling daily to the fishing ground and back again, it is possible to save fuel by stayingseveral days on the fishing ground. This will necessitate better crew accommodation, cookingfacilities and an insulated fish hold — this will again normally require a larger boat. The cost/benefitof this can only be determined through a case study.
(8)

Part II. Fuel Consumption Trials in Sri Lanka
1. TYPES OF BOATS TESTED AND MEASURING METHODTwo types of fishing vessels are used in large numbers in Sri Lankan fishery
The 18 ft (5.5 m) outboard powered boat is shown in Fig. 7. About 6,000 were in operation in1983. All are built in FRP. They are powered with 7 hp and 12-15 hp kerosene outboard enginesand mainly utilized for small mesh gillnetting within 10 n miles from the shore. The crew usuallyconsists of two men.
The 28 ft (8.5 m) inboard powered boat is shown in Fig. 8. It is originally a wooden boat of FAOdesign, introduced in 1958. Nearly 3,000 were operational in 1983, mainly built of FRP. The boatsare generally powered with a diesel engine developing 30 hp at 2200 rev/mm. The installed poweris 9 hp/t which is almost twice what was recommended in Section 2.3. Originally a 16 hp enginewas installed in these boats but general power escalation over the years has led to the 30 hp enginepresently used.
This boat is used for overnight fishing, mainly with large mesh driftnets up to 30 n miles from theshore. It has a crew of 4 men.
In addition to the two established types of boats used in the Sri Lakan fishery, three new boattypes which have been developed by the FAO-BOBP project were tested
SRL- 14 Designed to do the same large mesh driftnet fishery as the standard 28 ft boat, but withthe capability of surflanding on beaches. Main changes compared with the 28 ft boat are an engineof 20 hp at 2,500 rev/mm with a gearbox of 3.65 : 1 reduction. The engine is fitted in a pivotingbox which permits retraction of propeller and rudder for landing on the beach.
SRL-15 Harbour-based boat with the same 20 hp engine and gearbox as the SRL-14 but with astretched hull to permit an icehold and crew accommodation for fishing trips of a few days dura-tion. The bow is sharper than so far common on fishing boats of this size.
SRL-17 Single outrigger canoe as a fuel-efficient alternative to the 18 ft outboard powered boats.The idea is based on the local type of outrigger canoe, but with better shape for use with an out-board engine and with a good sail performance.
Further details about the boats tested are given Appendix 2.
Measuring methods: Trials were conducted in calm water inside the break water in the port ofColombo. Vessel speed was measured by an electronic trailing log, care being taken to reduceas far as possible any inaccuracies arising from the effects of propeller slip stream and the wakeof the boat by towing the trailing log from a pole lashed across the forward part of the boat tokeep the impeller clear of the bow wave system.
Fuel consumption was measured by taking the time, with a stopwatch, for the level of the fuelin an auxiliary glass tank to fall from one mark to another; the volume between the marks was100 cc; (see Fig. 9). The fuel injector return flow was collected in a measuring cylinder and thedifference gave the fuel actually burnt in the engine in the measured time. Engine speed (rev/mm)was measured in the case of inboard engines by applying a revolution counter to the flywheel andfor outboard engines by a vibration tachometer. The data was entered in a recording sheet (Ap-pendix 3).
2. RESULTS OF TRIALS
2.1 Outboard powered craftThe 18-footer and the SRL-17 were tested with the same loading of 400 kg and the same engines,a YAMAHA 8BK developing 7 hp when operated on kerosene and a YAMAHA 15AK developing 12hp on kerosene. Fig. 10 shows the fuel consumption in I/n mile. The following conclusions canbe drawn regarding operation in calm water
— Using a 7 hp outboard instead of the 12 hp outboard and operating at 6.0 kn instead of 9.0kn with the 18 ft boat, reduces the fuel consumption from 0.73 I/n mile to 0.52 I/n mile ora saving of 29% besides the saving in investment. At 6.0 kn speed 33% more time is requiredto go a certain distance.
(9)

— The SRL-17 outrigger canoe with the 7 hp engine has 25% lower fuel consumption than the18 ft boat at a speed of 6.0 kn.
— The SRL-17 outrigger canoe with the 12 hp engine has 33% lower fuel consumption than the18 ft boat at a speed of 9.0 kn.
2.2 Diesel powered craftThe results have been plotted in Fig. 11. The following conclusions can be made for trial conditioncalm water, low wind speed, no waves and a clean underwater hull.— Reducing the speed from 7.5 kn to 6.5 kn gives the following fuel savings:
28 ft boat 40%
SRL-14 55%SRL-15 35%
The conclusion is that speed reduction is the most effective way of saving fuel.— At a speed of 6.5 kn the SRL-14 has a fuel saving of 38% and the SRL-15 a fuel saving of
40% compared with the existing 28 ft boat. The reasons for the better performance are givenbelow.
— To achieve a speed in trial condition of around 6.5 kn, only about 9 hp is required. The 30 hpengine fitted in the 28 ft boat has a poor fuel efficiency when operated at only 9 hp output.The 28 ft boat has been fitted with a “heavy” propeller that gives 1,850 rev/mm at full throttle(maximum rated speed = 2,200 rev/mm). If a “lighter” propeller (smaller diameter and pitch)is fitted to allow 2,200 rev/mm, the efficiency at an output of 9 hp would be even lower. Inaddition, the 30 hp engine on the 28 ft boat is an old model with a high specific fuel consumption.The 20 hp engines fitted in SRL-14 and SRL-15 operate closer to their optimum range at anoutput of 9 hp. Using the principles outlined in section 2.3, an engine of maximum continuousduty of 15 hp to 18 hp would have been sufficient when operated at a service output of 9 hpand at a rev/mm of 80% of continuous rating. Engine selection will, however, have to be adjustedto what is available in the market.
— The engines of the SRL-14 and SRL-15 are fitted with a gearbox of 3.65 reduction comparedwith 2.13 for the 28 ft boat. At 6.5 kn the propeller of the new designs turn at 415 rev/mmwith a propeller efficiency of 66%, while the propeller of the 28 ft boat has an efficiency of58%. This gives a fuel saving of 12%. The new designs also have a better fairing of the skegin front of the propeller, giving a better flow of water into the propeller.
— The SRL-15 has a longer waterline length and a sharper bow than the 28 ft boat which givesa marked fuel saving for speeds above 7.0 kn.
The fuel consumption figures are for trial condition — that is with no waves and wind. This isnecessary to get comparable results with different boats. For service condition, as is experiencednormally with waves and wind and some fouling, the fuel consumption will increase. To add acertain percentage to the fuel consumption figures through the whole speed range underestimatesthe effect of wind and waves at lower speed. It is better to assume a certain increase per tonnedisplacement at different speeds as is done in Fig. 1. If the same values are used we will get thefollowing increases in fuel consumption with a displacement of 3.2 t
Increases due to waves and wind in service conditionSpeed (kn) hp/t hp I/h
5 1.0 3.2 0.806 1.2 3.8 0.957 1.5 4.8 1.20
The figures for fuel consumption have been added to the trial condition figures in Fig. 12 to producea curve for fuel consumption in service condition.Since wind and waves have a proportionally bigger effect at lower speed, the fuel saving expressedin per cent when reducing speed will be lower than for trial condition. When the speed is reducedfrom 7.5 to 6.5 kn, the saving which was 40% in trial condition is reduced to about 32% in servicecondition. Reduction in service speed however still remains the best bet for fuel saving.
(10)

Figure 1POWER- SPEED DIAGRAM
(11)
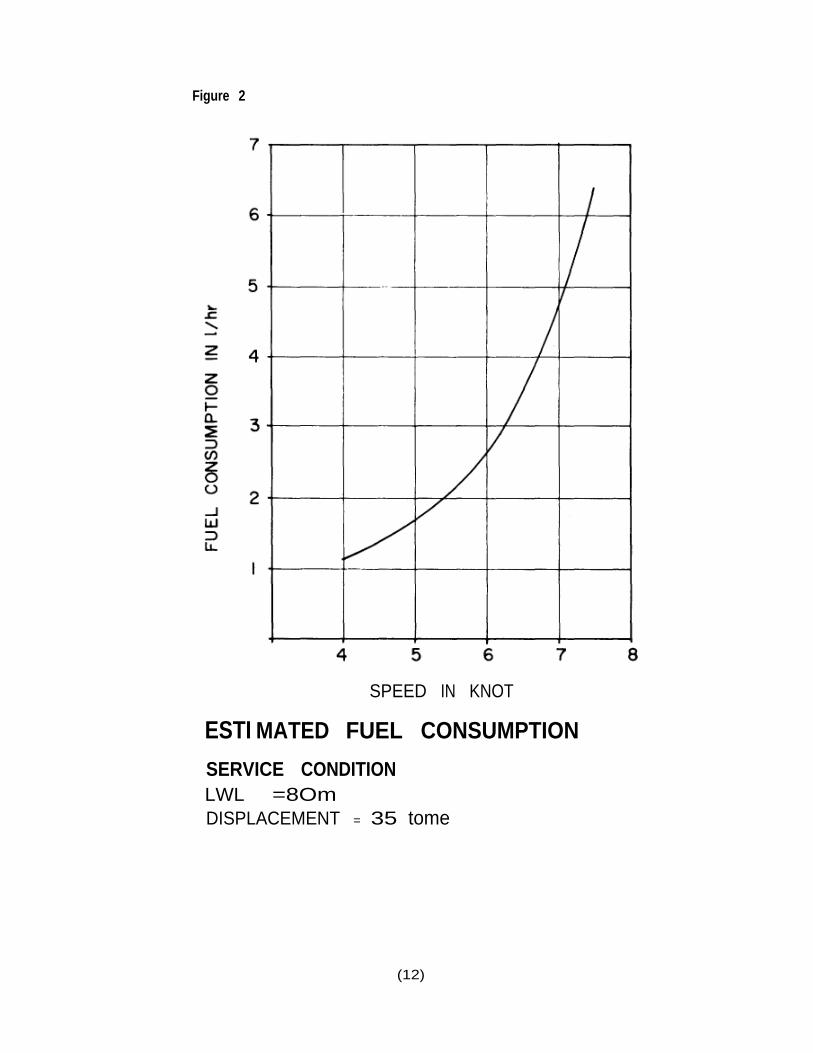
Figure 2
SPEED IN KNOT
ESTI MATED FUEL CONSUMPTION
SERVICE CONDITIONLWL =8OmDISPLACEMENT = 35 tome
(12)

ENGINE POWER AND OPERATING RANGE
Figure 3
(13)

Figure 4
a 017 x Dpb 0.05 x Dp
O•17 x Dpd = 0.27 xx Dp
M INIMUM CLEARANCE:PROPELLER / HULL
(14)

Figure 5
OPERATING HOURS/YEAR
OUTBOARD KEROSENE ENGINE vs DIESEL ENGINEFor basic data see Appendix I
(15)

Figure 6THE IND-20B DESIGN WITH GUNTER RIG
(16)

Figure 718 FT. SRI LANKAN (5.5 m) BOAT
(17)

Figure 828 FT. SRI LANKAN (8.5 m) BOAT
(18)

Figure 9
Measuring devicemust be fittedbelow fuel tankAlternatively, aseparate tank must beused during trials
Return flow frominjectors .o fuel tankmust be measuredin a separate glassgraduated to 10 ml,the volume ofreturn flow measuredat the same time andsubtracted from the100 ml for obtainingcorrect consumption.
FUEL CONSUMPTION MEASURING DEVICEFor enQines UD to 30 HP
Position of 3-way valve
(19)

Figure 10
OUTBOARD ENGINES YAMAHA 8 BK KEROSENE
LOAD
PROPELLER :
YAMAHA I5AK KEROSENEPROPELLER
400 Kg. (Same in both boats)Calm condition
18 FT.BOAT AND SRLI7:NAUTICAL MILE
SPEED IN KNOTS
FUEL CONSUMPTION PER
(20)

Figure 11
28 FT. BOAT, SRL-14 AND SRL-15:FUEL CONSUMPTION PER NAUTICAL MILE
Load :1300 kg.(4Onetsi-8 men)
(21)

28 FT. BOAT WITH 3OHP ENGINEFUEL CONSUMPTION PER NAUTICAL MILE
LOAD 1300 Kg. (4ONETS + 8 MEN)
(22)
Figure 12

Appendix 1
COST COMPARISON BETWEEN OUTBOARD ENGINEAND DIESEL INBOARD ENGINE FOR A 18 FT. FRP BOAT IN SRI LANKA
The outboard powered boat is shown in Fig. 7. The outboard engine is a kerosene engine startingon petrol developing maximum 7 hp at 5000 rev/mm.
The trial data in Fig. 10 show that this boat has a fuel consumption of about 2.60 I/h at a cruising speedof 5.5 kn. A diesel engine developing about 4 hp in service condition will give the same speed.An engine around 6 hp continuous power needs to be installed. Fuel prices (per litre) in Sri Lankaare (Dec. 1985)
Petrol US $ 0.50
Kerosene $ 0.27
Diesel $ 0.34
Lubricating oil $ 1.20
Fuel costs (per litre) for the different engines are
Outboard petrol
Outboard kerosene
Diesel
(Oil/petrol = 1/50) =$ 0.51
(Oil/kerosene = 1/30)=$ 0.31
(Oil/diesel = 1/130) =$ 0.35
inboard diesel engineCost comparison : Outboard engine versuscompared at the same speed = 5.5 kn
Outboard InboardPetrol Kerosene Diesel
Weight of engine includinginstallation (kg) 27 27 100
Fuel consumption (I/h) 2.50 2.60 1.00
1. Fuel cost per litre includingoil ($/l) 0.51 0.31 0.35
2. Fuel cost per hour ($/h) 1.28 0.81 0.46
3. Running time per year (hI 600 600 600
4. Fuel cost per year ($) 768 486 275
Cost of Capital:
5. Initial cost ($) 600 700 2,000
6. Life of engine (yr) 2.5 2.5 5
7. Annuity factor at 15% interest 0.50 0.50 0.30
8. Capital cost per year ($) 300 250 600
9. Yearly cost of engine (4 + 8) ($1 1068 836 875
The conclusion in the case study above is that the petrol driven outboard engine is about 20%higher in yearly cost than the other alternatives.
With only 600 hours’ operation per year, the diesel installation is not economically any better thanthe kerosene outboard engine. In addition there is the disadvantage of the high investment cost,the deep keel and increased weight when hauling the boat up the beach. This conclusion is basedon present fuel prices and an estimated 600 hours of engine operation per year. As the numberof hours of engine operation increases, the diesel engine becomes more attractive, as shown inFig. 5.
(23)

Appendix 2
MAIN PARTICULARS OF BOATS TESTED
Outboard powered Diesel powered
18 ft. SRL-17 28 ft. SRL-14 SRL-15
Length over all LOA (ml 5.4 8.0 8.75 8.60 9.65
Beam moulded B (ml 1.75 0.9 2.60 2.62 2.67
Depth, rabbet to top of sheer 0 (ml 0.75 0.85 1.43 1.10 1.25
Cubic number to top of sheerCUNO = LOA x B x 0 (m3) 7 6 32 25 32
Length waterline (ml 4.90 7.40 7.60 8.15 9.00
Beam waterline (m) 1.50 0.64 2.30 2.40 2.60
Draft (ml 0.30 0.30 0.76 0.4/0.6’ 1.00
Displacement light It) 0.3 0.5 1.9 1.6 2.1
Load (t) 0.4 0.4 1.3 1.3 1.3
Displacement loaded It) 0.7 0.9 3.2 2.9 3.4
Engine model Yamaha Yamaha Yanmar Faryman Faryman
Maximum continuous hp/rpm 8 BK 7/5000 8 BK 7/5000
Maximum continuous hp/rpm 15 AK 12/5000 15 AK 12/5000 30/2200 20/2500 20/2500
hp/t 8 BK-10; 8 BK-7.8 9.0 6.9 5.9
15 AK-17 15 AK-13.3Reduction gear 2.08 2.08 2.13 3.65 3.65
Propeller 7 hp — 230 7 lip — 230 580 610 640
Diameter (mm) 12 hp — 248 12 lip — 248
Propeller 7 hp — 146 7 lip — 146 330 410 450
Pitch (mm) 12 hp — 203 12 lip —203
excluding volume of outrigger.
stern gear of pivoting engine installation in “down” position.
(24)
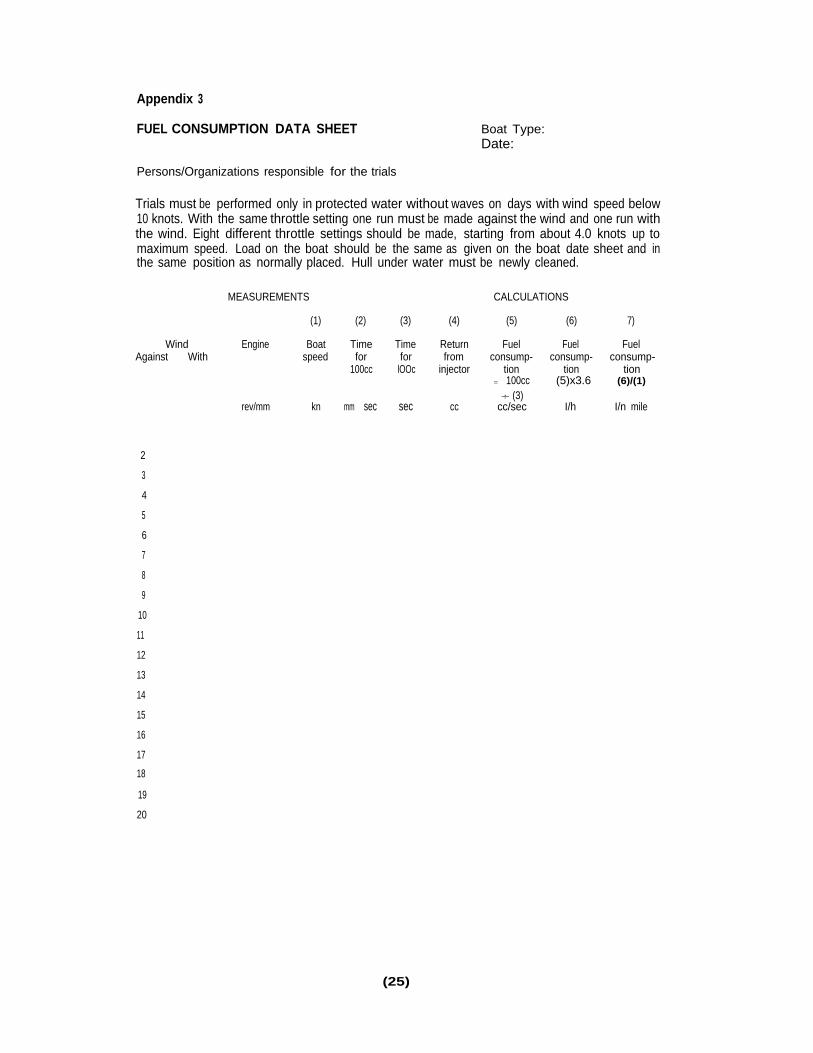
Appendix 3
FUEL CONSUMPTION DATA SHEET
Persons/Organizations responsible for the trials
Boat Type:Date:
Trials must be performed only in protected water without waves on days with wind speed below10 knots. With the same throttle setting one run must be made against the wind and one run withthe wind. Eight different throttle settings should be made, starting from about 4.0 knots up tomaximum speed. Load on the boat should be the same as given on the boat date sheet and inthe same position as normally placed. Hull under water must be newly cleaned.
MEASUREMENTS CALCULATIONS
(1) (2) (3) (4) (5) (6) 7)
Wind Engine Boat Time Time Return Fuel Fuel FuelAgainst With speed for for from consump- consump- consump-
100cc lOOc injector tion tion tion= 100cc (5)x3.6 (6)/(1)
÷ (3)rev/mm kn mm sec sec cc cc/sec I/h I/n mile
2
3
4
5
6
7
8
9
10
11
12
13
14
15
16
17
18
19
20
(25)

Publications of the Bay of Bengal Programme (BOBP)
The BOBP brings Out siX types of publications:
Reporss (BOBP/REP/....) describe and analyze completed activities such as seminars, annual meetings ofBOBP’s Advisory Committee, and projects in member-countries for which BOBP inputs have ended.
Working Papers (BOBP/WP/...) are progress reports that discuss the findings of ongoing BOBP work.
Manuals and Guides (BOBP/MAG/...) are instructional documents for specific audiences.
Miscellaneous Papers (BOBPJMIS/. . .) concern work not originated by BOBP staff or consultants — but whichis rdevant to the Programme’s objectives.
Informaiwn Documents (BOBP/INF...) are bibliographies and descriptive documents on the fisheries ofmember-countries in the region.
Newsletters (Baj of Bengal Xews), issued quarterly, contain illustrated articles and features in non-technicalstyle on BOBP work and related subjects.
A list of publications follows.
Reports (BOBP/REPJ...)
1. Report of the First Meeting of the Advisory Committee. Colombo, Sri Lanka, 28—29 October 1976.(Published as Appendix 1 of IOFC/DEV/78f44.1, FAO, Rome, 1978)
2. Report of the Second Meeting of the Advisory Committee. Madras, India, 29—30 June 1977.(Published as Appendix 2 of IOFC/DEV/78/44.l, FAO, Rome, 1978)
3. Report of the Third Meeting of the Advisory Committee. Chittagong, Bangladesh, 1—10 November 1978.Colombo, Sri Lanka, 1978.(Reissued Madras, India, September 1980)
4. Role of Women in Small-Scale Fisheries of the Bay of Bengal. Madras, India, October 1980.
5. Report of the Workshop on Social Feasibility in Small-Scale Fisheries Development.Madras, India, 3—8 September 1979. Madras, India, April 1980.
6. Report of the Workshop on Extension Service Requirements in Small-Scale Fisheries.Colombo, Sri Lanka, 8—12 October 1979. Madras, India, June 1980.
7. Report of the Fourth Meeting of the Advisory Committee. Phuket, Thailand, 27—30 November 1979.Madras, India, February 1980.
8. Pre-Feasibility Study of a Floating Fish Receiving and Distribution Unit for Dubla Char, Bangladesh.G. Eddie, M. T. Nathan. Madras, India, April 1980.
9. Report of the Training Course for Fish Marketing Personnel ofTamil Nadu.Madras, India, 3—14 December 1979. Madras, India, September 1980.
10.1 Report of the Consultation on Stock Assessment for Small-Scale Fisheries in the Bay of Bengal.Chittagong, Bangladesh, 16—21 June 1980. Volume 1: Proceedings. Madras, India, September 1980.
10.2 Report of the Consultation on Stock Assessment for Small-Scale Fisheries in the Bay of Bengal.Chittagong, Bangladesh, 16—21 June 1980. Volume 2: Papers. Madras, India, October 1980.
II. Report of the Fifth Meeting of the Advisory Committee. Penang, Malaysia, 4—7 November 1980.Madras, India,January 1981.
12. Report of the Training Course for Fish Marketing Personnel of Andhra Pradesh.Hyderabad, India, 11—26 November 1980. Madras, India, September 1981.
13. Report of the Sixth Meeting of the Advisory Committee. Colombo, Sri Lanka, 1—5 December 1981.Madras, India, February 1982.
14. Report of the First Phase of tlse “Aquaculture Demonstration for Small-Scale Fisheries Development Project”in Phang Nga Province, Thailand. Madras, India, March 1982.
15. Report of the Consultation-cum-Workshop on Development of Activities for Improvement of Coastal FishingFamilies. Dacca, Bangladesh, October 27—November 6, 1981. Madras, India, May 1982.
16. Report of the Seventh Meeting of the Advisory Committee. New Delhi, India, January 17—21, 1983.Madras, India, Match 1983.
17. Report of Investigations to Improve the Kattumaram of India’s East Coast. Madras, India, July 1984.
18. Motorization of Cosintry Craft, Bangladesh. Madras, India, July 1984.
19. Report of the Eighth Meeting of the Advisory Committee. Dhaka, Bangladesh, January 16—19, 1984.Madras, India, May 1984.
(26)
20. Coastal Aquaculture Project for Shrimp and Finfish in Ban Merbok, Kedah, Malaysia.Madras, India, December 1984.
21. Income-Earning Activities for Women from Fishing Communities in Sri Lanka. Edeltraud Drewes.Madras, India, September 1985.
22. Report of the Ninth Meeting of the Advisory Committee. Bangkok, Thailand, February 25—26, 1985.Madras, India, May 1985.
23. Summary Report of BOBP Fishing Trials and Demersal Resources Studies in Sri Lanka.Madras, India, March 1986.
24. Fisherwomen’s Activities in Bangladesh: A Participatory Approach to Development. Patchanee Natpracha.Madras, India, May 1986.
25. Attempts to Stimulate Development Activities in Fishing Communities of Adirampattinam, India.Madras, India, May 1986.
26. Report of the Tenth Meeting of the Advisory Committee.Male, Maldives. 17—18 February 1986. Madras, India, April 1986.
27. Activating Fisherwomen for Development through Trained Link Workers in Tamil Nadu, India.Edeltraud Drewes. Madras, India, May 1986.
28. Small-Scale Aquaculture Development Project in South Thailand: Results and Impact.E. Drcwes. Madras, India, May 1986.
29, Towards Shared Learning: An Approach to Non-formal Adult Education for Marine Fisherfolk of TamilNadu, India. L. S. Saraswathi and Patchanee Natpracha. Madras, India, July 1986.
30. Summary Report of Fishing Trials with Large-Mesh Driftncts in Bangladesh. Madras, India, May 1986.
Working Papers (BOBP/ WP/....)
1. Investment Reduction and Increase in Service Life of Kattumaram Logs.R. Balan. Madras, India, February 1980.
2. Inventory of Kattumarams and their Fishing Gear in Andhra Pradesh and Tamjl Nadu.T. R. Menon. Madras, India, October 1980.
3. Improvement of Large-Mesh Driftnets for Small-Scale Fisheries in Sri Lanka.G. Pajot. Madras, India, June 1980.
4. Inboard Motorisation of Small G.R.P. Boats in Sri Lanka. Madras, India, September 1980.
5. Improvement of Large-Mesh Driftnets for Small-Scale Fisheries in Bangladesh.G. Pajot. Madras, India, September 1980.
6. Fishing Trials with Bottom-Set Longlines in Sri Lanka.G. Pajot, K. T. Weerasooriya. Madras, India, September 1980.
7. Technical Trials of Beachcraf’t Prototypes in India.0. Gulbrandsen, G. P. Gowing, R. Ravikumar. Madras, India, October 1980.
8. Current Knowledge of Fisheries Resources in the Shelf Area of the Bay of Bengal.B. T. Antony Raja. Madras, India, September 1980.
9. Boatbuilding Materials for Small-Scale Fisheries in India. Madras, India, October 1980.
10. Fishing Trials with High-Opening Bottom Trawls in Tamil Nadu, India.G. Pajot, John Crockett. Madras, India, October 1980.
11. The Possibilities for Technical Cooperation between Developing Countries (TCDC) in Fisheries.E. H. Nichols. Madras, India, August 1981,
12. Trials in Bangladesh of Large-Mesh Driftnets of Light Construction.G. Pajot, T. K. Das. Madras, India, October 1981.
13. Trials of Two-Boat Bottom Trawling in Bangladesh. G. Pajot,J. Crockett. Madras, India, October 1982.
14. Three Fishing Villages in Tamil Nadu. Edeltraud Drewes. Madras, India, February 1982.
15. Pilot Survey of Driftnet Fisheries in Bangladesh. M. Bergstrom. Madras, India, May 1982.
16. l’urther Trials with Bottom Longlines in Sri Lanka. Madras, India, July 1982.
17. Exploration of the Possibilities of Coastal Aquaculture Development in Andhra Pradesh. Soleh Samsi, SiharSiregar and Martono. Madras, India, September 1982.
18. Review of Brackishwatcr .Aquaculture Development in Tamil Nadu. Kasemsant Chalayondeja and AnantSaraya. Madras, India, Augsist 1982.
19. Coastal \‘illage Development in Four Fishing Communities of Adirampattinam, Tamil Nadu, India.F. W. Blase. Madras, India, December 1982.
20. Further Trials of Mechanized Trawling for Food Fish in Tamil Nadu.G. Pajot, J. Crockett, S. Pandurangan, P. V. Ramamoorthy. Madras, India, December 1982.
(27)

2!. Improved Deck Machinery and Layout for Small Coastal Trawlers. G. Pajot, J. Crockett, S. Pandurangan andP. V. Ramamoorthy. Madras, India, June 1983.
22. The Impact of Management Training on the Performance of Marketing Officers in State Fisheries Corporations.U. Tietze. Madras, India, June 1983.
23. Review of Experiences with and Present Knowledge about Fish Aggregating Devices.M. Bergstrom. Madras, India, November 1983.
24. Traditional Marine Fishing Craft and Gear of Orissa. P. Mohapatra. Madras, India, April (986.
25. Fishing Craft Development in Kerala: Evaluation Report. 0. Gulbrandsen. Madras, India, June 1984.
26. Commercial Evaluation of IND-l3 Beachcraft at Uppada, India. R. Ravikumar. Madras, India, June 1984.
27. Reducing Fuel Costs of Fishing Boats. 0. Gulbrandsen. Madras, India, July 1986.
28. Fishing Trials with Small-Mesh Driftnets in Bangladesh.G. Pajot and T. K. Das. Madras, India, March 1984.
29. Artisanal Marine Fisheries of Orissa: a Techno-Demographic Study. M. H. Kalavathy and U Tietze.Madras, India, December 1984.
30. Mackerels in the Malacca Straits. Colombo, Sri Lanka, February 1985.
31. Tuna Fishery in the EEZs of India, Maldives and Sri Lanka. Colombo, Sri Lanka, February 1985.
32. Pen Culture of Shrimp in the Backwaters of Killai, Tamil Nadu: A Study of Techno-economic and SocialFeasibility. Rathindra Nath Roy, Madras, India, January 1985.
33. Factors that Influence the Role and Status of Fisherwomen. Karuna Anbarasan.Madras, India, April 1985.
34. Pilot Survey of Set Bagnet Fisheries of Bangladesh. Abul Kashem. Madras, India, August 1985.
35. Pen Culture of Shrimp in the Backwaters of Killal, Tamil Nadu. M. Karim and S. Victor Chandra Bose.Madras, India, May 1985.
36. Marine Fishery Resources of the Bay of Bengal. K. Sivasubramaniam. Colombo, Sri Lanka, October 1985.
37. A Review of the Biology and Fisheries of Hilsa ilisha in the Upper Bay of Bengal. B. T. Antony Raja.Colombo, Sri Lanka, October 1985.
38. Credit for Fisherfolk: The Adirampattinam Experience. R. S. Anbarasan and Ossie Fernandez.Madras, India, March 1986.
39. The Organization of Fish Marketing in Madras Fishing Harbour. M. H. Kalavathy.Madras, india, September 1985.
40. Promotion of Bottom Set Longlining in Sri Lanka. K. T. Weerasooriya, S. S. C. Pieris, M. Fonseka.Madras, India, August 1985.
41. The Demersal Fisheries of Sri Lanka. K. Sivasubramaniam and R. Maldeniya.Madras, India, December 1985.
42. Fish Trap Trials in Sri Lanka. (Based on a report by T. Hammerman). Madras, India, January 1986.
43. Demonstration of Simple Hatchery Technology for Prawns in Sri Lanka. Madras, India, June 1986.
44. Pivoting Engine Installation for Beachlanding Boats. A. Overa, R. Ravikumar. Madras, India, June 1986.
45. Further Development of Beachlanding Craft in India and Sri Lanka.A. Overa, R. Ravikumar, 0. Gulbrandsen, G. Gowing. Madras, India, July 1986.
46. Experimental Shrimp Farming in Ponds in Polekurru, Andhra Pradesh, India. J. A. J. Jansscn, T. RadhakrishnaMurthy, B. V. Raghavulu, V. Sreekrishna. Madras, India, July 1986.
47. Growth and Mortality of the Malaysian Cockle (Anadara Granosa) under Commercial Culture: Analysisthrough Length-Frequency Data. Ng Fong Oon. Madras, India, July 1986.
Manuals and Guides (BOBPJMAG/. .
1. Towards Shared Learning: Non-formal Adult Education for Marine Fisherfolk.Trainers’ Manual. Madras, India, June 1985.
2. Towards Shared Learning: Non-formal Adult Education for Marine Fisherfolk.Animators’ Guide. Madras, India, June 1985.
3. Fishery Statistics on the Microcomputer: A BASIC Version of Hasselblad’s NORMSEP Program.D. Pauly, N. David, J. Hertel-Wulif. Madras, India, June 1986.
Miscellaneous Papers (BOBP/MIS/....)
I. Fishermen’s Cooperatives in Kerala: A Critique. John Kurien. Madras, India, October 1980.
(28)
2. Consultation on So al Feasibility of Coastal Aquaculture.Madras, India, 26 November—I December 1984. Madras, India, November 1985.
Information Documents (BOBI’/IXFJ. . .
I. Women and Rural l)evelopment in the Bay of Bengal Region: Information Sources.Madras, India, February 1982.
2. Fish Aggregation Devices: Information Sources. Madras, India, February 1982.
3. Marine Small-Scale Fisheries of India: A General Description. Madras, India, March 1983.
4. Marine Small-Scale Fisheries of Andhra Pradesh: A General Description. Madras, India, June 1983.
5. Marine Small-Scale Fisheries of Tamil Nadu: A General Description. Madras, India, December 1983.
6. Marine Small-Scale F’isheries of Sri Lanka: A General Description. Madras, India, November 1984.
7. Marine Small-Scale Fisheries of Orissa: A General Description. Madras, India, December 1984.
8. Marine Small-Scale Fisheries of Bangladesh: A General Description. Madras, India, September 1985.
9. Food and Nutrition Status of Small-Scale Fisherfolk in India’s East Coast States:A Desk Review and Resource Investigation. V. Bhavani. Madras, India, April 1986.
Newsletters (Bay ofBengal Jiews):
22 issues quarterly from January 1981 to June 1986.
Published by the Bay of Bengal Programme, FAO, 91, St. Mary’s Road, Abhiramapuram, Madras-600 018, India.Printed at Nagaraj & Co., Madras-600 041.