reducing sox and nox emissions from ships by a … prime movers/2003 scrubber... · emissions from...
TRANSCRIPT

Reducing SO2 and NOX emissions from Ships
by a seawater scrubber
Dr. Brigitte Behrends and Prof. Dr. Gerd Liebezeit
Research Centre Terramare
Wilhelmshaven, Germany
Contract partner: BP-Marine
Contact person: Don Gregory
Date of submission: 17.04.2003

CONTENTS
1 Introduction ...................................................................................................... 1
1.1 Air pollution ........................................................................................ 1
1.2 Contribution of shipping to air pollution ............................................. 2
1.2.1 Legislation: 3
1.3 Techniques for the reduction of atmospheric emissions in power
plants ................................................................................................. 3
1.3.1 Techniques for the removal of sulphur from petroleum 4
1.3.2 Flue Gas Desulphurisation 4
1.4 Technologies for the reduction of atmospheric emissions by ships -
the seawater scrubber ........................................................................ 7
1.4.1 Composition of the effluent 7
1.5 Questions of concern .......................................................................... 8
2 Element cycles ................................................................................................. 9
2.1 Sulphur ............................................................................................... 9
2.1.1 Sulphur: an important component of the world economy Production 9
2.1.2 Sulphur emissions to atmosphere 10
2.1.2.1 Natural emissions of sulphur .......................................................... 10
2.1.2.2 Global anthropogenic sulphur emissions .......................................... 11
2.1.2.3 Particulate sulphate ...................................................................... 11
2.1.3 Deposition of sulphate and sulphuric acid 11
2.2 Nitrogen cycle................................................................................... 12
2.2.1 Emissions of nitrogen compounds to the atmosphere 12
2.2.1.1 Natural emissions of nitrogen ......................................................... 12
2.2.1.2 Anthropogenic emissions of nitrogen ............................................... 13
3 Composition of seawater............................................................................... 14
3.1 Marine sulphur cycle ......................................................................... 15
3.2 Marine nitrogen cycle ....................................................................... 16
3.3 The pH of seawater: the carbonate system ....................................... 18
3.4 Laboratory measurements ................................................................ 21
3.4.1 Impact of diluted sulphuric acid (pH 4) on seawater 21
3.4.2 Impact of diluted sulphuric acid (pH 4) on brackish waters 22
3.5 Summary of laboratory experiments ................................................ 23
3.6 Impact of the acidic effluent of the EcoSilencer on the pH of the
receiving water ................................................................................. 24
3.7 Estuaries .......................................................................................... 25
3.7.1 Harbour areas like the Port of Rotterdam 26
3.8 The Baltic Sea ................................................................................... 27
3.8.1 Vital inflow from the North Sea 28
3.9 Acidification of surface waters ......................................................... 28
3.10 Experiences with acid disposals at sea. ............................................ 29
3.11 Eutrophication effects ....................................................................... 29
4 Environmental impact of scrubbing waters - Synthesis ............................. 30

List of Figures
Fig. 1: Mean composition of atmospheric nitrogen compounds (nmol m
-3) in the German Bight _______ 14
Fig. 2: Scheme of the microbiological cycle of sulphur and its possible influence on the atmosphere ___ 16
Fig. 3: Schematic seasonal variation of nutrients and phytoplankton biomass in temperate areas. _____ 17
Fig. 4: Major reactions and pathways in the marine nitrogen cycle (Lohse, 1996) __________________ 18
Fig. 5: Impact of sulphuric acid (pH 4) on the pH of seawater (S = 29 PSU) ______________________ 21
Fig. 6: Percentage of sulphuric acid (pH 4) in brackish water with resulting pH (t = 0 and t = 1 h). ___ 23
Fig. 7: pH ranges that support aquatic life ________________________________________________ 26
List of Tables
Tab. 1: Comparison of estimates for global exhaust gas emissions from ships. ______________________ 3
Tab. 2: World production and consumption of sulphuric acid (EFMA, 2000) ______________________ 10
Tab. 3 Important Atmospheric nitrogen oxides _____________________________________________ 13
Tab. 4 Average sea- and freshwater compositions (internet site). _______________________________ 14
Tab. 5: Percentage of sulphuric acid (pH 4) in brackish water with resulting pH (t = 0 and t = 1 h) ____ 22
Tab. 6: Contribution of nitric acid to the acidity of the effluent _________________________________ 25
Tab. 7: Ports in the EU ranked by estimated annual emissions of NOx in 2000 reported by Entec, 2002. _ 27
List of used abbreviations
amu atomic mass units
CCN cloud condensation nuclei
DIN dissolved inorganic nitrogen (NH4+, NO2-, NO3-)
DMS Dimethyl sulphide
DON dissolved organic nitrogen
FGD Flue gas desulphurisation
IMO International Maritime Organization
Mam-Pec Computer model to generate predicted environmental concentrations
NOx stands for the different nitrogen oxides
PAH polycyclic aromatic hydrocarbons
PON particulate organic nitrogen
PSU practical salinity units
SWS seawater scrubber
VOC volatile organic compounds

- 1 -
1 Introduction
Burning of fossil fuels contributes significantly to atmospheric pollution. For several
decades concern has been expressed about the major pollutants, carbon dioxide,
sulphur dioxide and nitrous oxides. Carbon dioxide is considered to be largely
responsible for global warming while the latter two gases contribute amongst others to
acid rain and eutrophication of terrestrial and aquatic ecosystems. For power stations
a large number of technologies have been developed to reduce these emissions (see
chapter 1.3), while the shipping industry has made less progress in limiting emissions.
This is despite the fact that recent estimates suggest that shipping is a major factor in
global S and N cycles (chapter 2.1). The reduction of atmospheric emissions by ships,
with emphasis on seawater scrubber technology (flue gas desulphurisation process), is
therefore the main objective of this report.
1.1 Air pollution
Air pollutants are substances that are introduced into the atmosphere via
anthropogenic activities. Air pollution occurs as both, gaseous and particulate forms
which, when present in excess, are harmful to human health, buildings and
ecosystems. Four major impacts determine the classification of pollutants under the
traditional policy field Air Pollution:
acidification of soil and water by pollutants such as sulphur oxides and nitrogen
oxides.
damage to buildings sensitive to the same substances;
formation of tropospheric ozone from so-called ozone precursors, e.g. volatile
organic compounds, nitrogen oxides and carbon monoxide, thus indirectly
affecting human and animal health and vegetation;
direct effects on human health and ecosystems, e.g. through high atmospheric
concentrations of particles and volatile organic carbon compounds (VOCs).
Although some of these compounds are also produced by natural processes, the main
environmental problems result from human activities, such as burning of fossil fuels
(coal, natural gas and oil). Air pollutants may be transported over considerable
distances, affecting air quality, ecosystems, lakes and other surface waters,
groundwater, soils and buildings also in areas remote from the pollution source. Public
concern is focussed mainly on damage to forests and smog, although in Scandinavian
countries emphasis is also placed on the acidification of lakes. The atmospheric
pollution with sulphur dioxide and nitrous oxides is described in detail in chapters
2.1.2.2 and 2.2.1.2.
Particulates
Particulate air pollution originates from diverse sources. One major source of primary
particle emissions is fuel combustion, including mobile sources such as diesel and
gasoline-powered vehicles. The relative contributions of these different sources to the
particle concentration at a given site may vary significantly. Atmospheric particles
consist of organic and inorganic substances and are present in liquid or solid forms.
They are subdivided according to diameter: coarse particles >2.5 µm, fine particles
<2.5 µm. A further distinction is to classify particles as either primary or secondary,
according to their origin. Particles that are emitted directly into the atmosphere are
termed primary particles, whereas secondary particles form during atmospheric
reactions. The primary particles contain dust and other solid materials, which are
primarily formed during combustion processes. Fine particles also include secondarily
formed aerosols, smaller combustion particles and re-condensed organic and metallic

- 2 -
compounds with low volatility. Most secondary particulate matter occurs as sulphates
and nitrates formed in reactions involving sulphur dioxide and nitrogen oxides.
Shipping contributes to both, primary and secondary particles. Natural atmospheric
emissions of particulates also derive from volcanic activities.
1. Primary particulates:
Flue gases contain soot particles, which are produced by incomplete combustion of
fossil fuels. Besides the ability of particles to serve as condensation nuclei, soot
contains polycyclic aromatic hydrocarbons (PAHs), a family of semi-volatile organic
pollutants encompassing compounds such as naphthalene, anthracene, pyrene, or
benzo(a)pyrene. PAHs from combustion products have been identified as carcinogenic.
Combustion-derived PAHs are rapidly transferred from the atmosphere to aqueous
systems and accumulate in the sediment.
2. Secondary particulates
Secondary particles (including sulphate and nitrate aerosols) are formed from gaseous
pollutants (SO2, NOx). From the combustion of fossil fuels, ships emit sulphur dioxide
and nitrous oxides. The primary air pollutants sulphur dioxide and nitrogen oxides
undergo chemical transformations as they are dispersed in the atmosphere, forming
sulphuric acid and nitric acid respectively, which may be deposited downwind as acid
rain. Secondary particles can be transported over long distances.
1.2 Contribution of shipping to air pollution
Shipping contributes to air pollution by the burning of fossil fuel. The emitted nitrous
oxides (NOx) and sulphur oxides (SOx) together with particulate compounds such as
soot contribute to the anthropogenic perturbation of the Earth’s radiation budget
(Capaldo et al., 2000). The emission of NOx and SOx has different consequences for
the atmosphere: NOx is involved in production of ground level ozone but it also reacts
with tropospheric ozone thus aiding in the depletion of the ozone layer. SO2 is oxidised
to SO3 and eventually forms sulphuric acid, which contributes to acid rain and provides
cloud condensation nuclei by formation of secondary particles, thereby increasing the
albedo. Owing to the reactivity of sulphur gases in the atmosphere, most
anthropogenic SO2 emissions are deposited locally, therefore shipping contributes
mainly to coastal air pollution.
Corbett and Fischbek (1997) give annual emissions of 3.08 * 106 ton N and 4,24 106
ton S for the global fleet accounting for 14 % (N) and 16 % (S) of emissions from all
fuel combustion sources (Tab. 1). On the other hand, only 2 % of the 6,000 * 106 ton
carbon dioxide emitted annually from fossil fuel combustion are related to the
operation of ships. This indicates that ship engines are among the highest pollution
sources for nitrogen and sulphur gases. Various estimates for the contributions of
shipping to global air pollution are presented in Tab. 1.

- 3 -
Tab. 1: Comparison of estimates for global exhaust gas emissions from ships.
Source Calculation(1) Year
C (2)
[106 t]
SO2
[106 t]
NOx
[106 t]
Isensee, 2001 1997 101* 6.4 6.0
IMO, 2000 M 1996 112 5.5 9.8
IMO, 2000 F 1996 117 5.8 10.3
Det Norske Veritas, 1999 M 1996 109 5.5 9.9
UNFCCC, 1997 ? 1994 109 7.7-11.5 9.3
Corbett and Fischbeck,
1997
F 1996 - 8.5 10.1
Corbett, 1999 ? 1992 123.6 8.5 10.1
mean 1994 -
1997 114.2 6,7 9,3
(1) M = model, F = fuel based calculations
(2) Calculated from CO2 emissions
Emissions from shipping operations are not equally distributed over the seas. Most
vessels navigate relatively near shore, following the main shipping lanes. Corbett
(1999) concludes that almost 70 % of these emissions occur in a coastal zone of 400
km width. Similarly, Oftedal (1996) estimates that 74 - 83 % of all vessels are within
200 nautical miles of land at any time. Consequently, the impact of shipping on the
NOX and SO2 emissions is highest in the northern hemisphere, particularly along the
west and east coasts of the United States, in northern Europe and the North Pacific.
1.2.1 Legislation:
As soon as the IMO regulation for the prevention of air pollution from ships (Marpol
73/78 Annex VI) comes into force, emissions from ship exhausts have to be reduced.
Annex VI contains provisions allowing for special "SOx Emission Control Areas" to be
established with a more stringent control on sulphur emissions. In these areas, the
sulphur content of fuel oil used on board ships must not exceed 1.5 % m/m.
Alternatively, ships must fit an exhaust gas cleaning system or use any other technical
method to limit SOx emissions. Currently the Baltic Sea, the North Sea and the
Channel are designated as SOx Emission Control Areas in the Protocol. It is expected
that the Annex will come into force during 2004.
1.3 Techniques for the reduction of atmospheric emissions in power plants
The technology for the reduction of the atmospheric pollutants should be
environmentally benign. Otherwise, the problem would be shifted only. There are
three possibilities to reduce the SO2 emissions from combustion processes: removal of
sulphur or sulphur dioxide before, during or after combustion.

- 4 -
1.3.1 Techniques for the removal of sulphur from petroleum
As after World War II production of high sulphur crude oils increased considerably and
product specifications became more stringent, the oil industry was forced to develop
techniques for removal of sulphur. In addition, the catalyst used in the Platforming
Processes can handle only low ppm levels of sulphur. In addition, environmental
considerations also forced reductions of sulphur emissions.
The major process used today is Hydrotreating or Hydrodesulphurisation, i.e.
treatment of the oil with hydrogen gas obtained e.g. during catalytic reforming.
In this process sulphur compounds are removed by conversion to hydrogen sulphide
(H2S) in the presence of a catalyst. As only sulphur is removed, high yields of liquid
end products result. In addition, H2S can be washed from the product gas stream by
an amine wash. H2S is recovered in highly concentrated form and can then be
converted to elemental sulphur via the Claus-Process.
For Hydrotreating two processes are used, the liquid phase or trickle flow and the
vapour phase processes for light straight-run and cracked fractions. In both cases the
feedstock is mixed with hydrogen-rich make-up and recycle gas and reacted at
temperatures of 300 - 380 °C. Pressures of 10 - 20 bar for naphta and kerosine and
30 - 50 bar for gasoline are applied. Under these conditions, S and N compounds are
converted to hydrogen sulphide and ammonia, while a part of the aromatic
compounds present will by hydrogenated.
Catalysts employed are cobalt, molybdenum or nickel finely distributed on aluminium
extruders.
More recent developments include biological conversion of sulphur-containing
petroleum components to elemental sulphur and sonocatalytic treatment as well as
hydrogen peroxide oxidation in the presence of iron(III)complexes at low
temperatures. The latter two will remove dibenzothiophenes, compounds being of
particular concern to the oil industry.
1.3.2 Flue Gas Desulphurisation
The removal of SO2 after the combustion process is termed Flue Gas Desulphurisation
(FGD). The different FGD processes can be classified by their technologies:
Limestone/Gypsum System
The limestone FGD is to date the most widely used process. In principle, a solution of
crushed limestone in water is sprayed into the flue gases. The SO2 reacts with calcium
ions to form a calcium sulphite slurry. Aeration of the slurry with compressed air
oxidises calcium sulphite to calcium sulphate. After removal of the water, the calcium
sulphate can be disposed or used by the building trade. While the reduction of SO2 is
around 90 % the process has the disadvantage that limestone has to be stored and
gypsum waste in large quantities is produced.
Spray Dry System
A slurry of slaked lime is used as an alkaline sorbent. The slurry is injected into the
flue gases in a fine spray. The flue gases are simultaneously cooled by the evaporation
of water. The SO2 present reacts with the drying sorbent to form a solid reaction
product, with no wastewater.
Wellman-Lord Process

- 5 -
In the Wellman-Lord process, hot flue gases are passed through a pre-scrubber where
ash, hydrogen chloride, hydrogen fluoride and SO3 are removed. After pre-scrubbing,
the gases are then cooled and fed into an absorption tower, where the SO2 reacts with
a saturated sodium sulphite solution to form sodium bisulphite. The sodium bisulphite
is regenerated after a drying step to sodium sulphite again. The remaining product -
the released and clean SO2 - may then be liquefied or converted to elemental sulphur
or sulphuric acid. The sorbent is regenerated during the combustion process and is
continuously recycled, but the products (sulphur compounds) have to be stored.
Seawater Scrubbing Process (SWS)
Experience with the FGD by seawater scrubbing process in power plants
Probably the first large sized FGD was installed at the Battersea power plant (London
Power Company) in the UK in 1930. During the power station planning approval local
authorities expressed concern about the impact on the local community of the
emissions of large quantities of SOx from the combustion of coal. The water of the
Thames was used as the major sorbent although for a short period limestone was
added. This practise was soon discontinued as it was determined that it provided no
additional benefit to the scrubbing system. The Battersea power station operated in
this mode for more than 50 years.
In 1972, ABB Environmental in Norway and Norsk Hydro started the development of a
flue gas desulphurisation process (Flakt Hydro process) using seawater for the
absorption of SO2 from flue gases. The first seawater scrubber was introduced in 1988
at the Statoil refinery in Mongstad Norway (Tokerud, 1989). The seawater scrubbing
process exploits the natural buffering capacity of seawater to absorb acidic gases
instead of producing huge amounts of gypsum. After passing a dust collector, the hot
flue gas enters the scrubber. The scrubber is a packed absorption tower, where the
gases flow counter-current to seawater. During this process SO2 is efficiently absorbed
by the seawater. Air is supplied to oxidise the absorbed SO2 to sulphuric acid and to
saturate the seawater with oxygen. Before discharging the effluent into the sea,
further seawater is added to bring the pH back to normal seawater values. The
sulphate ions themselves are harmless, as they are major constituents of ordinary
seawater. However, the pH of the effluent may be of concern. To reduce the sulphuric
acid problem, e.g. in sensitive areas, precipitation of sulphate with limestone is
possible. This system is simple and inherently reliable with low capital and operational
costs. It can remove up to 99 % of SO2, with no disposal of waste to land. However,
heavy metals and chlorides that are also present in the scrubbing water must be
captured by use of a water treatment system, otherwise they will be released to the
sea with the wash water.
The Mongstad oil refinery (Statoil) situated on the west coast of Norway installed the
FGD in 1988 (Nyman and Tokerud, 1991). The effluent water from FGD is mixed with
seawater and is discharged to the sea. As the Norwegian Sea is deep and well mixed,
further water treatment was regarded unnecessary (Glenna and Tokerud, 1991).
Powergen and partners already tested the SWS process for flue gas desulphurisation
in some power plants.
Summary of the FGD technologies
Each method has both advantages and limitations related to cost, removal efficiency,
operational experience and waste products produced. For ships, the lack of space is an
important criterion. Space is not only needed for the FGD itself, but also for chemicals
(depending on the technology) and waste products. Some control technologies affect
more than one pollutant and have different impacts on environmental effects. FGD
simultaneously removes SO2, NOx and particulate matter, which have impacts on

- 6 -
acidification, on ambient levels of SO2 and primary particles and on secondary
sulphate aerosols.

- 7 -
1.4 Technologies for the reduction of atmospheric emissions by ships - the seawater scrubber
For ships the seawater scrubbing is a very suitable process, because
no limestone has to be stored on board,
no waste (gypsum) is produced, which has to be deposited on land,
the seawater already contains substantial amounts of sulphate and nitrate
The DME EcoSilencer seawater scrubber removes 90-95 % of SO2 and 10 - 20 % of
NOx. Additionally, the SWS removes 80 % of the particulates and 10-20% of
hydrocarbons. The use of cyclone technology ensures that the particulate material is
retained on board ship and not included with effluent overboard seawater. The
particulate sludge is then deposited ashore along with shipboard oily waste according
to local environmental and safety regulations. The DME system needs no extra space,
as it can be installed inside the exhaust system. Accompanying positive side effects
are the reduction of engine noise and a reduction of the diesel smell.
As the conversion of SO2 to SO42- and NOx to NO3
- consumes oxygen, aeration of the
effluent is necessary. The DME system incorporates a high degree of recirculation,
thus ensuring that aulphur oxides are given adequate time and oxygen contact to be
converted to SO4. In the following calculations complete oxidation will be assumed.
The DME MES EcoSilencer works by bringing water in contact with hot exhaust gas.
The exhaust gas is channelled through a concentric duct into a shallow water tank.
Within the water, there are a set of mixing baffles which break up large gas flow into
smaller bubbles, forcing the gas to come in contact with water, and thereby
encouraging transfer of species from gas to water. The SO2 in exhaust gas is
relatively soluble in seawater, so this transfer happens to a very high degree. Large
particles (greater than 10 micron) are also captured in the water. Very fine particles
(smaller than 2.5 micron) are not effectively cleaned using this method.
Since the recirculated water is maintained at a pH of 2.0-4.0, this makes a very good
medium for scrubbing of NOx. Measurements have shown up to 20% removal of NOx,
and this is enhanced due to the acidity of scrubbing liquor.
Water that is removed from the scrubber is pumped through a set of large cyclones.
These cyclones are designed to separate some of the heavy particles, as well as light
particles in a two-stage system. Underflow from the main cyclones is concentrated
again, and the underflow is fed to a settling tank for collection of soot and oil. Under
normal operating conditions, this system can be run with no ongoing maintenance
(such as filter backwash or media recharge), and the resulting cleaned recirculated
water is maintained at a low concentration of hydrocarbons, making it safe for
discharge to sea. An on-line hydrocarbon monitor is used to ensure that oil in water
that may result from poor engine operation is detected and discharge valves are
closed before this can be released. Under normal operation, the overboard discharge
water will contain less than 4ppm of hydrocarbon. This is far less than the total oil
that would reach the surface water from particle fallout in an unscrubbed plume.
1.4.1 Composition of the effluent
While NOx production depends on the engine design and to some extent engine power,
SO2 production depends on the sulphur content of the fuel. During seawater scrubbing
the SO2 is finally converted to sulphuric acid and NOx to nitric acid. 95 % of the SO2 is

- 8 -
eliminated by this technique and ca. 20 % of NOx. The salts in the effluent are SO42-,
SO32-, NO3
- and NO2-.
The seawater scrubber is fed with natural seawater, which is then added to the
seawater cooling system. The dilution is typically between 5:1 and 10:1. The mixture
of cooling water and buffering water is then discharged to the sea. The pH of the
effluent mixture ranges from 4.8 to 6.4 depending upon dilution rate which is a
function of engine operating conditions. The intention of this work is to analyse the
impact of the produced ions and the low pH on marine life.
1.5 Questions of concern
Is air pollution simply converted to seawater pollution by discharging the scrubbing
water directly into the surrounding waters?
Are there differences in the effects on fully marine and brackish waters? Is there
any breakpoint for salinity, at which the scrubbing water should not be discharged
anymore?
Can the produced sulphuric and nitric acids be buffered in semi-enclosed systems
and brackish waters?
Is there any oxygen deficiency in the surrounding seawater by discharging
sulphuric acid?
What are the impacts of scrubber effluent on harbour waters compared to power
stations effluents
What is the worst-case scenario?
To answer these questions, background information on global sulphur and nitrogen
cycles and seawater chemistry will be provided in the following before the effects of
acid discharge will be discussed.

- 9 -
2 Element cycles
2.1 Sulphur
The element sulphur occurs as crystals, granular aggregates, massive layers and
powdery crusts in three different forms: amorphous, rhombic and monocline crystals.
It forms as a product of volcanic activity, around volcanic craters and hot springs, but
also by weathering of sulphide minerals and bacterial reduction of dissolved sulphate.
Sulphur melts easily and burns producing sulphur dioxide gas.
Sulphur is an essential nutrient for plants. It is also a major element of seawater and
marine sediments. In nature sulphur compounds may cycle through a series of
oxidation states (-2, 0, +2, +4, +6). Therefore, sulphur compounds may act as both
electron acceptors and electron donors. Bacteria of a wide range of genera gain
metabolic energy from either oxidising or reducing sulphur compounds. Major forms of
sulphur include sulphate and sulphide minerals, dissolved sulphate (SO42–), dissolved
sulphide (HS–), and hydrogen sulphide gas (H2S). Organic sulphur is a component of
organic compounds such as humic substances, kerogen and proteins. Sulphur in fossil
fuels (mercaptans, thiophenes, mono- and polycyclic sulphur compounds) originates
from these latter sources (e.g. Guadelupe et al., 1991; Thompson, 1994; Saiz-
Jiminez, 1995; Sinninghe-Damsté et al., 1998).
2.1.1 Sulphur: an important component of the world economy Production
Elemental sulphur for industrial purposes is produced by oxidation of hydrogen
sulphide gas or reduction of sulphur dioxide and organic sulphur. These compounds
are constituents of natural gas and oil, from which they are also recovered. Of all
sulphur sources, natural sulphur from open pit mining accounts for less than 1 %,
nevertheless representing 3 * 106 t/yr world-wide. Most of the sulphur is recovered
from natural gas and oil (CIEC, 1999). For the exploitation of deep sulphur layers the
Frasch process is the most important technique: Sulphur is melted with heated water
under pressure and the liquefied sulphur is then pumped to the surface with
compressed air (Hollemann and Wiberg, 1985).
Use of sulphur
Sulphur is an essential nutrient for the growing plant. It is present in fertilisers,
usually in the sulphate form that plants can use. For example, superphosphate
contains about 11 % S while ammonium sulphate, usually regarded as a nitrogenous
fertiliser, contains 24 % S which is more than its nitrogen content. However, about
90 % of industrial sulphur is used in the manufacture of sulphuric acid, the most
important sulphur compound. More sulphuric acid is produced than any other chemical in the
world. In Western Europe in 1997 over 19 * 106 tonnes were produced, the total production
world-wide being estimated at around 150 * 106 tonnes (Smith et al., 2001). It is said that
the economic prosperity of a country can be assessed by its consumption of sulphuric
acid. Sulphuric acid was manufactured by the lead-chamber process until the mid-
1930s. This process has now been replaced by the contact process, involving the
catalytic oxidation of sulphur dioxide.
- 10 -
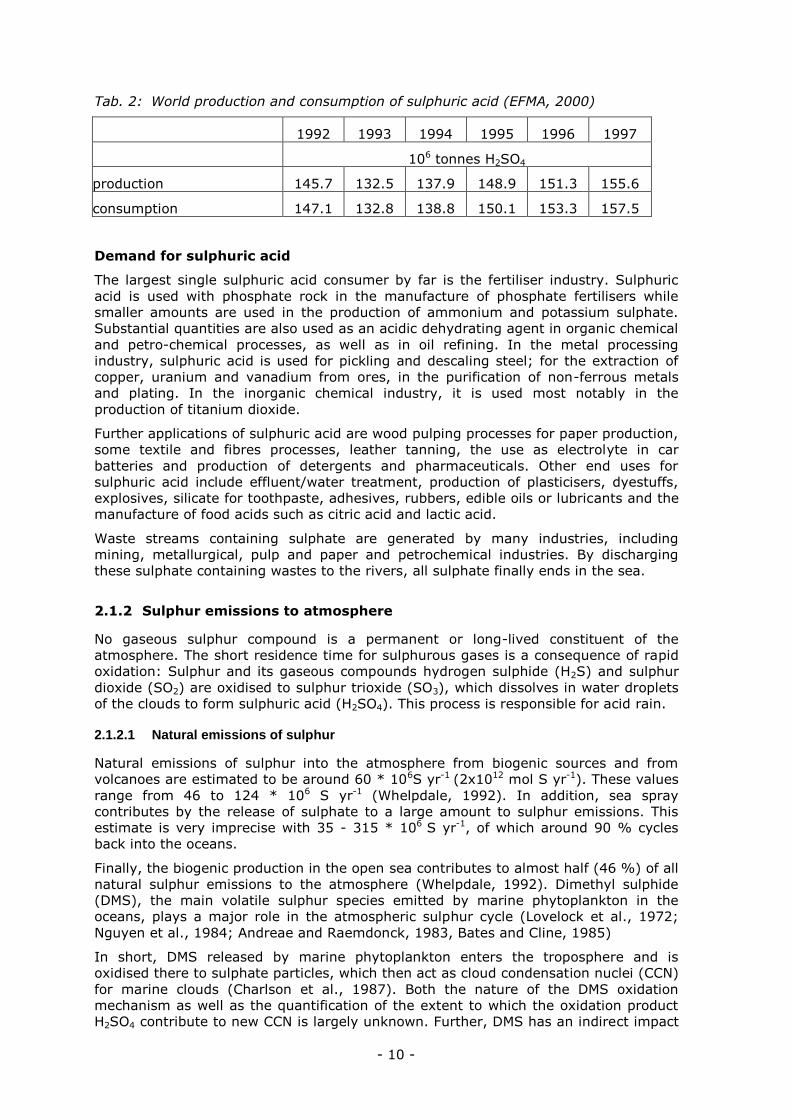
Tab. 2: World production and consumption of sulphuric acid (EFMA, 2000)
1992 1993 1994 1995 1996 1997
106 tonnes H2SO4
production 145.7 132.5 137.9 148.9 151.3 155.6
consumption 147.1 132.8 138.8 150.1 153.3 157.5
Demand for sulphuric acid
The largest single sulphuric acid consumer by far is the fertiliser industry. Sulphuric
acid is used with phosphate rock in the manufacture of phosphate fertilisers while
smaller amounts are used in the production of ammonium and potassium sulphate.
Substantial quantities are also used as an acidic dehydrating agent in organic chemical
and petro-chemical processes, as well as in oil refining. In the metal processing
industry, sulphuric acid is used for pickling and descaling steel; for the extraction of
copper, uranium and vanadium from ores, in the purification of non-ferrous metals
and plating. In the inorganic chemical industry, it is used most notably in the
production of titanium dioxide.
Further applications of sulphuric acid are wood pulping processes for paper production,
some textile and fibres processes, leather tanning, the use as electrolyte in car
batteries and production of detergents and pharmaceuticals. Other end uses for
sulphuric acid include effluent/water treatment, production of plasticisers, dyestuffs,
explosives, silicate for toothpaste, adhesives, rubbers, edible oils or lubricants and the
manufacture of food acids such as citric acid and lactic acid.
Waste streams containing sulphate are generated by many industries, including
mining, metallurgical, pulp and paper and petrochemical industries. By discharging
these sulphate containing wastes to the rivers, all sulphate finally ends in the sea.
2.1.2 Sulphur emissions to atmosphere
No gaseous sulphur compound is a permanent or long-lived constituent of the
atmosphere. The short residence time for sulphurous gases is a consequence of rapid
oxidation: Sulphur and its gaseous compounds hydrogen sulphide (H2S) and sulphur
dioxide (SO2) are oxidised to sulphur trioxide (SO3), which dissolves in water droplets
of the clouds to form sulphuric acid (H2SO4). This process is responsible for acid rain.
2.1.2.1 Natural emissions of sulphur
Natural emissions of sulphur into the atmosphere from biogenic sources and from
volcanoes are estimated to be around 60 * 106S yr-1 (2x10¹² mol S yr-1). These values
range from 46 to 124 * 106 S yr-1 (Whelpdale, 1992). In addition, sea spray
contributes by the release of sulphate to a large amount to sulphur emissions. This
estimate is very imprecise with 35 - 315 * 106 S yr-1, of which around 90 % cycles
back into the oceans.
Finally, the biogenic production in the open sea contributes to almost half (46 %) of all
natural sulphur emissions to the atmosphere (Whelpdale, 1992). Dimethyl sulphide
(DMS), the main volatile sulphur species emitted by marine phytoplankton in the
oceans, plays a major role in the atmospheric sulphur cycle (Lovelock et al., 1972;
Nguyen et al., 1984; Andreae and Raemdonck, 1983, Bates and Cline, 1985)
In short, DMS released by marine phytoplankton enters the troposphere and is
oxidised there to sulphate particles, which then act as cloud condensation nuclei (CCN)
for marine clouds (Charlson et al., 1987). Both the nature of the DMS oxidation
mechanism as well as the quantification of the extent to which the oxidation product
H2SO4 contribute to new CCN is largely unknown. Further, DMS has an indirect impact

- 11 -
on the acidity of rainwater. The atmospheric DMS concentration varies seasonally,
dependent on phytoplankton blooms. The DMS production has been reported to be by
a factor of 20 higher in the summer compared to the winter in the Southern Indian
Ocean (Sciare et al., 2000).
2.1.2.2 Global anthropogenic sulphur emissions
The emission of sulphur compounds into the environment is undesirable because of
their acidifying characteristics. The global anthropogenic sulphur emissions have been
estimated to be in a range from 60 to 110 * 106 t S yr-1 (2 – 3 x 10¹² mol yr-1) for the
years 1976 to 1985 (Moller, 1984; Hameed and Dignon, 1988). The combustion of
fossil fuels accounts for 80 to 85% of the total.
2.1.2.3 Particulate sulphate
Sulphate compounds are emitted as primary, directly released and secondary
particles. The sources of primary sulphate particles include open pit mines, dry
lakebeds, and desert soils. Other sources of primary sulphate particles are various fuel
combustion processes from both stationary and mobile sources.
Secondary sulphate particles are produced in the atmosphere when oxides of sulphur
(SOx) are transformed into particles via physical and chemical processes. The main
source of SOx is stationary and mobile fuel combustion. The types of sources that emit
SO2 are generally located in urban areas. Secondary sulphate particles formed from
SO2 emissions can be transported over long distances. These transported sulphate
particles can comprise a significant portion of the ambient sulphate in some rural
areas.
2.1.3 Deposition of sulphate and sulphuric acid
Gases in the atmosphere can reach the surface by wet and dry deposition processes.
For wet deposition precipitation is the delivery mechanism to the surface. The gases
can dissolve in clouds and rain drops or adsorb to frozen precipitation elements.
Sulphate particles represent good condensation nuclei and may be scavenged by the
clouds.
Those deposition processes, which do not involve precipitation, are collectively termed
dry deposition. Sulphate can be chemically bound or adsorbed to small particles,
which then reach the surface by gravitational settling (Whelpdale, 1992). The direct
adsorption of SO2 to particles is still poorly understood.
Secondary particles formed through chemical reactions are typically much smaller
(<10 µm diameter) than particles derived from physical processes (>100 µm
diameter). The smallest particles in the atmosphere are the result of high temperature
combustion and gas to aerosol conversions.
Depending on the relative humidity and the presence of other atmospheric gases like
ammonia, the sulphuric acid formed will be removed directly in precipitation, or
neutralised and converted to ammonium sulphate. The atmospheric conversion of
sulphur dioxide to ammonium sulphate (Scheme 1) is an example of a gas to aerosol
conversion process. These particles will range in molecular mass from 50 to as many
as 10,000 amu.

- 12 -
Scheme 1
H2SO4 H+ + HSO4-
HSO4- H+ + SO4
2-
NH3 + H2O NH4+ + -OH
2 NH4+ + SO4
2- (NH4)2SO4(aq)
Thus, particles form through complex gas phase, heterogeneous, and liquid phase
reactions.
2.2 Nitrogen cycle
Elemental nitrogen (N2) is gaseous and the major constituent of air (78.09 % Vol.). By
this, 99 % of all nitrogen on earth occurs in the air. Chemically bound nitrogen can be
found as nitrate, and organic bound nitrogen in e.g. proteins or nucleic acids. Pure
nitrogen can be simply produced by fractionation of liquid air (Linde Process).
By its ability to have oxidation states ranging from –3 up to +6, numerous
combinations with other elements are possible. The most important reaction partners
are hydrogen (reduced form) and oxygen (oxidised forms). Especially ammonia is of
great importance for the world economy a.o. as fertiliser (Hollemann and Wiberg,
1985).
Nitrogen is also an essential nutrient for life, but only a few plants are able to use
elemental nitrogen as source. A variety of different bacteria are able to oxidise or
reduce nitrogen compounds to gain energy.
2.2.1 Emissions of nitrogen compounds to the atmosphere
Nitrogen dioxide (NO2) is a reddish brown, highly reactive gas that is formed in the air
through the oxidation of nitric oxide (NO). Nitrogen oxides (NOx), the term used to
describe the sum of NO, NO2 and other oxides of nitrogen, plays a major role in the
formation of ozone. The major sources of man-made NOx emissions are high-
temperature combustion processes, such as those occurring in automobiles and power
plants.
Nitrogen oxides also contribute to the formation of acid rain and to to a wide range of
other environmental effects, including: potential changes in the composition and
competition of some species of vegetation in wetland and terrestrial systems, visibility
impairment, acidification of freshwater bodies, eutrophication of estuarine and coastal
waters, and increases in levels of toxins harmful to fish and other aquatic life. The
consequence of eutrophication is an explosive algae growth leading to a depletion of
oxygen in the water.
2.2.1.1 Natural emissions of nitrogen
Atmospheric reactions of nitrogen are much more complex than the atmospheric
reactions of sulphur. Ammonia (NH3) is the most reduced form of nitrogen, and is
- 13 -
released in small quantities from anaerobic degradation of organic matter containing
nitrogen. Similar to hydrogen sulphide, ammonia reacts with the hydroxyl radical to
form oxidised nitrogen species. Nitrogen oxides are released to the atmosphere from
both natural and anthropogenic sources. The two most common nitrogen gases
released to the atmosphere from biological processes are nitrous oxide (N2O) and
nitrogen dioxide (NO2).
2.2.1.2 Anthropogenic emissions of nitrogen
Combustion processes release mostly nitrogen oxide (NO) and nitrogen dioxide (NO2).
The exact composition of nitrogen oxides emitted from combustion processes varies
with temperature of the combustion process, and the nitrogen oxides from combustion
are often referred to as NOx to indicate the uncertainty in chemical composition.
Like sulphur, the modern global nitrogen cycle is very different from the "Pre-
industrial" nitrogen cycle. The difference is the large amount of nitrogen added to the
atmosphere through combustion processes. The excess atmospheric nitrogen oxides
contribute to acid rain in the same way that excess sulphur oxides do. Tab. 3 lists the
important atmospheric nitrogen oxides and their oxidation states.
Tab. 3 Important Atmospheric nitrogen oxides
nitrogen oxide oxidation state
N2O +1
NO +2
NO2 +4
HNO3, N2O5 +5
NO3 +6
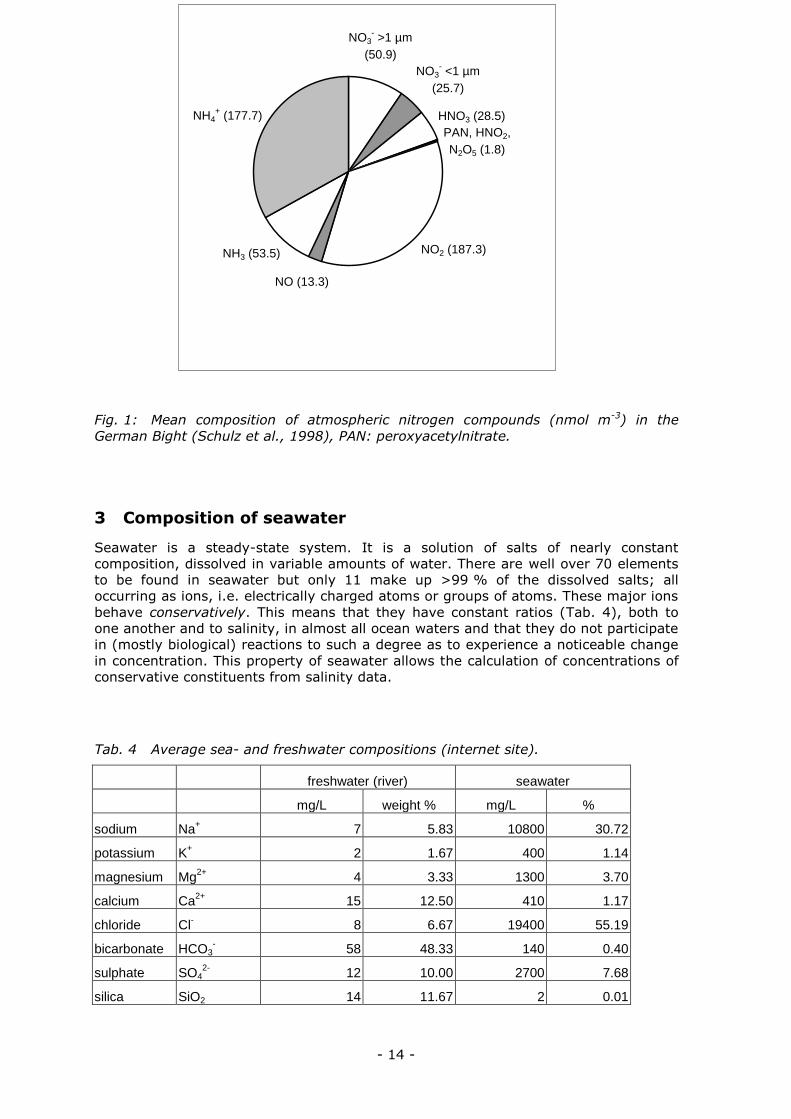
Atmospheric nitrogen compounds are transported over long distances (Schulz et al.
1998). During transport they undergo specific physical-chemical changes (Fig. 1).
NOx-compounds are typical anthropogenic precursors of oxidised nutrients like nitrate.
The extremely complicated reactions within the atmosphere are described in detail by
Holland (1978). For example, a dramatic change in the composition of aerosols
concerning sea-salt in the coastal area has been observed by Schulz et al. (1998).
This change is caused by the reaction of sodium chloride with the (anthropogenic)
nitric acid. The chloride of the sea-salt is exchanged by nitrate and hydrochloric acid is
formed:
NaCl + HNO3 NaNO3 + HCl
By this reaction up to 55 % of the original sodium chloride in aerosols may be
replaced by sodium nitrate during winds from the main land. These extremely
hygroscopic aerosols are easily deposited because of their high mass.
Sodium chloride containing particles, originating from sea spray, are highly enriched in
the coastal atmosphere. Contents of up to several 10 mg Cl-/m³ have been
determined which rapidly decrease landwards. Thus, a remarkable amount of nitrogen
deposition occurs in the coastal area. Schulz et al. (1998) regard this reaction as one
of the most important sinks for oxidised nitrogen compounds in the coastal marine
atmosphere.
- 14 -
Fig. 1: Mean composition of atmospheric nitrogen compounds (nmol m-3) in the
German Bight (Schulz et al., 1998), PAN: peroxyacetylnitrate.
3 Composition of seawater
Seawater is a steady-state system. It is a solution of salts of nearly constant
composition, dissolved in variable amounts of water. There are well over 70 elements
to be found in seawater but only 11 make up >99 % of the dissolved salts; all
occurring as ions, i.e. electrically charged atoms or groups of atoms. These major ions
behave conservatively. This means that they have constant ratios (Tab. 4), both to
one another and to salinity, in almost all ocean waters and that they do not participate
in (mostly biological) reactions to such a degree as to experience a noticeable change
in concentration. This property of seawater allows the calculation of concentrations of
conservative constituents from salinity data.
Tab. 4 Average sea- and freshwater compositions (internet site).
freshwater (river) seawater
mg/L weight % mg/L %
sodium Na+ 7 5.83 10800 30.72
potassium K+ 2 1.67 400 1.14
magnesium Mg2+
4 3.33 1300 3.70
calcium Ca2+
15 12.50 410 1.17
chloride Cl- 8 6.67 19400 55.19
bicarbonate HCO3- 58 48.33 140 0.40
sulphate SO42-
12 10.00 2700 7.68
silica SiO2 14 11.67 2 0.01
NH4+ (177.7)
NH3 (53.5)
NO3- >1 µm
(50.9)
NO2 (187.3)
NO3- <1 µm
(25.7)
PAN, HNO2,
N2O5 (1.8)
HNO3 (28.5)
NO (13.3)

- 15 -
As well as major elements, there are many trace elements in seawater - e.g.,
manganese (Mn), lead (Pb), gold (Au), iron (Fe) and iodine (I). Most of these occur in
parts per million (ppm) or parts per billion (ppb) concentrations. In contrast to the
major elements, the relative abundance of trace elements are variable.
Although freshwaters display high variability in their composition the most abundant
ions in river water are bicarbonate and calcium (Tab. 4). Compared to seawater, the
abundance of bicarbonate is only 2.6 times less. Bicarbonate plays an important role
in pH buffering (chapter 3.3).
Non-conservative substances dissolved in seawater are, among others, some gases
(e.g. oxygen and carbon dioxide) and inorganic nutrients. These are essential for the
growth of plants, including algae. Major nutrients include nitrate, phosphate, and
silicate (the latter required only by silicate depositing organisms). Nutrients are
usually depleted in surface waters, where plants grow, and are found in higher
concentrations in deeper waters, where the plant and animal remains that sink from
surface waters decay.
3.1 Marine sulphur cycle
The large amount of sulphate in seawater (2.65 g L-1) derives from volcanic activities
and degassing at the seafloor. Further, sulphates reach the oceans via river flows, but
the concentration in seawater remains constant at around 2.65 g L-1. A small part of
the total sulphate load in rivers comes from the natural weathering of pyrite and
gypsum. In addition, the water cycle carries recycled sulphate of marine origin.
However, most of the riverine sulphate derives from human activities, e.g. mining,
erosion and air pollution. Current fluxes are double those in pre-industrial times.
Sulphate is conservative in oxic oceans but not in anoxic basins or within sediments.
Sulphate is used by sulphate reducing bacteria to form HS or H2S. Bacteria carry out
various transformations of sulphur (Fig. 2).

- 16 -
Fig. 2: Scheme of the microbiological cycle of sulphur and its possible influence on
the atmosphere
1.Sulphate reduction in anaerobic environments (CH2O represents organic matter as carbohydrates)
2 CH2O + 2 H+ + SO42- H2S + 2 CO2 + 2 H2O
This reaction is analogous to aerobic respiration but with SO42- rather than oxygen
acting as the terminal electron acceptor in the oxidation reaction. The H2S produced
may precipitate as authigenic minerals such as greigite, mackinawite and pyrite or
may be used in one of the following reactions:
2.Sulphur-based (anaerobic) photosynthesis
2 H2S + CO2 CH2O + 2 S + 2H 2O
This reaction is probably the earliest form of photosynthesis using H2S rather than H2O
as the hydrogen donor in the reduction of CO2. Today it is employed by green and
purple sulphur-bacteria .
3.Chemoautotrophy under oxic conditions:
4 H2S + CO2 + O2 CH2O + 4 S + 3 H2O
This reaction is performed by species of Thiobacilli in environments with free
elemental sulphur or with H2S, for example near deep-sea hydrothermal vents.
3.2 Marine nitrogen cycle
In contrast to sulphate, nitrate is strongly linked to primary production in the sea. The
general seasonal development of nutrient concentrations in seawater is characterised
by a decrease during springtime (Fig. 3). During phytoplankton blooms, inorganic
nitrate is transformed into organic nitrogen compounds such as proteins or nucleic
acids. In summer, the nutrients reach a minimum leading sometimes to limitation of
certain nutrients. Remineralisation processes in the sediment may support a second
phytoplankton bloom in late summer. In autumn, nutrients increase because of low
primary production to maximum concentrations in winter.

- 17 -
NUTRIENTS
PLANKTON
BIOMASS
JAN FEB MAR APR MAY JUN JUL AUG SEP OCT NOV DEC
low pH
high pH
Fig. 3: Schematic seasonal variation of nutrients and phytoplankton biomass in
temperate areas.
Deposition of organic material (plankton and detritus) into surface sediments supports
benthic mineralisation. Mineralisation of organic nitrogen compounds occurs in several
enzymatic steps (proteins - peptides - amino acids). Finally ammonia is liberated from
amino acids by deamination. Degradation of organic material by heterotrophs leads to
dissolved inorganic nitrogen (DIN) again (Schlegel, 1981). Ammonia production is
highest under anoxic conditions (Fig. 4). The concentration of ammonia in the
porewater is governed by production, adsorption to particles, diffusion and reaction
processes.
- 18 -
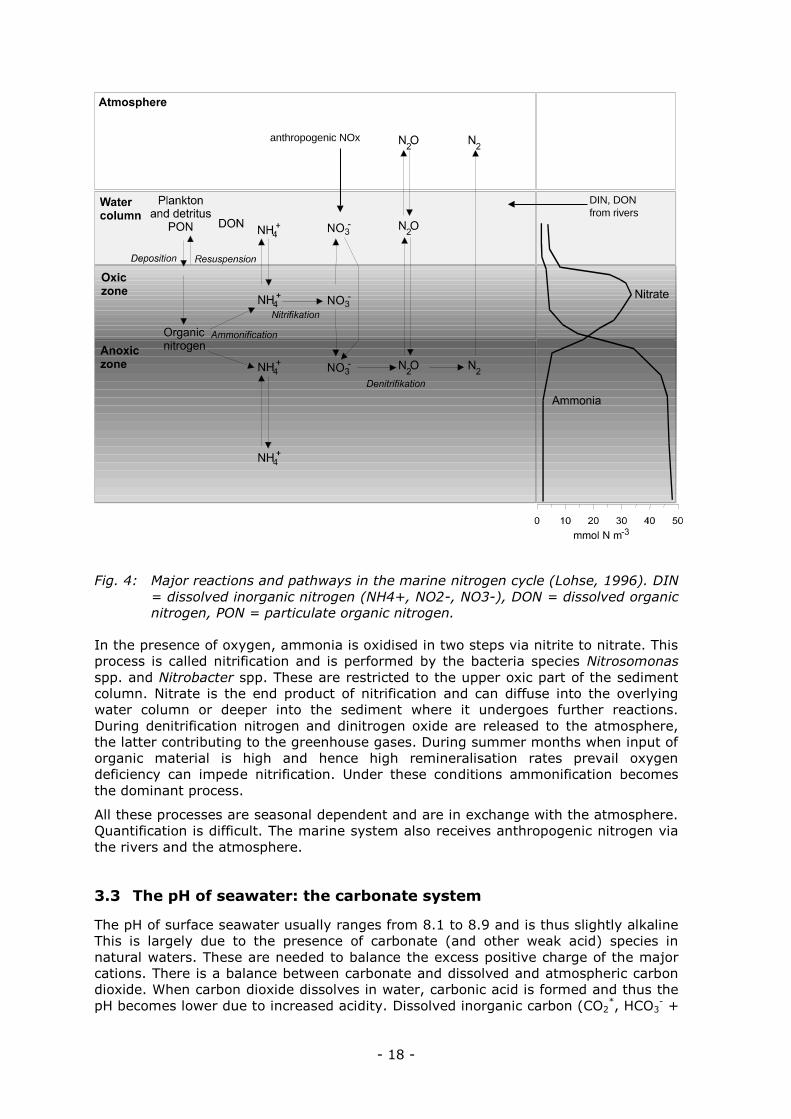
Fig. 4: Major reactions and pathways in the marine nitrogen cycle (Lohse, 1996). DIN
= dissolved inorganic nitrogen (NH4+, NO2-, NO3-), DON = dissolved organic
nitrogen, PON = particulate organic nitrogen.
In the presence of oxygen, ammonia is oxidised in two steps via nitrite to nitrate. This
process is called nitrification and is performed by the bacteria species Nitrosomonas
spp. and Nitrobacter spp. These are restricted to the upper oxic part of the sediment
column. Nitrate is the end product of nitrification and can diffuse into the overlying
water column or deeper into the sediment where it undergoes further reactions.
During denitrification nitrogen and dinitrogen oxide are released to the atmosphere,
the latter contributing to the greenhouse gases. During summer months when input of
organic material is high and hence high remineralisation rates prevail oxygen
deficiency can impede nitrification. Under these conditions ammonification becomes
the dominant process.
All these processes are seasonal dependent and are in exchange with the atmosphere.
Quantification is difficult. The marine system also receives anthropogenic nitrogen via
the rivers and the atmosphere.
3.3 The pH of seawater: the carbonate system
The pH of surface seawater usually ranges from 8.1 to 8.9 and is thus slightly alkaline
This is largely due to the presence of carbonate (and other weak acid) species in
natural waters. These are needed to balance the excess positive charge of the major
cations. There is a balance between carbonate and dissolved and atmospheric carbon
dioxide. When carbon dioxide dissolves in water, carbonic acid is formed and thus the
pH becomes lower due to increased acidity. Dissolved inorganic carbon (CO2*, HCO3
- +
DIN, DON
from rivers
anthropogenic NOx

- 19 -
CO32- ) varies by ~20 % due to vertical transport in the water column and
remineralisation of both CaCO3 and organic matter.
Natural changes of seawater pH are related to primary production, which converts
inorganic to organic carbon, and degradation of the produced material (Fig. 3).
Photosynthetic activity increases the pH while the opposite, organic matter
remineralisation, leads to a decrease in pH values.
The ability to neutralise acids and bases to a certain extent is termed the buffer
capacity or alkalinity of seawater. Total alkalinity is measured by measuring the
amount of acid (e.g. sulphuric acid) needed to bring a sample of seawater to a pH of
4.2. At this pH, all the alkaline compounds in the sample are "used up." The result is
reported as milligrams per litre of calcium carbonate (mg L-1 CaCO3).
The amount of bicarbonate and other weak bases in seawater buffers the system, thus
keeping the pH within a narrow range. Dissolved CO2 and carbonates belong to the
buffer system and are all related by the following four equations:
1. CO2 + H20 <------> (CO2)aq
2. (CO2)aq + H20 <------> H2CO3 (carbonic acid)
3. H2CO3 <------> H+ + HCO3- (bicarbonate)
4. HCO3- <------> H+ + CO3
2- (carbonate)
(CO2)aq and H2CO3 are difficult to measure and are usually given as CO2*. The solubility
of CO2 in water is 1,7 g L-1 (0,04 mol L-1) and is governed by Henrys Law, assuming
ideal gas behaviour:
SCO2 = [CO2] = KH* pCO2
I.e. the solubility (S) of a gas is proportional to its partial pressure (pA).
Henry's law is derived from
KD = [CO2(aq)]/[CO2(gas)]
[CO2(gas)] = pCO2/RT {Dalton's law of partial pressure}
[CO2(gas)] = (KD/RT) pCO2 = KH* pCO2 {KH [mol L-1 atm-1]}
As the carbonate system encompasses polyprotic acids, it is able to buffer against
changes in pH caused by addition of either acid and base:
H+ + HCO3- <------> H2CO3
H+ + CO32- <------> HCO3
-
OH- + HCO3- <------> H2O + CO3
2-
OH- + H2CO3 <------> H2O + HCO3-
As calcium carbonate (solid) reacts with water in presence of free hydrogen ions, the
solid calcium carbonate dissolves forming free Ca+2 ions and free bicarbonate ions,
hence consuming free hydrogen ions, decreasing hydrogen ion activity, and by
definition increasing pH (becoming more basic). i.e. calcium carbonate acts to
neutralise or buffer the solution by consuming hydrogen ions.
Both, carbonic acid and bicarbonate are weak acids with pK values of pK1 = 6.5, pK2 =
10.4. When pure water is equilibrated with CO2 the system is defined by two
independent variables (in addition to total pressure), e.g. temperature and pCO2. From
this the equilibrium concentrations, all components can be calculated using Henry's
law, the acidity constants and the proton condition or charge balance, if besides
temperature one other variable such as pCO2, [CO2*] of [H+] is known.

- 20 -
The pH of a pure aqueous CO2 solution is defined by the charge balance
[H+] = [HCO3-] + 2 [CO3
2-] + [OH-]
If the system is kept in equilibrium with constant pCO2, the pH can be varied only by
addition of a base CB or an acid CA. Electroneutrality must be observed for such an
addition.
As B is equivalent to the concentration of a monovalent cation (e.g. [Na+] from NaOH)
and A is equivalent to the concentration of a monovalent anion (e.g. [Cl-] from HCl).
CB + [H+] = [HCO3-] + 2 [CO3
2-] + [OH-] + CA
CB - CA = CT ([OH-] - [H+]
with CT = total CO2 concentration,
x = Bunsen coefficient (x = KH * 22,414 [atm-1]
CB - CA is the acid neutralising capacity of the solution with respect to the pure
solution of CO2. This difference is defined as the alkalinity.
KH pCO2
[Alk] = CB - CA = ------------- ([OH-] - [H+]
This model has three independent variables in addition to total pressure. It is
therefore sufficient to give T, pCO2, and alkalinity to define the system. The pH is given
by [Alk] and pCO2.
There are other bases than those present in the carbonate system are present in
seawater, which contribute to total alkalinity. These are B(OH)4-, HPO4
2- and PO43- and,
under specific environmental conditions, hydrogen sulphide HS-.
If this is included then
CB + [H+] = [HCO3-] + 2 [CO3
2-] + [B(OH)4-] +[OH-] + CA
CB - CA = CT (BTB[OH-] - [H+]
with BT = [H3BO3] + [B(OH)4-] and B = [B(OH)4
-]BT
and
KH pCO2
[Alk] = CB - CA = ------------- (BTB- + [OH-] - [H+]
In the system containing only carbonate species alkalinity is commonly referred to as
titration or carbonate alkalinity (CA). Incorporating other bases alkalinity is then
referred as total alkalinity (TA). CA and TA differ by about 100 µequivalents L-1 only.
TA of seawater averages 116 mg L-1 and is greater than fresh water, which vary
significantly, depending on the drainage area. TA can have a total alkalinity of 30 to
90 mg L-1. Brackish waters like in estuaries, where river water is mixed with seawater,
have TA varying between these values.
The pH values after addition of acid or base can be calculated using the above
equation(s) taking into account ionic strength effects on the constants. Corrected
values are tabulated.
The neutralisation of sulphuric acid in seawater occurs in two steps:
1. H2SO4 + H2O HSO4- + H3O
+ pKS (H2SO4) = -3
2. HSO4- + H2O SO4
2- + H3O+ pKS (HSO4
-) =1.92
Both, sulphuric acid and hydrogen sulphate have low pKs values (-3 and 1.92,
respectively), and are hence strong acids dissociating completely. Therefore all
protons of the sulphuric acid contribute to the pH-shift. The carbonate system will

- 21 -
buffer the additional protons by the release of CO2 to keep the pH constant. One
molecule sulphuric acid will therefore produce 2 molecules CO2. The equations 1-3 of
the carbonate system (see above) will shift from the right to the left sides, finally
releasing the dissolved CO2 to the atmosphere.
3.4 Laboratory measurements
A model of Abdulsattar et al. (1977) allows the prediction of the pH of effluent from
seawater scrubbers, but leads to an overestimation of acidity (Baalina, et al., 1997).
The reason is that the oxidation of SO2 to SO42- is not taken into account. Further, the
temperature of the seawater has an impact on pH (Hunter, 1998). The calculations in
the previous chapter are based on an ideal seawater composition and do not take
other seawater constituents into account (e.g. organic acids like amino or humic
acids). As the above described equations are simplified and some data are difficult to
obtain or absent, laboratory measurements were carried out at Terramare to quantify
the ability of seawater to buffer sulphuric acid solutions.
3.4.1 Impact of diluted sulphuric acid (pH 4) on seawater
To mimic the conditions of the seawater scrubber effluent, concentrated sulphuric acid
(98 %) was diluted with seawater to a pH of 4 (assumed worst case for scrubber
effluent, Ref 1.4.1). The amount of sulphuric acid in 1 L was 1.25 g H2SO4. Assuming
that this effluent would be discharged directly to the sea, this solution was added in
small portions to natural seawater (salinity = 29 PSU), taken at the Nassau Bridge in
Wilhelmshaven, Germany in October 2002. The concentration of the sulphuric was
recalculated, because of the changing end-volume. The pH shift, caused by the
addition of sulphuric acid was measured directly (Fig. 5).
0
100
200
300
400
500
600
7.4 7.5 7.6 7.7 7.8 7.9 8 8.1 8.2 8.3 8.4 8.5
pH
concentr
ation o
f sulp
huric a
cid
in s
eaw
ate
r
[mg/L
]
raw data
Y = (A+X)/(B+C*Xexp2)
Fig. 5: Impact of sulphuric acid (pH 4) on the pH of seawater (S = 29 PSU)
corresponds to regression line.
The addition of 54 ml seawater adjusted to pH 4 (68 mg sulphuric acid) to 500 mL
seawater results in a total volume of 554 mL, which caused a pH-shift of pH 0.1 units

- 22 -
only. The end-concentration is therefore 68 mg in 554 mL, or 1.2476 mmol sulphuric
acid L-1 (2.49 mmol H+). This corresponds with a mixture of 1:10 (v:v, sulphuric acid
in seawater pH 4 : natural seawater). Even a mixture of 1:5 (2.54 mmol sulphuric
acid L-1, or 5.08 mmol H+ L-1) only caused a pH-shift of 0.23.
The scrubber effluent is diluted with natural seawater ten times. Thus, the
requirements of US-EPA (1976) that changes in pH shall not exceed 0.2 units for
marine waters are fulfilled.
The regression line in Fig. 5 was calculated using the Lab-Fitting software.
The equation for the regression line is:
Y = (A+X)/(B+C*X2); R2 = 0.999
A = -8.43463908
B = -0.00536647
C = 0.00006588
3.4.2 Impact of diluted sulphuric acid (pH 4) on brackish waters
In a second experiment, the same test was carried out with brackish water (Ems-Jade
Kanal, Wilhelmshaven, Salinity = 14 PSU). Different ratios of the original and the
acidified brackish water (pH 4) were mixed. The pH was measured directly after
mixing, and after stirring the solutions for 1 hour again. Within this time, the
carbonate system was able to buffer the pH by release of CO2 to the atmosphere,
while the pH increased again (Tab. 5, Fig. 6).
Tab. 5: Percentage of sulphuric acid (pH 4) in brackish water with resulting pH (t = 0
and t = 1 h)
Percent sulphuric acid
in brackish water (pH
4)
[%]
Percent natural
brackish water
[%]
pH
measured
immediately
pH
measured
after 1 hour
pH between
t = 0 and
t = 1 h
0 100 7.60 7.63
10 90 6.63 7.50 0.87
20 80 6.52 7.35 0.83
30 70 6.45 7.02 0.57
40 60 6.31 7.01 0.70
50 50 6.08 6.88 0.80
60 40 5.85 6.47 0.62
70 30 5.63 6.15 0.52
80 20 5.38 5.65 0.27
90 10 4.54 4.95 0.41
100 0 4.03 4.07

- 23 -
0
10
20
30
40
50
60
70
80
90
100
3 4 5 6 7 8pH
pe
rce
nta
ge
acid
ifie
d b
rackis
h w
ate
r
pH immediately measured
pH after 1 h stirring
Fig. 6: Percentage of sulphuric acid (pH 4) in brackish water with resulting pH (t = 0
and t = 1 h).
The test with the brackish water (S = 14 PSU) showed that the same dilution factor of
1:10 caused an immediate shift of about 1 pH-unit. After one hour the pH returned to
almost its original value (pH = 0.1). These preliminary experiments show that the
addition of sulphuric acid in seawater to pure seawater is not only dependent on the
amount of sulphuric acid, but also on time. The carbonate system reacts in two steps:
first the production of dissolved (CO2 aq)), second the release of gaseous carbon
dioxide (CO2 (g)) from the system, to keep the pH almost constant.
3.5 Summary of laboratory experiments
The experiments with the hypothetical effluent of the SWS (pH 4) showed that even
with a dilution factor of only 10, the discharge would not change the pH of the
receiving sea water more than 0.2 standard units. Brackish water reacted with a
spontaneous pH shift around 1, but returned within one hour almost to the original pH
(pH shift 0.1).
These measurements were carried out in closed systems, where only gas-exchange
was allowed. To transform these results to realistic conditions, like in this case the
impact of a sulphuric acid discharge from a (moving) ship into the sea, more factors
have to be taken into account. The mixing of the effluent with seawater is dependent
on the current speed of the water. This parameter varies geographically. Additionally,
tidal currents vary hourly. In estuaries, the exchange rate with the open sea and the
inflow of freshwater are important factors.

- 24 -
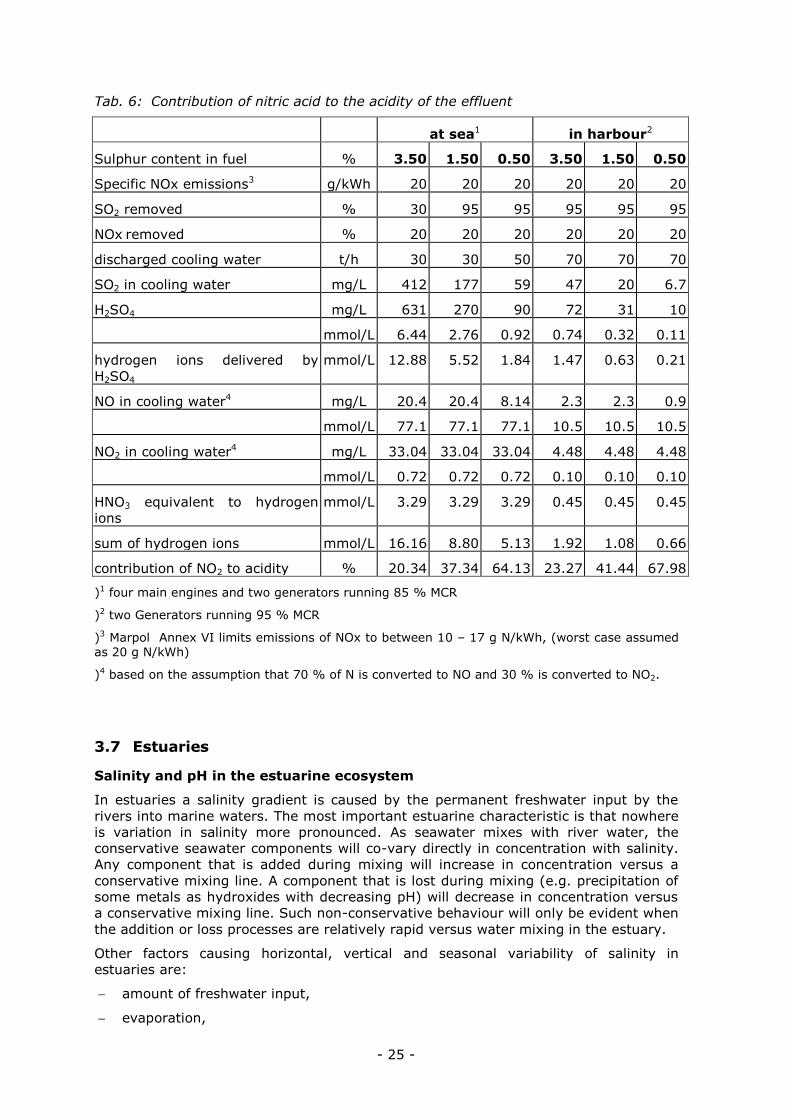
3.6 Impact of the acidic effluent of the EcoSilencer on the pH of the receiving water
In chapter 1.4.1 the theoretical composition of the effluent is described. The lowest pH
would be 4.8. The experiments were carried out with acidified seawater pH 4,
representing an assumed worst case. Next to sulphuric acid, nitric acid contributes to
the acidity of the effluent, but to a lesser extent.
1. NOx reduction is around 20 %, compared to 95 % SO2 reduction
2. Nitric acid delivers only one hydrogen ion per mol, whereas sulphuric acid delivers
two hydrogen ions.
Based on data delivered by DME for different scenarios (ship in service and ship in
harbour) and sulphur contents of the fuel, the composition of the resulting effluent
was calculated (Tab. 6). Noticeable is the changing amount of cooling water, which is
finally discharged. This variable has a significant impact on the concentrations.
The maximum relative contribution of nitrate to the acidity is calculated to be 9.66 %,
but this is of minor importance regarding the pH of the discharged effluent and its
impact on the environment. The proportion of nitric acid is relevant, as it delivers
nitrate to the marine system.
The calculations are base on data obtained from DME about the EcoSilencer. The SO2
adsorbing recirculation water is diluted with cooling water (seawater) and discharged
at a pH level between 4.5 and 5.5. The laboratory experiments showed that a dilution
of the effluent with seawater of 1:10 causes a pH-shift less than 0.2 pH units.
- 25 -
Tab. 6: Contribution of nitric acid to the acidity of the effluent
at sea1 in harbour2
Sulphur content in fuel % 3.50 1.50 0.50 3.50 1.50 0.50
Specific NOx emissions3 g/kWh 20 20 20 20 20 20
SO2 removed % 30 95 95 95 95 95
NOx removed % 20 20 20 20 20 20
discharged cooling water t/h 30 30 50 70 70 70
SO2 in cooling water mg/L 412 177 59 47 20 6.7
H2SO4 mg/L 631 270 90 72 31 10
mmol/L 6.44 2.76 0.92 0.74 0.32 0.11
hydrogen ions delivered by
H2SO4
mmol/L 12.88 5.52 1.84 1.47 0.63 0.21
NO in cooling water4 mg/L 20.4 20.4 8.14 2.3 2.3 0.9
mmol/L 77.1 77.1 77.1 10.5 10.5 10.5
NO2 in cooling water4 mg/L 33.04 33.04 33.04 4.48 4.48 4.48
mmol/L 0.72 0.72 0.72 0.10 0.10 0.10
HNO3 equivalent to hydrogen
ions
mmol/L 3.29 3.29 3.29 0.45 0.45 0.45
sum of hydrogen ions mmol/L 16.16 8.80 5.13 1.92 1.08 0.66
contribution of NO2 to acidity % 20.34 37.34 64.13 23.27 41.44 67.98
)1 four main engines and two generators running 85 % MCR
)2 two Generators running 95 % MCR
)3 Marpol Annex VI limits emissions of NOx to between 10 – 17 g N/kWh, (worst case assumed as 20 g N/kWh)
)4 based on the assumption that 70 % of N is converted to NO and 30 % is converted to NO2.
3.7 Estuaries
Salinity and pH in the estuarine ecosystem
In estuaries a salinity gradient is caused by the permanent freshwater input by the
rivers into marine waters. The most important estuarine characteristic is that nowhere
is variation in salinity more pronounced. As seawater mixes with river water, the
conservative seawater components will co-vary directly in concentration with salinity.
Any component that is added during mixing will increase in concentration versus a
conservative mixing line. A component that is lost during mixing (e.g. precipitation of
some metals as hydroxides with decreasing pH) will decrease in concentration versus
a conservative mixing line. Such non-conservative behaviour will only be evident when
the addition or loss processes are relatively rapid versus water mixing in the estuary.
Other factors causing horizontal, vertical and seasonal variability of salinity in
estuaries are:
amount of freshwater input,
evaporation,

- 26 -
water density (vertical variability),
tides and
the Coriolis effect
Human activities that cause significant, short-term fluctuations in pH or long-term
acidification of a water body are exceedingly harmful. For instance, algal blooms that
are often initiated by an overload of nutrients in the rivers can cause pH to fluctuate
dramatically over a few hours' period. Changes of the pH can greatly stress local
organisms.
The pH of an estuary can vary from 7.0 to 7.5 in the fresher, low salinity sections to
between 8.0 and 8.6 in the more marine parts. The slightly alkaline pH of seawater is
due to the natural buffering from carbonate and bicarbonate dissolved in the water
(chapter 3.3). The pH of water is critical to the survival of most aquatic plants and
animals. Many species have trouble surviving if pH levels drop below 5.0 or rise above
9.0 (Fig. 7).
Fig. 7: pH ranges that support aquatic life (source: see Internet-sites)
most acid neutral most basic
0 1 2 3 4 5 6 7 8 9 10 11 12 13 14
Bacteria
Plants (algae, rooted, etc)
Carp, suckers, catfish, some insects
Bass, bluegill, crappie
Snails, Clams, mussels
Largest variety of animals
(Trout, mayfly nymphs, stonefly nymphys,
caddishfly larvae)
pH ranges that support aquatic life.
Changes in pH can alter other aspects of the water's chemistry, usually to the
detriment of native species. Even small shifts in the water's pH can affect the solubility
of some metals such as iron and copper. Such changes can influence aquatic life
indirectly. If the pH levels are lowered, toxic metals in the estuary's sediment can be
re-dissolved in the water column. This can have impacts on many aquatic species.
3.7.1 Harbour areas like the Port of Rotterdam
The port of Rotterdam is a very complex area, with vital inflow from the North Sea and
several rivers and canals. The complex geometry and hydrography of the port of
Rotterdam was approached in the Mam-Pec model (in CEPE report, 1999) with two
different scenarios. In the first scenario the geometry of the Rotterdam port area was
conceptualised as a rectangular area (2 x 20 km; 4000 ha; depth 20 m), with a 5 km
wide open front to the river in order to mimic a harbour segment with an average
water exchange of 32 % per tidal period. A second scenario, with a 10 km wide open
front to the river was chosen to represent harbour segments with a water exchange of
65 % per tidal period. The hydrodynamic exchange in the Mam-Pec model is derived
from the following parameters: density differences (between marine and freshwater),
tidal period and height, river flux and the dimensions of the rectangular port area.
Shipping:

- 27 -
The Port Statistics 2001 of the Port Rotterdam show that the number of ship arrivals
of seagoing vessels is around 30 000/a in the recent years and 133 000 arrivals of
inland vessels per year. Movements of seagoing vessels are on average 82 000/a.
Within the EU the port of Rotterdam has the maximum NOx, SO2 and CO2 emissions.
Tab. 7: Ports in the EU ranked by estimated annual emissions of NOx in 2000 reported
by Entec, 2002.
Rank Port Name Country
Code
NOx [kT] SO2 [kT] CO2 [kT]
1 Rotterdam NLD 3.8 3.7 219.9
2 Antwerp BEL 2.2 2.2 134.0
3 Milford Haven GBR 2.0 2.2 130.4
4 Hamburg DEU 2.0 1.9 115.5
5 Augusta ITA 1.8 2.0 121.4
6 Agioi Theodoroi GRC 1.7 1.8 107.0
7 Piraeus GRC 1.6 1.6 93.9
8 Eleusis GRC 1.5 1.6 95.1
9 Gothenburg SWE 1.5 1.5 91.1
10 Immingham GBR 1.3 1.4 82.0
A rough calculation using data from Tab. 7 indicates that on an annual basis total SO2
discharge into Rotterdam port waters will contribute about 2 x 10⁻⁴ mol H+/L assuming
that all SO2 will be transferred to the aqueous phase. Using data from Table 6 and
assuming the presence of 100 vessels in the port area, the H+ concentrations will
increase by 5.7, 9.4 and to 16.7 x 10⁻⁶ mol H+/L h for 0.5 %, 1.5 % and 3.5 %
sulphur fuel. This corresponds to 0.5 – 2 pH units. This calculation does not take into
account the buffer capacity of seawater, the exchange of CO2 with the atmosphere,
nor the tidal exchange with the open sea. Preliminary experimental data presented
above (chapter 3.4) suggest that the re-equilibrium is rapid although effects of
continuous addition of acid need to be investigated in detail.
3.8 The Baltic Sea
The Baltic Sea is a relatively shallow inland sea surrounded by the countries of North-
eastern Europe and Scandinavia. Its total area is about 377,400 km2, and its volume
about 21,000 km3. The catchment area extends over an area about four times as large
as the sea itself. The mean depth is 55 m, while the maximum depth is 459 m in the
Landsort Deep. The Baltic also receives surface water drainage from five other
countries: Belarus, Czech Republic, Slovak Republic, Norway, and Ukraine.
The Baltic Sea is connected to the North Sea through narrow and shallow sounds
between Denmark and Sweden. The outlet consists of a series of basins separated by
shallow sills, which obstruct efficient water exchange. Consequently, it takes 25 - 35
years for all the water from the Baltic Sea to be replenished by water from the North
Sea and beyond.
Salinity in the Baltic varies from fully marine at the Skagerrak/Kattegatt boundary to
almost fresh water conditions in the Bothnian Gulf. Due to the high riverine input of
fresh water a pronounced year-round stratification of the water column, especially in
the Baltic Proper, can be observed. This results in a reduced mixing of surface with
bottom waters. Ice coverage occurs regularly in the northern parts.

- 28 -
More than 500 million tonnes of cargo are transported across the Baltic Sea each year,
along many busy shipping lanes. More than 50 passenger ferries also ply routes
between Baltic ports.
3.8.1 Vital inflow from the North Sea
The inflow of water from the North Sea is the main source of oxygen for the deep
waters of the Baltic Proper, and is very significant for nutrient cycles throughout the
Baltic Sea. A stagnation period of more than sixteen years ended in January 1993
when masses of high-salinity water entered the Baltic, and for the first time since
1977, the Baltic Sea was free of hydrogen sulphide. Unfortunately, the effects of this
water exchange did not last, and within a couple of years the depths of the Eastern
Gotland Basin were again becoming anoxic. In 1996 hydrogen sulphide was once more
recorded in the depths of the Bornholm and Eastern Gotland Basins. Contaminants
and nutrients enter the Baltic Sea in rivers, in runoff from coastal areas, through
exchange of water with the North Sea, through atmospheric deposition, and due to
human activities at sea. A complete water renewal takes about 25-30 years, so
persistent pollutants can remain in the Baltic for a long time.
3.9 Acidification of surface waters
The deposition of atmospheric acids is not a recent phenomenon, but the extent of the
consequences are still unclear. Acidification of soils and surface waters is to some
extent a natural process but has accelerated in the last decades. The main causes of
acidification are acid rain and the use of certain fertilisers in agriculture, which reach
the oceans by surface water runoff and rivers. A drop of the pH to 5.5 in soil for
example causes a decline in agricultural harvests as certain micronutrients become
less available and microbial turnover of nitrogen and carbon are impaired.
The acidity of a water body is dependent on the amount of acid deposited, the amount
of acid already present in the water body, and the ability of the water body to absorb
and neutralise acid (buffer capacity). Seawater has a tremendous ability to neutralise
acids, so significant acidification does not occur in coastal waters and most estuaries.
Some freshwater bodies, however, may be very sensitive to atmospheric inputs of
acidic compounds (US EPA, 1976).
The overall effects of seawater acidification on marine ecosystems are not clear yet.
For example the potentially harmful effects of changing environmental CO2
concentrations on energy metabolism and growth of marine invertebrates fishes still
have to be studied in detail.
Acidification affects ecosystems in many ways. Aquatic organisms in acidified waters
often suffer from calcium deficiencies which can weaken bones and exoskeletons and
can cause eggs to be weak or brittle. It also affects the permeability of fish
membranes and, particularly, the ability of gills to take up oxygen from the ambient
water. Additionally, increasing amounts of acid in a water body change the mobility of
certain trace metals like aluminium, cadmium, manganese, iron, arsenic, and
mercury. Species that are sensitive to these metals, particularly fish, can suffer as a
result. The effects of acidification on aluminium mobility has received the most
attention because this metal is toxic to fish. The effects of increasing levels of
cadmium and mercury, which are atmospheric pollutants of concern for water quality,
are also becoming known.

- 29 -
3.10 Experiences with acid disposals at sea.
The waste of titanium dioxide production contains heavy metals and sulphuric acid
(around 12 %; Rat von Sachverständigen, 1981; Carlson, 1986). Beginning in 1969
this waste was dumped into the sea about 12 nautical miles north of Heligoland in the
central German Bight with increasing amounts. This disposal was stopped in 1989,
because the heavy metal content of the acid caused dramatic changes in the
ecosystem. At that time 750 000 t of sulphuric acid (12 %) were dumped into the sea
per year. The pH of the water in the disposal area changed only slightly, due to the
buffer capacity of the receiving seawater (Dethlefsen, 1990).
Data provided by Weichart (1975) indicate that pH changes resulting from titanium
dioxide waste dumping were within the range of naturally occurring pH values. Even in
the core of the screw water of the dumping vessel in 5 - 10 m water depth the pH
after one hour was 7.77, increasing to 8.04 after 4.7 h and 8.15 after 4.7 h. With the
exception of fresh screw waters no indications of long term pH changes were found.
3.11 Eutrophication effects
Any inorganic nitrogen and phosphorus compound added to natural waters will
promote primary productivity. Enhanced production of biomass can lead to
eutrophication effects under certain circumstances.
In marine systems phytoplankton biomass is usually produced in -within limits- fixed
relations of carbon : nitrogen: phosphorus, the so-called Redfield ratio of 106 : 16 :1.
Thus, any mole P added will result in the fixation of 106 moles carbon and 16 moles
nitrogen.
In cases where only nitrogen is added as in scrubber effluents the extent to which
additional biomass is produced will depend not only on the actual amount added but
also on the phosphorus available for primary production. In open ocean situations P is
generally regarded as the limiting nutrient. Here, additional N will not have any effects
on planktonic biomass production.
In near-shore or harbour situations, where P is available from e.g. riverine inputs,
runoff from agriculture or direct input of domestic sewage, addition of inorganic
nitrogen may lead to enhanced primary production.
On the other hand, addition of nitrogen may also have beneficial effects as it
counteracts the development of cyanobacteria blooms which may occur in the absence
of inorganic nitrogen when there is still sufficient phosphorus in the euphotic zone.
Certain cyanobacteria are able to use molecular nitrogen instead of nitrate or
ammonia. This is often the case in the Baltic Sea where such blooms occur regularly.
Here, phosphate is still present in measurable quantities even after the phytoplankton
spring bloom has reduced nitrate levels to below the detection limit (Wasmund et al.
2001).
Based on the assumption that there will be ample phosphate then an input of 3.29 or
0.45 mmoles NO3-/L, respectively, (Tab. 4) will result in an additional biomass
production of 43.6 or 6 mg/L assuming that carbon accounts for 50 % of the produced
biomass. This figure, however, does not include further dilution of the scrubber input
by turbulent mixing along the ship's path.
Primary production, at least in temperate and polar regions, is strongly connected to
the seasonality of insolation. This results in high productivity in spring when there are
sufficient inorganic nutrients available and lower ones in summer and early autumn
when nutrients are production limiting. Thus, relative contributions of additional
nitrogen-containing nutrients will be low in spring but higher in summer. Furthermore,

- 30 -
inter-annual variability will also have an effect on the relative contribution of any
additional nitrogen added.
In coastal areas and harbours neither P and N are usually production limiting factors.
Here, it is rather the avilability of light which prevents usage of inorganic nutrients by
primary producers (e.g. Colijn and Cadée 2003).
4 Environmental impact of scrubbing waters - Synthesis
During removal of sulphur in refineries catalysts are used in the production of low S
fuels. These contain transition metals (molybdenum, cobalt, nickel, zinc, copper)
which need to be replaced at more or less regular intervals. Only part of these metals
can be recycled, the remainder, especially fine material released into the gas stream,
has to be safely deposited. In addition the amine used to remove the hydrogen
sulphide produced during Hydrotreating also can be recycled or needs to be safely
deposited.
The costs and environmental impacts incurred from either recycling or deposition
cannot be specified on a global scale. Van Oudenhoven et al. (1993) report that in
1993 a total of 6,368 tons of spent desulphurisation catalyst was produced by 89
refineries in Europe.
Thus, processes that are cheaper or more environmentally benign are attractive
alternatives. One of these is removal of combustion gases. Of the processes listed
above Flue Gas Desulphurisation with Seawater Scrubbing (FGD-SWS) appears to be
attractive for operation of seagoing vessels.
Both laboratory experiments and field evidence indicate that acidic waste streams
from FGD-SWS introduced in full strength seawater leads to observable effects on
ambient pH only for extremely short periods of time. From the dumping of much
higher concentrated sulphuric acid in the North Sea it is known that the area affected
is restricted to a few hundred meters behind the dumping vessel.
Preliminary laboratory experiments with seawater indicate that at a 1:10 dilution the
observable pH change did not exceed 0.1 pH units. For brackish waters a time lag of
about one hour was observed. These values coincide with EPA requirements.
Considering that in this case a 12 % acid (=2.634 mol H+/L) was dumped then it can
be expected that the maximum of about 6 mmol H+/L produced during waste
discharge from FGD-SWS will affect neither the pH values nor the sulphate contents of
the receiving waters to a noticeable degree. This is not only due to the low
concentrations of sulphate in the waste stream. Ship movements and screw rotation
causing turbulent mixing will provide further dilution. In addition, natural mixing
processes also will contribute to this.
It should, however, be noted that the conclusion given above holds for fully marine
salinities only. In waters such as the Baltic with generally lower salt contents and
slightly different ionic composition, especially in the northern parts, the 1:10 dilution
may not be sufficient. Also, during harbour times when there will be no ship
movements and only limited water movement this dilution factor may also be too low.
Under these conditions, additional sulphate precipitation with limestone or the use of
low sulphur fuels might become necessary. Detailed analysis of this case remains to
be done. The other factors worth considering are the total mass of sulphur emitted in
harbour versus at sea. Vessels in port do not burn the amount of fuel as at sea due to
the lower demand for propulsion. A typical ferry may have 27 MW of installed power
available at sea, while only 3 MW of this would be available in harbour. The amount of
sulphur discharge is proportional to this power use, thus even in brackish harbours,
the sulphur dilution ratio may be sufficient.
In the case of nitrate open sea discharge from FGD-SWS is, again due to the high
dilution rate, not likely to cause any eutrophying effects. In ports, however, the high

- 31 -
concentrations in the discharge stream together with restricted water exchange may
lead to nitrate values high enough to cause unwanted effects such as exceptional
phytoplankton blooms. Just as sulphur emission is linked to engine total output, so is
the nitrogen emission rates. Vessels that are moving slowly, or anchored in harbour
with only generators running will be producing much lower levels of nitrates than
under full speed at sea. The effect of 2-4 MW of engine power per ship in harbour may
be insignificant in terms of nitrate amounts. Even when main engines are started, it is
difficult to conceive of how massive amounts of fuel can be burned for propulsive
motors in a small harbour. The use of propulsion engines is to get out of harbour and
manoeuvre, so these sources are not continuous.
Nevertheless, as experimental evidence is lacking, it appears necessary to conduct a
series of laboratory and field experiments to elucidate the actual changes in pH and
sulphate as well as nitrate concentrations under a variety of conditions. Similarly, it
might be useful to adopt models developed for port sediment and water exchange to
include pH and sulphate also.
Comparing these results with the harmful effects of the SO2 and NOx emissions of
ships, the use of the SWS seems to be a shortcut: most of the produced sulphate and
nitrate will reach the oceans by surface run-off via the rivers. At land however the
acidification of soils, lakes and rivers causes considerably higher damage. The change
of atmospheric aerosol composition by NOx emissions, which has been observed in the
German Bight for example should also be taken into account.
Other positive side-effects of the SWS are 80 % removal of the particulates and noise
reduction.

- 32 -
References
Andreae, M. O. and Raemdonck, H. (1983). Dimethylsulfide in the surface ocean and
the marine atmosphere: a global view. Science, 221,744-7.
Andreae, M.O. and Jaeschke, W.A., 1992 Exchange of Sulphur between Biosphere and
Atmosphere over Temperate and Tropical Regions. In: Sulphur Cycling on the
Continents - Wetlands, Terrestrial Ecosystems, and Associated Water Bodies.
(Howarth, R.W., Stewart, J.W.B. & Ivanov, M.V. Chapter 3, Scope 48.
Bates, T. S., Cline, J. D., Gammon, R. H. and Kelly-Hansen, S. R., 1987. Regional and
seasonal variations in the flux of oceanic dimethylsulfide to the atmosphere. J.
Geophys. Res., 92, 2930-2938.
Capaldo, K., Corbett, J.J., Kasibhatla, Fischbek, P. and Pandis, S.N. 1999. Effects of
ship emissions on sulphur cycling and radiative climate forcing over the ocean.
Nature 400: 743-746.
Carlson, H. 1986. Quality Status of the North Sea. Dt. hydrogr. Z. Erg.-H. B 16: 1-424.
CEPE (European Council of Paint, Printing Ink and Artists’ Colours Industry), 1999.
Utilisation of more ‘environmentally friendly’ antifouling products, EC project No.
96/559/3040/DEB/E2, Phase 1 – Final report.
Charlson, R.J., Lovelock, J.E., Andrea, M.O. and Warren, S.G. 1987. Oceanic
phytoplankton, atmospheric aulphur, cloud albedo and climate. Nature 326: 655-
661.
CIEC The Essential Chemical Industry, 1999. Chemical Industry Information Centre,
University of York, 4th ed.
Colijn, F. and G.C. Cadée 2003. Is phytoplankton growth in the Wadden Sea light or nitrogen limited? J. Sea Res. 49: 83-93.
Corbett, J.J. and Fischbek, P.S. 1997. Emissions from ships. Science 278: 823-824.
Corbett. J.J., Fischbeck P.S., and Pandis S.N. 1999. Global nitrogen and sulfur
emissions inventories for oceangoing ships. J. Geoph. Res. 104: 3457 –3470.
Det Norske Veritas 1999. Reference values for ship pollution. Technical report
No. 99-2034, 59p.
Dethlefsen, V., 1990. Ende der Verklappung von Abfällen aus der
Titandioxidproduktion in der Nordsee. SDN
EFMA European Fertilizer Manufactures Association, 2000. Best Available Techniques
for Pollution Prevention and Control in the European Sulphuric Acid and Fertilizer
Industries. Booklet No. 3. Brussels, Belgium. 68 p.
Entec, 2002. Quantification of emissions from ships associated with ship movements
between ports in the European Community. Final Report, July 2002.
Glenna, K. and Tokerud, A., 1991. Unique FGD process uses sea water as absorbent.
Desulphurization of flue gases without chemicals in a Norwegian oil refinery. ABB
review 4: 9-12.
Hameed, S. and Dignon, J. (1988). Changes in the geographical distributions of global
emissions of NOx and SOx from fossil-fuel combustion between 1966 and 1980.
Atmospheric Environment, 22, 441-449.
Holland, H.D. 1978. The Chemistry of the Atmosphere and Oceans. John Wiley & Sons,
New York, pp. 351.
Hollemann, A.F. and Wiberg E., 1985. Lehrbuch der Anorganischen Chemie. 91.-100.
ed., Walter de Gruyter, Berlin.
Hunter, K.A,. 1998. The temperature dependence of pH in surface seawater. Deep Sea Res. Pt. I 45: 1919-1930.

- 33 -
IMO –International maritime organization, 2000. Study of Greenhouse Gas Emissions
from Ships. Final report. Issue no. 2 - 31 March 2000
Isensee, J. (1997): Energieverbrauch und Luftverschmutzung - ein Vergleich zwischen
Schiffen und anderen Transportfahrzeugen. Institute of Ship Construction,
University Hamburg
Isensee, J. 2001. Reduction of CO2 and other gaseous emissions from shipping by
switching from residual fuel to sulphur free diesel. Proposal to the German
members of MEPC.
Leendert R. and Kwint J. 1997. The origin of DMS(P)cies. Proefschrift Rijksuniversiteit
Groningen.
Lohse, L. 1996. Sediment-water exchange of nitrogen compounds and oxygen in the
North Sea. Dissertation, Rijksuniversiteit Groningen, pp. 86.
Lovelock, J. E., Maggs, R. J. and Rasmussen, R. A., 1972. Atmospheric
dimethylsulphide and the natural sulphur cycle. Nature, 237, 452-3.
Moller, D. (1984). Estimation of the global man-made sulphur emission. Atmos.
Environ., 18, 19-27.
Nguyen, B. C., Bergeret, C. and Lambert, G., 1984. Exchange rates of dimethyl sulfide
between ocean and atmosphere. In: Brunsaert, W. and Jirka, G. H. (Eds). Gas
Transfer at Water Surfaces. Reidel, Dordrecht, pp. 539-45.
Nyman, G.B.G. and Tokerud, A., 1991. Seawater scrubbing removes S02 from refinery
flue gases. Oil & Gas Journal, July 1, 1991.
Rat von Sachverständigen für Umweltfragen 1981. Umweltprobleme der Nordsee. Deutscher Bundestag Drucksache 9/692 1-503.
Schlesinger, W.H. 1997. Biogeochemistry: an analysis of global change. Chapter 13.m
Academic Press, California.
Schulz, M., van Beusekom, J., Bigalke, K., Brockmann, U., Dannecker, W., Gerwig, H.,
Grassl, H., Lenz, C.-J., Michaelsen, K., Niemeier, U., Nitz, T., Plate, E., Pohlmann,
T., Raabe, T., Rebers, A., Reinhardt, V., Schatzmann, M., Schlünzen, K.H.,
Schmidt-Nia, R., Stahlschmidt, T., Stienhoff, G. & von Salzen, K. 1998. The
atmospheric impact on fluxes of matter and energy in the German Bight.
KUSTOS/TRANSWATT Abschlußbericht 1: 97-130.
Sciare, J., Mihalopoulos, N. and Dentener, F.J., 2000. Interannual variability of
atmospheric dimethylsulfide in the southern Indian Ocean. Journal of Geophysical
Research 105: 26,369-26,377.
Sinninghe-Damsté, J.S., Kohnen, M.E.L. and Horsfield, B., 1998. Origin of low-
molecular-weight alkylthiophenes in pyrolysates of sulphur-rich kerogens as
revealed by micro-scale sealed vessel pyrolysis. Organic Geochemistry 29: 1891-
1903.
Smith, S. J., H. Pitcher and T. M. L. Wigley 2001. Global and regional anthropogenic
sulphur dioxide emissions. Global Planet. Change 29: 99-119.
Smolyakov, B.S., Belevantsev, V.I., Zhigula, M.V., and Ryzhikh A. P., 2000. Effect of
transformation of the copper and lead species on their behaviour in real fresh water
ecosystems. Environ. Sci. & Poll. Res. Abstracts of 17th FECS Conference 2000.
Tokerud, A. 1989. Seawater used as SO2 removal agent. Modern Power System, June
1989, 9 (6): 21-25.
United Nations Framework Convention on Climate Change (UNFCCC), Special issues in
carbon/energy taxation: Marine bunker charges, Working paper 11, 1997.
(http://www.oecd.org/env/docs/cc/gd9777.pdf)

- 34 -
US EPA, 1976. Quality criteria for water. U.S. Environmental Protection Agency,
Washington DC, Report No. EPA-44019-76-023, July 1975, 501 p.
Van Oudenhoven, J.A.C.M., Cooper, G.R., Cricchi, G., Gineste, J., Pötzl, R. and Martin,
D.E. 1995. Oil refinery waste, disposal methods and costs 1993 survey. CONCAWE
Report 1/95: 1-39.
Wasmund, N., Andrushaitis, A. , Lysiak-Pastuszak, E. , Müller-Karulis, B. , Nausch, G., Neumann, T., Ojaveer, H., Olenina, I., Postel, L., and Witek, Z. 2001. Trophic status of the south-eastern Baltic Sea: a comparison of coastal and open areas. Estuar. Coast. Shelf Sci. 53: 849-864.
Weichart, G. 1975. Untersuchungen über den pH-Wert im Wasser der Deutschen
Bucht im Zusammenhang mit dem Einbringen von Abwässern aus der
Titandioxidproduktion. Dt. Hydrogr. Zt. 28: 2443-252.
Whelpdale, D.M. 1992. An overview of the atmospheric sulphur cycle. In: Sulphur
Cycling on the Continents - Wetlands, Terrestrial Ecosystems, and Associated Water
Bodies. (Howarth, R.W., Stewart, J.W.B. & Ivanov, M.V. Chapter 2, Scope 48.
Zidouri, H., 2000. Desalination in Morocco and presentation of design and operation of
the Laayoune Seawater Reverse Osmosis Plant. Proceedings of the Conference on
Membranes in Drinking and Industrial Water Production, Volume 1, pages 293–301.
Internet sites
Advances in power technology, issue 4:
http://www.powertech.co.uk/downloads/R&D/fgdSeaWater.pdf
US-EPA What are the Major Effects of Common Atmospheric Pollutants on Water
Quality, Ecosystems, and Human Health?
http://www.epa.gov/owow/oceans/airdep/air3.html
pH ranges that support aquatic life.
http://www.bpa.gov/corporate/kr/ed/kidsinthecreek/materials/waterquality/graph.
htm
Oceanography - Salt balance, residence times, element addition and removal.
http://www.ncl.ac.uk/