reducing feed cost in tilapia farming through digestive...
TRANSCRIPT
Reducing Feed Cost
in Tilapia Farming
through
Digestive and Metabolic
Enhancement
Peter Coutteau, PhD
Nutriad International, [email protected]
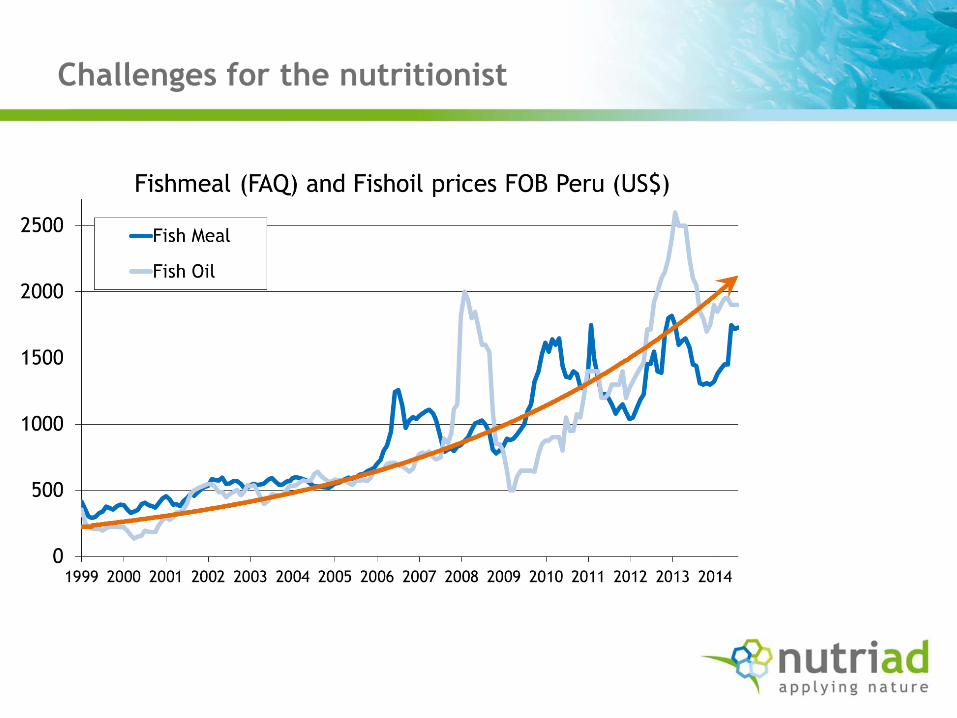
Challenges for the nutritionist

Agriculture commodities prices 1994-2014
Source: World Bank
0
100
200
300
400
500
600
700
SOYBEAN MEAL 48% CP, USD/MT (Chicago)
0
500
1000
1500
2000VEGETABLE OILS, USD/MT
RAPESEED OIL SOYBEAN OIL PALM OIL

Improving feed utilization in aquaculture
Enzymes– Degrade non-starch polysaccharides (NSP)
– Make phytate phosphorous available
Herbal Extracts & Phytobotanical Compounds– Stimulate enzyme & bile secretion
– Improve gut health and modulate microflora
– Reduce impact disease & parasites
Organic Acids– Enhance acidification of stomach, improving pepsine digestion
– Bacteriostatic/bacteriocide activity
Feed Emulsifiers– Complement bile acid activity
– Improve energy utilization
…

Promoting nutrient utilization in aquaculture:
there is a lot to gain
Utilization of dietary energy
in salmonids
(after Luquet, 1982)
Nitrogen balance in fish
(after Luquet, 1982)

Species specific aqua additives
• Aquaculture species very different from livestock
• Aquaculture : wide range of species
– Feeding biology
– Digestive physiology
– Culture methods
– Feed formulations

Omnivorous fish : challenges on feed efficiency
• Low cost ingredients
• Maximize nutrient digestibility
• Fileting yield: minimize feed cost per kg of filet
• Visceral fat deposition
• Reduce waste output into the environment

Species-specific screening for synergistic compounds

Development through feeding
trials with Tilapia
Ceulemans et al. (2009) Global Aquaculture Advocate Nov/Dec 2009

Data from a 70 day lab trial with Nile Tilapia using triplicate tanks of 100l per diet.
Fish were grown at 26°C from 16g til ± 70g while fed on a practical tilapia grow out
diet with CP/CF of 33/7.6.
GROWTH RATE (%/day)
1.10
1.15
1.20
1.25
1.30
CONTROL EASY DIGEST
+6%
FEED CONVERSION RATIO (kg
feed consumed per kg of
weight gain)
1.30
1.35
1.40
1.45
1.50
1.55
CONTROL EASY DIGEST
- 6%
PROTEIN EFFICIENCY RATIO
(kg weight gain per kg protein
consumed)
1.85
1.90
1.95
2.00
2.05
2.10
CONTROL EASY DIGEST
+7%
AQUAGEST® OMF improves FCR, Growth
and PER in Tilapia
AQUAGEST AQUAGEST AQUAGEST

Data from a 70 day lab trial with Nile Tilapia using triplicate tanks of 100l per diet.
Fish were grown at 26°C from 16g til ± 70g while fed on a practical tilapia grow out
diet with CP/CF of 33/7.6.
LIVER WEIGHT
(% BODY WEIGHT; HSI)
1.60
1.70
1.80
1.90
2.00
2.10
2.20
CONTROL EASY DIGEST
-12%
VISCERA WEIGHT
(% BODY WEIGHT; VSI)
6.00
6.10
6.20
6.30
6.40
6.50
6.60
6.70
6.80
CONTROL EASY DIGEST
- 4%
AQUAGEST® OMF reduces liver and
visceral weight in Tilapia
AQUAGEST AQUAGEST

Dose-response AQUAGEST® OMF in Tilapia
CONTROL AQUAGEST® OMF
1.5 kg/MT feed
% vs
control
AQUAGEST® OMF
3 kg/MT feed
% of
control
Survival (%) 100 ± 0 100 ± 0 100 ± 0
initial weight (g) 9.17 ± 0.04 9.15 ± 0.13 8.93 ± 0.21
final weight (g) 41.84 ± 0.83 44.32 ± 1.25 44.3 ± 1.99
SGR (%/day) 2.71 ± 0.03a
2.82 ± 0.03ab 4.1% 2.86 ± 0.08
b 5.5%
Feed Intake (g/ind) 37.86 ± 0.65 38.83 ± 1.18 38.3 ± 1.15
Feed Conversion Ratio 1.16 ± 0.01a
1.10 ± 0.01b -5.2% 1.08 ± 0.03
b -6.9%
Protein Efficiency Ratio 2.75 ± 0.03a
2.86 ± 0.02ab 4.0% 2.92 ± 0.1
b 6.2%
Hepatosomatic Index (%) 1.60 ± 0.15 1.48 ± 0.11 -7.5% 1.43 ± 0.01 -10.6%
Viscerasomatic Index (%) 8.45 ± 0.09a
7.79b ± 0.11 -7.8% 8.41 ± 0.13
a -0.5%
Data from a 56 day lab trial with Nile Tilapia using triplicate tanks of 100lper diet.
Fish were grown at 26°C from 9g til ± 44g while fed on a practical tilapiagrow out diet with CP/CF of 33/7.6.

Cage trial with Tilapia in Brazil
Sampaio Gonçalves et al. (2012) Aquaculture Asia Pacific Magazine Nov/Dec 2012

Field verification with tilapia
Cage trial Tilapia, Brazil
Tilapia cages: 25 units (7m3 each)Instituto de Pesca São José do Rio Preto, Brazil

Cage trial Tilapia, Brazil – experimental conditions
Phase 1: pre-growing (from 28g to ±170g)
• Period: 111 days
• Stocking density: 880 fishes/cage
• GIFT strain
Treatments:
1. Control feed n=10 replicate cages
2. Aquagest OMF (3kg/MT feed) n=15 replicate cages

Cage trial Tilapia, Brazil – results Phase 1
Initial weight 28 g – DOC 85 days
# cages/treatment: Control N=10; Aquagest N=15
+12%
-3%

Cage trial Tilapia, Brazil – experimental conditions
Phase 2: growout (from ±170g till ± 750g)
• Period: 111 days
• Stocking density: 840 fishes/cage
• 5% of fish per replicate processed for determining fillet yield, visceral fat, liver and visceral weight
Phase 2: Treatments: (n=5 replicate cages per treatment)
• T1 : Control feed (commercial feed in use; CP32)
• T2 : CONTROL + Aquagest OMF 3kg/MT
• T3 : CONTROL + Aquagest OMF 3kg/MT (until 350g);
+ Aquagest OMF 1.5kg/MT (until 750g)
• T4 : LOW COST FEED + Aquagest OMF 2 kg/MT

Cage trial Tilapia, Brazil - summary
Best economic return from AQUAGEST OMF 3 kg/MT:
– Reduced FCR (-3.0%)
– Improved growth (+5%)
– Improved survival (+2.8%)
– Improved fileting weight (+1.5%)
– Reduced visceral mass (-10.7%)
Integrator Brazil:
• Return on Investment (ROI) 1:3.8
• Increased revenues: +17%

Cage trial Tilapia, Brazil
Economic analysis of different application dosages
+17% 3.8

APPLICATION OF A METABOLIC/
DIGESTIVE ENHANCER TO REDUCE
PROTEIN REQUIREMENTS IN TILAPIA
Lin & Wu (2014) Aquaculture Asia Pacific Magazine Nov/Dec 2014

Rationale
• digestive/metabolic enhancement
– metabolic/faecal losses
– protein efficiency
– dietary protein requirement
• Conditions for reducing protein level
without affecting performance
– Maintain protein quality (essential
amino acid levels)
– Maintain feed intake

• Experimental design : reduce 2% protein in a standard growout feed for tilapia:• replacing 4.35% soybean meal with filler material (oyster shell)• Compensating with a digestive/metabolic enhancer (Aquagest OMF)
• Determine effects on• fish performance• fileting yield and carcass composition• Condition factor = W (g) /L(cm)3• a range of physiological parameters (haematological parameters, gut
histology• Metabolic enzyme - Glucose-6-phosphate dehydrogenase (G6PDH):
enzyme involved in, a metabolic pathway that supplies reducing energy to cells (pentose phosphate pathway); important for liver lipogenesis (biosynthesis of fatty acids) NOT related to fat content in body, but indirectly to nutrients utilization (CHO, Protein)
Experimental design
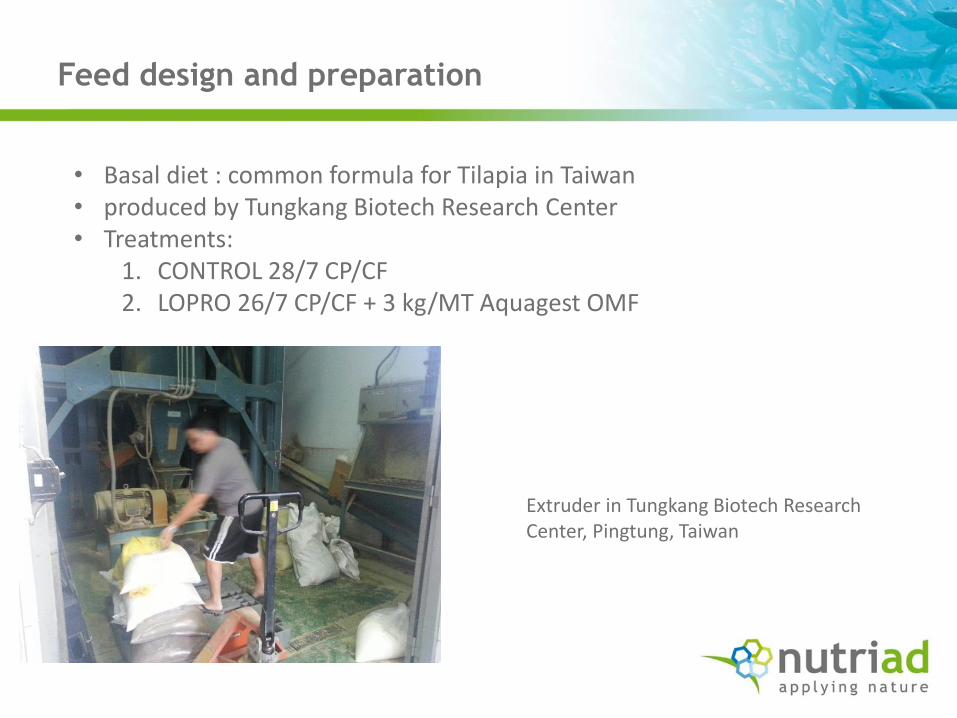
Extruder in Tungkang Biotech Research Center, Pingtung, Taiwan
• Basal diet : common formula for Tilapia in Taiwan• produced by Tungkang Biotech Research Center• Treatments:
1. CONTROL 28/7 CP/CF2. LOPRO 26/7 CP/CF + 3 kg/MT Aquagest OMF
Feed design and preparation

Experimental feeds
CONTROL 28/7 LOPRO 26/7+AG
local fish meal 10.9 10.9
meat and bone meal 2.2 2.2
soybean meal 13.0 8.7
rapeseed meal 8.7 8.7
wheat meal 10.9 10.9
wheat flour (japan) 10.9 10.9
coconut meal 8.7 8.7
whole fat rice bran 10.9 10.9
corn DDGS 19.6 19.6
salt 0.7 0.7
local fish oil 2.6 2.6
DCP 0.4 0.4
premix 0.4 0.4
choline 0.0 0.0
oyster shell powder - 4.3
AQUAGEST OMF - 0.3
TOTAL 100 100
Proximate composition
Moisture 8.7 8.3
Crude protein 27.8 26.1
Crude fat 7.4 7.4
Ash 8.2 10.4

Trial conditions
• Male hybrid tilapia (Oreochromis niloticus × O. aureus), initial weight 175 g (Tainan, Taiwan)
• Trial performed at a farm in Changjhih, Pingtungwith monitoring and sampling by National Pingtung University of Science and Technology, Taiwan
• Fish were acclimated to farm conditions for 2 month fed commercial tilapia diet (Hanaqua Tech Inc., Taiwan)
• Trial units: cement tanks 5 m × 5 m (0.75 m depth) ; each tank was divided into two units using a nylon net
• flow-through system with underground freshwater (80% water change every three weeks)
• 45 fish per unit, 3 replicate units per treatment
• Culture period : 18 wks (July 28 - Nov 30, 2013)

• Fish were fed with 2-2.5% of their body
weight per day (close to the maximal
daily ration for tilapia according to feed
consumption during the acclimation
period of the study)
• The daily ration was divided into two
equal meals (08:00 and 15:00 h) and
hand-fed
• Fish were weighed once every 3 weeks
by National Pingtung University of
Science and Technology (NPUST), to
monitor growth performance and adjust
feeding rations
• Water temperature was recorded daily
• Water quality parameters (ammonium
and nitrite) weekly
Trial conditions

Fish performance (trial duration 18 weeks)
CONTROL
28/7
LOPRO
26/7+AG
% change
vs controlstatistics
Survival (%) 93.3 ± 2.2 96.3 ± 2.6 +3.2%
Initial weight (g) 177.3 ± 1.8 174.7 ± 2.1 -1.5%
Final weight (g) 469.6 ± 13.2 482.0 ± 12.1 +2.6%
Daily weight gain (g/d) 2.32 ± 0.11 2.44 ± 0.08 +5.2%
Feed intake (g/fish) 860.5 ± 21.6 840.3 ± 17.0 -2.4%
Food Conversion Ratio (FCR) 2.95 ± 0.20 2.74 ± 0.04 -7.1% P<0.05
Protein Efficiency Ratio (PER) 1.22 ± 2.2 1.40 ± 0.02 +14.8% P<0.05
Protein retention (%) 27.70 ± 1.73 29.72 ± 0.04 +7.3% P<0.05

Processing parameters (trial duration 18 weeks)
Processing the fish at Hung-Yi Frozen Food Factory, Pingtung
Visceral fat
CONTROL
28/7
LOPRO
26/7+AG
% change
vs controlstatistics
Hepatosomatic Index HSI (%) 3.30 ± 0.74 3.09 ± 0.26 -6.4%
Visceral fat (%) 6.31 ± 1.81 5.83 ± 1.62 -7.6%
Conditioning factor 1.88 ± 0.14 2.02 ± 0.04 +7.4%
Filet yield (%) with skin 41.46 ± 0.17 41.91 ± 0.40 +1.1%
Filet yield (%) without skin 34.82 ± 0.14 35.20 ± 0.34 +1.1%

Fish composition (trial duration 18 weeks)
No significant effect on carcass composition
carcass compositionCONTROL
28/7
LOPRO
26/7+AG
moisture (%) 78.1 ± 0.4 77.6 ± 1.3
crude protein (%) 20.1 ± 1.3 19.3 ± 1.4
crude fat (%) 1.2 ± 0.7 1.7 ± 0.5
ash (%) 1.12 ± 0.10 1.07 ± 0.01

Haematological indices (trial duration 18 weeks)
• Blood cell counts not affected
Indicators metabolic enhancement:
• Decrease of plasma TG
• Boost of G6PDH activity
haematological indicesCONTROL
28/7
LOPRO
26/7+AGstatistics
white blood cells 235 ± 11 236 ± 12
red blood cells 2.55 ± 0.08 2.50 ± 0.24
haemoglobin 10.12 ± 0.56 10.64 ± 0.82
haematocrit 33.1 ± 2.3 31.6 ± 3.0
plasma TG 15.73 ± 0.40 13.53 ± 0.80 P<0.05
G6PDH 163 ± 40 267 ± 29 P<0.05

Tank trial Tilapia, Taiwan - summary
LOPRO 26/7 + AQUAGEST OMF 3 kg/MT versus CONTROL 28/7:
• Improved fish performance– Reduced FCR (-7.1%)
– Improved growth (+5.2%)
– Improved survival (+3.2%)
• More efficient conversion of feed protein into fish– Improved protein retention (+7.3%)
– Improved protein efficiency ratio (+14.8%)
• Improved processing yield– Improved condition factor (+7.4%)
– Improved fileting weight (+1.1%)
– Reduced visceral fat (-7.6%)
• Carcass composition and haematology not affected
• Physiological indicators confirming mode of action:– Reduced plasma TG
– Increased G6PDH
– Improved integrity of gut villi in the midgut

Reducing feed cost in aquaculture
Take home message :
- Increasing raw material costs is main drive to more
efficient use of nutrients
- Functional feed additives can be used to improve the
digestive and metabolic efficiency of tilapia resulting in
better revenue for the farmer

OBRIGADO !
Dr. Yu-Hung Lin & co-workersDepartment of AquacultureNational Pingtung University of Science and TechnologyTAIWAN
Dr. Giovani S. Gonçalves & co-workersInstituto de Pesca, Sao José do Rio PretoSP, BRAZIL
Rocio Robles & co-workersCTAQUA Centro Tecnologico de la AcuiculturaPuerto de Santa Maria, CadizSPAIN