reducing chronic absence - california
TRANSCRIPT

www.attendanceworks.org
Reducing Chronic Absence:
Why Does It Matter for
Reducing the Achievement
Gap?
December 3, 2013
Director: Hedy Chang

Average Daily
Attendance
•Nationally, ADA is generally understood as the % of enrolled students who attend school each day. In California, for funding purposes, it is also defined as total days of student attendance divided by total days of student instruction.
Truancy
•Typically refers only to unexcused absences and is defined by each state under No Child Left Behind. It signals the potential need for legal intervention under state compulsory education laws. In CA, truancy = absent 3 days without a valid excuse or late 3 times to class by at last 30 minutes without a valid excuse. In MD, truancy = missing 20% of the school year without an excuse.
Chronic Absence
•Missing 10% or more of school for any reason – excused, unexcused, etc. It is an indication that a student is academically at risk due to missing too much school. Chronic absence is now a measure of student engagement in the Local Control Funding Formula.
Unpacking Attendance Terms
2

Most Schools only track average daily attendance and truancy. Both can mask chronic absence.
Moving into Action Requires Knowing
if Chronic Absence is a Problem
7%
12% 13% 13% 15% 16%
0%
5%
10%
15%
20%
25%
30%
A B C D E F
Chronic Absence For 6 Elementary Schools in
Oakland, CA with @ 95% ADA in 2012
% Chronic Absence
3
98% ADA = little chronic absence
95% ADA = don’t know
93% ADA = significant chronic absence

Chronic Absence Versus Truancy
4
0
100
200
300
400
500
600
700
K 1 2 3 4 5 6 7 8 9 10 11 12
Number of students missing 10% versus 10 unexcused absences
(San Francisco Unified School District)
# chronic absentees - 2010-2011
# of students with 10 unexcused absences (as of May 16th 2011)

Nationwide, as many as 10-15% of students (7.5 million) miss
nearly a month of school every year.
In California, the lack of attendance data in CALPADS means
we have not known how many students are chronically
absent.. AG Harris report estimates chronic absence affects
250,000 elementary students (7.6%). Levels are significantly
higher in some districts and schools. Districts must report on
chronic absence for the first time as part of LCFF
Chronic absenteeism is a red alert that students are headed
for academic trouble and eventually for dropping out of high
school. It can start as early as kindergarten and pre-
kindergarten.
5
Chronic Absence: A Hidden Crisis

6
Starting in preK, chronic absence affects learning and school readiness. Attendance matters most for the children who enter the farthest behind.
Analyses control for prior preschool experience, race, gender, neighborhood poverty and social status, special education status, ELL status, and program type. Missing data points represent values with fewer than 30 students.

7
Students with more years of chronic absenteeism, starting in preK have lower 2nd grade scores
* Indicates that scores are significantly different from scores of students who are never chronically absent, at p<.05 level; **p<.01; ***p<.001
Some risk
At risk

64%
43% 41%
17%
0%
20%
40%
60%
80%
100%
No attendance risks Small attendance risks Moderate attendance risks High attendance risks
Percent Students Scoring Proficient or Advanced on 3rd
Grade ELA
Students Chronically Absent in Kindergarten and 1st Grade
are Much Less Likely to Read Proficiently in 3rd Grade
No risk Missed less than 5% of school in K & 1st
Small risk Missed 5-9% of days in both K & 1st
Moderate risk Missed 5-9% of days in 1 year &10 % in 1
year
High risk Missed 10% or more in K & 1st
Source: Applied Survey Research & Attendance Works (April 2011) 8

The Long-Term Impact of Chronic Kindergarten
Absence is Most Troubling for Poor Children
40
42
44
46
48
50
52
0-3.3% in K 3.3 - 6.6% in K 6.6-10.0% in K >=10.0% in K
Ave
rage
Aca
dem
ic P
erfo
rmance
Absence Rate in Kindergarten
Reading
Math
Source: ECLS-K data analyzed by National Center for Children in Poverty (NCCP)
Note: Average academic performance reflects results of direct cognitive assessments conducted for ECLS-K.
5th Grade Math and Reading Performance By K Attendance for Children Living In Poverty.
Academic performance was lower even if attendance had improved in 3rd grade.
9

10
Why Interrupting Chronic Early Absence Matters
Oakland Unified School District SY 2006-2012, Analysis By Attendance Works
Chronic absence in 1st
grade is also associated
with:
• Lower 6th grade test
scores
• Higher levels of
suspension
Years of Chronic Absence in Grades 1-5
Increase in
probability of
6th grade
chronic
absence
Each year of chronic absence in elementary school is associated with
a substantially higher probability of chronic absence in 6th grade
5.9x
7.8x
18.0x

The Effects of Chronic Absence on
Dropout Rates are Cumulative
11
With every year of chronic
absenteeism, a higher percentage of students drop out
of school.
http://www.utahdataalliance.org/downloads/ChronicAbsenteeismResearchBrief.pdf

12
Chronic absence is even higher among
students of color
0%
5%
10%
15%
20%
25%
30%
K 1 2 3 4 5 6 7 8 9 10 11 12
% o
f A
ctiv
e S
tud
en
ts
Grade Level
% Chronically Absent Students By Ethnicity2011-12 School Year
African American
Asian
Latino
White

13
Solutions Only Work if Grounded in Understanding of
What Leads to Chronic Absence
Myths Absences are only a problem if they are
unexcused
Sporadic versus consecutive absences
aren’t a problem
Attendance only matters in the older
grades
Barriers
Lack of access to health care
Poor transportation
No safe path to school
Aversion Child struggling
academically
Lack of engaging instruction
Poor school climate and ineffective school
discipline
Parents had negative school experience

Hope for a better future
+
Faith
that school will help you or your child succeed
+
Capacity Resources, skills, knowledge needed to get to school
14
Going to School Every Day Reflects

15
Universal Strategies

A Comprehensive Approach
is More Cost Effective
A small fraction
of a school’s
students
Students who were chronically
absent in prior year or
starting to miss 20%
or more of school
Some
of a school’s
students
Students at risk for
chronic absence
All of
a school’s
students
All students
in the school
Recovery
Programs
Intervention
Programs
Universal/Preventive
Programs
High
Cost
Low
Cost 16

• Data-driven action: Data are used identifying where to place counselors, which students to target & to evaluate success.
• Attendance Improvement Counselors: Attendance
Improvement Counselors, along with Vista national service members helped the schools track data, adopt universal and targeted interventions, create incentives for good attendance, reach out to students and parents, and ensure a timely response to poor attendance.
• Capacity-building: The Attendance Improvement Counselors also charged with building the capacity of the school staff, parents and community partners to understand attendance laws, use data, and develop a comprehensive approach that includes prevention and early intervention.
Los Angeles
Attendance Improvement Program

LAUSD Attendance Improvement Program Outcomes
Note: Program operated in 77 schools including 52 elementary and 25 high schools with poor K and 9th grade attendance

• Strength-based approach with more positive perceptions of parents, higher expectations of their students and parents
• Greater levels of parent engagement
• A shared belief that everyone had a role in improving attendance and should work together
• Deeper levels of commitment to program implementation and delving into the causes of absence
• School leadership made improving attendance a high priority
Characteristics of More Successful AIP programs

20
Chronic absence efforts can leverage and build off existing truancy infrastructure. (OUSD example)

Students with more severe absence
likely face bigger barriers
21
10.3% 11.8% 14.9%
24.4%
0%
10%
20%
30%
40%
50%
60%
TIER 1 TIER 2 TIER 3 TIER 4
Ab
sen
ce R
ate
Ran
ge
Average Absence Rate
This analysis divides all chronically absent 1st graders in OUSD district into 4 tiers (almost quartiles) based upon their level of absence

Ingredients for Success & Sustainability
in a District and Community
22

Tackling Chronic Absence in Baltimore City
December 3, 2013
Keeping Kids in School and Out of Court
23

Baltimore City Public Schools By the Numbers
•85,000 public school students prekindergarten – 12th grade •1 in 4 students are chronically Absent •195 schools and programs •83% Free and Reduced Meals •90% Average Daily Attendance •30% Student Mobility •88% African-American •9% White •3% Latino

22% 21%
14%
34%
44%
27%
23%
13% 16%
41%
0%
5%
10%
15%
20%
25%
30%
35%
40%
45%
50%
Prekindergarten Kindergarten Elementary School (1st - 5th)
Middle School High School
Ch
ron
ic A
bse
nce
Rat
es
Baltimore Schools' Chronic Absence SY2006-07 - SY2011-12
2006-2007 2011-2012
Sources: Prekindergarten and Kindergarten – BERC Prekindergarten and Kindergarten attendance analysis Grades 1st – 12th MSDE Official Files
2600
5000

26

Works with partners to increase student
attendance
Initiates attendance and back-to-school
awareness campaigns
Provides technical assistance and
professional development
Links twenty-six non-profits and public
agencies located in more than 100 schools
Supports data and research
Advocates for the implementation of
attendance policies and practices

2008-2010
• *Student Attendance Work Group
*Involved over 100 stakeholders
*Studied attendance; Laws and Regulations, Policy and Practice, Barriers; and Issued Recommendations
*Recommended making chronic absence as a must respond to indicator.
2010-2012
• *Established the Baltimore Student Attendance Campaign
*Over twenty non-profits and public agencies partner on strategies to improve attendance.
*Worked toward implementation of work group recommendations.
2012-2013
• *The Baltimore Attendance Collaborative works to tackle barriers to student attendance.
* Advocacy results in the establishment of school uniform guidance.
* Advocacy results in the establishment of a transportation texting campaign.
2013 – 2014
• Members of the Baltimore Student Attendance Collaborative working to initiate school based partnership efforts in over 100 schools to improve attendance including establishing direct outreach, mentorship, and mediation programs.
Baltimore Student Attendance Campaign Timeline

Student Attendance is a Community Priority in Baltimore
Students, Families,
and Schools
Public agencies
Baltimore City Public Schools
The Mayor's Office / Chief
Services Officer
The Family League / Baltimore
Student Attendance Campaign
Baltimore based non-profits and early learning
institutions The Baltimore
Education Research
Consortium
The Baltimore Grade Reading
Campaign
Local foundations

STRATEGIES
30

Provided support for schools to improve attendance:
– Developed the role of the attendance monitor
– Updated attendance best practices and absentee protocols
– Provided intensive annual training for attendance monitors and school based staff
– Attendance, chronic absence, and suspension data incorporated into District planning and reporting
31
Structural Strategies to Improve Attendance

• Created more Grades PK-8
– Consequently reducing the number of school transitions and keeping students where they and their families are known
• Changed the middle school (i.e. Grades 6-8 schools) model to reflect District education priorities by implementing:
– Smaller learning environments, often with thematic learning opportunities
– A focus on literacy
• Increased student and family options by creating limited middle school and district-wide high school choice
• Created alternative options programs for high school students
• Initiated the Great Kids Come Back to School Campaign, a drop out recovery strategy
32
Structural Strategies to Improve Attendance

• Created a multi-disciplinary work group to revise the Baltimore City Public Schools Code of Conduct
• Prohibited suspensions for class cutting, lateness, absenteeism and truancy
• Reduced discretionary suspensions from 10 days to 5 days
• Clearly messaged suspension as an alternative of last resort
• Leveraging the Student Support Team process
• Provided additional mental health supports to targeted schools
• Trained school leaders in the theory and practice school climate
Revised the Baltimore City Code of Conduct – suspensions contribute to chronic absence!
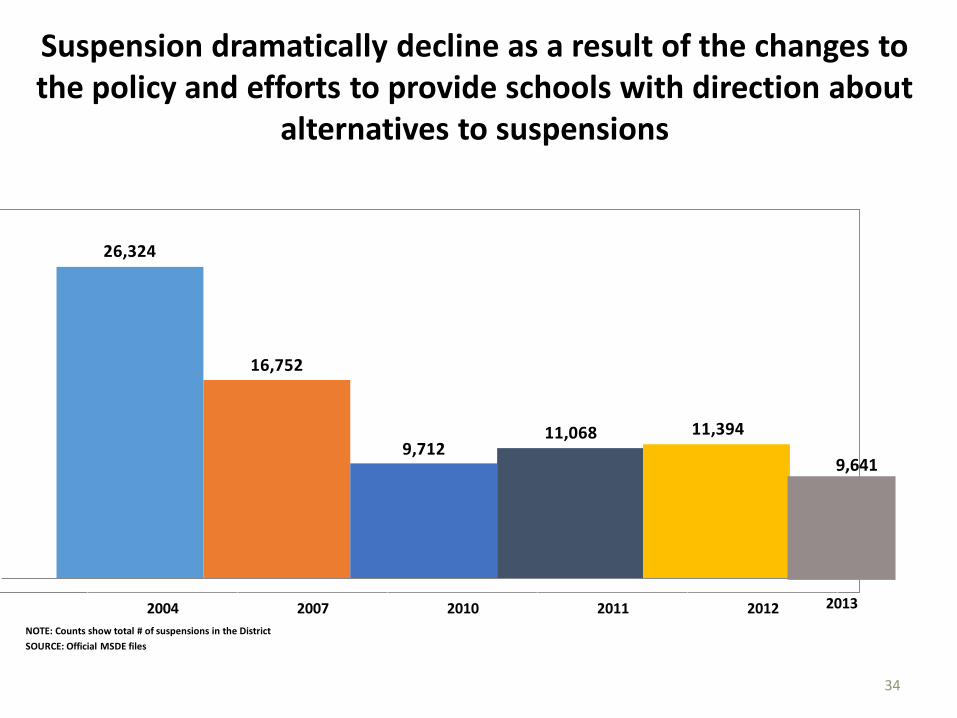
Suspension dramatically decline as a result of the changes to the policy and efforts to provide schools with direction about
alternatives to suspensions
26,324
16,752
9,71211,068 11,394
34
2004 2007 2010 2011 2012
NOTE: Counts show total # of suspensions in the District
SOURCE: Official MSDE files
2013
9,641


GRADUATION
37

38

39

Studied the prevalence of and reasons for early grades
absence Qualitative and Quantitative
Parent and Teacher Focus Groups
Teacher training
New Family Orientations
Targeted messaging and materials Prekindergarten/Kindergarten guide, Take Home Folders and Activities, Messaging in
the School Menu, Every Day Counts
• Mayoral sponsored competition targeted at increasing
attendance in prekindergarten and kindergarten
40
Baltimore Early Grades Attendance Strategy

1. Why do you and your agency made improving attendance a priority?
2. What strategies have you used?
3. How do you know you are making a difference?
41
Questions for Public Agency Partners

Attendance and Child Welfare

43
• Child Welfare is responsible for the well being of children in foster care and for the prevention of abuse and neglect.
• Success is dependant on partnerships with organizations that are already in children’s lives – such as the public school system.
• Attendance is a powerful data point for well-being and prevention.
• Simple data sharing techniques help both social services
and schools better care for vulnerable children.
Priorities in Child Welfare

Well-being: Attendance for children
in foster care
• The school district provides the attendance rate of every child in foster care last month.
• Social Services ensures a case worker intervenes with any child who’s attendance rate is below 85%
Attendance rate of
children ages 3 to 12
in foster care in
Baltimore City for the
past two years:
95%

Well-being: School stability for children in foster care
• Upon request, the schools release the information on a child’s Emergency Contact Card.
• Social Services asks those named on the card to be the foster care placement for the child.
• Reduces trauma for children coming into foster care by placing them in a home with someone they already know, and
• Helps ensure that coming into foster care does not mean you also change schools.
• In Baltimore City = ~25% of placements.

Prevention: Attendance of young children in
Baltimore
• Chronic absence in young children is a early warning sign of stress at home.
• Schools provide data on children in Pre-k who are chronically absent from school.
• Social Services visits and intervenes with prevention services.
Asthma
Homeless
Behavior
Cause of Absenteeism
Month over month comparison shows young children do not re-
appear in data after DSS Intervention

Add in slides for juvenile court
47

Questions?
48