reducing carbon dioxide emissions from the eu...
TRANSCRIPT

THESIS FOR THE DEGREE OF LICENTIATE OF ENGINEERING
Reducing Carbon Dioxide Emissions from the EU Power and Industry Sectors
An assessment of key technologies and measures
JOHAN ROOTZÉN
Department of Energy and Environment
CHALMERS UNIVERSITY OF TECHNOLOGY
Gothenburg, Sweden 2012

Reducing Carbon Dioxide Emissions from the EU Power and Industry Sectors – An assessment of key technologies and measures JOHAN ROOTZÉN © JOHAN ROOTZÉN, 2012 Department of Energy and Environment Chalmers University of Technology SE-412 96 Gothenburg Sweden Telephone + 46 (0)31-772 1000 Cover: [The cover image shows an illustration of EU carbon dioxide emission, past, present and future (see Figure 1, p. 5. in the present work)] Printed by Chalmers Reproservice Gothenburg, Sweden 2012
i
Reducing Carbon Dioxide Emissions from the EU Power and Industry Sectors An assessment of key technologies and measures
JOHAN ROOTZÉN Energy Technology
Department of Energy and Environment Chalmers University of Technology
ABSTRACT In February 2011, the European Council reconfirmed the goal of reducing EU greenhouse gas emissions by at least 80% by 2050, as compared to the levels in 1990. The power and industrial sectors currently account for almost half of the total GHG emissions in the EU. The overall objective of the work presented in this thesis is to provide a technology-based perspective on the feasibility of significant reductions in CO2 emissions in the EU power and industrial sectors, with the emphasis on expected turnover in the capital stock of the existing infrastructure. Three sectors of industry are included: petroleum refining; iron and steel production; and cement manufacturing. The analysis is based on a thorough description and characterization of the current industry infrastructure and of the key mitigation technologies and measures in each sector. The analysis comprises investigations of how specific factors, such as the age structure of the capital stock, technology and fuel mix, and spatial distribution of the plant stock, contribute to facilitating or hindering the shift towards less-emission-intensive production processes. The results presented here are the synthesis of the results described in the following three papers: Paper I investigates the potential for CCS in industrial applications in the EU by considering branch- and plant-specific conditions; Paper II assesses strategies for CO2 abatement in the European petroleum refining industry; and Paper III explores in a scenario analysis the limits for CO2 emission abatement within current production processes in the power and industrial sectors. Together, the three papers provide a comprehensive assessment of the roles of technologies and measures that are commercially available today, as well as those of emerging technologies that are still in their early phases of development. The results presented in Paper III show that the EU goal for emissions reductions in the sectors covered by the EU ETS, i.e., 21% reduction by 2020 (as compared to Year 2005 levels), is attainable with the abatement measures that are already available. However, despite assumptions regarding moderate (steel and cement) or negative (petroleum products) output growth, an almost complete renewal of the capital stock (with the exception of petroleum refining) and extensive implementation of available abatement measures, the conclusion drawn is that total emissions from the assessed sectors will exceed the targeted levels by more than twofold unless a major breakthrough in low-carbon process technologies materializes within the period up to 2050. The results of Papers I and II illustrate how large-scale implementation of CCS in industrial settings might contribute to significantly reducing CO2 emissions from heavy industries in the EU. Taken together, these studies highlight the importance of, in parallel with the implementation of measures to meet the short-term (2020) reduction targets, accelerating efforts to develop new zero- or low-carbon technologies and processes that would enable significant reductions in emissions in the long term (2050). Key words: carbon dioxide; CO2,emission reductions; power; industry; refining; cement; steel; mitigation technologies; CCS; European Union

ii

iii
List of publications The thesis is based on the following appended papers:
I. Rootzén, J., Kjärstad, J. and Johnsson, F., 2011. Prospects for CO2 capture in European industry. Management of Environmental Quality: An International Journal, Vol. 22 No. 1, pp.18–32.
II. Johansson, D., Rootzén, J., Berntsson, T. and Johnsson, F., 2012. Assessment of strategies for CO2 abatement in the European petroleum refining industry. In press: Energy (2012).
III. Rootzén, J. and Johnsson, F., 2012. Exploring the limits for CO2 emission abatement in the EU power and industry sectors - Awaiting a breakthrough. To be submitted, 2012.
Johan Rootzén is the principal author of Papers I and III. Paper II is co-authored with Daniella Johansson. Professor Filip Johnsson, who is the main academic supervisor, contributed with discussions and the editing of all the papers. Jan Kjärstad contributed with discussions and the editing of Paper I. Professor Thore Berntsson supervised the work and contributed with discussions and the editing of Paper II.

iv

v
Acknowledgements I am indebted to many people, without whom this work would not have been possible. First and foremost, I would like to thank my supervisor Filip Johnsson, for giving me the opportunity to pursue this endeavor and for your support along the way. The work of this thesis has been carried out within the project ‘Pathways – Svenska systemlösningar’. Financial support from the Swedish Energy Agency is gratefully acknowledged. To all my colleagues at the Division of Energy Technology thank you for creating such a friendly and inspiring environment. They say it takes a village to raise a child. I would say it takes a village to live a happy and fulfilled life. To my villagers, my family and friends, wherever you are, I hope you all know how much I appreciate you. I would like to express special thanks to my parents, my journey from Blåkullagatan to Hörsalvägen would not have been possible without your limitless love and support, and to my fantastic sister and friend, Josefin. Finally, to my dream team, Annie, Otto and Ivar, you are always in my heart. Gothenburg, May 2012 Johan Rootzén

vi
vii
Contents 1 Introduction ..................................................................................................................................... 1
1.1 Background ............................................................................................................................. 1
1.2 Aim and scope ......................................................................................................................... 2
1.3 Outline of the thesis ................................................................................................................. 2
2 EU greenhouse gas emissions trends ............................................................................................... 4
3 Description of key characteristics of the industries ......................................................................... 6
3.1 Power sector ............................................................................................................................ 6
3.2 Petroleum refineries ................................................................................................................ 6
3.3 Iron and steel industry ............................................................................................................. 8
3.4 Cement industry .................................................................................................................... 10
4 Methodology ................................................................................................................................. 12
4.1 Modeling of industrial energy use and CO2 emissions .......................................................... 13
4.2 Technological change ............................................................................................................ 14
4.3 Scenario analysis ................................................................................................................... 14
4.4 The Chalmers Energy Infrastructure database ....................................................................... 15
5 Results and discussion ................................................................................................................... 17
6 Future work ................................................................................................................................... 20
References ..................................................................................................................................... 21

1
1 Introduction
1.1 Background
There is little doubt that most of the societal advancements in the twentieth century would have been impossible without abundant, inexpensive and precisely controlled flows of energy. The enormous expansion of the global energy system during the twentieth century was characterized by: rapid exploitation of fossil fuels as sources of primary energy; substantial improvements in energy conversion technologies; increased importance of electricity as an energy carrier; and an ever-growing supply of, and demand for, new and improved energy services (Smil, 2005). This unprecedented rise in the extraction, transformation, transportation, and use of energy has, however, also had its costs. Fossil fuel combustion is the single largest source of anthropogenic greenhouse gas (GHG) emissions, and energy-related CO2 emissions continue to increase in most parts of the world. This trend, which is the dominant driver of global climate change, threatens to impose enormous costs on society, costs which are estimated to be much greater than the costs associated with reducing emission levels (Stern, 2007). The Intergovernmental Panel on Climate Change’s Fourth Assessment Report (IPCC, 2007) concluded that to limit the long-term global average temperature increase to 2°C or less, relative to pre-industrialization levels, GHG emissions would need to peak by 2020 and be reduced by at least 50% by 2050, as compared to the levels in 1990. To achieve this target, developed countries as a group would need to reduce GHG emissions by 80%–95% by 2050, as compared to levels in 1990. The European Union (EU) has committed itself to take a leading role in the challenge of mitigating global climate change. Over the past decade, the EU has implemented a range of policies aimed at facilitating the transition towards a low-carbon society. The EU Emissions Trading System (EU ETS) established in 2005 is the backbone of EU climate policy. The scheme, which is the first large-scale attempt to place a price on CO2 emissions, was introduced to assist the EU Member States in achieving compliance with their commitments under the Kyoto Protocol in as cost-effective a manner as possible. The details of the third, post-Kyoto, period (Phase III, 2013–2020) are currently being negotiated. In February 2011, the European Council reconfirmed the EU objective of reducing GHG emissions by 80%–95% by 2050, as compared to 1990 levels, in line with the IPCC recommendations (European Commission, 2011a). To design the optimal policies to achieve the required reductions in emissions, decision-makers need information about the various options to reduce GHG emissions. In recent years, many low-carbon scenarios, roadmaps, and pathways have been developed with the goal of exploring how the transition to a low-carbon economy could be achieved (e.g., ECF, 2011; Pathways, 2011a; European Commission, 2011b). While the relative importance assigned to specific mitigation technologies and practices vary, most of these studies have emphasized the significance of technical change in the transformation process, involving a shift away from fossil fuels towards low-carbon production processes
2
With respect to the challenges associated with decarbonizing the EU stationary sectors, emphasis is typically placed on the transformation of the power sector. This thesis adds to the previous body of work by exploring further the potentials and limitations for reductions in CO2 emissions in three industrial sectors: petroleum refining, iron and steel production, and cement manufacturing. In these sectors, the options to reduce CO2 emissions tend to be fewer and are less-developed than those in the power sector. The thesis has a focus on transformation of the capital stock, based on a description of the current stock, rather than modeling. Compared to the power sector, the economics of the industrial sectors are more complex. Thus, comparing abatement options across the different sectors in terms of economics is difficult and is outside the scope of the present work. The work of this thesis has been carried out within the framework of the Pathways to Sustainable European Energy Systems project (Pathways, 2011a), which is aimed at evaluating pathways to a sustainable European energy system, focusing on the stationary energy system and the time period up to the year 2050.
1.2 Aim and scope
The overall objective of the thesis is to provide a technology perspective on the challenges associated with reducing CO2 emissions from the EU power and industrial sectors. The three appended papers assess the status and future prospects of key mitigation technologies and measures in the four major CO2-emitting industries in the EU stationary sector, i.e., power generation, petroleum refining, iron and steel production, and cement manufacturing. Paper I provides a first estimate of the potential for CO2 Capture and Storage (CCS) in industrial applications in the EU, and explores the spatial distribution of large industrial point sources, as well as potential capture clusters and their locations in relation to suitable storage sites. Paper II outlines the main characteristics of the EU petroleum refining industry and provides a descriptions and an assessment of the options for reducing CO2 emissions from refineries. This paper also includes a survey of access to infrastructural components, such as district heating networks, natural gas grids, chemical industries, and possible CO2 storage sites, which could facilitate cost-efficient CO2 abatement. Paper III explores the limitations of CO2 emission abatement within existing production processes in the EU power and industrial sectors. By simulating capital stock turnover, scenarios that track changes in the technology stock, energy intensities, and fuel and production mixes, and the resulting CO2 emissions have been generated for each of the four major CO2-emitting industries in the EU stationary sector (power generation, petroleum refining, iron and steel production, and cement manufacturing).
1.3 Outline of the thesis
The thesis consists of an introductory essay and three appended papers. This introductory section is intended to give a general introduction to the background of the work and to place the appended papers in a broader context.

3
Section 2 outlines the challenge to be met by exploring the historical trends in CO2 emissions within the EU and by comparing these trends with the emission reductions that need to be achieved by 2050. Section 3 presents the key characteristics and trends relevant to future CO2 emissions in each of the assessed sectors. Section 4 discusses the choice of methodology and related research, while Section 5 summarizes and discusses some of the key findings of the thesis work. Finally, in Section 6, ideas for future work are presented.
4
2 EU greenhouse gas emissions trends Even though there are significant differences between countries, Europe definitely is one of the regions of the world that have benefitted the most from the “energy revolution” of the twentieth century. Fossil fuels have played a vital role in the post-war rebuilding of the European economy. Coal has been the backbone of European economies and energy landscapes throughout the twentieth century. Rapid economic growth, an abundant supply of inexpensive oil, and the discovery of domestic oil and gas deposits have led to increased consumption of petroleum products and natural gas. A considerable share of the capital stock of the existing European energy system is a heritage of this post-war expansion. Many industries and power plants, which are still in operation, were commissioned in the period from 1960 to 1980 when most externalities associated with the use of fossil fuels were ignored. As a result, with the exception of a slight decline during the 1973 oil crisis, the levels of CO2 emissions increased almost continuously in the period 1945–1980. The 1979 oil crisis marked the beginning of a new era in European energy policy. Growing concern about the security of supply combined with increasing oil prices led to a leveling out of the growth in energy demand and marked the end of the dominant role of oil in the primary energy mix in Europe. The diversification of the energy mix also contributed to a change in CO2 emissions. Since 1980, the general trend in European CO2 emissions has been slightly downwards. However, this trend varies widely across EU Member States and between sectors, and the emission trajectory is far from smooth. In 1990, total GHG emissions amounted to approximately 5590 MtCO2-eq/yr, of which CO2 accounted for a little less than 80%. By Year 2000, the GHG emissions were 5090 MtCO2-eq/yr. A large share of the emission reductions achieved in the period 1990–2000 was a consequence of the following three major factors (EEA, 2011b; Gummer and Moreland, 2002):
structural changes in the economies of the new Member States in central and eastern Europe (EU12);
the rehabilitation process in the former East Germany; and an extensive switch from coal to natural gas usage in the power sector of the
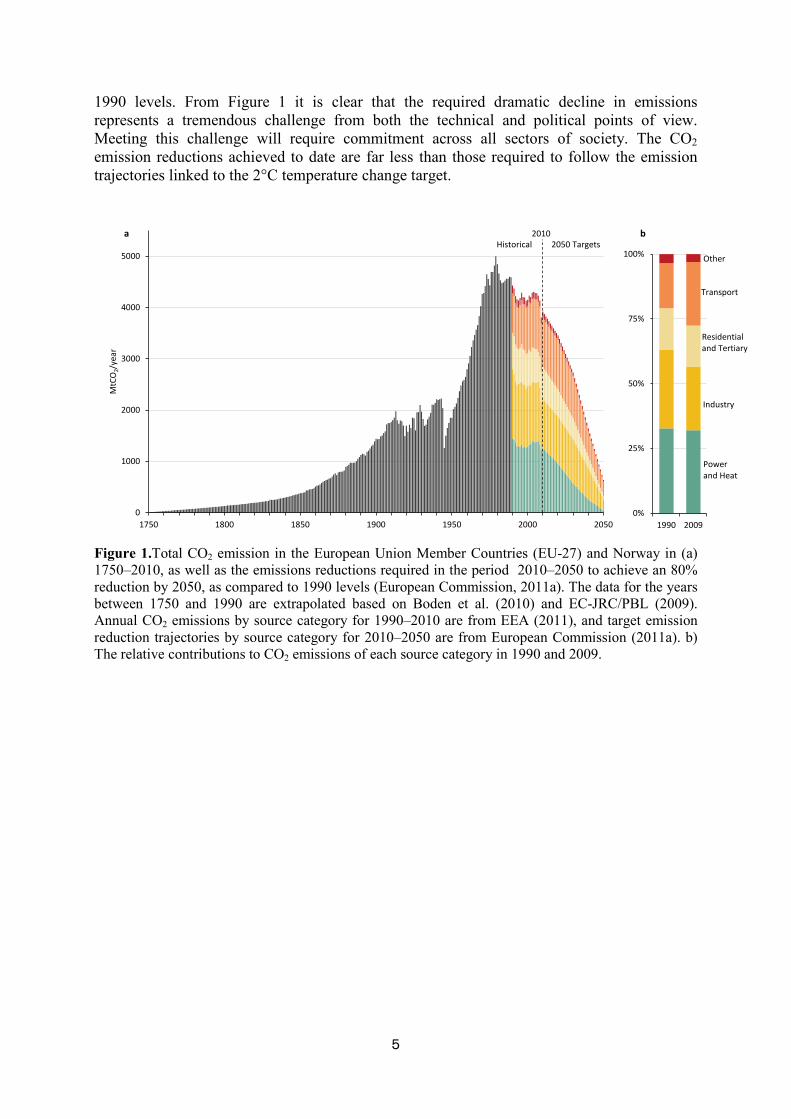
United Kingdom. After Year 2000, the downward trend leveled out somewhat and annual emission levels remained relatively constant until the onset of the global financial crisis. The subsequent economic recession meant that emissions slumped by almost 7% between 2008 and 2009. Figure 1 shows the total annual CO2 emissions in the European Union Member States (EU-27) and Norway between 1750 and 2010, as well as the reductions in emissions required to meet the aforementioned Year 2050 target. Emissions of CO2 from stationary sources in the power and heat and industrial sectors account for 60% of the CO2 emissions and 50% of the total GHG emissions. The European Commission has estimated the magnitude of reductions required in each sector of the economy to achieve an 80% reduction of GHG emissions by 2050, as compared to the respective levels in 1990 (European Commission, 2011a). The Commission estimates that CO2 emissions from the power sector will need to be reduced by 40%–44% by 2030 and by 93%–97% by 2050, and that emissions from the industrial sectors will need to be reduced by 34% –40% by 2030 and by 83%–87% by 2050, as compared to the
5
1990 levels. From Figure 1 it is clear that the required dramatic decline in emissions represents a tremendous challenge from both the technical and political points of view. Meeting this challenge will require commitment across all sectors of society. The CO2 emission reductions achieved to date are far less than those required to follow the emission trajectories linked to the 2°C temperature change target.
Figure 1.Total CO2 emission in the European Union Member Countries (EU-27) and Norway in (a) 1750–2010, as well as the emissions reductions required in the period 2010–2050 to achieve an 80% reduction by 2050, as compared to 1990 levels (European Commission, 2011a). The data for the years between 1750 and 1990 are extrapolated based on Boden et al. (2010) and EC-JRC/PBL (2009). Annual CO2 emissions by source category for 1990–2010 are from EEA (2011), and target emission reduction trajectories by source category for 2010–2050 are from European Commission (2011a). b) The relative contributions to CO2 emissions of each source category in 1990 and 2009.
0%
25%
50%
75%
100%
1990 2009
Other
Transport
Industry
Powerand Heat
Residential and Tertiary
0
1000
2000
3000
4000
5000
1750 1800 1850 1900 1950 2000 2050
MtC
O2/
year
Historical 2050 Targets2010a b

6
3 Description of key characteristics of the industries
3.1 Power sector
The structure of the electricity generation sector varies considerably across the EU Member States. Climatic conditions, resource availability, strategies for handling security of supply, and other national priorities have influenced the evolution of energy mixes in the Member States. Fossil fuels have, together with nuclear and hydro power, served as the backbone of European power production for more than half a century, and fossil-fueled power plants still account for more than half of the electricity supply in the EU-27 (coal, ~30%; gas, ~20%; and oil, ~3%). Energy-related CO2 emissions have been targeted by a number of policies, and the energy mix has gradually become diversified. Two notable trends over the last two decades have been the sharp increase in natural gas usage in power production and the rapid expansion of wind power capacity. The share of EU electricity production capacity covered by natural gas has more than doubled since 1995. At the same time, wind power has gone from contributing only marginally to the electricity production capacity in most Member States to account for more than 10% of the installed capacity in the EU-27 in 2011 (EWEA, 2012). According to the European Wind Energy Association’s estimations, wind power contributed approximately 6% of the EU’s gross final electricity consumption in 2011. The total share of renewable energy sources for electricity generation rose from 13% in 1990 to 17% in 2008 (EEA, 2009). While hydropower remains the largest source for renewable electricity generation, expansions of the wind and biomass resources have made the greatest contributions to the growth in electricity generated from renewable energy sources since 1990. Electricity and heat production represent the single largest source of CO2 emissions in the EU. Total CO2 emissions from power and heat production amounted to 1220 MtCO2 in 2009, down from 1322 MtCO2 in 2008. A small subgroup of large thermal power plants (~540) is responsible for approximately 30% of the total CO2 emissions in the EU. Hard coal- and lignite-fired power plants (~180) account for almost 20% and natural gas-fired plants (~170) are responsible for 6% of the CO2 emissions. Power and heat producers in the five Member States with the highest number of large fossil-fueled thermal plants (hard coal, lignite, and natural gas), i.e., Germany, UK, Poland, Italy, and Spain, emitted approximately 855 MtCO2 in 2008.
3.2 Petroleum refineries
The European petroleum refining industry was limited in size up to World War II. After the war, rapid economic growth, an abundant supply of inexpensive crude oil, and the discovery of domestic oil and gas deposits caused a rapid increase in oil consumption and expansion of the petroleum refining industry. In Western Europe, oil-refining capacity grew 40-fold in the period 1950–1970 (Molle and Wever, 1984). A considerable share of the current capital stock is a legacy of this post-war expansion. More than 90% of European refineries were built before 1980 (European Commission, 2010). Most of the European refineries were originally built to produce petrol for cars and fuel oil for power generation, although product demand has gradually changed (UKPIA, 2006). Currently, there are 114 refineries in the EU-27, with
7
a combined capacity of approximately 770 Mt/yr. Refineries can be found in 22 of 27 EU Member States, and they range in size from small topping and specialty refineries to high-conversion cracking refineries (European Commission, 2009a). While there are differences in the supply and demand equilibrium between Member States, the European petroleum refining industry as a whole is struggling to meet the domestic demand mix. The demand for diesel currently exceeds production capacity, while European refineries produce a surplus of gasoline. The total demand for refined petroleum products is predicted to grow slowly over the coming decades. The widening gap between the demands for gasoline and diesel and the penetration of alternative fuels and powertrains are expected to continue to put pressure on EU refineries. Portions of the demand changes are likely to be met through increased trade (i.e., gasoline export and imports of gasoil/diesel and alternative fuels) and the emergence of new actors in the fuel/powertrain markets (i.e., shifts towards alternative fuels and increased penetration of electric vehicles). Mineral oil refining involves several production steps, whereby crude oil is purified, separated, and transformed into a wide array of petroleum products. A modern refinery typically consists of an integrated network of separate processing units. Most of the flue gas emissions result from the generation of heat and electricity. The furnaces and boilers that feed the different sub-processes are fueled by a mixture of petroleum coke, still gas (refinery gas, i.e., byproducts of the refining process), petroleum fuels, and natural gas. The levels of energy use and CO2 emissions vary depending on the type of crude oil being processed and on the mix and quality of the final products. Therefore, the total level of CO2 emissions from a refinery is the sum of several emission sources of varying size. Process heaters and steam boilers are responsible for the major share of the CO2 emitted from a typical refinery. While both overall GHG emissions and fossil fuel-related CO2 emissions have declined in the EU since 1990 (cf. Fig. 1), the emissions from European (EU-27) petroleum refineries increased by approximately 18% between 1990 and 2008. This trend was largely driven by increasing demand for fuel in the transport sector in general and by increasing demand for lighter distillates in particular. However, in 2009, as a result of the economic crisis, the total annual CO2 emissions from petroleum refineries in the EU-27 and Norway were 147.4 MtCO2 in 2009, down 6.5% from Year 2008. Seven countries, Germany, UK, Italy, France, Spain, Netherlands, and Belgium, account for 75% of the total crude capacity, as well as 75% of the total CO2 emissions from the oil refining industry in the EU. EU petroleum refineries have experienced significant changes in market conditions over the past decades. EU refineries are currently struggling to adapt to a situation in which diesel has come to dominate the EU road fuel market and in which product specifications are being gradually tightened. To maintain their role on the internal fuel markets, EU refineries will have to invest so as to adapt output to the changing demand. Investments in new processing capacity (e.g., hydro cracking and desulfurization) will likely lead to increased energy intensity and off-set some of the potential for CO2 abatement. Key abatement options for the petroleum-refining industry include: Abatement measures that could be taken in the near future include: continued improvements in energy efficiency; fuel switching (e.g., using natural gas instead of residual fuels as energy source); and increased use of biomass feedstock as fuel. CO2 capture could be an option in the longer term (Paper II). Providing excess heat for district heating or integrating process flows with adjacent industries (e.g., petrochemical industries) are additional ways for refineries to
8
contribute to reducing CO2 emissions off-site. It should be noted that few of these abatement strategies are directly additive. Paper II and the references cited therein give a more thorough review of strategies for reducing CO2 emissions in the refining industry.
3.3 Iron and steel industry
Steel production has been a cornerstone of European industry and many European economies for more than a century. Rising demand and technological breakthroughs (i.e., the introduction of the oxygen steelmaking process) prompted the European steel industry to increase considerably its capacity in the 1950’s and 1960’s. The predecessor to the EU, the European Coal and Steel Community, was established in 1951 as an attempt to facilitate the management of European coal and steel resources (Poelmans, 2009). Given its strategic importance, much of the European steel industry remained either state-owned or under stringent governmental regulation up until the 1990’s. Thereafter, the industry became largely privatized, and it has undergone large-scale consolidation so that today the five largest steel companies account for more than 60% of steel production in the EU. Even though the European share of the global steel market has gradually declined, the EU remains the second largest steel-producing region in the world. From 2005 to 2008, the total output of crude steel in the EU-27 remained between195 Mt/yr and 210 Mt/yr. Similar to most other manufacturing industries, the iron and steel industry was severely affected by the financial crisis and economic crisis, which caused crude steel output to fall by 30% in 2009, as compared to 2008. The four largest steel-producing countries, Germany, France, Italy, and Spain, account for more than 55% of steel production (Eurofer, 2010). The iron and steel industry is extremely energy-intensive and the production of primary steel is associated with significant CO2 emissions. Although the sector has a complex industrial structure, the following two production routes dominate production (European Commission, 2009b): Integrated steel plants. This is the most common production route. It involves a series
of interconnected production units (coking ovens, sinter plants, palletizing plants, blast furnaces, basic oxygen furnaces, and continuous casting units), which process iron ore and scrap metal to crude steel. Coke, which is derived from coal, often functions as both a fuel and reducing agent.
Mini-mills. Scrap metal, direct reduced iron, and cast iron are processed in electrical arc furnaces to produce crude steel.
Nearly 60% of the steel produced in the EU-27 is produced through the integrated route (coking oven, blast furnace, basic oxygen furnace). The remainder is produced in electric arc furnaces, while a very small fraction (~0.3%) is produced in open-hearth furnaces (WSA, 2010). Whereas primary steelmaking (integrated route) dominates EU production, the secondary steelmaking route (electrical arc furnaces) is gradually gaining market shares. Currently, there are 36 integrated steel plants (with 85 blast furnaces and 102 basic oxygen furnaces) and 222 electrical arc furnaces operating in the EU-27 (Plantfacts, 2009). A large proportion of the capital stock involved in primary steelmaking in the EU was commissioned during the post-war expansion of the steel industry. More than 80% of the blast furnaces
9
(corresponding to approximately80% of the production capacity) were commissioned before 1980. Total CO2 emissions from installations involved in the production of iron and steel in the EU-27 were approximately 160 Mt CO2/yr before the economic recession caused steel demand, and CO2 emissions, to fall drastically in 2009. Primary steelmaking in integrated steel plants is responsible for more than 85% of the direct CO2 emissions from the iron and steel industry. The predominant steel-producing countries, Germany, France, and the UK account for more than 50% of the CO2 emissions. The blast furnaces utilized in the integrated route represent the single largest source of CO2 emissions in the steel industry. The direct CO2 emissions associated with the secondary route are relatively low, since the electrical arc furnace uses electricity as its primary energy input (secondary CO2 emissions associated with the electrical arc furnace process are highly dependent upon the energy mix in the electricity supply system). Key emissions abatement options in the steel industry include: Improved energy efficiency. The European steel industry has managed to improve considerably the energy efficiency of the production process over the last decades. However, a multitude of measures, both in primary and secondary steelmaking, could be implemented that would reduce significantly energy use and associated CO2 emissions (for a comprehensive review, see e.g., European Commission, 2009b). Fuel shift. The blast furnace is the single most energy-consuming process in the production of steel. Coke, which is derived from coal, often functions as both a fuel and reducing agent. Replacing coke with natural gas or bio-coke could potentially reduce CO2 emissions from the blast furnace process. Carbon capture and storage. Opportunities for CO2 capture in the steel production vary depending on the process and the feedstock used (Paper I). The largest flow of CO2 in a conventional integrated steel mill is generated in the blast furnace. Recovery of CO2 from blast furnace gas is a feasible capture option for the steel industry (IPCC, 2005). Applying current end-pipe technologies to existing blast furnaces, ~30% of the overall CO2 emissions from a conventional integrated steel plant could be captured. Capture could be applied to other gas flows in the production process, although the costs are likely to be higher, since the volumes and concentrations CO2 are lower. One of the most promising opportunities for CO2 capture in the steel industry is to replace or retrofit conventional blast furnaces with Top Gas Recycling Blast Furnaces (TGR-BF). In a TGR-BF, the CO2 is separated from the BF gas and the remaining CO-rich gas stream is recirculated back into the furnace. Simultaneously replacing the preheated air with pure oxygen would ensure that the blast furnace gas stream was free of N2, thereby simplifying CO2 capture. It has been estimated that 70% of the CO2 emitted from an integrated steel plant could be recovered if TGR-BF with CO2 capture was introduced (IPCC, 2005). Structural change. Secondary steelmaking in electrical arc furnaces is expected to continue to gain market share at the expense of primary steelmaking in integrated steel plants, thereby lowering the carbon intensity of EU steel production. New steelmaking processes. The Ultra-Low Carbon dioxide Steelmaking (ULCOS) consortium is investigating innovative steelmaking processes that have the potential to reduce
10
considerably CO2 emissions from the EU steel industry (for a review, see ULCOS, 2011). The ULCOS consortium has identified a number of process technologies that could reduce CO2 emissions by at least 50% compared to the current best routes (often in combination with CCS).
3.4 Cement industry
Reconstruction programs after World War II created a strong demand for cement and marked the start of the expansion of the European cement industry. The development of industry and infrastructure and increased urbanization stimulated cement demand until the oil crisis in the 1970’s. More than 70% of the cement kilns in the EU-27 were commissioned during this period. Currently, there are 268 cement plants in the EU-27 (of which 250 are listed in the Chalmers IN database), with a total of 377 kilns. Production capacities range from a couple of hundred to several thousand metric tonnes of cement per day. Dry process kilns account for approximately 90% of European cement production. The remaining 10% is produced in semi-dry or semi-wet process kilns (7.5%) and in wet process kilns (2.5%). The annual production of cement in the EU-27 has remained at 230–270 Mt cement/yr over the last decade (Cembureau, 2011). 2009 marked an exception, as the cement industry was seriously affected in that year by the downturn in the European economy; cement production dropped by more than 20% between 2008 and 2009. Imports to and exports from the EU have to date been relatively limited, although concerns have been raised regarding competition from cement producers located in countries that lack carbon constraints, i.e., countries of North Africa. The transport of cement is costly, especially road transport, and cement markets have therefore traditionally clustered in regions that are close to the eventual customers. Shipping allows for more cost-efficient transportation and permits cement producers that are located near the sea (or inland waterways) to access a wider market. The European cement industry is one of the most concentrated in the world. The five largest European companies account for almost 60% of the total European cement output (Ecofys, 2009). In a cement plant, calcium carbonate (CaCO3) and different forms of additives are processed to form cement. Significant amounts of electricity are used to power both raw material preparation and cement clinker grinding, and large quantities of fuel are needed in the clinker burning process. The levels of energy use and related CO2 emissions vary depending on the choice of production route and kiln technology. Depending on the efficiency of the process, the mix of fuels used, and the specifications of the cement, the production of one tonne of cement currently results in the release of 0.65–0.95 t CO2. Almost all of the direct CO2 emissions from cement production arise from the clinker burning process. Approximately 60% of the CO2 emissions originate from the calcination process, with the remaining CO2 emissions being related to fuel combustion (European Commission, 2009b). As cement production peaked in 2007, the total direct CO2 emissions from the EU cement industry were just over 170 MtCO2. The countries with the largest outputs, Italy, Spain, Germany, France, Greece, and Poland, together account for approximately 65% of the total CO2 emissions. Cement production and the associated CO2 emissions have decreased considerably since the peak of production in 2007.
11
Key emissions abatement options in the cement industry include: Continued energy efficiency improvements. These improvements involve the retrofitting and replacement of process equipment in existing plants and the deployment of best-available technologies in new cement plants. The theoretical minimum thermal energy demand for the production of cement clinker is 1.60–1.85 GJ per tonne clinker. In Europe, the specific thermal energy demand currently varies from 3.0 GJ per tonne for dry-process manufacturing with multistage preheating and precalcining to 6.5 GJ per tonne clinker for wet-process long kilns and the production of special cements (European Commission, 2009b). Electricity accounts for 10%–20% of the energy consumed in cement manufacturing, and electricity demand ranges from 90–150 kWh/t cement. Alternative fuel use. The replacement of conventional fuels (typically coal and pet-coke) with less-carbon-intensive fuels is an option. Alternative fuels include both fossil-based (e.g., industrial and municipal waste) and biomass-based fuels (animal meal, agricultural residues, recycled wood and paper). The average substitution rate in the EU-27 is currently around 18%. The use of alternative fuels, however, varies widely between Member States; in some countries the substitution rate is >50% (WBCSD, 2009). Clinker substitution. Replacing the clinker in the cement with additives with similar properties reduces energy usage and the CO2 emissions per unit of mass of the finished cement product. Substitutes include blast furnace slag (a byproduct of primary steelmaking) and fly ash (from coal-fired power plants). In Europe, the average clinker content of cement is currently in the range of 78%–85% (European Commission, 2010b). The clinker to cement ratio could probably be lowered further without jeopardizing product quality or performance. Carbon capture and storage. With large absolute CO2 emissions and relatively high concentrations of CO2 in the flue gas streams (~20%), the cement industry is an early candidate for the implementation of CCS. However, the European cement industry is still in an early stage of CCS implementation in pilot or demonstration projects. Two options for CO2 capture in the European cement industry have been pointed out as being particularly interesting (see Paper I and references therein). Post-combustion capture could be applied utilizing the same basic principles that are being developed for coal-fired power plants. It has been estimated that 95% of the CO2 emissions from a cement plant could be avoided if post-combustion capture was introduced. The regeneration of the CO2 capture solvent would, however, require additional generation of steam, thereby increasing slightly the overall level of CO2 emissions. Oxy-combustion with CO2 capture could be applied both in the precalciner and in the kiln; by targeting the precalciner only, the impacts on the clinkerization process could be minimized. Approximately 50% of the CO2 from a cement plant could be captured using the oxy-combustion precalciner setup. New cement-making processes. Several alternative materials, with mechanical properties similar to those of Portland cement, are currently being developed (for a review, see WBCSD, 2009). Innovative low-carbon (and/or negative-carbon) cements could replace Portland cement and offer opportunities for extensive reductions in CO2 emissions. However, these processes are still in the early stages of development and have yet to be proven either technically or economically viable.
12
4 Methodology The three sub-studies that form the basis of this thesis are all aimed at assessing technologies and measures that could facilitate CO2 emission reductions in the EU power and industrial sectors. The analysis is restricted to the technical potentials for CO2 emissions reductions and thus, largely neglects potential economic and institutional constraints. All of the studies (Papers I–III) are based on a bottom-up approach with representation of the current technology stock and of emerging technologies and processes. Bottom-up studies related to industry energy use and GHG emissions include a wide variety of studies, ranging from bottom-up modeling studies of entire sectors to detailed engineering studies of specific processes (e.g., based on detailed process simulations). They have, however, a common basis in focusing on the technological (or techno-economic) potential for improvements with regards to energy use and or CO2 emissions, and typically involve precise descriptions of the capital equipment and technical options (Greening et al. 2007; Pathways, 2010). To analyze the possibilities and limitations imposed by the present energy infrastructure, the emphasis in this thesis is on descriptions of the current status of the assessed sectors. An essential element of this approach is to consider how aspects such as the age structure of the capital stock, technology and fuel mix, and spatial distribution of the plant stock contribute to facilitating or hindering the shift towards less-emission-intensive production processes. Therefore, an important part of the work has been the establishment of a detailed database concerning the infrastructure of EU industry. This database, the Chalmers Industry database (Chalmers IN db), is one of five sub-databases in the Chalmers Energy Infrastructure database. The main features of the Chalmers IN db are described in detail in Section 4.4. The studies reported in Papers I and II apply the same basic methodological approach, whereby the description of the current industry structure forms the basis for assessing the potential for key mitigation technologies and measures. Paper I investigates the branch- and plant-specific conditions for the implementation of CCS. The overall potential for CO2 capture in industrial applications is estimated based on a number of basic assumptions. Only large point sources are assumed to be suitable for CO2 capture; 0.5 MtCO2/yr is arbitrarily chosen as representing an emission level that would entail CO2 avoidance costs that would make capture economically viable. Furthermore, CO2 capture is assumed to be limited to the major flue gas streams of the respective processes. The analysis also involves an evaluation of two alternative setups for capture technologies and an assessment of the implications of the spatial distribution of large industrial emission sources (i.e., their locations in relation to other large CO2 emission sources and to storage sites). Similarly, Paper II assesses the prospects for improved energy efficiency, fuel switching, and CCS in a bottom-up analysis of the EU petroleum refining industry. In addition, the analysis includes the mapping of access to infrastructures, such as district heating networks, natural gas grids, chemical industries, and possible CCS storage sites, which could facilitate measures to reduce CO2 emissions in the refining industry. Paper III applies a scenario analysis to explore the limits for CO2 emission abatement within current production processes in the power and industrial sectors. By generating scenarios that
13
describe changes in the technology stock, energy intensities, and fuel and production mixes, emission trajectories for the period 2010–2050 are derived. The analysis covers power generation, petroleum refining, iron and steel production, and cement manufacturing in the EU-27 and Norway. The most distinctive feature of the analysis is the treatment of capital stock turnover. Based on the age structure of the existing capital stock and assumptions regarding the average technical lifetime of key process technologies, capital stock turnover is simulated up to Year 2050 for each sector.
4.1 Modeling of industrial energy use and CO2 emissions
Studies of industrial energy use and CO2 emissions involve application of a broad set of analytical tools from several different disciplines. Greening et al. (2007) and Algehed et al. (2009) distinguishes between six main categories of empirical tools aimed at understanding and projecting changes in industrial energy consumption CO2 emissions: Energy trend decomposition methods. Apply decomposition techniques to identify key drivers behind changes in the aggregate energy intensity for industry to assess the relative impacts arising from structural change and energy efficiency or other factors. Econometric methods. Involve a range of statistical approaches to measure economic relations between key variables, e.g., fuel prices, energy demand, price elasticity and economic growth. Parameter values, relating changes in one variable to changes in another, are typically estimated on the basis of historical data. ‘Top-down’ models. Includes aggregate models of the whole economy aimed at studying price-dependent interactions between the energy system and the rest of the economy. Typically attempts to realistically portray microeconomic decision-making and to capture macro-economic feedbacks. Each production sector is often represented as a single production function which limits the level of technological detail. ‘Bottom-up’ or engineering models. This class of models includes detailed representation of current and emerging technologies within the energy sector or subsector (i.e. an industry branch). Include both optimization and simulation models aimed at assessing the impact of different technological developments on energy use and CO2 emissions. Often omit linkages between the energy and/or industry sectors and the rest of the economy and are therefore fail to capture macro-economic feedback loops. ‘Hybrid’ models. Combine features from top-down and bottom-up models to overcome some of the limitations associated with these approaches. Attempts to integrate the technological explicitness of bottom-up models with the micro-economic realism and macro-economic feedbacks of top-down models. Industry-specific micro-economic analyses. Include studies of specific industries or processes within industries involving detailed analyses utilizing, e.g., statistical or optimization techniques. One central differentiator between the analytical approaches is to what extent current and emerging technologies are represented. As discussed above, while no formal modeling is applied, the present work builds on a bottom-up approach. Technological explicitness is
14
particularly important in the energy-intensive industrial sector, where the potential exists for large, discrete jumps in types of technologies (Algehed et al., 2009). While barriers and constraints other than technological, e.g. economic and institutional, will contribute to determine whether the required emission reductions will be achieved or not technology will be a key enabler. Thus a common basis in all of the studies (Papers I–III) is precise descriptions of the current capital stock and of technical options that could contribute to reducing CO2 emissions from the assessed sectors.
4.2 Technological change
In Papers I and II, the potentials for reductions in emissions of key mitigation technologies and measures are provided as fixed estimates without an explicit consideration of the timing of their implementation. Thus, neither of these papers considers the dynamics of technical change, i.e., the expected rate of capital stock turnover. Paper III takes the analysis a step further by investigating how the expected turnover in capital stock of the existing infrastructure will contribute to facilitating or hindering the shift towards less-emission-intensive production processes. This approach builds on the assumption that the rate of introduction of low-carbon technologies to the market place, in the absence of premature retirement of capital, is limited to the rate of capital stock turnover, if emission reductions are to remain affordable (Philibert, 2007; Worrell and Biermans, 2005). As discussed above (cf. Section 3) a characteristic shared by all the sectors assessed in the present work is an ageing capital stock that is heavily dependent upon the use of fossil fuels. Since the technological lifetime of a key process technology is typically limited to ~30–50 years, a considerable share of the existing capital stock will have to undergo major refurbishments or will need to be replaced within the coming decades. Thus, assumptions regarding the types of technologies that will be available to replace the current stock and the timing of a possible breakthrough in new low-carbon process technologies will obviously have a major impact on the outcome of the analysis. However, since many of the technologies that are expected to contribute significantly to reductions in CO2 emissions are still in the early phases of development, such assumptions are associated with significant uncertainties. In Paper III, by disregarding the assumptions related to the potential and performance of mitigation technologies that are not yet commercially available but that are assumed to significantly contribute to CO2 emission reductions between now and 2050, an indirect measure of the requirements for new low-carbon technologies and industrial production processes is provided. Taken together, Papers I–III provide a comprehensive assessment of the roles of technologies and measures that are commercially available today and of emerging technologies that are still in their early phases of development.
4.3 Scenario analysis
Energy future studies have been used in the field of energy systems analysis at least since the 1960s (Nilsson et al., 2011). Energy scenarios can be divided in three main categories; predictive (What will most likely happen?), explorative (What can happen?) or normative (How can a certain objective be reached?) (Söderholm et al., 2011). The scenarios applied in Paper III belong to the two latter categories. While the scenarios exploring the limits for reductions in CO2 emissions within current production processes in the industrial sectors are best described as explorative, the three scenarios of this work for the future development of

15
the power sector are examples of normative scenarios aimed at assessing what it will take to reduce emission levels in the power sector to close to zero leading up to Year 2050. Scenario studies are useful to illustrate how long-term goals give implications for short-term action. The motivation for applying scenario analysis is typically to inform current decision makers by expanding people’s judgment about plausible features and by pointing to key uncertainties, barriers or opportunities. However, the use of scenarios as analytical or communicative tool is not entirely unproblematic. Based on a review of the literature on human judgment under uncertainty Morgan and Keith (2008) argue that while intended to help expand peoples thinking, detailed scenarios may cause users to overlook a wide variety of alternate developments and to overestimate the probabilities of the alternatives that are presented. With respect to the many low carbon scenarios developed in recent years, a common critique involves the failure to factor in the role of institutional change in achieving different energy futures (Hughes and Strachan, 2010; Nilsson et al., 2011; Söderholm et al. 2011).
4.4 The Chalmers Energy Infrastructure database
The Chalmers Energy Infrastructure database was designed to cover both the supply side and the demand side of the European energy systems (Kjärstad and Johnsson, 2007; Pathways 2011b). The database is divided into the following sub-databases: the Chalmers Power Plant database (Chalmers PP db); the Chalmers Fuel database (Chalmers FU db); the Chalmers CO2 Storage database (Chalmers CS db); and the Chalmers Member States database (Chalmers MS db). The Chalmers IN db was established as part of the work leading up to this thesis. This new sub-database currently includes facility-level data on industrial installations included in the EU ETS. The database is continuously updated and its scope has been continuously expanded throughout the work with the studies reported in Papers I–III. In its present form, the database includes information on more than 10,000 stationary CO2 emission sources in the energy and industrial sectors. Together, these installations account for approximately half of the EU’s total CO2 emissions (~2,100 MtCO2 in 2008). For large emission sources (>0.5 MtCO2/yr), the database carries information on, e.g., process technologies, production capacity, fuel mix, and age of capital stock. This category includes a relatively small number of large thermal power plants (~540), refineries (~85), integrated steel plants (~35), and cement plants (~150), which are collectively responsible for almost 40% of total CO2 emissions in the EU. The only major stationary CO2 emission sources currently not covered in the database are the petrochemical and other chemical industries and ammonia production plants, which together emit approximately 180 MtCO2/yr (Ecofys, 2006). The main features of the Chalmers IN db are presented in Table 1.

16
Table 1. Main features of the Chalmers IN db. Data sources: Cembureau, (2001); IEA GHG, (2006); OGJ, (2007); EPER, (2009); GCD, 2009; Steel Institute VDEh, (2009); E-PRTR, (2010); CITL, (2010).
Comprises the EU-27 countries plus Norway and Liechtenstein.
Covers seven industrial sectors, mineral oil refineries (150), coking ovens (20),
metal ore roasting or sintering installations (30), installations for the production of pig iron or steel (240), installations for the production of cement clinker or lime (560), installations for the manufacture of glass (440), installations for the manufacture of ceramic products (1000), and industrial plants for the production of pulp, paper or board (850). In addition to the >3200 industrial installations, the database specifies emissions and allocated emission allowances for installations classified as combustion installationsa in the EU ETS Directive (including >7000 installations for the combustion of fuels with a total rated thermal input exceeding 20 MW).
Specifies emissions and allocated emission allowances, including the verified CO2 emissions and allocated emission allowances for the period 2005–2010 and the allocated emission allowances for the period 2005–2012.
Contains the exact locations (country, city, address, and geographical co-ordinates) of plants with CO2 emissions exceeding 0.5 MtCO2/yr.
Describes plant-level characteristics. For refineries, iron and steel plants, cement plants, and pulp and paper plants, the database carries information on process technologies, production capacity, fuel mix, and age of capital stock. For more details on the coverage of:
- refineries, iron and steel plants, and cement plants, see Paper III and references therein;
- pulp and paper industries, see Jönsson and Berntsson, 2010 and references therein. a The category includes activities that range from the relatively small scale, e.g., smaller boilers, furnaces, and heaters, to large coal- and gas-fired power plants.

17
5 Results and discussion From the results presented in Papers I–III, it can be concluded that achieving deep reductions in emissions (~85%–95% reduction by 2050, as compared to levels in 1990) within the power and industrial sectors in less than four decades will be a tremendous challenge. Meeting the targets will require rapid and comprehensive implementation of mitigation technologies and measures that are commercially available today and emerging technologies that are still in the early phases of development. The results presented in Paper I indicate that some 60-75 percent of the emissions from large industry point sources could be avoided annually if the full potential of emerging CCS technologies was to be realized. Furthermore, several regions were identified as being particularly suitable to facilitate integrated networks for the transportation and storage of the captured CO2. The most promising prospects for early deployment of CCS are found in the regions bordering the North Sea. Paper II illustrates how the access to infrastructures, such as district heating networks, natural gas grids, chemical industries, and possible CCS storage sites, which could facilitate CO2 abatement in the petroleum refining industry, is optimal in the Member States that border the North Sea. Furthermore, it is shown that the potential for currently available mitigation measures in the refining industry is relatively limited and that the potential for CO2 capture varies widely depending on which sub-process is targeted. In Paper III, it is shown that near-term targets for emissions reductions in the power and industrial sectors can probably be met through measures that are already available, such as increased energy efficiency, optimization of production processes, and shifts in the usage of fuel and feedstock mixes. Nevertheless, despite assumptions made regarding moderate (steel and cement) or negative (petroleum products) output growth, an almost complete renewal of the capital stock (with the exception of the petroleum refinery industry) and extensive implementation of available abatement measures, the results indicate that total emissions from the assessed sectors in 2050 would exceed by more than twofold the targeted levels. Thus, to realize the goals of future, stricter, emission targets, more radical alterations to production processes are required. Reducing CO2 emissions from the power sector to virtually zero up to Year 2050 is a prerequisite for achieving the objective of significant cuts in emissions. This is the situation since there are several available technologies for reshaping the electricity generation system. Therefore, it is important to accelerate the transformation of this sector. As for the industrial sectors the results from Papers I – III show that:
- Current options of reducing CO2 emissions from industrial sources will not be sufficient to achieve deep emissions reduction in the EU industrial sectors (Paper III).
- For the three industrial sectors covered by the present work – petroleum refining, iron
and steel and cement manufacturing – CCS is one of few technological options that allows for deep reductions in CO2 emissions (Papers I and II).
18
Thus, the work presented in this thesis highlights the importance and urgency of developing new low-carbon technologies in the industrial sectors, in which the options to reduce CO2 emissions tend to be fewer and less-developed than in the power sector. Looking forward, based on the findings presented in this thesis (Papers I–III), from a technology perspective, the basic challenges for each sector can be summarized as follows:
- In the power sector, even if there is still room for significant improvements in the performance of many of emerging technologies, the challenge primarily involves the development of the physical infrastructures required to facilitate large-scale diffusion of emerging technologies with low- or zero-carbon emissions (e.g., infrastructures for electricity transmission and storage and for CO2 transportation and storage) (Paper III);
- In the iron and steel and cement manufacturing sectors, in which breakthrough technologies are still in their infancy, to enable significant reductions in emissions up to Year 2050, the ongoing efforts to develop new steel- and cement-making processes must be accelerated considerably (Papers I and III); and
- In the refinery sector, the challenge is, to a greater extent than in the other sectors, intimately linked to the developments in the end-use sectors. The first priority must be to continue efforts to develop alternative fuels and alternative powertrains in the transport sector. While the solution lies outside the refinery gates, it is also important to explore further the prospects for the application of CO2 capture in the refining process (Papers I–III).
Despite sometimes conflicting interests, the EU and its Member States had managed up until the current economic crisis to enforce a reasonably potent mix of policies aimed at facilitating the transition towards a low-carbon economy. While the EU ETS has succeeded in imposing a price for CO2 emissions, that price has to date been too low to incentivize fundamental changes with regards to technology and the fuel mix. With the exception of a few upswings and downswings, the price of EU Emission Allowances has remained in the range of 10–25 €/tCO2 since 2005. At the time of writing, however, the price is less than 10 €/tCO2 for the fifth consecutive month. In the third trading period (Phase III, 2013–2020), a stricter cap will be enforced. A cause for concern is that significant numbers of surplus allowances will be carried over from Phase II to Phase III, which risks inflating the emissions budget for Phase III. In addition, while no formal decision has yet been taken as to the precise number of free allowances allocated to each installation, sectors that are deemed to be exposed to significant risk of carbon leakage (all of the industrial sectors assessed in this thesis fall into this category) will most likely continue to receive a significant share of their emission allowances free of charge throughout Phase III. As emphasized above, the technological transition required to reduce radically the CO2 emissions of the EU power and industrial sectors in less than four decades involves both the phasing out of current carbon-intensive technologies and the phasing in of new zero- or low-carbon technologies. A CO2 price set at a level significantly higher than it is today is a prerequisite for incentivizing near-term mitigation measures, as well as for stimulating investments aimed at further developing emerging technologies and processes. However, developing and phasing in new zero- or low-carbon technologies, at scale, will require complementary policy interventions, including RD&D funding, support for niche markets,

19
and adaptation of infrastructure policies (Wilson and Grubler, 2011; Azar and Sandén, 2011; Vogt-Schilb and Hallegatte, 2011). While policy support plays an important role in the development and deployment of many low-carbon technologies, it is especially crucial for CCS. This is because, in contrast to, e.g, renewable energy or applications of energy efficiency, CCS generates no income, nor other market incentives, so long as the cost of emitting CO2 remains low (IEA, 2012).

20
6 Future work A first priority will be to synthesize the work carried out in Papers I and III, to assess how capital stock turnover influences the penetration rate of CCS and to estimate the increases in industry energy demand under different scenarios for the scope of the deployment of CO2 capture. A logical continuation of the work presented here is to develop tools for analyzing how changes in the consumption and production of energy-intensive, basic materials (e.g., steel and cement) affect the overall demands for energy and electricity in the EU (see e.g., Schade et al, 2009). The outcome of this type of analysis could be used as an input to the Pathways electricity supply model package (Pathways, 2011b). There are several other areas of research for which investigations of the interlinkages between the industrial and power sectors would be interesting. One example could be to explore the opportunities for electricity demand-side management in the industrial sectors, which might facilitate a high penetration of intermittent renewables. Another example would be to assess the impact, in terms of e.g., CO2 emissions and energy use, of the required transformation process itself (see e.g., Myhrvold and Caldeira, 2011). Finally, to compare the relative costs of different abatement options and to demonstrate how costs vary across different sectors, one could investigate how the Marginal Abatement Cost Curves (MACC) concept could be applied to develop further the analysis presented in this work (for a critical review of the concept see, e.g. Murphy and Jaccard, 2011; Vogt-Schilb and Hallegatte, 2011; Kesicki and Ekins, 2012).
21
References Algehed, J., Wirsenius, S., and Jönsson, J., 2009. Modelling energy efficiency and carbon dioxide emissions in energy-intensive industry under stringent CO2 policies: comparison of top-down and bottom-up approaches and evaluation of usefulness to policy makers. Proceedings of eceee 2009 summer study (pp. 1181-1191). Azar, C. and Sandén, B.A., 2011. The elusive quest for technology-neutral policies. Environmental Innovation and Societal Transitions, 1(1), 135-139. Elsevier B.V. doi:10.1016/j.eist.2011.03.003 Boden, T.A., G. Marland, and R.J. Andres, 2010. Global, Regional, and National Fossil-Fuel CO2 Emissions. Carbon Dioxide Information Analysis Center, Oak Ridge National Laboratory, U.S. Department of Energy, Oak Ridge, TN, U.S.A. doi 10.3334/CDIAC/00001_V2010 CEMBUREAU, 2001. World Cement Directory 2002, The European Cement Association, Cembureu, Brussels, Belgium. CITL, 2011. “Data on allocation and compliance”, Community Independent Transaction Log, European Commission, Brussels, available at: http://ec.europa.eu/environment/ets/. Ecofys, 2006. Inclusion of additional activities and gases into the EU ETS, Report under the project “Review of EU Emissions Trading Scheme”, Ecofys, Brussels. ECF, 2010. Roadmap 2050 – A Practical Guide to a Prosperous Low-Carbon Europe, European Climate Foundation (ECF). EEA, 2009. Greenhouse gas emission trends and projections in Europe 2009, European Environment Agency, Report No. 9/2009. EEA, 2011a.Annual European Union greenhouse gas inventory1990–2009 and inventory report 2011, Submission to the UNFCCC Secretariat, European Environment Agency (EEA), Technical report No.2/2011. EEA, 2011b. Greenhouse gas emissions in Europe: a retrospective trend analysis for the period 1990–2008, European Environment Agency (EEA), EEA Report No 6/2011. European Commission , 2009a. Refinery capacities and balances (EU27). Directorate General for Energy and Transport. European Commission, 2009b. Draft Reference Document on Best Available Techniques for the production of Iron and Steel, Draft 2 (July 2009), Integrated Pollution Prevention and Control, Joint Research Centre, European Commission, Seville, Spain. European Commission, 2010a. Draft Reference Document on Best Available Techniques for Mineral Oil and Gas Refineries, Draft 1 (July 2010), Integrated Pollution Prevention and Control, Joint Research Centre, European Commission, Seville, Spain.

22
European Commission, 2010b. Draft Reference Document on Best Available Techniques in the Cement, Lime and Magnesium Oxide Manufacturing Industries, Integrated Pollution Prevention and Control, Joint Research Centre, European Commission, Seville, Spain. European Commission, Joint Research Centre (EC-JRC) andNetherlands Environmental Assessment Agency (PBL), 2009. Emission Database for Global Atmospheric Research (EDGAR), release version 4.0. http://edgar.jrc.ec.europa.eu. European Commission, 2011a. Communicationfrom the Commission to the European Parliament, the Council, the European Economic and Social Committee and The Committee of the Regions, A Roadmap for moving to a competitive low carbon economy in 2050, COM(2011) 112 final, Brussels, 8.3.2011. European Union, 2003. “Directive 2003/87/EC of the European Parliament and of the Council establishing a scheme for greenhouse gas emission allowance trading within the Community and amending Council Directive 96/61/EC”, Directive 2003/87/EC of the European Parliament and of the Council, Official Journal of the European Union, L 275/32. European Union, 2009. “Directive 2009/29/EC of the European Parliament and of the Council of 23 April 2009 amending Directive 2003/87/EC so as to improve and extend the greenhouse gas emission trading scheme of the Community”, Directive 2009/29/EC of the European Parliament and of the Council, Official Journal of the European Union, L 140/63. EPER, 2009, “European Pollutant Emission Register”, available at: http://eper.ec.europa.eu/ (accessed 4 May 2009). E-PRTR, 2010. “The European Pollutant Release and Transfer Register”, available at: http://prtr.ec.europa.eu/ (accessed 29 March 2010) EWEA, 2012. Wind in power 2011 - European statistics. The European Wind Energy Association (EWEA), February, 2012. Fruehan, R.H., Fortini, O., Paxton H.W. and Brindle, R., 2000.Theoretical Minimum Energies to Produce Steel for Selected Conditions.Carnegie Mellon University, Pittsburgh, PA. GCD, 2009. Global Cement Directory (GCD) 2009, Pro Publications International Limited, Epsom, Surrey, United Kingdom. Greening, L.A., Boyd, G., and Roop, J.M., 2007.Modeling of industrial energy consumption: An introduction and context. Energy Economics, 29(4), 599-608. Gummer, J. and Moreland, R., 2002. The European Union & Global climate change – A Review of Five National Programmes. Sancroft International Ltd. Report prepared for the Pew Center on Global Climate Change, June 2000. Heaton, G., Repetto, R. and Sobin, R., 1991. Transforming Technology: An Agenda for Environmentally Sustainable Growth in the 21st century. World Resources Institute, Washington D.C., USA.

23
Hughes, N., and Strachan, N., 2010. Methodological review of UK and international low carbon scenarios. Energy Policy, 38(10), 6056-6065. ELSEVIER SCI LTD. Retrieved from http://discovery.ucl.ac.uk/408832/ IEA, 2012. Tracking Progress in Carbon Capture and Storage. International Energy Agency (IEA) and the Global CCS Institute report to the third Clean Energy Ministerial, April 2012. IEA GHG, 2006. Updating the IEA GHG Global CO2 Emissions Database: Development Since 2002, International Energy Agency Greenhouse Gas R&D Programme, Technical Study, Report Number 2006/7. IPCC, 2005. IPCC Special Report on Carbon Dioxide Capture and Storage, Prepared by Working Group III of the Intergovernmental Panel on Climate Change [Metz, B., O. Davidson, H. C. de Coninck, M. Loos, and L. A. Meyer (eds.)], Cambridge University Press, Cambridge, United Kingdom and New York, NY, USA, 442 pp. Jönsson, J and Berntsson, T., 2010.Analysing the Potential for CCS within the European Pulp and Paper Industry. Conference paper, Published in the Proceedings of 23nd Conference on Efficiency, Cost, Optimization, Simulation and Environmental Impact of Energy Systems (ECOS), pp. 676-683 Kesicki, F., and Ekins, P., 2012. Marginal abatement cost curves: a call for caution. Climate Policy, 12(2), 219-236. Taylor & Francis. doi:10.1080/14693062.2011.582347 Kjärstad, J. and Johnsson, F., 2007.The European power plant infrastructure – Presentation of the Chalmers energy infrastructure database with applications, Energy Policy, Vol. 35 No. 7, pp. 3643-3664. http://dx.doi.org/10.1016/j.enpol.2006.12.032 Molle, W. and Wever, E., 1984. Oil Refineries and Petrochemical Industries in Europe, GeoJournal, Vol. 9 No. 4, pp. 421-430. Morgan, M.G., and Keith, D.W., 2008. Improving the way we think about projecting future energy use and emissions of carbon dioxide. Climatic Change, 90(3), 189-215. doi:10.1007/s10584-008-9458-1 Murphy, R., and Jaccard, M., 2011. Energy efficiency and the cost of GHG abatement: A comparison of bottom-up and hybrid models for the US. Energy Policy, 39(11), 7146-7155. doi:10.1016/j.enpol.2011.08.033 Myhrvold, N. P., and Caldeira, K. 2012. Greenhouse gases, climate change and the transition from coal to low-carbon electricity. Environmental Research Letters, 7(1), 014019. doi:10.1088/1748-9326/7/1/014019 Nilsson, M., Nilsson, L. J., Hildingsson, R., Stripple, J., Eikeland, P. O. (2011). The missing link: Bringing institutions and politics into energy future studies. Futures, 43(10), 1117-1128. doi:10.1016/j.futures.2011.07.010 OGJ, 2007.Worldwide refining survey. (ed.) Koottungal L., Oil & Gas Journal (OGJ), December 2007.
24
Overgaag, M., Harmsen, R., and Schmitz, I. A., 2009. Sectoral Emission Reduction Potentials and Economic Costs for Climate Change - Industry and refineries sector. European Commission, DG Joint Research Centre, Institute for Prospective Technological Studies (JRC-IPT) and Ecofys, Brussels, Belgium. Pathways, 2010. Opportunities for reducing CO2 in European industry until 2050 - a synthesis of industry analyses within the Pathway project. Report prepared by Andersson, E., and Nyström, I., CIT IndustriellEnergi AB. AGS Pathways report 2010:EU3, Mölndal, Sweden. Pathways, 2011a. European Energy Pathways - Pathways to Sustainable European Energy Systems. (ed.) Filip Johnsson, Project report, January 2011, ISBN: 978-91-978585-1-9, Mölndal, Sweden. Pathways, 2011b. Methods and Models used in the project Pathways to Sustainable European Energy Systems. (ed.) Filip Johnsson, Project report, January 2011, ISBN: 978-91-978585-2-6, Mölndal, Sweden. Philibert, C., 2007. Technology Penetration and Capital Stock Turnover: Lessons from IEA Scenario Analysis. OECD/IEA, COM/ENV/EPOC/IEA/SLT(2007)4, Paris. Poelmans, E., 2009.The emergence of the ‘coastal steelworks’ in the European Coal and Steel Community (ECSC), 1952-1967, Economic History Research Group, Center for Economic Studies, K.U. Leuven, Belgium. SEI, 2009. Europe’s Share of the Climate Challenge Domestic Actions and International Obligations to Protect the Planet. Stockholm Environmental Institute (SEI) in partnership with Friends of the Earth Europe, Stockholm, Sweden. Schade, W., Jochem, E., Barker, T., Catenazzi, G., Eichhammer, W., Fleiter, T., Held, A., Helfrich, N., Jakob, M., Criqui, P., Mima, S., Quandt, L., Peters, A., Ragwitz, M., Reiter, U., Reitze, F., Schelhaas, M., Scrieciu, S. and Turton, H., 2009. ADAM 2-degree scenario for Europe – policies and impacts. Deliverable D-M1.3 of ADAM (Adaptation and Mitigation Strategies: Supporting European Climate Policy). Project co-funded by European Commission 6th RTD Programme. Karlsruhe, Germany. Smil, V., 2005. Energy at the crossroads – global perspectives and uncertainties, The MIT Press, Cambridge, Massachusetts. Steel Institute VDEh, 2009. Description of the Plantfacts database, Steel Institute VDEh, Technical information department and Library. Stern, N., 2007. The Economics of Climate Change – The Stern Review.Cambridge University Press, Cambridge, UK. Söderholm, P., Hildingsson, R., Johansson, B., Khan, J. and Wilhelmsson, F., (2011). Governing the transition to low-carbon futures: A critical survey of energy scenarios for 2050. Futures, 43(10), 1105-1116. doi:10.1016/j.futures.2011.07.009 UKPIA, 2006. Meeting our energy need: The Future of UK Oil Refining. Watson, M., Vandervell, N., UK Petroleum Industry Association Ltd, London.

25
ULCOS, 2011. Ultra-Low Carbon dioxide Steelmaking, more information available at: www.ulcos.org (accessed 21 April 2012). Vogt-Schilb, A., and Hallegatte, S., 2011. When Starting with the Most Expensive Option Makes Sense - Use and Misuse of Marginal Abatement Cost Curves.Policy Research Working PaperWPS5803, The World Bank, Washington, D.C. WBCSD, 2009. Cement technology roadmap 2009 – Carbon emissions reductions up to 2050. OECD/IEA and World Business Council for Sustainable Development. Wilson, C. and Grubler, A., 2011. Lessons from the history of technological change for clean energy scenarios and policies. Natural Resources Forum, 35, 165-184. Worrell, E., Biermans, G., 2005. Move over! Stock turnover, retrofit and industrial energy efficiency. Energy Policy, 33(7), 949-962. Elsevier. doi:10.1016/j.enpol.2003.10.017 WSA, 2010. Steel Statistical Yearbook 2010. Brussels, Belgium, World Steel Association.
