determinants of carbon dioxide emissions in asean+3 of carbon dioxide... · determinants of carbon...
TRANSCRIPT
DETERMINANTS OF CARBON DIOXIDE EMISSIONS IN
ASEAN+3
Teoh Xin Di
Bachelor of Economics with Honours
(Industrial Economics)
2015
DETERMINANTS OF CARBON DIOXIDE EMISSIONS IN
ASEAN+3
TEOH XIN DI
This project is submitted in partial fulfillment of
the requirements for the degree of Bachelor of Economics with Honours
(Industrial Economics)
Faculty of Economics and Business
UNIVERSITY MALAYSIA SARAWAK
2015

Statement of Originality
The work described in this Final Year Project, entitled
“Determinants of Carbon Dioxide Emissions in ASEAN+3”
is to the best of the author’s knowledge that of the author except
where due reference is made.
Date
Teoh Xin Di
39126

ABSTRACT
DETERMINANTS OF CARBON DIOXIDE EMISSIONS IN ASEAN+3
By
Teoh Xin Di
This study is carried out to investigate the determinants of carbon dioxide emissions
in ASEAN+3 (Brunei, Cambodia, China, Indonesia, Japan, South Korea, Laos,
Malaysia, Myanmar, Philippines, Singapore, Thailand and Vietnam) during the
period 1991 to 2010. The methodologies that been employed in this study include Im,
Pesaran and Shin Panel Unit Root Test, Pedroni (Engle-Granger based)
Cointegration Test and Granger-Causality based on Vector Error Correction Model
(VECM). Result from panel unit root test shows that all the variables are integrated
of order one, I(1). For the cointegration test, the results indicate that a long
relationship is exist between carbon dioxide emissions, energy consumption,
economic growth, urbanization, trade openness and transportation. The empirical
results show that economic growth is directly caused by carbon dioxide emissions,
energy consumption, urbanization, trade openness and transportation in ASEAN+3.
In short, economic growth, energy consumption and trade openness are the
determinants of CO2 emissions in ASEAN+3.
ABSTRAK
PENENTU PENGELUARAN KARBON DIOKSIDA DI ASEAN+3
Oleh
Teoh Xin Di
Kajian ini bertujuan untuk mengkaji penentu pengeluaran karbon dioksida dalam
tempoh 1991 hingga 2010 di ASEAN+3 (Brunei, China, Filipina, Indonesia, Jepun,
Laos, Kemboja, Korea Selatan, Malaysia, Myanmar, Singapura, Thailand dan
Vietnam). Metodologi yang digunakan dalam kajian ini ialah Ujian Kepegunan
Panel Im, Pesaran dan Shin, Ujian Kopengamiran Pedroni (Engle-Granger based)
dan Ujian Penyebab Granger dalam Ujian Pembetulan Ralat Vektor (VECM).
Keputusan daripada ujian kepegunan panel menunjukkan bahawa semua
pembolehubah adalah pegun dalam perbezaan pertama. Dalam ujian kopengamiran,
keputusan menunjukkan bahawa terdapat satu hubungan jangka panjang antara
pengeluaran karbon dioksida, penggunaan tenaga, keluaran dalam negara kasar,
pembandaran, keterbukaan perdagangan dan pengangkutan. Hasil kajian
menunjukkan bahawa keluaran dalam negara kasar disebabkan secara langsung oleh
pengeluaran karbon dioksida, penggunaan tenaga, pembandaran, keterbukaan
perdagangan dan pengangkutan di ASEAN+3. Ringkasnya, keluaran dalam negara
kasar, penggunaan tenaga dan keterbukaan perdagangan adalah penentu karbon
dioksida di ASEAN+3.
ACKNOWLEDGEMENT
I would like to express my gratitude and appreciation to all those who gave me all
the way support in doing this Final Year Project and the possibility to complete this
study.
Firstly, I would like to express my sincere gratitude to my supervisor, Dr.
Rossazana Ab. Rahim, who has assisted in giving me constructive advises, support
and invaluable suggestion throughout the period in accomplishing my Final Year
Project.
Next, I would like to express my sincere thanks to my beloved family and
friends for moral support and encouragement from beginning of until the end of the
study.
Moreover, I would like to thank my course mates for their tolerance and
cooperation in sharing their point of view and ideas with some precious advices.
Without them, it would have been impossible for me to finish this project.
TABLE OF CONTENTS
List of Tables ............................................................................................................ viii
List of Figures ............................................................................................................. ix
Chapter One: Introduction
1.1 Introduction ....................................................................................................... 1
1.2 Research Background........................................................................................ 4
1.3 Background of ASEAN+3 ................................................................................ 8
1.4 Background of Carbon Dioxide Emissions in ASEAN+3 .............................. 10
1.5 Problem Statement .......................................................................................... 15
1.6 Objectives of the Study ................................................................................... 17
1.7 Significance of the Study ................................................................................ 18
1.8 Organization of the Study ............................................................................... 19
Chapter 2: Literature Review
2.1 Introduction ..................................................................................................... 20
2.2 Theoretical Studies .......................................................................................... 20
2.2.1 Environmental Kuznets Curve (EKC) ................................................... 20
2.2.2 Energy Consumption ............................................................................. 21
2.2.3 Economic Growth ................................................................................. 22
2.2.4 Urbanization .......................................................................................... 23
2.2.5 Trade Openness ..................................................................................... 23
2.2.6 Transportation ........................................................................................ 24
2.3 Empirical Studies on Determinants of Carbon Dioxide (CO2) Emissions ...... 25
2.3.1 Energy Consumption ............................................................................. 25
2.3.2 Economic Growth .................................................................................. 26
2.3.3 Urbanization .......................................................................................... 26
2.3.4 Trade Openness ..................................................................................... 27
2.3.5 Transportation ........................................................................................ 28
2.4 A Remark ........................................................................................................ 28
Chapter Three: Methodology
3.1 Introduction ..................................................................................................... 42
3.2 Data Description.............................................................................................. 42
3.3 Research Framework ....................................................................................... 43
3.4 Empirical Model.............................................................................................. 43
3.5 Methodology ................................................................................................... 44
3.5.1 Panel Unit Root Test .............................................................................. 44
3.5.2 Pedroni (Engle-Granger based) Cointegration Test ............................... 46
3.5.3 Granger-Causality Based on Vector Error Correction Model (VECM) 47
Chapter Four: Empirical Results and Discussions
4.1 Introduction ..................................................................................................... 49
4.2 Descriptive Statistics ....................................................................................... 49
4.3 Panel Unit Root Test ....................................................................................... 51
4.4 Pedroni (Engle-Granger based) Cointegration Test ........................................ 52
4.5 Granger-Causality Based on Vector Error Correction Model (VECM) .......... 54
4.6 Discussion of the Results ................................................................................ 58
Chapter Five: Conclusion and Recommendation
5.1 Introduction ..................................................................................................... 60
5.2 A Summary of Results .................................................................................... 60
5.3 Policy Implication ........................................................................................... 62
5.4 Limitations and Recommendations ................................................................. 62
References .................................................................................................................. 64
viii
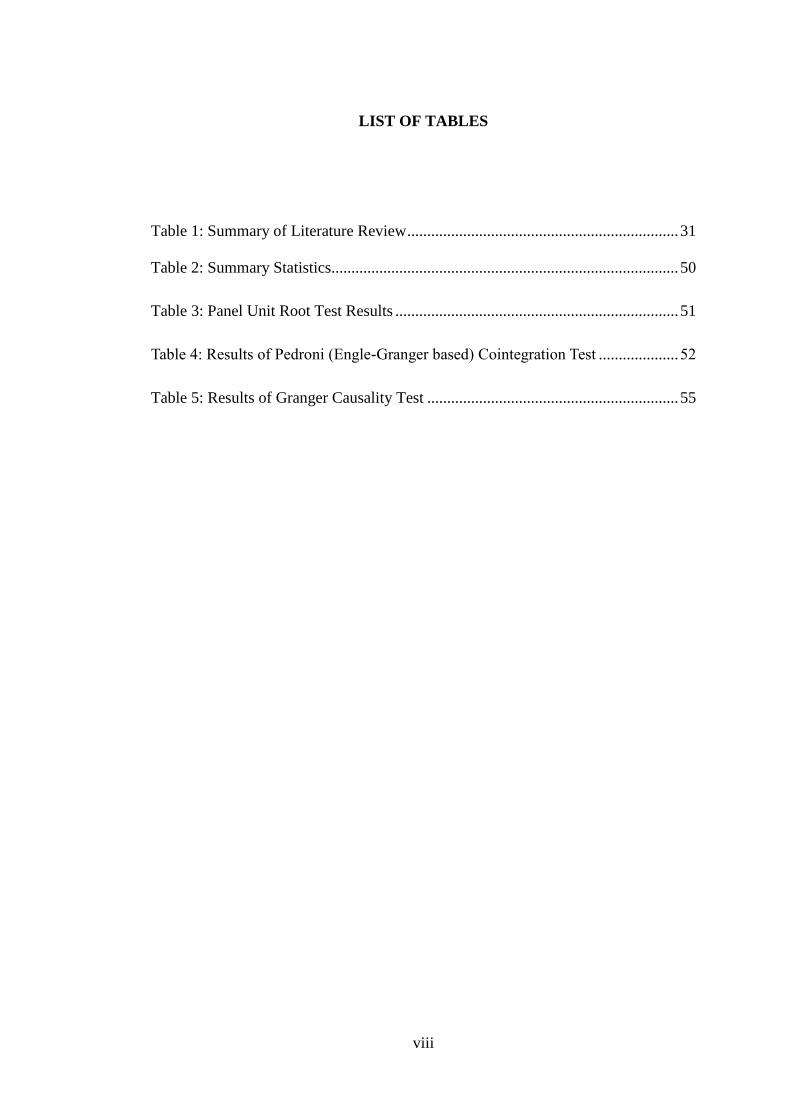
LIST OF TABLES
Table 1: Summary of Literature Review .................................................................... 31
Table 2: Summary Statistics....................................................................................... 50
Table 3: Panel Unit Root Test Results ....................................................................... 51
Table 4: Results of Pedroni (Engle-Granger based) Cointegration Test .................... 52
Table 5: Results of Granger Causality Test ............................................................... 55
ix
LIST OF FIGURES
Figure 1: CO2 emissions from fossil-fuel use and cement production ....................... 2
Figure 2: Carbon dioxide emissions in ASEAN countries (1970 to 2010) .................. 9
Figure 3: Carbon dioxide emissions in ASEAN+3 (1970 to 2010) ........................... 13
Figure 4: Short Run Causality Direction .................................................................... 54
1
CHAPTER ONE
INTRODUCTION
1.1 Introduction
In the last decades, climate change has been the major concern of developing
countries and developed countries. The effects related to climate change are the long-
term rise of sea level, higher frequency of tropical storms and alarming rate of
cardiovascular and respiratory disease (Stocker et al., 2009). Moreover, global
climate change is also expected to increase the vector-borne diseases incidence,
especially malaria and dengue. Centers for Disease Control and Prevention (2014)
stated that dengue is the world's fastest growing vector-borne disease, especially in
Southeast Asia and Latin America. Due to changes in temperature, some of the
Association of Southeast Asian Nations (ASEAN) countries are suffering from the
increasing vector-borne diseases incidence (Loevinsohn, 1994). The increase in
global temperature is leading to a nature phenomenon which is global warming.
Increase in greenhouse gases emissions, resulting from the increasing carbon dioxide
concentrations, has become a major threat of global warming.
One of the main causes of global warming is carbon dioxide. Increasing
amount of carbon dioxide generated by human activities into the environment is due
to the deforestation and growing world-wide consumption of fossil fuels. Fossil fuels
consumption such as coal, oil and gas, the main power of source of automobile and
industry had attributed large part to the economic growth and developments.
2
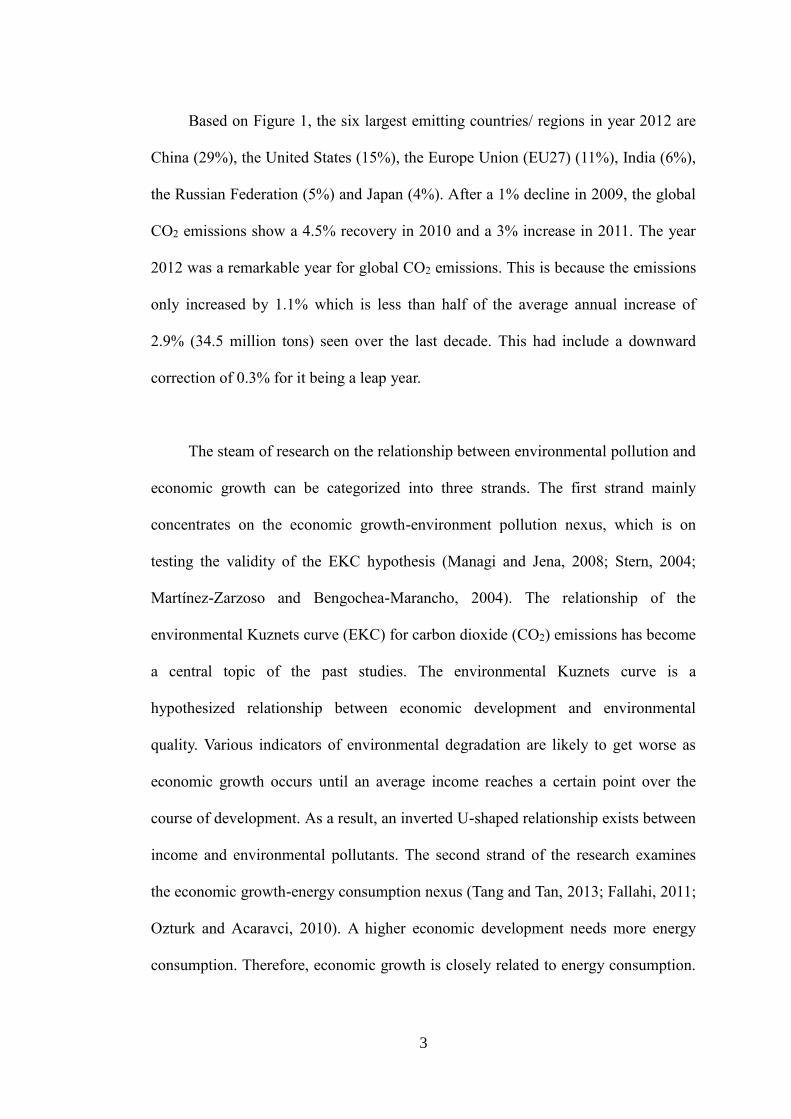
The main causes of human-induced global warming are fossil fuels combustion
and other smaller industrial sources. According to Oliver, Janssens-Maenhout,
Munteen, and Peters (2013), the increase in global emissions of carbon dioxide
(CO2) from these sources has slowed down in 2012. Nevertheless, the global average
annual growth rate of 2.4 ppm in atmospheric CO2 concentrations in 2012 was rather
high. Figure 1 shows the CO2 emissions from fossil-fuel use and cement production
in the top six emitting countries.
Industrialized countries Developing countries
United States China
Russian Federation India
European Union (EU27)
Japan
Figure 1: CO2 emissions from fossil-fuel use and cement production
Source: Oliver, Janssens-Maenhout, Munteen, and Peters (2013).
3
Based on Figure 1, the six largest emitting countries/ regions in year 2012 are
China (29%), the United States (15%), the Europe Union (EU27) (11%), India (6%),
the Russian Federation (5%) and Japan (4%). After a 1% decline in 2009, the global
CO2 emissions show a 4.5% recovery in 2010 and a 3% increase in 2011. The year
2012 was a remarkable year for global CO2 emissions. This is because the emissions
only increased by 1.1% which is less than half of the average annual increase of
2.9% (34.5 million tons) seen over the last decade. This had include a downward
correction of 0.3% for it being a leap year.
The steam of research on the relationship between environmental pollution and
economic growth can be categorized into three strands. The first strand mainly
concentrates on the economic growth-environment pollution nexus, which is on
testing the validity of the EKC hypothesis (Managi and Jena, 2008; Stern, 2004;
Martínez-Zarzoso and Bengochea-Marancho, 2004). The relationship of the
environmental Kuznets curve (EKC) for carbon dioxide (CO2) emissions has become
a central topic of the past studies. The environmental Kuznets curve is a
hypothesized relationship between economic development and environmental
quality. Various indicators of environmental degradation are likely to get worse as
economic growth occurs until an average income reaches a certain point over the
course of development. As a result, an inverted U-shaped relationship exists between
income and environmental pollutants. The second strand of the research examines
the economic growth-energy consumption nexus (Tang and Tan, 2013; Fallahi, 2011;
Ozturk and Acaravci, 2010). A higher economic development needs more energy
consumption. Therefore, economic growth is closely related to energy consumption.
4
In the same way, more efficient energy use requires a higher economic development
level. Finally, the third strand of the research is the combination of the first two
strands, which investigate the dynamic relationship between economic growth,
energy consumption and pollution emissions (Soytas and Sari, 2009; Ang, 2007;
Lean and Smyth, 2010).
1.2 Research Background
As one of the factor of global warming, carbon dioxide (CO2) emissions has been a
popular topic for numerous researches in order to reduce the increasing threat of
global warming. A stream of researchers (Sharma, 2011; Iwata, Okada and Samreth,
2010; Friedl and Getzner, 2003) has analyzed several determinants of CO2 emissions
such as energy consumption, electricity consumption, economic growth,
urbanization, trade openness and transportation. 1
Over the past decade, the CO2 emissions trend mainly reflects energy-related
human activities. These were determined by economic growth, particularly in
emerging countries. In 2012, there was a 'decoupling' of the increase in CO2
emissions from global economic growth in GDP. This points to a shift towards less
fossil-fuel intensive activities, more use of renewable energy and increased energy
saving (Oliver et al., 2013).
1 There are other determinants of CO2 emissions such as cold climate, hot climate and availability of
renewable energy sources (Neumayer, 2004). However, this study only focus on energy consumption,
electricity consumption, economic growth, urbanization, trade openness and transportation.
5
Greater economic growth may involves a higher energy consumption while
lower energy consumption may results in lower economic growth. To produce
energy, the burning of fossil fuel is needed because it is used in the production
processes of goods and services. In order for higher level of energy to be produced to
cover the energy consumption, more carbon dioxide gas emissions are produced and
these eventually pollute our surrounding environment.
Continuous growth in urbanization and industrialization leads to increases in
energy consumption and consequently to greater atmospheric pollution. Over the last
150 years, factors like the increase in life expectancy, reduced child mortality, and
improved farming methods have resulted in rapid and exponential growth of the
world population.
Since roads are built at where people live, big countries have a larger road
network, but the road length depends on how scattered the population is over the
whole land areas. Countries with populations spatially scattered across a big land
area need to have higher transportation requirements as goods and people need to
move over longer distances. Therefore, these countries have higher emissions
compared to smaller countries or those with highly concentrated clusters of
population.
Due to rapid globalization, trade increased significantly associated with
growing agriculture, extraction of minerals, drilling of oil, and transportation. These
activities increase the energy consumption and then carbon emissions. Gases
6
emissions are related directly to global warming and this eventually affect the
environment with the increasing economic growth and trade openness.
Association of Southeast Asian Nations (ASEAN) was formed since 1967,
consisting of Indonesia, Malaysia, Philippines, Singapore and Thailand and later
expanded to include Brunei, Cambodia, Laos, Myanmar and Vietnam. Having a total
land area of 4.436 million square kilometers (3.3% of world land area) and a total
population of 584 million (8.7% of the world population), ASEAN is one of the
fastest growing economic regions and rank as the eighth largest economy in the
world. At an average annual rate of 4.8% for 1994 to 1999, the economy has
experienced a rapid GDP growth again in period of 2000 to 2008 with an annual rate
of 6.5%. Energy consumption had been increased substantially by the continuous
growth in urbanization and industrialization. ASEAN Centre for Energy (ACE) had
estimated the increase of 4.4% in final energy consumption in 2030. The increase is
very much higher than world’s average growth rate of 1.4% per year in energy
demand over 2008 to 2035. Besides, CO2 emissions are also increasing in a similar
way. As ASEAN is moving toward single entity, ASEAN Economic Community
(AEC), thus it is justifiable to investigate the determinants of CO2 emissions.
Decisions had been made to establish the ASEAN Economic Community
(AEC) in the Declaration of ASEAN Concord II in Bali, Indonesia on 7 October
2003 and AEC Blueprint was adopted on 20 November 2007 to serve as a coherent
master plan guiding the establishment of the AEC by 2015. The AEC aims to
transform ASEAN into a region with free movement of goods, services, investment,
7
skilled labor, and freer flow of capital (Association of Southeast Asian Nation,
2014a). As the goal of regional economic integration by 2015, AEC envisages the
following key characteristics: (i) a single market and production base; (ii) a highly
competitive economic region; (iii) a region of equitable economic development; and
(iv) a region fully integrated into the global economy.
To deal with mutual issues and concerns in energy security, natural gas
development, oil market studies, oil stockpiling, and renewable energy, ASEAN have
gone into partnership with the People's Republic of China (PRC), the Republic of
Korea and Japan. Hence, this study embarks the research of the CO2 emissions
determinants on ASEAN+3 due to lack of existing research in ASEAN+3.
Extensive researches on the relationship between carbon dioxide emissions
and economic growth had focused in various countries including ASEAN countries.
However, as far as this research is concerned, there is no studies on the determinants
of CO2 emissions in ASEAN+3 countries yet although ASEAN+3 have been formed
in 1997. ASEAN+3 is formed to increase the cooperation among the East Asia
countries in terms of economy, finance, human resource and social development,
scientific and technical development and infrastructure development. On this note,
this study on CO2 emissions is deemed very important in policy-making processes.
8
1.3 Background of ASEAN+3
Association of Southeast Asian Nations Plus Three (ASEAN+3) member countries
are made up of members of ASEAN and the three Northeast Asian countries. They
are Brunei Darussalam (BRN), Cambodia (KHM), Indonesia (IDN), Lao People's
Democratic Republic (LAO), Malaysia (MYS), Myanmar (MMR), the Philippines
(PHL), Singapore (SGP), Thailand (THA) and Vietnam (VNM) plus Japan (JPN),
People's Republic of China (CHN) and Republic of Korea (KOR).
According to Ministry of International Trade and Industry (2013), the sluggish
growth in Japan had been absorbed by the expansion of China, Korea and ASEAN
and this had increased the share of ASEAN+3 in global GDP. The ASEAN+3
countries’ share in global GDP overtook USA (21.47%) by 2.05 percentage point in
2011 and EU (23.13%) by 1.49 percentage point in 2012. As the share of EU and US
decrease further, ASEAN+3’s around 25% share of global GDP is estimated to
increase to 27% by 2018.
ASEAN+3 began to cooperate in December 1997. When a Joint Statement on
East Asia Cooperation is issued at their Third ASEAN+3 Summit in Manila,
ASEAN+3 institutionalized in 1999. East Asia cooperation decided to strengthen and
deepen at various levels and in various areas by the ASEAN+3 leaders. These
include the areas of political and security, transnational crime, trade and investment,
finance, tourism, public health, food, agriculture, fishery and forestry, minerals,
small and medium enterprises, environment and sustainable development,
9
networking of track II, poverty alleviation, promotion development of vulnerable
groups, culture and people-to-people contact, education, science and technology,
disaster management, energy, transport, and information and communicating
technology (ICT) (Association of Southeast Asian Nation, 2014b).
Therefore, ASEAN Plus Three (APT) Cooperation Work Plan 2013-2017 have
been adopted by the 14th APT Foreign Ministers' Meeting on 30 June 2013. Based on
the assessment and recommendations of the Mid-Term Review of the APT
Cooperation Work Plan 2007-2017, this work plan is revised from the APT
Cooperation Work Plan 2007-2017.
The objective of the work plan is to enhance ASEAN+3 relations and
cooperation in a comprehensive and mutually beneficial manner from year 2013 to
2017. Listed in the Work Plan, one of the activities is to strengthen cooperation in
environment and sustainable development. There is also an activity which is to
strengthen cooperation in addressing the impact of climate change. Therefore, it will
be interesting to find out the determinants of CO2 emissions in ASEAN+3.
10
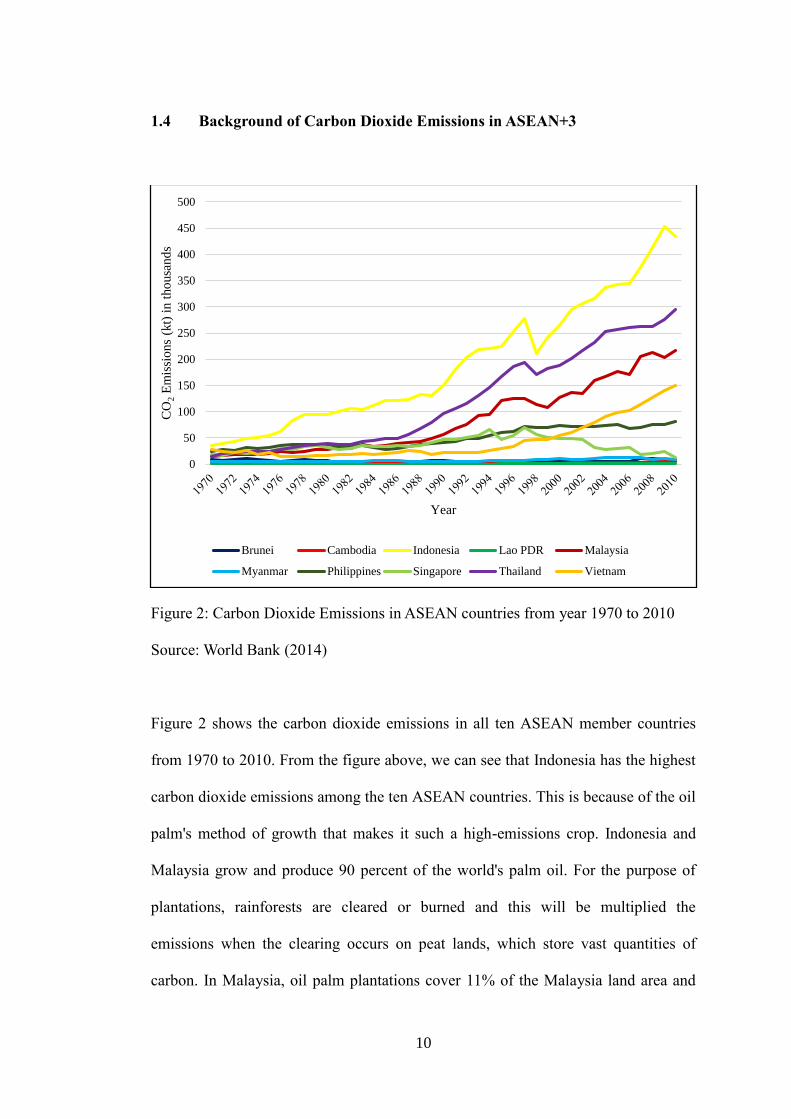
1.4 Background of Carbon Dioxide Emissions in ASEAN+3
Figure 2: Carbon Dioxide Emissions in ASEAN countries from year 1970 to 2010
Source: World Bank (2014)
Figure 2 shows the carbon dioxide emissions in all ten ASEAN member countries
from 1970 to 2010. From the figure above, we can see that Indonesia has the highest
carbon dioxide emissions among the ten ASEAN countries. This is because of the oil
palm's method of growth that makes it such a high-emissions crop. Indonesia and
Malaysia grow and produce 90 percent of the world's palm oil. For the purpose of
plantations, rainforests are cleared or burned and this will be multiplied the
emissions when the clearing occurs on peat lands, which store vast quantities of
carbon. In Malaysia, oil palm plantations cover 11% of the Malaysia land area and
0
50
100
150
200
250
300
350
400
450
500
CO
2E
mis
sio
ns
(kt)
in t
ho
usa
nd
s
Year
Brunei Cambodia Indonesia Lao PDR Malaysia
Myanmar Philippines Singapore Thailand Vietnam
11
have a more than 13 million tons of crude palm oil (CPO) yearly production. Carlson
et al. (2013) expected that by 2020, Indonesian palm oil plantation expansion will
release more than 558 million metric tons of CO2, which is more than Canada's
yearly carbon dioxide emissions. According to Malaysian Department of
Environment (MDOE), the main contributors to Malaysia growing emissions are the
industries including power stations, motor vehicles and open burning. The highest
contributor was the emissions from motor vehicles.
Emitting 4.2 tonnes of carbon into atmosphere per person per year, Thailand is
the 7th largest emitter of carbon dioxide in Asia (Irin, 2008). Thailand's new
government plan to cut CO2 emissions by 15-20 percent from major industrial
companies because of problems related to environmental pollution. Thai government
even wants to taxing vehicles based on CO2 emission starting from 1 January 2016
(Fuels & Lubes Weekly, 2013).
In Vietnam, the CO2 emissions come from coal-fired electric power plants,
according to an international conference in Hanoi. In 2000, with Vietnam's
agricultural sector as main contributor (65 million tonnes or 43%), about 150.9
million tonnes of carbon dioxide were discharged into the environment (VietnamNet,
2011). There was a 113% increase in CO2 emissions from burning fossil fuels and
54% of it was from coal fired plants. With 18.5 percent fired by coal and 36.6
percent by burning oil and gas, the thermal power plants are the source for more than
half of Vietnam's electricity in 2010. In Vietnam, each 1KWh of electricity averagely
creates 0.52kg of carbon dioxide.
12
In Philippines, energy consumption mainly are came from transport sector,
followed by residential and industry sectors. Statistics from Philippine Department
of Energy (2014) show that the road transport fuel consumption and corresponding
CO2 emissions have slowed down with a 0.5% annual growth rate from 2000 to
2010.
Contributing global emissions by less than 0.2%, Singapore still manages to
reduce the carbon emissions by focusing on researches, although Singapore has to
import almost all its energy needs (National Climate Change Secretariat, 2013).
Myanmar has one of the highest rates of forest loss on earth as its yearly
deforestation corresponding to approximately 116 million ton of CO2 (UNEP Risø
Centre, 2013). CO2 emissions in Brunei increased by 2% annually, along with total
energy consumption. Because of unreasoned use of wood for domestic cooking,
deforestation in Cambodia has made its forest cover rate reduce from over 70% in
1970 to 3% in 2007. To reduce carbon emissions, Laos cooperates with Japan and
transfers low carbon technologies to the country.
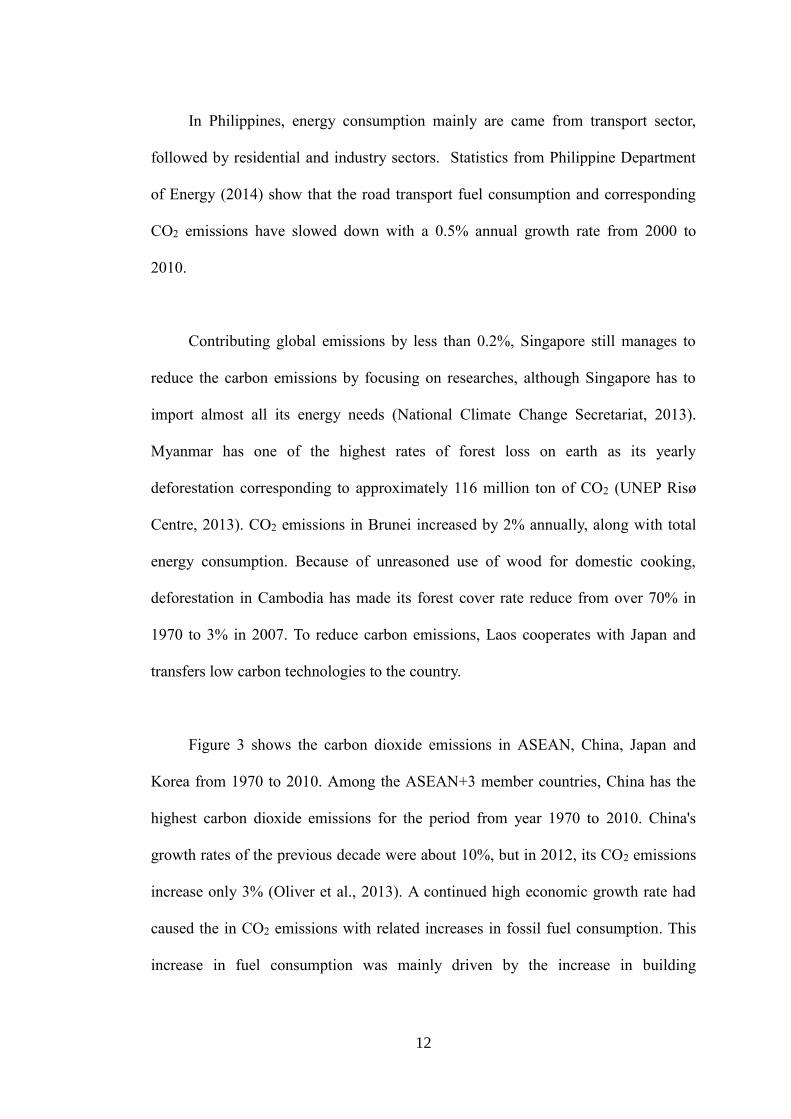
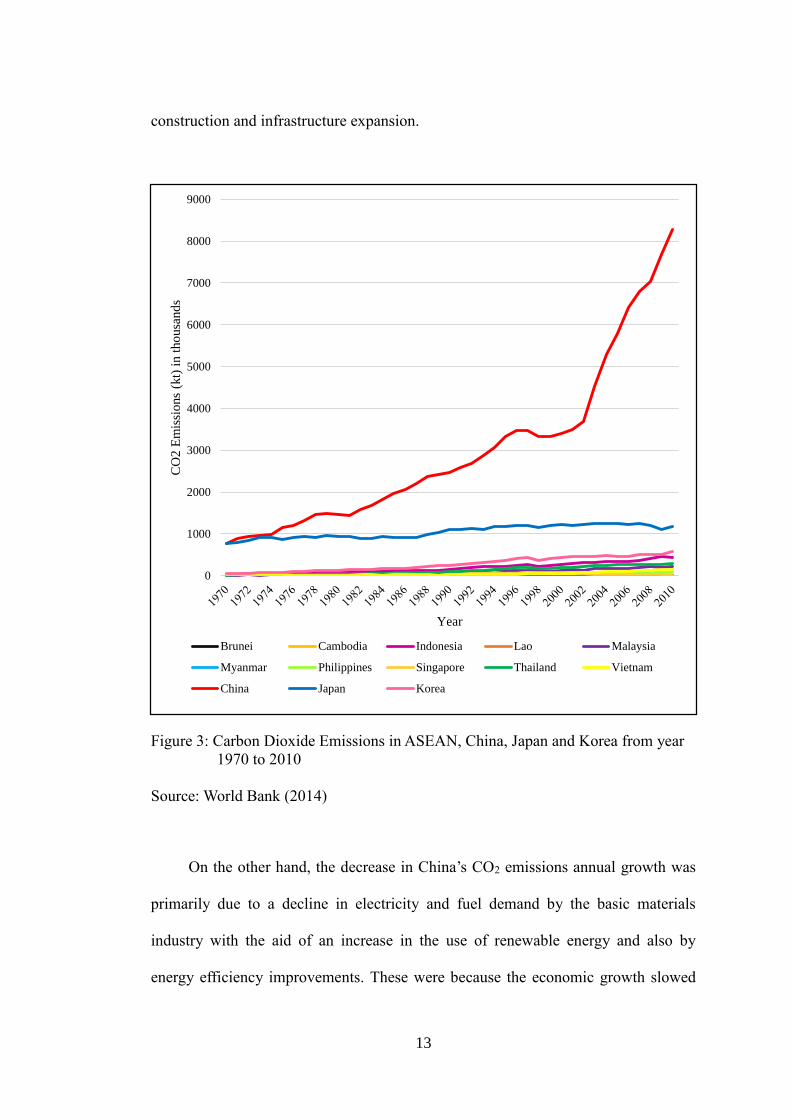
Figure 3 shows the carbon dioxide emissions in ASEAN, China, Japan and
Korea from 1970 to 2010. Among the ASEAN+3 member countries, China has the
highest carbon dioxide emissions for the period from year 1970 to 2010. China's
growth rates of the previous decade were about 10%, but in 2012, its CO2 emissions
increase only 3% (Oliver et al., 2013). A continued high economic growth rate had
caused the in CO2 emissions with related increases in fossil fuel consumption. This
increase in fuel consumption was mainly driven by the increase in building
13
construction and infrastructure expansion.
Figure 3: Carbon Dioxide Emissions in ASEAN, China, Japan and Korea from year
1970 to 2010
Source: World Bank (2014)
On the other hand, the decrease in China’s CO2 emissions annual growth was
primarily due to a decline in electricity and fuel demand by the basic materials
industry with the aid of an increase in the use of renewable energy and also by
energy efficiency improvements. These were because the economic growth slowed
0
1000
2000
3000
4000
5000
6000
7000
8000
9000
CO
2 E
mis
sio
ns
(kt)
in t
ho
usa
nd
s
Year
Brunei Cambodia Indonesia Lao Malaysia
Myanmar Philippines Singapore Thailand Vietnam
China Japan Korea