reduced-order electrochemical model parameters
TRANSCRIPT
2168-6777 (c) 2013 IEEE. Personal use is permitted, but republication/redistribution requires IEEE permission. Seehttp://www.ieee.org/publications_standards/publications/rights/index.html for more information.
This article has been accepted for publication in a future issue of this journal, but has not been fully edited. Content may change prior to final publication. Citation information: DOI10.1109/JESTPE.2014.2331062, IEEE Journal of Emerging and Selected Topics in Power Electronics
Abstract— Recently, extensive research has been conducted in
the field of battery management systems due to increased interest
in vehicles electrification. Parameters such as battery state of
charge and state of health are of critical importance to ensure
safety, reliability, and prolong battery life. This paper includes the
following contributions: (1) tracking reduced-order
electrochemical battery model parameters variations as battery
ages, using non-invasive genetic algorithm optimization technique,
(2) the development of a battery aging model capable of capturing
battery degradation by varying the effective electrode volume, (3)
estimation of the battery critical state of charge using a new
estimation strategy known as the Smooth Variable Structure Filter
based on reduced-order electrochemical model. The proposed
filter is used for state of charge estimation, and demonstrates
strong robustness to modeling uncertainties which is relatively
high in case of reduced-order electrochemical models. Batteries
used in this research are lithium-Iron Phosphate cells widely used
in automotive applications. Extensive testing using real-world
driving cycles are used for estimation strategy application and for
conducting the aging test. Limitations of the proposed strategy are
also highlighted.
Index Terms— Lithium-Ion Batteries, electrochemical battery
model, state of charge estimation, state of health estimation, smooth
variable structure filter.
I. INTRODUCTION
HIS paper involves the identification of the reduced-order
electrochemical model parameters based on aged batteries,
in addition to the application of a battery state of charge
(SOC) estimation strategy. The paper presents an extension to
[1], in which battery model parameters for fresh batteries are
obtained using genetic algorithm. Furthermore, an aging model
has been developed by changing the effective volume of the
electrode to accommodate for battery aging. This section
includes research motivation, peak oil concept, literature review
of battery state of charge estimation techniques, significant
paper research contributions, and the paper outline.
A. Motivation and Technical Challenges
Battery SOC and state of health (SOH) estimation represent
a challenging task, since the traction battery exhibits fast
changing dynamics due to acceleration and deceleration
Manuscript received December 1, 2013; revised January 30, 2014; accepted
April 30, 2014. The review of this paper was co-ordinated by R. Ahmed.
R. Ahmed, M. El Sayed, I. Arasaratnam and S. Habibi are with the
Department of Mechanical Engineering, McMaster University, Hamilton, ON
depending on the driving cycle. In order to ensure a reliable
electric vehicle performance, precise estimation of lithium-Ion
battery SOC and S1OH is crucial [2]. SOC is defined as the
remaining pack capacity thus provides an indication of the
vehicle remaining range [3]. SOH is a measure of the
irreversible degradation that occurs in the battery performance
due to cycling [3]. The current state of the battery is compared
to that of the fresh battery (before cycling) [3]. SOH is a
measure of the battery capability to respond to the required
power demand and alarm if maintenance is required.
Accordingly, an accurate estimation of the battery SOH is
crucial to the battery operation [3]. In general, two main critical
factors are considered when addressing the battery SOH,
namely: capacity fade and power capability. The battery
capacity fade has a huge impact on the vehicle range associated
with customer range anxiety. The second factor is the power
capability which impact the vehicle performance and
drivability. The remaining useful life (RUL) is used to predict
the battery remaining useful time during its life time thus it
represents a proactive act for battery maintenance [3].
Battery SOC and SOH are highly correlated, a trade-off
exists between extending the life-time of the battery and
extending the range of the vehicle [2]. Discharging the battery
to a high level of depth of discharge (DOD) (i.e.: low SOC) is
generally not recommended as it will significantly shorten the
lifetime of the battery. However, this will lead to shorter driving
range as only partial charge is being utilized from the entire
stored charge. In contrast, charging the battery beyond the
acceptable range of operation results in high temperature and
shortens the battery life [2]. Consequently, an accurate SOC
estimate is of utmost importance in electric vehicles; any
deviation in SOC estimation might result in an irreversible loss
of capacity or even battery permanent damage [2].
Since electric and hybrid vehicles have been recently
introduced to the market, it will require some time to assess
their performance in real world operation. In particular, the
battery might suffer from irreversible degradation due to
cycling and that will adversely affects the SOC estimation
accuracy which is of great concern to the driver. The Battery
management system (BMS) has to be adaptive in order to
account for aging and degradation in performance that might
affect the vehicle range of operation and charging efficiency.
L8S4L7, Canada(e-mail: [email protected]; [email protected],
[email protected], [email protected]).
J. Tjong is with Ford Motor Company of Canada, Windsor, ON N8Y 1W2
([email protected]). 1
Ryan Ahmed, Mohammed El Sayed, Ienkaran Arasaratnam, Jimi Tjong, Saeid Habibi
Reduced-Order Electrochemical Model
Parameters Identification and SOC Estimation
for Healthy and Aged Li-Ion Batteries Part II: Aged Battery Model and State of Charge Estimation
T
2168-6777 (c) 2013 IEEE. Personal use is permitted, but republication/redistribution requires IEEE permission. Seehttp://www.ieee.org/publications_standards/publications/rights/index.html for more information.
This article has been accepted for publication in a future issue of this journal, but has not been fully edited. Content may change prior to final publication. Citation information: DOI10.1109/JESTPE.2014.2331062, IEEE Journal of Emerging and Selected Topics in Power Electronics
JESTPE-2013-10-0273 2
For instance, as per October, 2012, there are 112 documented
cases of customers complaining of capacity loss in their electric
vehicles [4]. In addition, around 11.8% of the total number of
Nissan Leaf vehicles sold in Arizona have exhibited a loss in
capacity gauge bars (Note: first capacity bar represents 15%
capacity loss and 6.25 in the subsequent bars) [4].
B. Literature Review
Adaptive techniques for SOC estimation are extremely
important especially for automotive applications where having
an accurate, reliable, and robust estimate is necessary to
mitigate the driver range anxiety concerns and ensure safety. In
the literature, adaptive SOC estimation techniques are classified
to one of the following: Fuzzy Logic, Artificial Neural
Networks, and filter/observer-based techniques (such as
Kalman Filters). The work in this paper will focus on
filter/observer based methods.
In [5], using Kalman filter, a SOC, potentials, and
concentration gradients estimation strategy based on reduced-
order electrochemical battery model is presented. Estimates are
compared against experimental data from a 6 Ah electric
vehicle battery cell [5]. The filter provides accurate and stable
estimates for low current input values. However, at very high
C-rates that leads to near electrode maximum or minimum
concentrations, the estimates exhibit large errors [5]. The filter
used in this research has 4-7 states which is of relatively low
order compared to equivalent circuit-based models [5]. The
presented technique is computationally efficient to run in real-
time applications such as an on-board battery management
system [5].
In [6], a state estimation based on an output error injection
observer using a reduced set of partial differential algebraic
equations describing the solid and electrolyte concentrations
and potentials is presented. Simulation and experimental results
using real-world driving cycles such as the urban dynamometer
driving schedule (UDDS) demonstrate the effectiveness of the
proposed technique. In [7], a state of charge estimation
technique based on a linearized battery model is presented. In
order to overcome the nonlinear behavior of battery models, the
Open circuit voltage-State of charge (OCV-SOC) relationship
has been divided into linear sections and model parameters are
estimated for each section individually [7]. Then based on the
resultant linear model, an observer has been applied to estimate
the state of charge. The technique has been verified using 1.5
Ah lithium-polymer cells [7].
C. Contributions
From the literature, most electrochemical based models did
not account for aging and degradation effects which make them
viable for fresh, healthy batteries only. However, as these
batteries age with time, these models are not accurate and the
SOC estimator might suffer from divergence and instability
problems. Accordingly, developing an adaptive model that can
account for cycling effects is of utmost importance. In addition,
developing an adaptive model can significantly enhance the
existing SOH estimation techniques and can provide an
estimate for the battery RUL. Unlike most of the literature
published to date, most papers that involve reduced-order
electrochemical models are not fitted to experimental data with
SOC estimation, besides, aging effects are generally not
accounted for. Furthermore, tracking the electrochemical model
parameters as battery degrades is crucial, since keeping track of
these parameters that contribute to aging such as diffusion
coefficient, solid-electrolyte interface resistance, and the OCV-
SOC relationship can help in providing an adaptive, high
fidelity model.
In this paper, electrochemical model parameters for aged
batteries are estimated. An extensive accelerated aging test has
been conducted on battery cells at high depth of discharge and
elevated temperatures. The aging test continues until the battery
reaches the battery end-of-life (80% of its capacity). Then a
reference performance test using driving cycles has been
conducted on aged batteries. The paper presents an aging model
that can account for battery degradation at various battery states
of life. The model works by varying the effective electrode
volume, OCV-SOC relationship, solid-electrolyte interface
resistance, and the solid diffusion coefficient thus account for
aging. The model can be practically implemented in a real-time
microprocessor for terminal voltage and state of charge
estimation.
Finally, a battery critical surface charge estimation strategy
has been designed to estimate the state of charge based on the
identified battery model parameters. A strategy known as the
Smooth Variable Structure Filter (SVSF) has been presented for
battery critical surface charge estimation. The proposed
strategy has been selected since it demonstrates robustness to
modeling uncertainties, sensor noise, and to state of charge
initial conditions [8, 9].
D. Paper Outline
This paper is organized as follows: section II involves a
summary of the aging experiments conducted for experimental
data generation. Section III includes battery aging model
development in addition to model parameters identification for
aged batteries. Section IV includes the application of state of
charge estimation and the critical surface charge using the
Smooth Variable Structure Filter (SVSF). Section V presents
conclusions and limitations of the proposed strategy.
II. AGING/REFERENCE PERFORMANCE TEST EXPERIMENTS
Battery test procedures might vary depending on the country
and the application, i.e.: for HEVs, PHEV, or EVs [10]. In this
research, focus on test procedures used for PHEVs and EVs is
attained. In U.S., battery test procedures are generally classified
into 3 main categories: characterization, life, and reference tests
[11].
1. Characterization tests are conducted to specify battery
cell/pack baseline performance characteristics [11].
Examples of these tests include: static capacity, hybrid
pulse power characterization (HPPC), self-discharge, cold
cranking, thermal performance, and efficiency tests [11].
2. Life tests are conducted to determine battery degradation
(aging) effects that take place in both cycle life and
calendar life [11]. Calendar life means the life of the
battery during storage (with no cycling involved) while
cycle life is the life of the battery after multiple
charging/discharging cycles [10]. The main purpose of
2168-6777 (c) 2013 IEEE. Personal use is permitted, but republication/redistribution requires IEEE permission. Seehttp://www.ieee.org/publications_standards/publications/rights/index.html for more information.
This article has been accepted for publication in a future issue of this journal, but has not been fully edited. Content may change prior to final publication. Citation information: DOI10.1109/JESTPE.2014.2331062, IEEE Journal of Emerging and Selected Topics in Power Electronics
JESTPE-2013-10-0273 3
these tests is to perform an accelerated battery aging by
acquiring data in a relatively short time therefore be able
to predict the performance of the battery cell in practice.
In addition, these tests can be used for battery warranty
estimates.
3. Reference performance tests (RPT): are conducted
periodically to track changes that might occur in the
battery baseline characteristics. Reference tests are
performed after conducting a certain number of life tests
to measure the capacity fade and degradation in
performance through the entire progress of battery life
cycle [12]. In addition, these tests are performed at the
beginning (fresh battery) and at the end of life state.
In this paper, a series of the aforementioned experiments
have been conducted on 3 LiFePO4 battery cells.
Characterization/RPT tests have been conducted at two
different states of life, namely: fresh battery (at 100% capacity)
and at 80% capacity. In the following subsection, a summary of
tests conducted is this study.
A. Characterization/RPT tests
Extensive characterization tests have been conducted on a
fresh and aged batteries at controlled room temperature of 25℃, 4 main experiments include: A static capacity test at 1C
rate, SOC-OCV characterization test, and a driving scenario.
The scenario includes a mix of driving schedules of an average
North American driver, data generated is used to validate the
accuracy of the SOC estimator and the aging model. A detailed
description of the reference performance tests (ex: OCV-SOC,
static capacity test) in addition to the experimental setup used
in data generation can be found in part I of this paper [1].
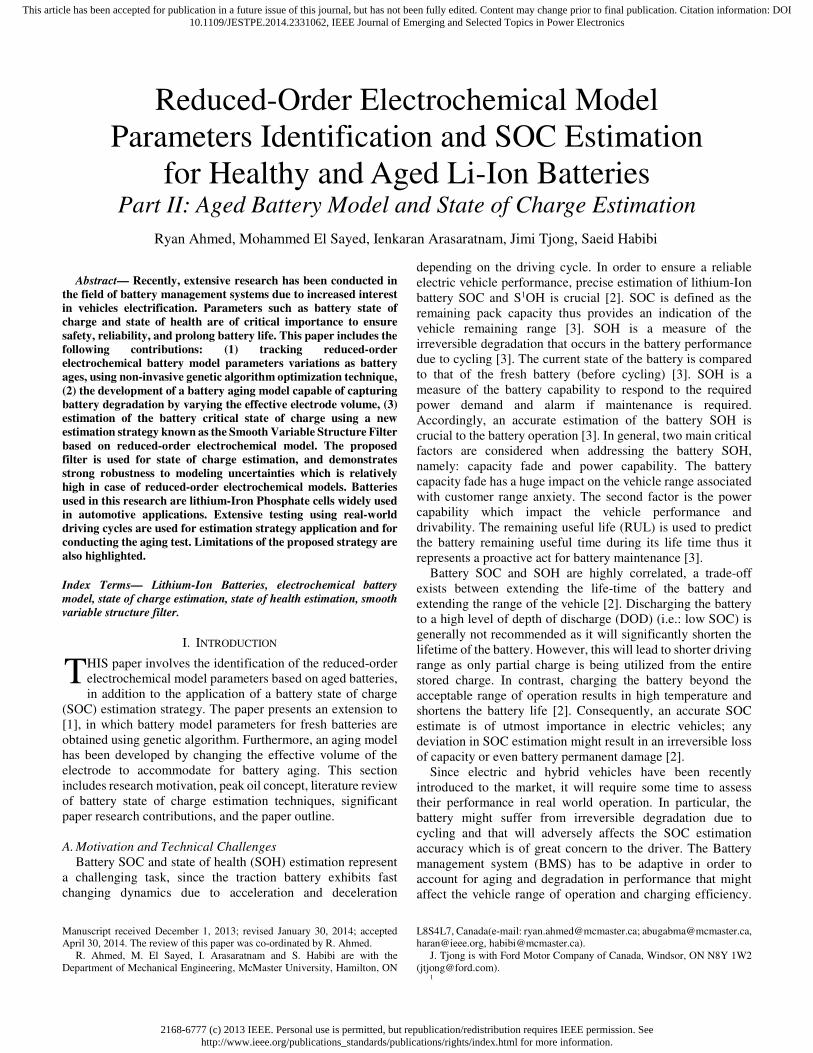
Fast Charge/Discharge Aging (Life) Tests
Aging test using well-defined charging/discharging cycles at
elevated temperature (55℃) and high C-rates have been
conducted. The accelerated test has been conducted to track
changes in battery electrochemical model parameters. Tests
have been conducted on a 24/7 basis over a period of 3-6
months. The test procedure is as follows:
1. Fully charge the battery in a CCCV mode until
maximum voltage (3.6V).
2. Fully discharge the battery at constant current (CC)
mode with 1C-rate until the voltage hits the minimum
voltage (2V).
3. All cycler current accumulators are reset to zero. At
this moment, the battery is at zero state of charge
(SOC).
4. Charge the battery to 90% SOC.
5. Discharge the battery at 10 C-rate until the battery
hits the minimum voltage (2V)
6. Allow for voltage relaxation for 5 minutes.
7. Charge the battery at 4C-rate for 20 minutes. If the
battery hits the maximum voltage, CCCV charge mode
is maintained.
8. Repeat the procedure from D to G for approximately
200 cycles (till capacity hits 80%).
A summary of one fast charge aging cycle is illustrated in
Fig. 1.
III. BATTERY AGING MODEL DEVELOPMENT AND
PARAMETERS FITTING
In this section, an aging model is developed and
electrochemical battery model parameters for aged batteries at
80% capacity are estimated. The section is divided into two
subsections as follows: Subsection A provides a brief summary
of the reduced-order electrochemical battery model. Subsection
B illustrates the necessity of having an updated model
parameters as battery ages. This is done by assessing the
performance of a model developed from a fresh battery vs. data
from aged battery. Subsection C demonstrates the process of
aging model development and model parameters evaluation as
battery ages.
Fig. 1. Voltage, Current and SOC for One Fast Charge/Discharge Aging Test
A. Reduced-Order Electrochemical Battery Model
A detailed description of the reduced-order electrochemical
battery model and the developed parameterization model can be
found in [1]. A summary of the reduced-order model equations
is illustrated here for the purpose of readability and
completeness. Recall that each electrode can be modeled as a
sphere with particle radiusR�. The single spherical particle is
divided into M� − 1 shells each of size ∆r with i = 1, … ,M� −1 andr� = i∆r, where:
∆� = ���� (1)
The particle outer shell (M�) is exposed to the input current
on the solid-electrolyte interface. The system, which has one
input, one output, and M��� states representing the shells
surface concentrations, can be summarized in the following
state-space representation from [13]:
0 5 10 15 20 25 30
2
2.3
2.6
2.9
3.2
3.5
Time [min]
Vo
lta
ge
[V
]
Voltage for One Fast Charge/Discharge Aging Cycle
LiFePO4 Measured Voltage
0 5 10 15 20 25 30
-60
-40-20
02040
6080
100S
OC
[%
]
Time [min]
0 5 10 15 20 25 30
-30
-25-20
-15-10-5
0510
Cu
rre
nt
[A]
Time [min]
Current/SOC for One Fast Charge/Discharge Aging Cycle
LiFePO4 SOC
LiFePO4 Input Current

2168-6777 (c) 2013 IEEE. Personal use is permitted, but republication/redistribution requires IEEE permission. Seehttp://www.ieee.org/publications_standards/publications/rights/index.html for more information.
This article has been accepted for publication in a future issue of this journal, but has not been fully edited. Content may change prior to final publication. Citation information: DOI10.1109/JESTPE.2014.2331062, IEEE Journal of Emerging and Selected Topics in Power Electronics
JESTPE-2013-10-0273 4
System equation:
���
= ��
�����������−2 2 01/2 −2 3/20 2/3 −2 ⋯ 000⋮ ⋱ ⋮
0 0 0 ⋯−2 �� − 2�� − 3 0�� − 3�� − 2 −2 �� − 1�� − 20 �� − 2�� − 1 2 −���� − 1%&&
&&&&&&&'��
+ �) ����� 00⋮− * ���� − 1+%&&
&' ,
(2)
Output equation: ��- = ��./ = ��./01 − �)�� 234 (3)
The model input u is the butler-Volmer current (J8�) which
is a function of the solid-electrolyte surface concentration (c�;) and the total current(I). The output of this sub-model is the
solid concentration at the solid-electrolyte interface (c�;). This
output is fed into another sub-model that calculates the terminal
voltage and the state of charge. The solid-electrolyte interface
concentration from the negative electrode (c�;,=) is calculated
from the positive one (c�;,>) using the following equation [13]:
��̅-,@ =��,ABC,@ DE@F% + ��̅-,H − EHF%��,ABC,H(EH�FF% − EHF%)��,ABC,H (E@�FF% − E@F%)I (4)
Whereθ=F%, θ=�FF%, θ>F%, θ>�FF% are the stoichiometry
points for the negative and positive electrodes, respectively
[14]. The terminal voltage can be calculated based on the solid-
electrolyte-interface concentrations (c�;) from the anode and
the cathode as follows [13]:
K(L) = MN̅H − N̅@O + (∅Q-.H − ∅Q-.@)+ STUM��-,HO − T@M��-,@OV − �WX (5)
Recall the state of charge can be calculated as [13]:
YZ[ = 100 ∗ ]��,H^_` ��,ABC,H − EHF%EH�FF% − EHF%a (6)
Where the average concentrations can be calculated as [13]:
��,H^_` =�bK =LcLdeefLℎf,h�ci�jL�dLfcikd�Lf�ejlce,hj = ∑ �4)4o∆�p/��4q�43o(�� − ∆�)r (7)
B. Aged Battery vs. Optimized ECM Model (Fresh)
In order to demonstrate the importance of having multiple
battery models at various battery states of life, current profile
from a UDDS driving cycle is applied to aged battery (at 80%
capacity fade). The measured experimental voltage is compared
against the voltage from an ECM using the optimized model
parameters obtained for a fresh battery [1]. The actual SOC is
obtained from the Arbin cycler using coulomb counting. The
battery SOC is calculated based on the battery discharge
capacity conducted as a reference performance test at the
beginning of the test.
Fig. 2. Electrochemical Battery Model vs. Experimental Data from a UDDS
Driving Cycle (Aged Battery)
The battery discharge capacity for the battery after the aging
test is 1.74 Ah. As shown in Fig. 2 and Fig. 3, it is clear that if
the same ECM fitted at 100% capacity (fresh battery) will
exhibit significant deviation in both terminal voltage and SOC
as battery ages.
As shown in Fig. 3, it is critical to update model parameters
as battery ages since the ECM model estimate of the SOC is
higher than the actual SOC which indicates a false SOC
estimate. For example, at the end of the UDDS driving cycle,
the model SOC is at approximately 44% while the actual SOC
is at 41.5% which is a relatively significant error. It is also
important to highlight that other factors such as temperature
effects and cell-balancing have not been accounted for in the
scope of this paper. These factors will contribute to modeling
errors and uncertainties which will worsen the terminal voltage
and SOC estimate.
0 5 10 15 20
3.17
3.2
3.23
3.26
3.29
3.32
Time [min]
Vo
lta
ge
[V
]
Experimental Terminal Voltage for Aged Battery Vs. Model Output
Measured Terminal Voltage for Aged Battery (80% Capacity)
Model Terminal Voltage (Optimized)
12.612.8 13 13.213.4
3.23
3.26
3.29

2168-6777 (c) 2013 IEEE. Personal use is permitted, but republication/redistribution requires IEEE permission. Seehttp://www.ieee.org/publications_standards/publications/rights/index.html for more information.
This article has been accepted for publication in a future issue of this journal, but has not been fully edited. Content may change prior to final publication. Citation information: DOI10.1109/JESTPE.2014.2331062, IEEE Journal of Emerging and Selected Topics in Power Electronics
JESTPE-2013-10-0273 5
Fig. 3. Actual SOC for Aged Battery (using Coulomb Counting) vs. Model
SOC
The root mean square error (RMSE) between the measured
terminal voltage (V(t)) and the electrochemical model output
(Vu(t)) for n number of samples can be calculated as follows:
vwxy = z∑ {(|) − {u(|)}|q~ } (8)
Results for both terminal voltage and the SOC are 0.0087 V
and 1.4694 %, respectively. However, the model performs
really well with data from healthy batteries, the RMSE of the
terminal voltage and the SOC are 0.22057 mV and 0.1%. It is
important to highlight that this error is over a single driving
cycle which depletes the battery from 50% to approximately
40%. This error will worsen for extended driving cycles that
might deplete the battery from 90% to 10%. A summary of the
RMSE for the UDDS driving cycle for both fresh and aged
batteries is as shown in Fig. 4. In the following section, a
strategy is applied to effectively overcome this problem and
account for battery aging and degradation.
C. Battery Aging Model Development
Battery aging and performance degradation occur due to two
main effects, namely: film growth and carbon retreat [15].
These two phenomena are found to be changing in a sigmoidal
fashion (with sudden changes after a number of cycles) [15].
Aging occurs due to the reaction between the cathode active
materials and the electrolyte resulted in formation of a solid-
electrolyte interface (SEI) layer which in turn changes the
particle surface composition leading to breaking down of the
carbon conductive path which causes carbon retreat and sudden
acceleration of capacity fade [15]. Furthermore, battery aging
occurs due to the formation of an insulating layer on the surface
of the electrodes particles (mainly the cathode electrode) which
in turn lead to increase in the impedance of the positive
electrode [16]. The other factor is likely due to loss of electron
conductivity of the cathode particles [17]. This phenomenon is
also related to the (carbon retreat) phenomenon which is the
disconnection of carbon within the particles due to the
formation of a SEI layer.
Fig. 4. Terminal Voltage RMSE for Fresh vs. Aged Battery (Upper), SOC
RMSE for Fresh vs. Aged (Lower)
In order to incorporate aging into the reduced-order
electrochemical model, modification to the reduced-order
model has to be conducted. As shown in Fig. 5, the battery
reduced-order electrochemical model at 3 distinct states of life,
namely: fresh (healthy state), mid-life, and end-of-life is
presented. The proposed battery aging model works by
modeling the increase in the SEI layer and the decrease in the
electrode volume due to side reactions. As battery ages, the
electrode resistance to accept further lithium ions increases and
this results in capacity degradation and aging.
Fig. 5. Battery Reduced-order Electrochemical Model at 3 States of Life; (a)
Fresh (healthy state), (b) Mid-life, and (c) End-of-life. Aging is modeled by
increase in the SEI layer and decrease in the Effective Electrode Volume.
Recall that at steady state, when no further lithium diffusion
occurs inside the spherical particle representing the electrode.
All lithium concentrations in every shell reaches a steady state
condition according to the following equation [1]:
0 5 10 15 20
41
41.5
42
42.5
43
43.5
44
44.5
45
45.5
46
46.5
47
47.5
48
48.5
49
49.5
50
Time [min]
SO
C [
%]
Actual (Aged) Vs. Model SOC
Actual SOC (Aged)
Model SOC
5 6 7 8
47
47.5
48
0 1 2 3 4 5 6 7 8 9
x 10-3
Fresh Battery (100%)
Aged Battery (80%)
Terminal Voltage RMSE
Volts [V]
0 0.5 1 1.5
Fresh Battery (100%)
Aged Battery (80%)
SOC RMSE
SOC [%]

2168-6777 (c) 2013 IEEE. Personal use is permitted, but republication/redistribution requires IEEE permission. Seehttp://www.ieee.org/publications_standards/publications/rights/index.html for more information.
This article has been accepted for publication in a future issue of this journal, but has not been fully edited. Content may change prior to final publication. Citation information: DOI10.1109/JESTPE.2014.2331062, IEEE Journal of Emerging and Selected Topics in Power Electronics
JESTPE-2013-10-0273 6
�4 = �b/(�p/01) ∗ 4o∆�) ∗ ��WB����= � �4)4o∆��4p/��
4q� /(�p/01) ∗ 4o∆�)∗ ��WB����= (��) ∗ 4o∆��� + �)) ∗ 4o∆��)+ �r) ∗ 4o∆��r …+ �p/01)∗ 4o∆��p/��)/(�p/01) ∗ 4o∆�)∗ ��WB����
(9)
where c� represents the steady state initial concentration at
every shell of the spherical particle for a given state of charge
and number of shells in the particle.
In order to demonstrate the previous equation, consider a
spherical particle of radius 0.0015 cm with 11 spherical
discretization segments (spherical shells) and assume that the
total lithium concentration is concentrated at the outermost
shell. The maximum lithium concentration of 0.04782mol/cmr, and assume an initial SOC of 50%. The stoichiometry
values of 0.6976 and 0.9149 has been selected. By substituting
with the SOC in the following equation, average lithium
concentration at the specified state of charge is calculated as
follows [1]:
��,H^_` = *YZ[100 ∗ MEH�FF% − EHF%O + EHF%+∗ ��,ABC,H = 0.0386hce/�hr (10)
Assuming the total lithium concentration is concentrated at
the outermost shell, lithium concentration at the outermost shell c�>��01can be calculated as follows:
��H./01 = ��,H^_` ∗ 43 o(�� − ∆�)r/(�p/01) ∗ 4o∆�)= 0.1285hce/�hr
As shown in Fig. 6, assuming no input current is applied at
the solid-electrolyte interface layer, lithium at the outermost
shell (starting from 0.1285mol/cmr) will diffuse inside the
sphere according to Fick’s second law of diffusion until all
lithium concentrations are equalized, and no further lithium
diffusion would occur inside the sphere. The final concentration
value in which all shells settle is related to thec�������according
to (11).
Lithium concentrations in every shell can be calculated by
applying the final value theorem below:
��WB���� = �fidelde,j = efh�→F �(L)= efh�→F �((�X − �)���(0))= 0.2597
(11)
The final value, which is dependent on the state transition
matrix A is 0.259. It is important to highlight that this value
solely depends on the number of discretization segmentsM� which is 11 in this example. The steady state value of lithium
concentrations, as shown in Fig. 6, can be calculated as follows:
�4 = ��H./01 ∗ ��WB���� = �b/(�p/01) ∗ 4o∆�)∗ ��WB���� = 0.1285 ∗ 0.2597= 0.033hce/�hr (12)
Recall that the optimizer is used to optimize the electrode
area (A) and then using the constraint to calculate the electrode
thickness δ as follows [1]:
� = *1�+ ∗ �*2�� − 12 + ∗ * ���� − 1+r ∗ �) ∗ ∆�∗ ��WB�����/(���^� ∗ �� ∗ �ABC∗ (EH1��% − EH�%)
(13)
This relationship is important since as battery ages, the
effective volume of the sphere representing the electrode is
decreased.
Fig. 6. Lithium concentrations across shells assuming total lithium
concentration is concentrated at the outermost shell
This results in capacity degradation and battery aging. In this
paper, the term “Electrode Aging Factor (�)” is introduced as
follows:
�ej�L�c�j� fi ¡d�Lc�(�) = X2 ∗ � ∗ � == (X)/ D2 ∗ *2�� − 12 + ∗ * ���� − 1+r ∗ �)∗ ∆� ∗ ��WB����I /(���^� ∗ �� ∗ �ABC∗ (EH1��% − EH�%)
(14)
In other words, the battery input current is scaled down to the
Butler-Volmer current by dividing the input current by the
effective electrode volume (K-WW). As battery ages, the effective
electrode volume is reduced and thus lithium ions are prevented
from further diffusion inside the particle representing the
electrode. The effective electrode volume can be calculated as
0 0.2 0.4 0.6 0.8 1 1.2 1.4 1.6
0
0.015
0.03
0.045
0.06
0.075
0.09
0.105
0.12
0.135
Time [min]
Co
nce
ntr
atio
n [
mo
l/cm
3]
Cathode Concentrations Across Shells
Shell 1
Shell 2
Shell 3
Shell 4
Shell 5
Shell 6
Shell 7
Shell 8
Shell 9
Shell 100.8 1 1.2
0.03
2168-6777 (c) 2013 IEEE. Personal use is permitted, but republication/redistribution requires IEEE permission. Seehttp://www.ieee.org/publications_standards/publications/rights/index.html for more information.
This article has been accepted for publication in a future issue of this journal, but has not been fully edited. Content may change prior to final publication. Citation information: DOI10.1109/JESTPE.2014.2331062, IEEE Journal of Emerging and Selected Topics in Power Electronics
JESTPE-2013-10-0273 7
follows:
K-WW = � ∗ � ∗ � (15)
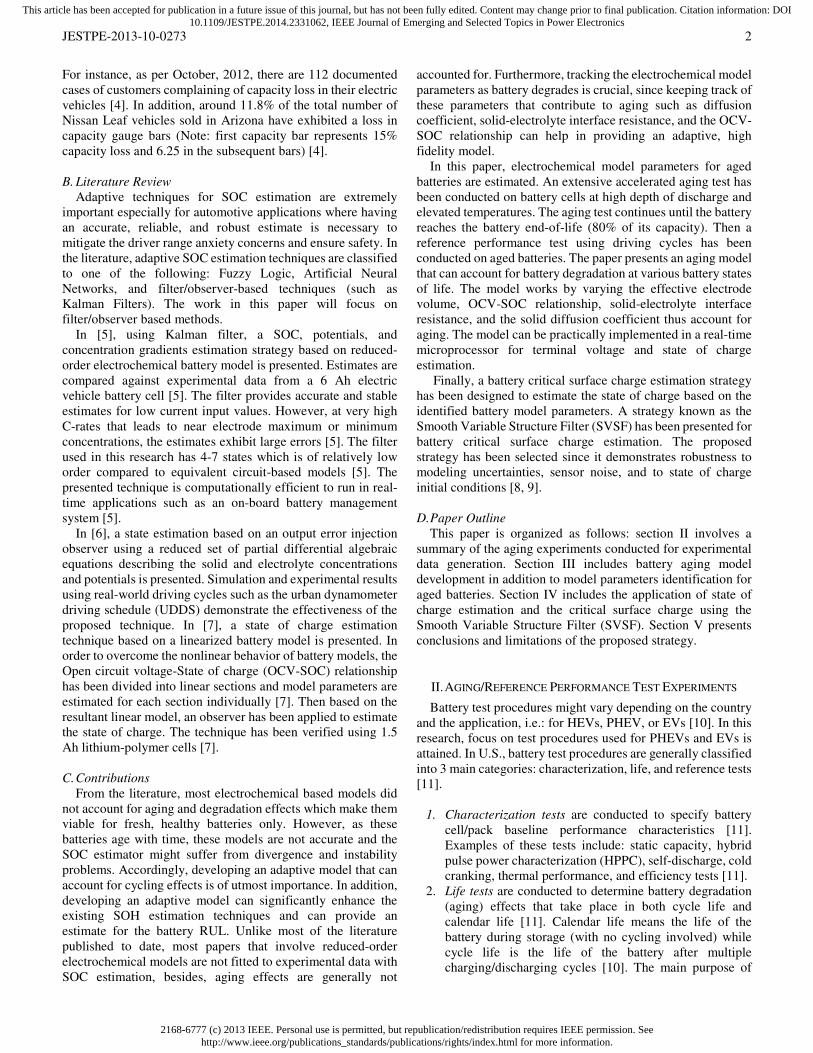
In order to demonstrate the presented model, assume that an
input discharge current of 1C (-2.3 A) is applied for 15 minutes
on the outermost shell of the sphere with the same parameters
as previously discussed. Then a resting period of 15 minutes,
followed by a charging current of +2.3A then a 15 minutes
resting period as shown below in Fig. 7. Assume the electrode
plate area is 16524.27 cm) and assuming the battery capacity Q£�¤ is 2.3 Ah and α) = 1/(Fa�∆r) is 4.632e-7.
Fig. 7. Cathode Input Current and State of Charge for healthy battery (100%
capacity)
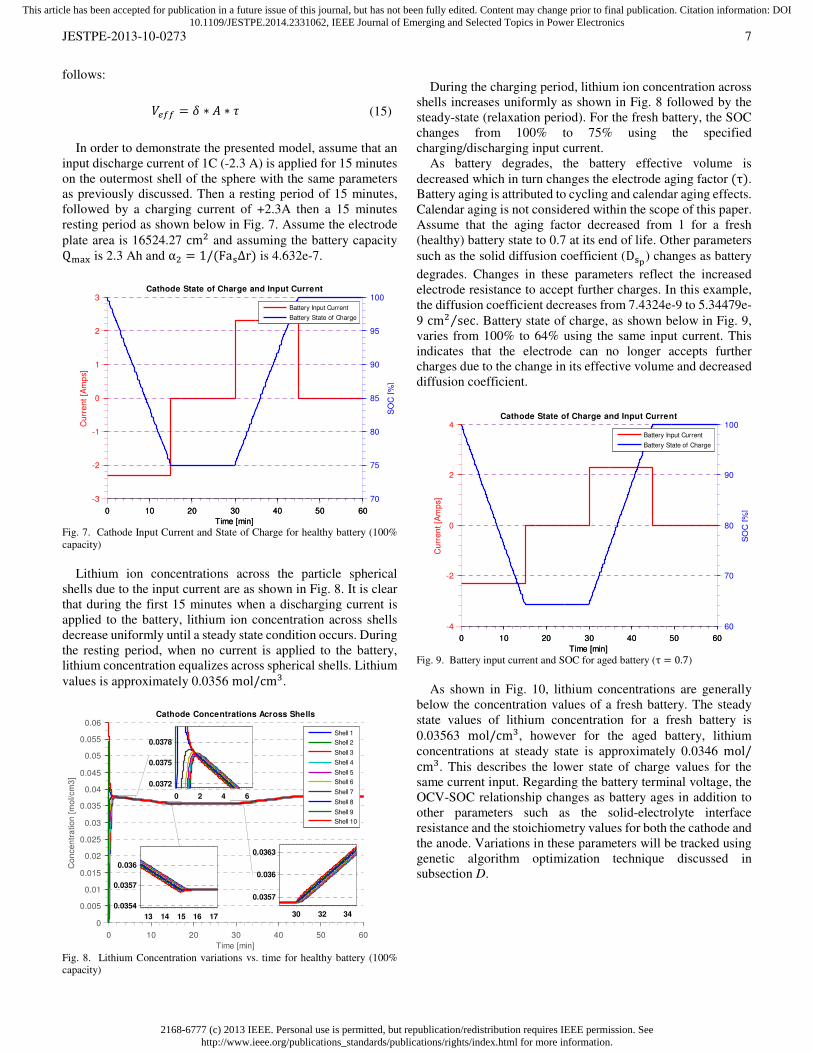
Lithium ion concentrations across the particle spherical
shells due to the input current are as shown in Fig. 8. It is clear
that during the first 15 minutes when a discharging current is
applied to the battery, lithium ion concentration across shells
decrease uniformly until a steady state condition occurs. During
the resting period, when no current is applied to the battery,
lithium concentration equalizes across spherical shells. Lithium
values is approximately 0.0356 mol/cmr.
Fig. 8. Lithium Concentration variations vs. time for healthy battery (100%
capacity)
During the charging period, lithium ion concentration across
shells increases uniformly as shown in Fig. 8 followed by the
steady-state (relaxation period). For the fresh battery, the SOC
changes from 100% to 75% using the specified
charging/discharging input current.
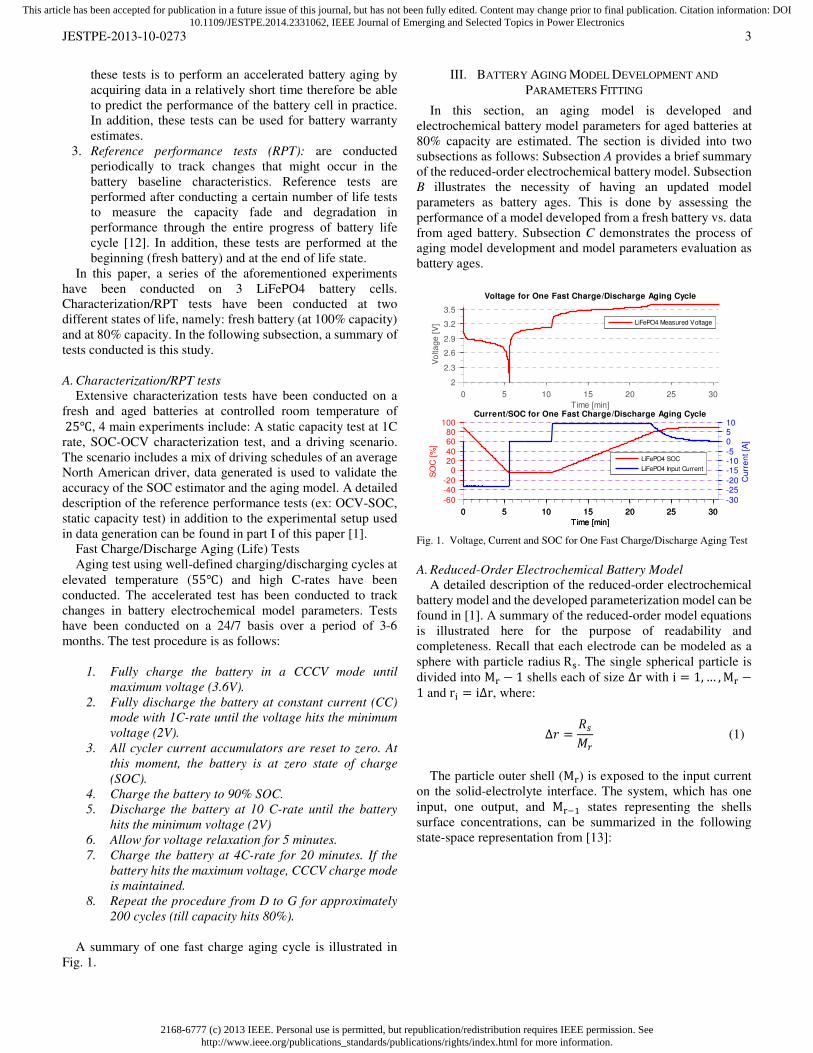
As battery degrades, the battery effective volume is
decreased which in turn changes the electrode aging factor(τ). Battery aging is attributed to cycling and calendar aging effects.
Calendar aging is not considered within the scope of this paper.
Assume that the aging factor decreased from 1 for a fresh
(healthy) battery state to 0.7 at its end of life. Other parameters
such as the solid diffusion coefficient (D�ª) changes as battery
degrades. Changes in these parameters reflect the increased
electrode resistance to accept further charges. In this example,
the diffusion coefficient decreases from 7.4324e-9 to 5.34479e-
9 cm) sec⁄ . Battery state of charge, as shown below in Fig. 9,
varies from 100% to 64% using the same input current. This
indicates that the electrode can no longer accepts further
charges due to the change in its effective volume and decreased
diffusion coefficient.
Fig. 9. Battery input current and SOC for aged battery (τ = 0.7)
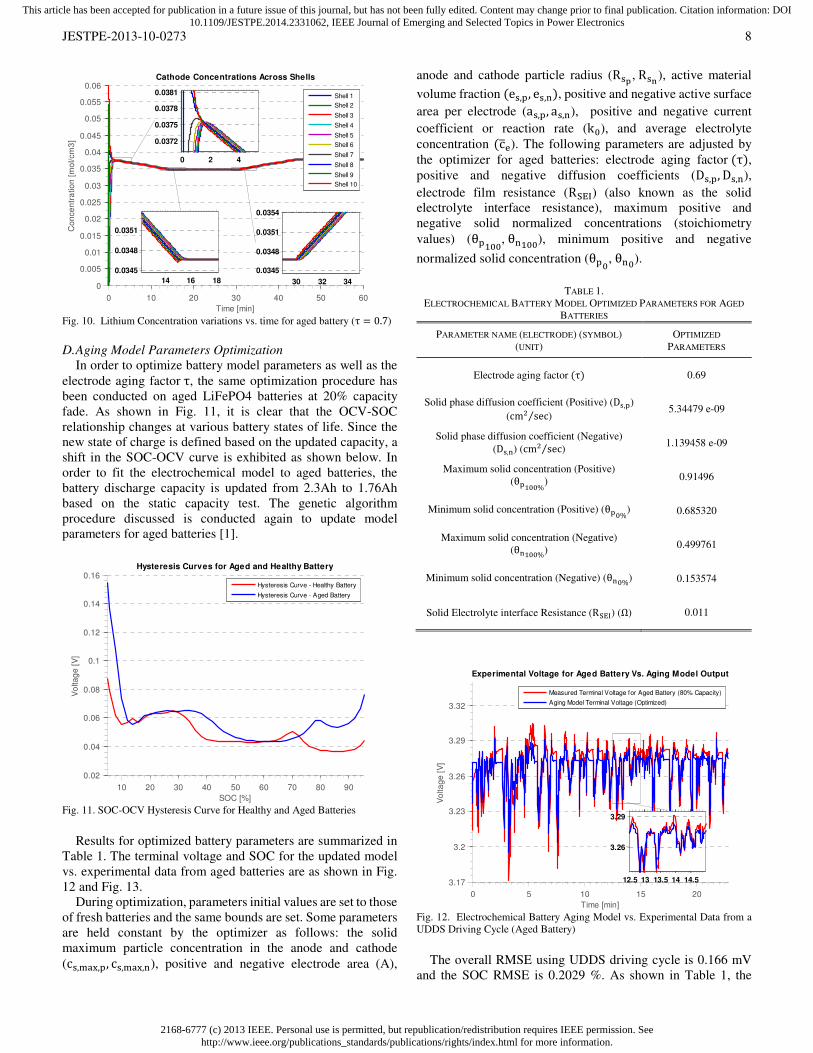
As shown in Fig. 10, lithium concentrations are generally
below the concentration values of a fresh battery. The steady
state values of lithium concentration for a fresh battery is
0.03563 mol/cmr, however for the aged battery, lithium
concentrations at steady state is approximately 0.0346 mol/cmr. This describes the lower state of charge values for the
same current input. Regarding the battery terminal voltage, the
OCV-SOC relationship changes as battery ages in addition to
other parameters such as the solid-electrolyte interface
resistance and the stoichiometry values for both the cathode and
the anode. Variations in these parameters will be tracked using
genetic algorithm optimization technique discussed in
subsection D.
0 10 20 30 40 50 60
-3
-2
-1
0
1
2
3
Cu
rre
nt
[Am
ps]
Time [min]
0 10 20 30 40 50 60
70
75
80
85
90
95
100
SO
C [
%]
Time [min]
Cathode State of Charge and Input Current
Battery Input Current
Battery State of Charge
0 10 20 30 40 50 60
0
0.005
0.01
0.015
0.02
0.025
0.03
0.035
0.04
0.045
0.05
0.055
0.06
Time [min]
Co
nce
ntr
atio
n [
mo
l/cm
3]
Cathode Concentrations Across Shells
Shell 1
Shell 2
Shell 3
Shell 4
Shell 5
Shell 6
Shell 7
Shell 8
Shell 9
Shell 10
0 2 4 6
0.0372
0.0375
0.0378
13 14 15 16 17
0.0354
0.0357
0.036
30 32 34
0.0357
0.036
0.0363
0 10 20 30 40 50 60
-4
-2
0
2
4
Cu
rre
nt
[Am
ps]
Time [min]
0 10 20 30 40 50 60
60
70
80
90
100
SO
C [
%]
Time [min]
Cathode State of Charge and Input Current
Battery Input Current
Battery State of Charge
2168-6777 (c) 2013 IEEE. Personal use is permitted, but republication/redistribution requires IEEE permission. Seehttp://www.ieee.org/publications_standards/publications/rights/index.html for more information.
This article has been accepted for publication in a future issue of this journal, but has not been fully edited. Content may change prior to final publication. Citation information: DOI10.1109/JESTPE.2014.2331062, IEEE Journal of Emerging and Selected Topics in Power Electronics
JESTPE-2013-10-0273 8
Fig. 10. Lithium Concentration variations vs. time for aged battery (τ = 0.7)
D. Aging Model Parameters Optimization
In order to optimize battery model parameters as well as the
electrode aging factorτ, the same optimization procedure has
been conducted on aged LiFePO4 batteries at 20% capacity
fade. As shown in Fig. 11, it is clear that the OCV-SOC
relationship changes at various battery states of life. Since the
new state of charge is defined based on the updated capacity, a
shift in the SOC-OCV curve is exhibited as shown below. In
order to fit the electrochemical model to aged batteries, the
battery discharge capacity is updated from 2.3Ah to 1.76Ah
based on the static capacity test. The genetic algorithm
procedure discussed is conducted again to update model
parameters for aged batteries [1].
Fig. 11. SOC-OCV Hysteresis Curve for Healthy and Aged Batteries
Results for optimized battery parameters are summarized in
Table 1. The terminal voltage and SOC for the updated model
vs. experimental data from aged batteries are as shown in Fig.
12 and Fig. 13.
During optimization, parameters initial values are set to those
of fresh batteries and the same bounds are set. Some parameters
are held constant by the optimizer as follows: the solid
maximum particle concentration in the anode and cathode
(c�,£�¤,>, c�,£�¤,=), positive and negative electrode area (A),
anode and cathode particle radius (R�ª,R�®), active material
volume fraction (e�,>, e�,=), positive and negative active surface
area per electrode (a�,>, a�,=), positive and negative current
coefficient or reaction rate (kF), and average electrolyte
concentration (c°;). The following parameters are adjusted by
the optimizer for aged batteries: electrode aging factor(τ), positive and negative diffusion coefficients (D�,>, D�,=),
electrode film resistance (R±²³) (also known as the solid
electrolyte interface resistance), maximum positive and
negative solid normalized concentrations (stoichiometry
values) (θ>�FF,θ=�FF), minimum positive and negative
normalized solid concentration (θ>F,θ=F).
TABLE 1.
ELECTROCHEMICAL BATTERY MODEL OPTIMIZED PARAMETERS FOR AGED
BATTERIES
PARAMETER NAME (ELECTRODE) (SYMBOL)
(UNIT)
OPTIMIZED
PARAMETERS
Electrode aging factor (τ) 0.69
Solid phase diffusion coefficient (Positive) (D�,>)
(cm) sec⁄ ) 5.34479 e-09
Solid phase diffusion coefficient (Negative)
(D�,=) (cm) sec⁄ ) 1.139458 e-09
Maximum solid concentration (Positive)
(θ>�FF%) 0.91496
Minimum solid concentration (Positive) (θ>F%) 0.685320
Maximum solid concentration (Negative)
(θ=�FF%) 0.499761
Minimum solid concentration (Negative) (θ=F%) 0.153574
Solid Electrolyte interface Resistance (R±²³) (Ω) 0.011
Fig. 12. Electrochemical Battery Aging Model vs. Experimental Data from a
UDDS Driving Cycle (Aged Battery)
The overall RMSE using UDDS driving cycle is 0.166 mV
and the SOC RMSE is 0.2029 %. As shown in Table 1, the
0 10 20 30 40 50 60
0
0.005
0.01
0.015
0.02
0.025
0.03
0.035
0.04
0.045
0.05
0.055
0.06
Time [min]
Co
nce
ntr
atio
n [
mo
l/cm
3]
Cathode Concentrations Across Shells
Shell 1
Shell 2
Shell 3
Shell 4
Shell 5
Shell 6
Shell 7
Shell 8
Shell 9
Shell 10
0 2 4
0.0372
0.0375
0.0378
0.0381
14 16 18
0.0345
0.0348
0.0351
30 32 34
0.0345
0.0348
0.0351
0.0354
10 20 30 40 50 60 70 80 90
0.02
0.04
0.06
0.08
0.1
0.12
0.14
0.16
SOC [%]
Vo
lta
ge
[V
]
Hysteresis Curves for Aged and Healthy Battery
Hysteresis Curve - Healthy Battery
Hysteresis Curve - Aged Battery
0 5 10 15 20
3.17
3.2
3.23
3.26
3.29
3.32
Time [min]
Vo
lta
ge
[V
]
Experimental Voltage for Aged Battery Vs. Aging Model Output
Measured Terminal Voltage for Aged Battery (80% Capacity)
Aging Model Terminal Voltage (Optimized)
12.5 13 13.5 14 14.5
3.26
3.29

2168-6777 (c) 2013 IEEE. Personal use is permitted, but republication/redistribution requires IEEE permission. Seehttp://www.ieee.org/publications_standards/publications/rights/index.html for more information.
This article has been accepted for publication in a future issue of this journal, but has not been fully edited. Content may change prior to final publication. Citation information: DOI10.1109/JESTPE.2014.2331062, IEEE Journal of Emerging and Selected Topics in Power Electronics
JESTPE-2013-10-0273 9
optimized electrode aging factor is less than one indicating a
reduced effective electrode volume. The solid-electrolyte
interface resistance increases as battery ages which indicates
more resistance to lithium diffusion inside the representative
particle. Stoichiometry values for both the cathode and the
anode change since the OCV-SOC relationship changes with
aging. The positive solid particle diffusion coefficient decreases
indicating decreased rate of lithium diffusion inside the particle.
Future research involves tracking changes of these parameters
using correlation with ampere-hour throughput and aging
parameters such as battery discharge rate, temperatures, and
depth of discharge.
Fig. 13. Electrochemical Battery Aging Model SOC vs. Experimental Data
from a UDDS Driving Cycle (Aged Battery)
IV. BATTERY CRITICAL SURFACE CHARGE ESTIMATION
In this section, an estimation strategy known as the Smooth
Variable Structure Filter (SVSF) which was recently introduced
in 2007 have been applied to estimate the battery critical surface
charge based on the reduced-order electrochemical battery
model. The following subsection (A) involves a brief overview
of the SVSF and subsection (B) discusses the application of the
filter to the model for critical surface charge estimation.
A. The Smooth Variable Structure Filter
Similar to Kalman filter, the SVSF works in a predictor-
corrector fashion [18]. The filter is based on sliding mode
concept and has demonstrated robustness to modeling
uncertainties and sensor noise [18, 8]. The SVSF can be applied
to both linear and non-linear systems. It works by using an
SVSF gain that forces the states to converge to the boundary of
the true (desired) state estimates [18]. The gain forces the states
to switch back and forth across the state trajectory within a
region referred to as the existence subspace which is function
of the model uncertainties. The width of the existence space β
is a function of the uncertain dynamics associated with the
inaccuracy of the internal model of the filter as well as the
measurement model, and varies with time [18]. The SVSF can
be applied to systems that are differentiable and observable [18,
19]. The original form of the SVSF as presented in [18] did not
include covariance derivations. An augmented form of the
SVSF was presented in [20], which includes a full derivation
for the filter.
Consider the nonlinear system with linear output
(measurement) equation. The filter run by generating a
prediction of the state estimate (which represents the solid-
electrolyte interface concentration) as follows:
¶·¸¹�|¸ = �»M¶·¸|¸, ,¸O (16)
The predicted estimates are then used to generate a predicted
measurements ¼̂¸¹�|¸ as follows [18]:
¼̂¸¹�|¸ = [¸|¾4@-B�4¿-À¶·¸¹�|¸ (17)
Where [¸|¾4@-B�4¿-À is the measurement matrix. Then the
measurement error j¿,¸¹�|¸ can be calculated as follows [18]:
Fig. 14. The SVSF estimation strategy starting from some initial value, the state
estimate is forced by a switching gain to within a region referred to as the
existence subspace [18].
j¿,¸¹�|¸ = ¼¸¹� − ¼̂¸¹�|¸ (18)
The SVSF gain is a function of the a-priori and the a-
posteriori measurement errors eÁÂÃ1|Â and eÁÂ|Â , the smoothing
boundary layer widths ψ, the ‘SVSF’ memory or convergence
rate γ, as well as the linear measurement matrix CÇ|È�=;���Á;É.
For the derivation of the SVSF gainKǹ�, refer to [18, 20]. The
SVSF gain may be defined diagonally as follows [18]:
˸¹�= [¸|¾4@-B�4¿-À¹�fd ÌSÍj¿ÎÃ1|ÎÍ + Ï Íj¿Î|ÎÍV∘ �dL *j¿ÎÃ1|ÎÑ +Ò �fd Sj¿ÎÃ1|ÎV��
(19)
The updated states ¶·¸¹�|¸¹� are calculated as follows [18]:
¶·¸¹�|¸¹� = ¶·¸¹�|¸ + ˸¹�j¿ÎÃ1|Î (20)
Calculation of a posteriori output estimate z·Ç¹�|ǹ� and
0 5 10 15 20
41
41.5
42
42.5
43
43.5
44
44.5
45
45.5
46
46.5
47
47.5
48
48.5
49
49.5
50
Time [min]
SO
C [
%]
Actual SOC(Aged) Vs. Aging Model SOC
Actual SOC (Aged)
Aging ECM SOC
5 6 7
46.5
47
47.5
13.5 14 14.5
43.5
44
44.5
2168-6777 (c) 2013 IEEE. Personal use is permitted, but republication/redistribution requires IEEE permission. Seehttp://www.ieee.org/publications_standards/publications/rights/index.html for more information.
This article has been accepted for publication in a future issue of this journal, but has not been fully edited. Content may change prior to final publication. Citation information: DOI10.1109/JESTPE.2014.2331062, IEEE Journal of Emerging and Selected Topics in Power Electronics
JESTPE-2013-10-0273 10
measurement errors eÁÂÃ1|ÂÃ1are calculated afterwards. The
output estimates and a posteriori measurement errors are
calculated respectively as follows [18]:
¼̂¸¹�|¸¹� = [¸|¾4@-B�4¿-ÀÔÕ¸¹�|¸¹� (21)
j¿ÎÃ1|ÎÃ1 = ¼¸¹� − ¼̂¸¹�|¸¹� (22)
Equations 17 to 22 are iteratively repeated until a certain
threshold is attained. As per [18], the estimation process is
stable and convergent if the following lemma is satisfied:
Öj¸|¸Ö > Öj¸¹�|¸¹�Ö (23)
The proof, as defined in [18], yields the derivation of the SVSF
gain from (26). The standard SVSF gain yields the following:
j¿,¸¹�|¸¹� = j¿,¸¹�|¸ − Ø˸¹� (24)
Substitution of (24) into (23) yields:
Öj¿,¸|¸Ö > Öj¿,¸¹�|¸ − Ø˸¹�Ö (25)
Simplifying and rearranging (28):
|Ø˸¹�| > Öj¿,¸¹�|¸Ö + ÏÖj¿,¸|¸Ö (26)
Based on the fact that|HKǹ�| = HKǹ� ∘ sign(HKǹ�), the
standard SVSF gain can be derived as follows:
˸¹� = Ø��MÖj¿,¸¹�|¸Ö + ÏÖj¿,¸|¸ÖO∘ �f i(Ø˸¹�) (27)
Equation (27) may be further expanded based on the fact
thatsign(HKǹ�) = signMeÁ,ǹ�|ÇO, as per [18], such that:
˸¹� = Ø��MÖj¿,¸¹�|¸Ö + ÏÖj¿,¸|¸ÖO∘ �f iMj¿,¸¹�|¸O
(28)
The SVSF switching may be smoothed out by the use of a
saturation function, accordingly, (28) becomes:
˸¹� = Ø��MÖj¿,¸¹�|¸Ö + ÏÖj¿,¸|¸ÖO∘ �dLMj¿,¸¹�|¸O
(29)
where the saturation function is defined by:
�dLMj¿,¸¹�|¸O= Ü 1, j¿,¸¹�|¸ ≥ 1j¿,¸¹�|¸ , −1 < j¿,¸¹�|¸ < 1−1, j¿,¸¹�|¸ ≤ −1
(30)
Finally, a smoothing boundary layer ψ may be added to further
reduce the magnitude of chattering, leading to:
˸¹� = Ø��MÖj¿,¸¹�|¸Ö + ÏÖj¿,¸|¸ÖO∘ �dLMj¿,¸¹�|¸ Ñ⁄ O
(31)
Note that the gain described in (31) is slightly different than
that presented earlier in (19). A diagonalized form was created,
as described in [20, 21], to formulate an SVSF derivation that
included a covariance function. The form shown as (31) was
presented as the original or ‘standard’ SVSF in [18].
B. SVSF-based Critical Surface Charge Estimation-fresh
battery
The SVSF has been used to estimate the critical surface
charge based on the reduced-order model. The state space
representation indicating the diffusion of lithium into the solid
particle consists of a linear system (3) and a nonlinear
measurement (output) (5). The terminal voltage is function of
the solid-electrolyte interface concentrations c�;,> andc�;,=.
The model has one input current (I), M� − 1 states and, and one
output representing the terminal voltage (Và). The measured
voltage is compared to the model output to calculate the error
signal that is fed back to the SVSF estimator to calculate the
gain and update the states. The output equation is linearized
with respect to the current state as follows:
[¸|¾4@-B�4¿-À = áKᶠ= ∂V∂c°�,>(ã���) (32)
Due to the complexity of the output equation, complex
differentiation has been conducted to linearize the output
equation then to generate the CÇ|È�=;���Á;É matrix. The CÇ|È�=;���Á;É matrix consists of zero elements except for the last
element thus when used to update the states, only the solid
electrolyte interface concentration is updated.
The filter can estimate the solid-electrolyte interface
concentration c�;,> and since at steady state conditions, all
lithium concentrations are equalized (no further diffusion
occurs), the filter can estimate all the spherical shell
concentrations and thus provides an estimate of the initial SOC.
Accordingly, the filter can be used to estimate the SOC at steady
state conditions to correct the initial SOC then the model takes
over as shown below.
It is important to shortly discuss computational issues that
may occur when calculating the pseudoinverse of the linearized
measurement matrix in (19). Numerous authors have
experienced abrupt and unexpected instabilities with the
pseudoinverse [22, 23]. A sudden growth of the Jacobian matrix
elements when calculating the pseudoinverse during the SVSF
gain calculation occurs at each iteration. Consequently, the
estimator outputs and thus the mean square error between the
measured terminal voltage and model output increases
significantly. A stabilizing adjustment is performed to avoid
this problem. The problem has been extensively analyzed in
[22], and occurs due to the presence of singularities.
Singularities occur when the Jacobian matrix loses rank. Small
singular values of H might arise in the vicinity of these
singularities. Consequently, larger values occur when obtaining
2168-6777 (c) 2013 IEEE. Personal use is permitted, but republication/redistribution requires IEEE permission. Seehttp://www.ieee.org/publications_standards/publications/rights/index.html for more information.
This article has been accepted for publication in a future issue of this journal, but has not been fully edited. Content may change prior to final publication. Citation information: DOI10.1109/JESTPE.2014.2331062, IEEE Journal of Emerging and Selected Topics in Power Electronics
JESTPE-2013-10-0273 11
the pseudoinverse of the Jacobian H¹ thus creating larger error
values which leads to instability. According to [24], it is rather
difficult to detect these singularities. A traditional method of
solving this instability problem is by replacing the
pseudoinverse H¹ with the following equation [24]:
[À¹ = [b([[b + ä)X)�� (36)
where, ρ is called the damping parameter. The effect of the
added damping is that it mitigates the effect of small singular
values when computing the inverse [24]. On the other hand, a
slightly small error is introduced when calculating the inverse.
In this paper, ρ is set to 0.4, and is shown to have a negligible
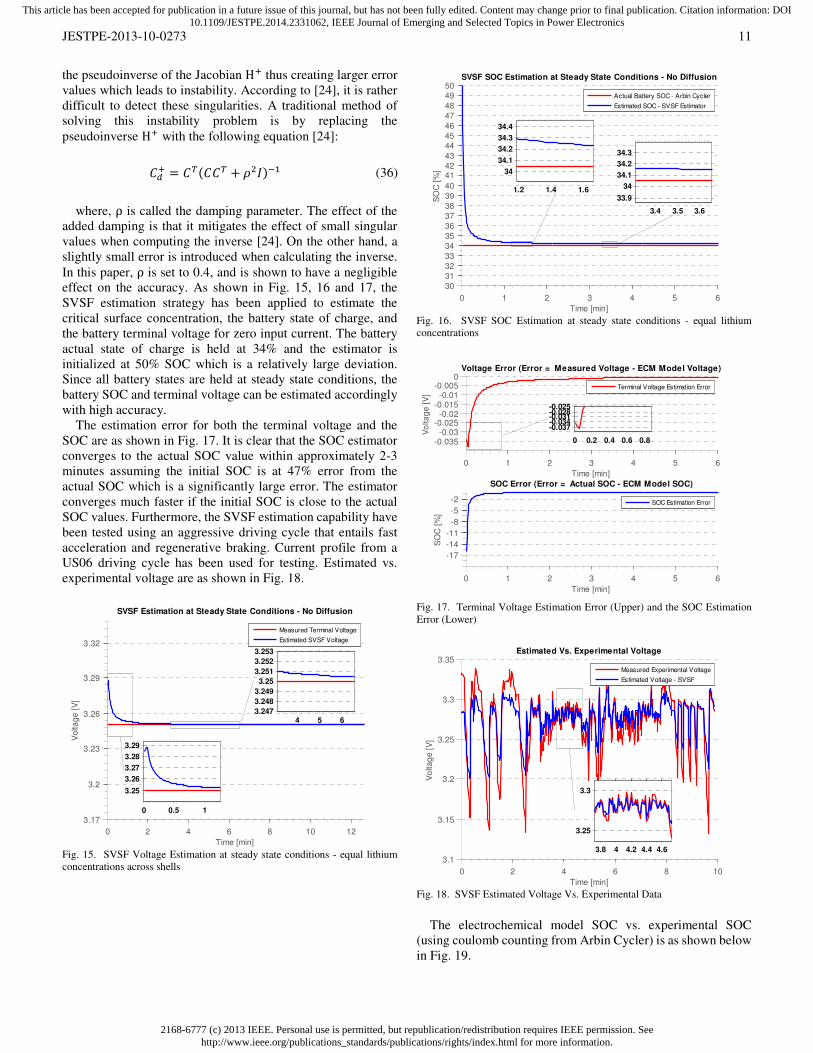
effect on the accuracy. As shown in Fig. 15, 16 and 17, the
SVSF estimation strategy has been applied to estimate the
critical surface concentration, the battery state of charge, and
the battery terminal voltage for zero input current. The battery
actual state of charge is held at 34% and the estimator is
initialized at 50% SOC which is a relatively large deviation.
Since all battery states are held at steady state conditions, the
battery SOC and terminal voltage can be estimated accordingly
with high accuracy.
The estimation error for both the terminal voltage and the
SOC are as shown in Fig. 17. It is clear that the SOC estimator
converges to the actual SOC value within approximately 2-3
minutes assuming the initial SOC is at 47% error from the
actual SOC which is a significantly large error. The estimator
converges much faster if the initial SOC is close to the actual
SOC values. Furthermore, the SVSF estimation capability have
been tested using an aggressive driving cycle that entails fast
acceleration and regenerative braking. Current profile from a
US06 driving cycle has been used for testing. Estimated vs.
experimental voltage are as shown in Fig. 18.
Fig. 15. SVSF Voltage Estimation at steady state conditions - equal lithium
concentrations across shells
Fig. 16. SVSF SOC Estimation at steady state conditions - equal lithium
concentrations
Fig. 17. Terminal Voltage Estimation Error (Upper) and the SOC Estimation
Error (Lower)
Fig. 18. SVSF Estimated Voltage Vs. Experimental Data
The electrochemical model SOC vs. experimental SOC
(using coulomb counting from Arbin Cycler) is as shown below
in Fig. 19.
0 2 4 6 8 10 12
3.17
3.2
3.23
3.26
3.29
3.32
Time [min]
Vo
lta
ge
[V
]
SVSF Estimation at Steady State Conditions - No Diffusion
Measured Terminal Voltage
Estimated SVSF Voltage
0 0.5 1
3.25
3.26
3.27
3.28
3.29
4 5 63.247
3.248
3.249
3.25
3.251
3.252
3.253
0 1 2 3 4 5 6
30
31
32
33
34
35
36
37
38
39
40
4142
43
44
45
46
47
48
49
50
Time [min]
SO
C [
%]
SVSF SOC Estimation at Steady State Conditions - No Diffusion
Actual Battery SOC - Arbin Cycler
Estimated SOC - SVSF Estimator
3.4 3.5 3.6
33.9
34
34.1
34.2
34.3
1.2 1.4 1.6
34
34.1
34.2
34.3
34.4
0 1 2 3 4 5 6
-0.035-0.03
-0.025-0.02
-0.015-0.01
-0.0050
Time [min]
Vo
lta
ge
[V
]
Voltage Error (Error = Measured Voltage - ECM Model Voltage)
Terminal Voltage Estimation Error
0 0.2 0.4 0.6 0.8
-0.037-0.034-0.031-0.028-0.025
0 1 2 3 4 5 6
-17
-14
-11
-8
-5
-2
Time [min]
SO
C [
%]
SOC Error (Error = Actual SOC - ECM Model SOC)
SOC Estimation Error
0 2 4 6 8 10
3.1
3.15
3.2
3.25
3.3
3.35
Time [min]
Vo
lta
ge
[V
]
Estimated Vs. Experimental Voltage
Measured Experimental Voltage
Estimated Voltage - SVSF
3.8 4 4.2 4.4 4.6
3.25
3.3

2168-6777 (c) 2013 IEEE. Personal use is permitted, but republication/redistribution requires IEEE permission. Seehttp://www.ieee.org/publications_standards/publications/rights/index.html for more information.
This article has been accepted for publication in a future issue of this journal, but has not been fully edited. Content may change prior to final publication. Citation information: DOI10.1109/JESTPE.2014.2331062, IEEE Journal of Emerging and Selected Topics in Power Electronics
JESTPE-2013-10-0273 12
Fig. 19. ECM Model SOC vs. Experimental (Coulomb Counting) SOC
The terminal voltage and SOC estimation error for US06
driving cycle are as shown below in Fig. 20. The maximum
error in the SOC is within 0.2 % and within 0.05V for the
terminal voltage. The RMSE for the SOC is 0.0989% and
0.0207V for the terminal voltage, respectively.
Fig. 20. US06 Voltage (Upper) and SOC (Lower) Error
V. CONCLUSION
The paper extends on the existing electrochemical battery
models to accommodate for aging and degradation that occurs
overtime. An aging battery model is developed by changing the
effective electrode volume to model capacity degradation. A
non-invasive genetic algorithm has been applied to estimate
model parameters for aged batteries. Main parameters that
contribute to battery aging are: the OCV-SOC relationship, the
solid-electrolyte interface resistance (c�;ª), the solid diffusion
coefficient (D�), the electrode effective volume (τ), and the
minimum and maximum stoichiometry values (θ>�%) and
(θ>1��%). The battery loss of capacity due to aging is attributed
to the increase in the battery solid electrolyte interface
resistance, the decrease in diffusion coefficient, and the
decrease in the battery electrode effective volume, those
changes reflect the electrode tendency to resist further lithium
diffusion as battery degrades.
Extensive accelerated aging and reference performance tests
have been conducted on lithium-iron phosphate cells.
Reference tests have been conducted at two distinct states of
life, namely: 100% and 80% capacity. Furthermore, a critical
state of charge estimation strategy has been implemented using
the SVSF estimation methodology. Results indicate that the
SVSF is robust, accurate, and reliable, and can be used for real-
time applications on board of an electric vehicle battery
management system. The estimator can be used to estimate the
critical surface charge and the battery overall state of charge at
steady state conditions. Future research involves extending the
reduced-order electrochemical model to work at higher C-rates
in addition to extending the strategy to the pack level.
VI. ACKNOWLEDGMENTS
Financial support from Ford Motor Company and NSERC
(National Sciences and Engineering Research Council of
Canada) is gratefully acknowledged.
TABLE 2.
ELECTROCHEMICAL BATTERY MODEL PARAMETERS NOMENCLATURE AND
UNITS
SYMBOL NAME UNIT æç Electrolyte current density Acm�) æç Solid current density Acm�) ∅ç Electrolyte potential V ∅é Solid potential V êç Electrolyte concentration molcm�r êé Solid concentration molcm�r êéç Concentration at the solid electrolyte interface molcm�r ëìæ Butler-Volmer current Acm�r íî Anode Normalized solid concentration - íï Cathode Normalized solid concentration - ð Open circuit potential V ðî Anode open circuit voltage V ðï Cathode open circuit voltage V ñ Overpotential V ò Faraday’s constant Cmol�� ó Applied battery cell current A ô Universal Gas constant JK��mol�� õ Temperature K
VII. BIBLIOGRAPHY
[1] R. Ahmed, M. El Sayed, J. Tjong and S. Habibi, "Reduced-Order
Electrochemical Model Parameters Identification and Critical Surface
Charge Estimation for Healthy and Aged Li-Ion Batteries, Part I:
Parameterization Model Development for Healthy Battery," Journal of
Emerging Technologies, 2014.
[2] S. E. Samadani, R. A. Fraser and M. Fowler, "A Review Study of
Methods for Lithium-ion Battery Health Monitoring and Remaining
Life Estimation in Hybrid Electric Vehicles," SAE International , 2012.
[3] B. Pattipati, C. Sankavaram and K. R. Pattipati, "System Identification
and Estimation Framework for Pivotal Automotive Battery
Management System Characteristics," IEEE Transactions on Systems,
Man, and Cybernetics, vol. 41, no. 6, 2010.
[4] "www.mynissanleaf.com/wiki/," [Online].
[5] K. A. Smith, C. D. Rahn and C.-Y. Wang, "Model-Based
Electrochemical Estimation of Lithium-Ion Batteries," in IEEE
International Conference on Control Applications, San Antonio, Texas,
USA, September 3-5, 2008.
0 2 4 6 8 10
42
43
44
45
46
47
48
49
50
Time [min]
SO
C [
%]
Estimated Vs. Experimental SOC
Actual SOC based on Coulomb Counting
Bulk SOC - ECM Model
2.4 2.6 2.8 3 3.2 3.4
47
5.5 6 6.5
44
45
0 2 4 6 8 10
-0.1
-0.05
0
0.05
0.1
Time [min]
Vo
lta
ge
[V
]
US06 Voltage Error
Terminal Voltage Error
0 2 4 6 8 10
0
0.1
0.2
Time [min]
SO
C [
%]
US06 SOC Error
SOC Error
2168-6777 (c) 2013 IEEE. Personal use is permitted, but republication/redistribution requires IEEE permission. Seehttp://www.ieee.org/publications_standards/publications/rights/index.html for more information.
This article has been accepted for publication in a future issue of this journal, but has not been fully edited. Content may change prior to final publication. Citation information: DOI10.1109/JESTPE.2014.2331062, IEEE Journal of Emerging and Selected Topics in Power Electronics
JESTPE-2013-10-0273 13
[6] R. Klein, N. A. Chaturvedi, J. Christensen, J. Ahmed, R. Findeisen and
A. Kojic , "Electrochemical Model Based Observer Design for a
Lithium-Ion Battery," IEEE Transactions on Control Systems
Technology, vol. 21, no. 2, 2013.
[7] H. Rahimi-Eichi, F. Baronti and M.-Y. Chow, "Modeling and Online
Parameter Identification of Li-Polymer Battery Cells for SOC
estimation," in IEEE International Symposium on Industrial Electronics
(ISIE), Hangzhou, 2012.
[8] S. R. Habibi and R. Burton, "The Variable Structure Filter," Journal of
Dynamic Systems, Measurement, and Control (ASME), vol. 125, pp.
287-293, September 2003.
[9] S. R. Habibi and R. Burton, "Parameter Identification for a High
Performance Hydrostatic Actuation System using the Variable
Structure Filter Concept," ASME Journal of Dynamic Systems,
Measurement, and Control, 2007.
[10] M. Conte, V. C. Fiorentino , I. D. Bloom, K. Morita, T. Ikeya and J. R.
Belt, "Ageing Testing Procedures on Lithium Batteries in an
International Collaboration Context," China, November, 2010.
[11] "Battery Test Manual for Plug-In Hybrid Electric Vehicles," U.S.
Department of Energy, Idaho National Laboratory, Idaho Falls, Idaho
83415, March 2008.
[12] G. Pistoia, Electric and Hybrid Vehicles, Rome, Italy: Elsevier, 2010.
[13] D. Domenico, S. Anna and F. Giovanni, "Lithium-Ion Battery State of
Charge and Critical Surface Charge Estimation Using an
Electrochemical Model-Based Extended Kalman Filter," Journal of
Dynamic Systems, Measurement, and Control, vol. 132, pp. 1-11, 2010.
[14] D. D. Domenico, G. Fiengo and A. Stefanopoulou, "Lithium-Ion
battery State of Charge estimation with a Kalman Filter based on a
electrochemical model," IEEE Interantional Conference on control
Applications (CCA), pp. 702-707, 2008.
[15] M. Dubarry, V. Svoboda, R. Hwu and B. Y. Liaw, "Capacity and power
fading mechanism identification from a commercial cell evaluation,"
Journal of Power Sources, 2006.
[16] D. Abraham, R. Twesten, M. Balasubramanian, I. Petrov, J. McBreen
and K. Amine, "Surface changes on LiNi0:8Co0:2O2 particles during
testing of high-power lithium-ion cells," Electrochemistry
Communications, vol. 4, pp. 620 - 625, 2002.
[17] R. Kostecki and F. McLarnon, "Degradation of LiNi0.8Co0.2O2
Cathode Surfaces in High-Power Lithium-Ion Batteries,"
Electrochemical and Solid-State Letters, vol. 5, pp. A164-A166, 2002.
[18] S. R. Habibi, "The Smooth Variable Structure Filter," Proceedings of
the IEEE, vol. 95, no. 5, pp. 1026-1059, 2007.
[19] M. Al-Shabi, "The General Toeplitz/Observability SVSF," Hamilton,
Ontario, 2011.
[20] S. A. Gadsden and S. R. Habibi, "A New Form of the Smooth Variable
Structure Filter with a Covariance Derivation," in IEEE Conference on
Decision and Control, Atlanta, Georgia, 2010.
[21] S. A. Gadsden, "Smooth Variable Structure Filtering: Theory and
Applications," Hamilton, Ontario, 2011.
[22] K. O'Neil and C. Y.-C, "Instability of Pseudinverse Acceleration
Control of Redundant Mechanisms," Proceedings of the IEEE
International Conference on Robotocs and Automation , April 2000.
[23] K. Doty, C. Melchiorri and C. Bonivento, "A theory oof generalized
inverses applied to robotics," International Robotics Journal, vol. 12,
pp. 1-19, 1993.
[24] H. Lipkin and P. E. , "Enumeration of singular configuration for robotic
manipulators," journal of Mech. Design , vol. 113, no. 3, pp. 272-279,
1991.
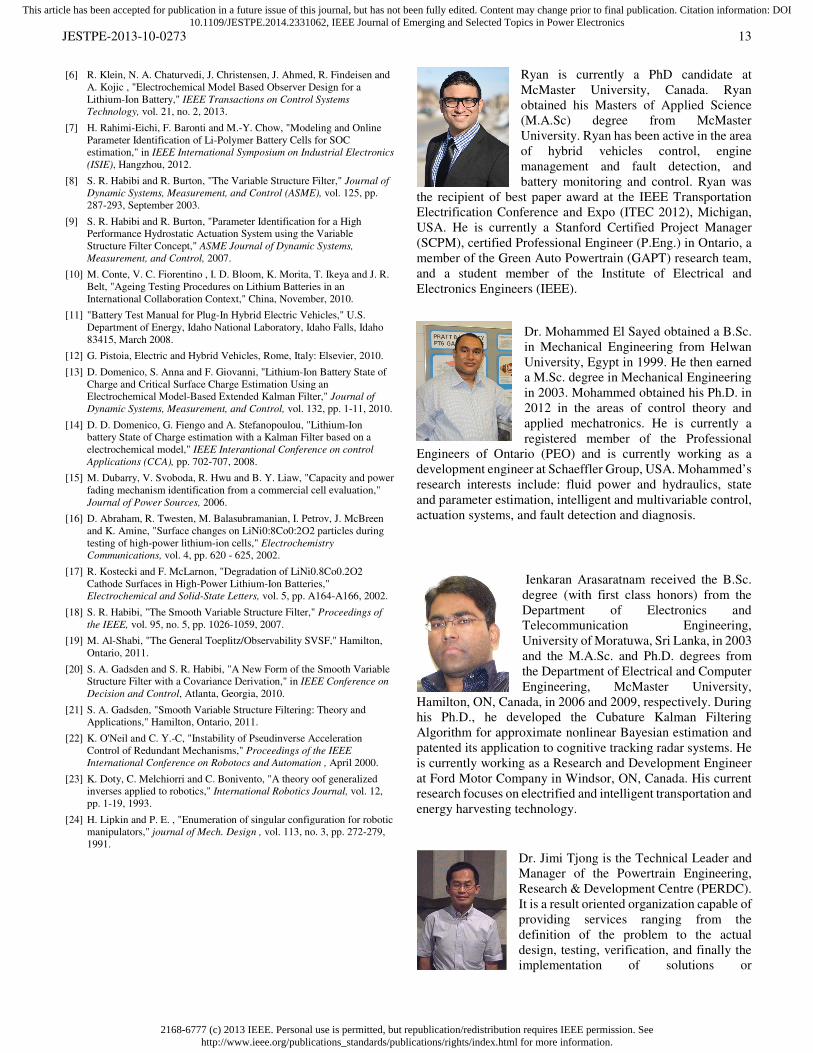
Ryan is currently a PhD candidate at
McMaster University, Canada. Ryan
obtained his Masters of Applied Science
(M.A.Sc) degree from McMaster
University. Ryan has been active in the area
of hybrid vehicles control, engine
management and fault detection, and
battery monitoring and control. Ryan was
the recipient of best paper award at the IEEE Transportation
Electrification Conference and Expo (ITEC 2012), Michigan,
USA. He is currently a Stanford Certified Project Manager
(SCPM), certified Professional Engineer (P.Eng.) in Ontario, a
member of the Green Auto Powertrain (GAPT) research team,
and a student member of the Institute of Electrical and
Electronics Engineers (IEEE).
Dr. Mohammed El Sayed obtained a B.Sc.
in Mechanical Engineering from Helwan
University, Egypt in 1999. He then earned
a M.Sc. degree in Mechanical Engineering
in 2003. Mohammed obtained his Ph.D. in
2012 in the areas of control theory and
applied mechatronics. He is currently a
registered member of the Professional
Engineers of Ontario (PEO) and is currently working as a
development engineer at Schaeffler Group, USA. Mohammed’s
research interests include: fluid power and hydraulics, state
and parameter estimation, intelligent and multivariable control,
actuation systems, and fault detection and diagnosis.
Ienkaran Arasaratnam received the B.Sc.
degree (with first class honors) from the
Department of Electronics and
Telecommunication Engineering,
University of Moratuwa, Sri Lanka, in 2003
and the M.A.Sc. and Ph.D. degrees from
the Department of Electrical and Computer
Engineering, McMaster University,
Hamilton, ON, Canada, in 2006 and 2009, respectively. During
his Ph.D., he developed the Cubature Kalman Filtering
Algorithm for approximate nonlinear Bayesian estimation and
patented its application to cognitive tracking radar systems. He
is currently working as a Research and Development Engineer
at Ford Motor Company in Windsor, ON, Canada. His current
research focuses on electrified and intelligent transportation and
energy harvesting technology.
Dr. Jimi Tjong is the Technical Leader and
Manager of the Powertrain Engineering,
Research & Development Centre (PERDC).
It is a result oriented organization capable of
providing services ranging from the
definition of the problem to the actual
design, testing, verification, and finally the
implementation of solutions or
2168-6777 (c) 2013 IEEE. Personal use is permitted, but republication/redistribution requires IEEE permission. Seehttp://www.ieee.org/publications_standards/publications/rights/index.html for more information.
This article has been accepted for publication in a future issue of this journal, but has not been fully edited. Content may change prior to final publication. Citation information: DOI10.1109/JESTPE.2014.2331062, IEEE Journal of Emerging and Selected Topics in Power Electronics
JESTPE-2013-10-0273 14
measures. The Centre is currently the hub for Engineering,
Research and Development that involved Canadian
Universities, Government Laboratories, Canadian automotive
parts and equipment suppliers. The Centre includes16 research
and development test cells, prototype machine shop, PHEV,
HEV and BEV development testing which occupies an area of
200,000 sq ft. The Centre is the hub for Production / Design
Validation of engines manufactured in North America and an
overflow for the Ford worldwide facilities. It also establishes a
close link worldwide within Ford Research and Innovation
Centre, Product Development and Manufacturing Operations
that can help bridge the gap between laboratory research and
the successful commercialization and integration of promising
new technologies into the product development cycle.
His principal field of Research and Development
encompasses the following: Optimizing Automotive Test
systems for cost, performance and full compatibility. It includes
the development of test methodology and cognitive systems;
Calibration for internal combustion engines; Alternate fuels,
bio fuels, lubricants and exhaust fluids; Lightweight materials
with the focus on Aluminum, Magnesium, bio materials;
Battery, Electric motors, super capacitors, stop/start systems,
HEV, PHEV, BEV systems; Nano sensors and actuators; High
performance and racing engines; Non-destructive monitoring of
manufacturing and assembly processes; and Advanced gasoline
and diesel engines focusing in fuel economy, performance and
cost opportunities.
He has published and presented numerous technical papers
in the above fields internationally. Dr. Tjong is also an Adjunct
Professor of the University of Windsor, McMaster University,
and University of Toronto. He continuously mentors graduate
students in completing the course requirements as well as career
development coaching.
Dr. Saeid Habibi is currently the Director
of the Centre for Mechatronics and Hybrid
Technology and a Professor in the
Department of Mechanical Engineering at
McMaster University. Saeid obtained his
Ph.D. in Control Engineering from the
University of Cambridge, U.K. His
academic background includes research
into intelligent control, state and parameter estimation, fault
diagnosis and prediction, variable structure systems, and fluid
power. The application areas for his research have included
aerospace, automotive, water distribution, robotics, and
actuation systems. He spent a number of years in industry as a
Project Manager and Senior Consultant for Cambridge Control
Ltd, U.K., and as Senior Manager of Systems Engineering for
AlliedSignal Aerospace Canada. He received two corporate
awards for his contributions to the AlliedSignal Systems
Engineering Process in 1996 and 1997. He was the recipient of
the Institution of Electrical Engineers (IEE) F.C. Williams best
paper award in 1992 for his contribution to variable structure
systems theory. He was also awarded an NSERC Canada
International Postdoctoral Fellowship that he held at the
University of Toronto from 1993 to 1995, and more recently a
Boeing Visiting Scholar sponsorship for 2005. Saeid is on the
Editorial Board of the Transactions of the Canadian Society of
Mechanical Engineers and is a member of IEEE, ASME, and
the ASME Fluid Power Systems Division Executive
Committee.