electrochemical evaluation of glutathione s-transferase ... · electrochemicalevaluation of...
TRANSCRIPT

�������� ����� ��
Electrochemical evaluation of Glutathione S-transferase kinetic parameters
Teodor Adrian Enache, Ana Maria Oliveira-Brett
PII: S1567-5394(14)00108-XDOI: doi: 10.1016/j.bioelechem.2014.07.002Reference: BIOJEC 6762
To appear in: Bioelectrochemistry
Received date: 24 July 2013Revised date: 8 July 2014Accepted date: 13 July 2014
Please cite this article as: Teodor Adrian Enache, Ana Maria Oliveira-Brett, Electro-chemical evaluation of Glutathione S-transferase kinetic parameters, Bioelectrochemistry(2014), doi: 10.1016/j.bioelechem.2014.07.002
This is a PDF file of an unedited manuscript that has been accepted for publication.As a service to our customers we are providing this early version of the manuscript.The manuscript will undergo copyediting, typesetting, and review of the resulting proofbefore it is published in its final form. Please note that during the production processerrors may be discovered which could affect the content, and all legal disclaimers thatapply to the journal pertain.
ACC
EPTE
D M
ANU
SCR
IPT
ACCEPTED MANUSCRIPT1
Electrochemical evaluation of Glutathione S-transferase kinetic
parameters
Teodor Adrian Enache and Ana Maria Oliveira-Brett
*
Department of Chemistry, University of Coimbra, 3004-535 Coimbra, Portugal
* To whom correspondence should be addressed
Tel/FAX: +351-239-827703
e-mail: [email protected]
Departamento de Quíımica,
Faculdade de Ciências e Tecnologia,
Universidade de Coimbra,
3004-535 Coimbra, Portugal
Abstract
Glutathione S-transferases (GSTs), are a family of enzymes belonging to the
phase II metabolism that catalyse the formation of thioether conjugates between the
endogenous tripeptide glutathione and xenobiotic compounds. The voltammetric
behaviour of glutathione (GSH), 1-chloro-2,4-dinitrobenzene (CDNB) and glutathione
S-transferase (GST), as well as the catalytic conjugation reaction of GSH to CDNB by
GST was investigated at room temperature, T = 298.15 K (25 °C), at pH 6.5, for low
concentration of substrates and enzyme, using differential pulse (DP) voltammetry at a
glassy carbon electrode. Only GSH can be oxidized, a sensitivity of 0.14 nA/µM and a
LOD of 6.4 µM were obtained. The GST kinetic parameters electrochemical evaluation,
in relation to its substrates, GSH and CDNB, using reciprocal Michaelis–Menten and
Lineweaver–Burk double reciprocal plots, were determined. A value of KM ~ 100 µM
was obtained for either GSH or CDNB, and Vmax varied between 40 - 60 µmol/min per
mg of GST.
Keywords: glutathione, 1-chloro-2,4-dinitrobenzene, glutathione S-transferase,
electrochemistry, oxidation
ACC
EPTE
D M
ANU
SCR
IPT
ACCEPTED MANUSCRIPT2
1 Introduction
The metabolism of cancer cells is controlled by oncogene signalling and by
dysregulation of metabolic enzymes. The resulting altered metabolism supports cellular
proliferation and survival but leaves cancer cells dependent on a continuous supply of
nutrients. A primary cause of cancer treatment failure and patient relapse is an acquired
or intrinsic resistance to anticancer therapies. Acquisition of drug resistance can be
attributed to various factors that include avoidance of apoptotic cell death, altered
expression of multidrug resistance-associated proteins, altered drug metabolism or
uptake, and/or overexpression of phase II biotransformation enzymes [1, 2].
Many metabolic enzymes, such as those belonging to the phase II metabolism,
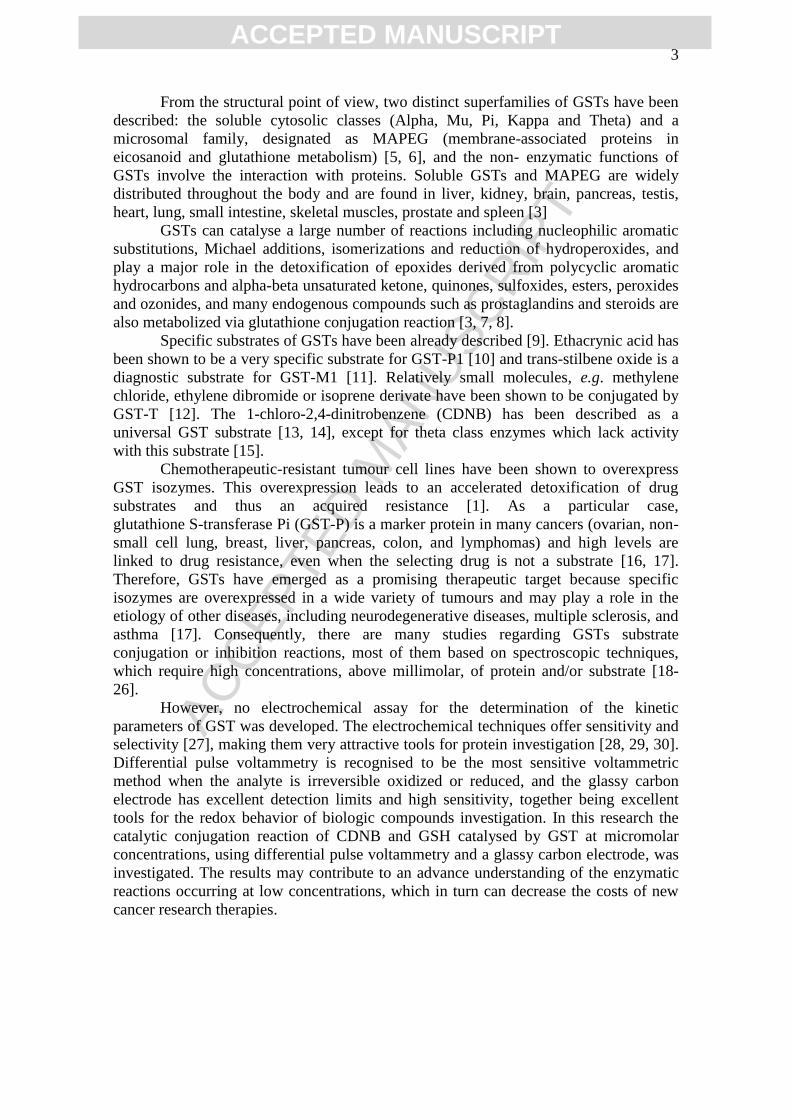
have been investigated. Glutathione S-transferases (GSTs), one of the major phase II
detoxification, are a family of enzymes that catalyses the formation of thioether
conjugates between the endogenous tripeptide glutathione (GSH) and xenobiotic
compounds, Scheme 1, [3]. They are abundant throughout most life forms [2], being
involved in the metabolism of xenobiotics and play an important role in cellular
protection against reactive and toxic electrophiles species that arise through normal
metabolic processes [4].
Scheme 1 The conjugation reaction of GSH with CDNB by GST
O
NH
OH
O
SHNH
NH2HO
O
OCl
NO2
NO2
GST
O
NH
OHO
S
NH
NH2
HO
O
O
Cl
NO2
NO2
O
NH
OHO
S
NH
NH2
HO
O
O
NO2
NO2
H+ Cl-
H+
ACC
EPTE
D M
ANU
SCR
IPT
ACCEPTED MANUSCRIPT3
From the structural point of view, two distinct superfamilies of GSTs have been
described: the soluble cytosolic classes (Alpha, Mu, Pi, Kappa and Theta) and a
microsomal family, designated as MAPEG (membrane-associated proteins in
eicosanoid and glutathione metabolism) [5, 6], and the non- enzymatic functions of
GSTs involve the interaction with proteins. Soluble GSTs and MAPEG are widely
distributed throughout the body and are found in liver, kidney, brain, pancreas, testis,
heart, lung, small intestine, skeletal muscles, prostate and spleen [3]
GSTs can catalyse a large number of reactions including nucleophilic aromatic
substitutions, Michael additions, isomerizations and reduction of hydroperoxides, and
play a major role in the detoxification of epoxides derived from polycyclic aromatic
hydrocarbons and alpha-beta unsaturated ketone, quinones, sulfoxides, esters, peroxides
and ozonides, and many endogenous compounds such as prostaglandins and steroids are
also metabolized via glutathione conjugation reaction [3, 7, 8].
Specific substrates of GSTs have been already described [9]. Ethacrynic acid has
been shown to be a very specific substrate for GST-P1 [10] and trans-stilbene oxide is a
diagnostic substrate for GST-M1 [11]. Relatively small molecules, e.g. methylene
chloride, ethylene dibromide or isoprene derivate have been shown to be conjugated by
GST-T [12]. The 1-chloro-2,4-dinitrobenzene (CDNB) has been described as a
universal GST substrate [13, 14], except for theta class enzymes which lack activity
with this substrate [15].
Chemotherapeutic-resistant tumour cell lines have been shown to overexpress
GST isozymes. This overexpression leads to an accelerated detoxification of drug
substrates and thus an acquired resistance [1]. As a particular case,
glutathione S-transferase Pi (GST-P) is a marker protein in many cancers (ovarian, non-
small cell lung, breast, liver, pancreas, colon, and lymphomas) and high levels are
linked to drug resistance, even when the selecting drug is not a substrate [16, 17].
Therefore, GSTs have emerged as a promising therapeutic target because specific
isozymes are overexpressed in a wide variety of tumours and may play a role in the
etiology of other diseases, including neurodegenerative diseases, multiple sclerosis, and
asthma [17]. Consequently, there are many studies regarding GSTs substrate
conjugation or inhibition reactions, most of them based on spectroscopic techniques,
which require high concentrations, above millimolar, of protein and/or substrate [18-
26].
However, no electrochemical assay for the determination of the kinetic
parameters of GST was developed. The electrochemical techniques offer sensitivity and
selectivity [27], making them very attractive tools for protein investigation [28, 29, 30].
Differential pulse voltammetry is recognised to be the most sensitive voltammetric
method when the analyte is irreversible oxidized or reduced, and the glassy carbon
electrode has excellent detection limits and high sensitivity, together being excellent
tools for the redox behavior of biologic compounds investigation. In this research the
catalytic conjugation reaction of CDNB and GSH catalysed by GST at micromolar
concentrations, using differential pulse voltammetry and a glassy carbon electrode, was
investigated. The results may contribute to an advance understanding of the enzymatic
reactions occurring at low concentrations, which in turn can decrease the costs of new
cancer research therapies.

ACC
EPTE
D M
ANU
SCR
IPT
ACCEPTED MANUSCRIPT4
2 Experimental
2.1 Materials and reagents
Reduced glutathione (GSH), 1-chloro-2,4-dinitrobenzene (CDNB) and
glutathione S-transferase (GST) from equine liver, from Sigma–Aldrich were used
without further purification. Stock solutions of 1 mM GSH and CDNB (containing 30%
(v/v) ethanol) were daily prepared in ultra-pure water from a Millipore Milli-Q system
(conductivity 0.1 S cm-1
). The GST solutions of different concentrations were
prepared in 5% glycerol and were stored at -22 ºC.
The supporting electrolyte was 0.1 M phosphate buffer pH = 6.5.
Microvolumes were measured using EP-10 and EP-100 Plus Motorized
Microliter Pippettes (Rainin Instrument Co. Inc., Woburn, USA). All experiments were
done at room temperature (25 1 ºC) in 0.1 M phosphate buffer pH =6.5.
2.2 Voltammetric parameters and electrochemical cells
Voltammetric experiments were carried out using a µAutolab running with
GPES 4.9 software, Metrohm/Autolab, Utrecht, The Netherlands. Measurements were
carried out using a glassy carbon electrode (GCE) as working electrodes, a Pt wire as
counter electrode and an Ag/AgCl (3 M KCl) as reference electrode. The experimental
conditions for differential pulse (DP) voltammetry were: pulse amplitude 50 mV, pulse
width 70 ms and scan rate 5 mV s-1
.
The GCE (d = 1 mm) was polished using diamond spray (particle size 3 m)
before each experiment. After polishing, the electrode was rinsed thoroughly with
Milli-Q water for 30 s; then it was placed in supporting electrolyte and various
DP voltammograms were recorded until a steady state baseline voltammogram was
obtained.
2.3 Acquisition and presentation of voltammetric data
All the voltammograms presented were background-subtracted and baseline-
corrected using the moving average with a step window of 3 mV included in GPES
version 4.9 software. This mathematical treatment improves the visualization and
identification of peaks over the baseline without introducing any artefact, although the
peak height is in some cases reduced (<10%) relative to that of the untreated curve.
Nevertheless, this mathematical treatment of the original voltammograms was used in
the presentation of all experimental voltammograms for a better and clearer
identification of the peaks. The values for peak current presented in all graphs were
determined from the original untreated voltammograms after subtraction of the baseline.
3 Results and discussion
An electrochemical method for evaluation of GST activity and determination of
its kinetic parameters was developed. The conjugation reaction of GSH with CDNB
catalysed by GST was studied by DP voltammetry in solutions incubated for different
time periods and different concentrations of enzyme and substrates in 0.1 M phosphate
buffer pH = 6.5.
GSH oxidation occurs at the cysteine residue and is an irreversible, diffusion-
controlled, pH dependent process that involves the sulfhydryl group oxidation [28, 31].
ACC
EPTE
D M
ANU
SCR
IPT
ACCEPTED MANUSCRIPT5
GST catalyses the proton removal from GSH to generate the thiolate anion GSˉ, that is
more reactive than GSH. The thiolate conjugation reaction with CDNB occurs at carbon
one where chloride was bound, producing a Meisenheimer complex. This complex is
unstable, chloride dissociates, and the glutathionyl-dinitrobenzene (GS-DNB) conjugate
is formed in solution [32], Scheme 1.
Therefore, as GST catalyses the conjugation reaction of CDNB, less free GSH
oxidizable sulfhydryl groups are be available in solution to react. Consequently, the
formation of the GS-DNB complex as well as the GST activity can be indirectly
determined by the electrochemical evaluation of the GSH oxidation current decrease.
The DP voltammograms were recorded using a clean GCE surface and the
current corresponding to GSH sulfhydryl group oxidation was measured in order to
quantify the GS-DNB product. The CDNB, GST, and conjugation reaction product
GS-DNB, were not electroactive in the experimental conditions used.
3.1 GSH electrochemical oxidation
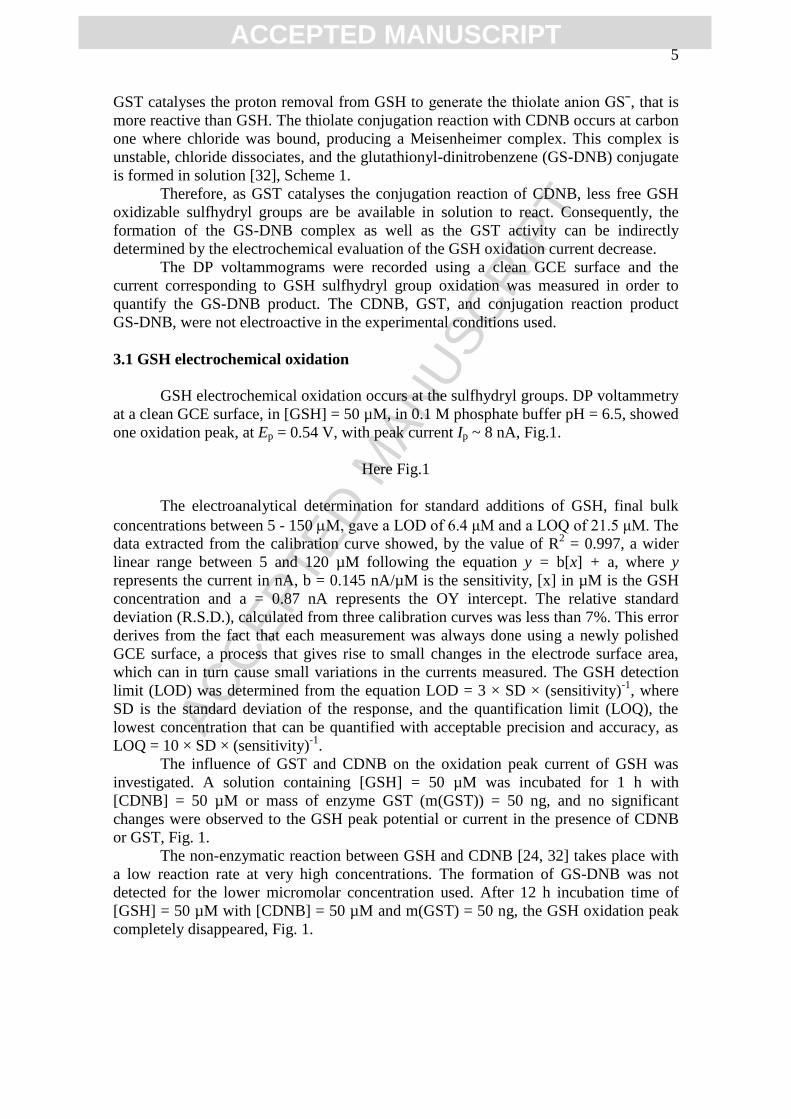
GSH electrochemical oxidation occurs at the sulfhydryl groups. DP voltammetry
at a clean GCE surface, in [GSH] = 50 µM, in 0.1 M phosphate buffer pH = 6.5, showed
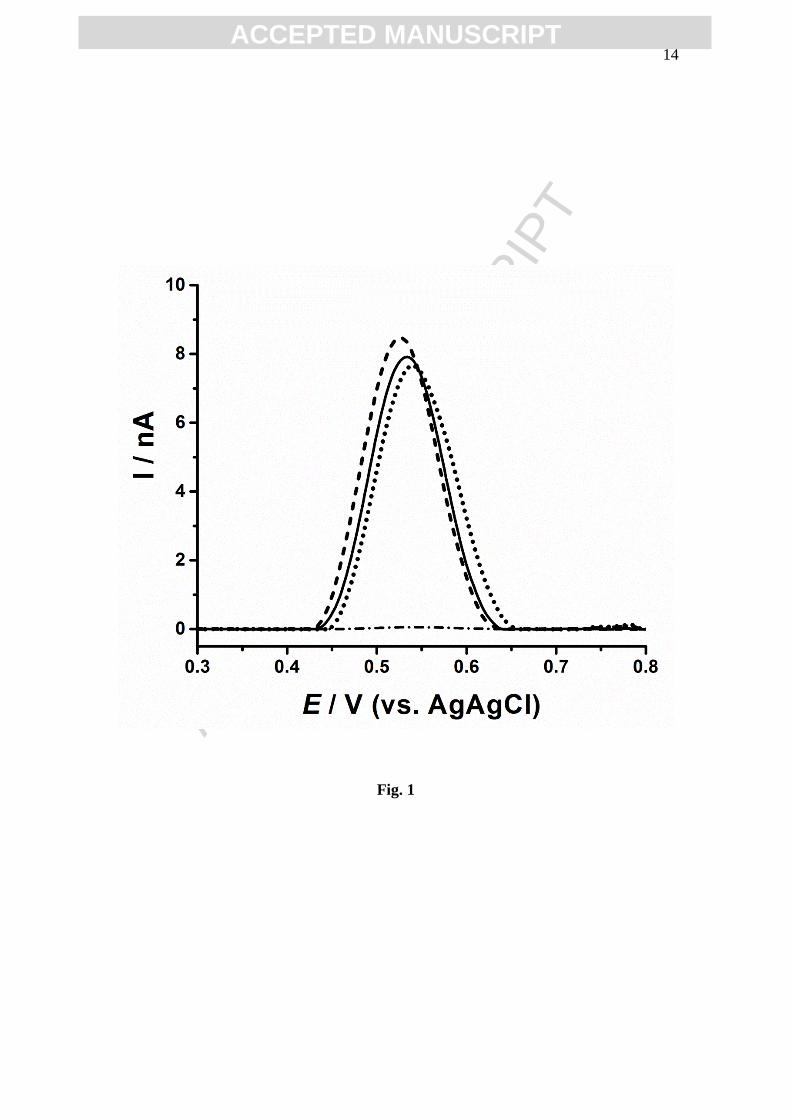
one oxidation peak, at Ep = 0.54 V, with peak current Ip ~ 8 nA, Fig.1.
Here Fig.1
The electroanalytical determination for standard additions of GSH, final bulk
concentrations between 5 - 150 M, gave a LOD of 6.4 μM and a LOQ of 21.5 μM. The
data extracted from the calibration curve showed, by the value of R2 = 0.997, a wider
linear range between 5 and 120 µM following the equation y = b[x] + a, where y
represents the current in nA, b = 0.145 nA/µM is the sensitivity, [x] in µM is the GSH
concentration and a = 0.87 nA represents the OY intercept. The relative standard
deviation (R.S.D.), calculated from three calibration curves was less than 7%. This error
derives from the fact that each measurement was always done using a newly polished
GCE surface, a process that gives rise to small changes in the electrode surface area,
which can in turn cause small variations in the currents measured. The GSH detection
limit (LOD) was determined from the equation LOD = 3 × SD × (sensitivity)-1
, where
SD is the standard deviation of the response, and the quantification limit (LOQ), the
lowest concentration that can be quantified with acceptable precision and accuracy, as
LOQ = 10 × SD × (sensitivity)-1
.
The influence of GST and CDNB on the oxidation peak current of GSH was
investigated. A solution containing [GSH] = 50 µM was incubated for 1 h with
[CDNB] = 50 µM or mass of enzyme GST (m(GST)) = 50 ng, and no significant
changes were observed to the GSH peak potential or current in the presence of CDNB
or GST, Fig. 1.
The non-enzymatic reaction between GSH and CDNB [24, 32] takes place with
a low reaction rate at very high concentrations. The formation of GS-DNB was not
detected for the lower micromolar concentration used. After 12 h incubation time of
[GSH] = 50 µM with [CDNB] = 50 µM and m(GST) = 50 ng, the GSH oxidation peak
completely disappeared, Fig. 1.
ACC
EPTE
D M
ANU
SCR
IPT
ACCEPTED MANUSCRIPT6
3.2 GST activity electrochemical evaluation
The indirect determination of the GS-DNB complex and GST activity was
electrochemically evaluated based on the decrease of the GSH sulfhydryl group
oxidation peak current.
The effect of varying m(GST) on the conjugation reaction rate in solutions
containing [GSH] = 50 µM and [CDNB] = 50 µM was investigated for four incubation
periods, 0, 15, 30 and 60 min.
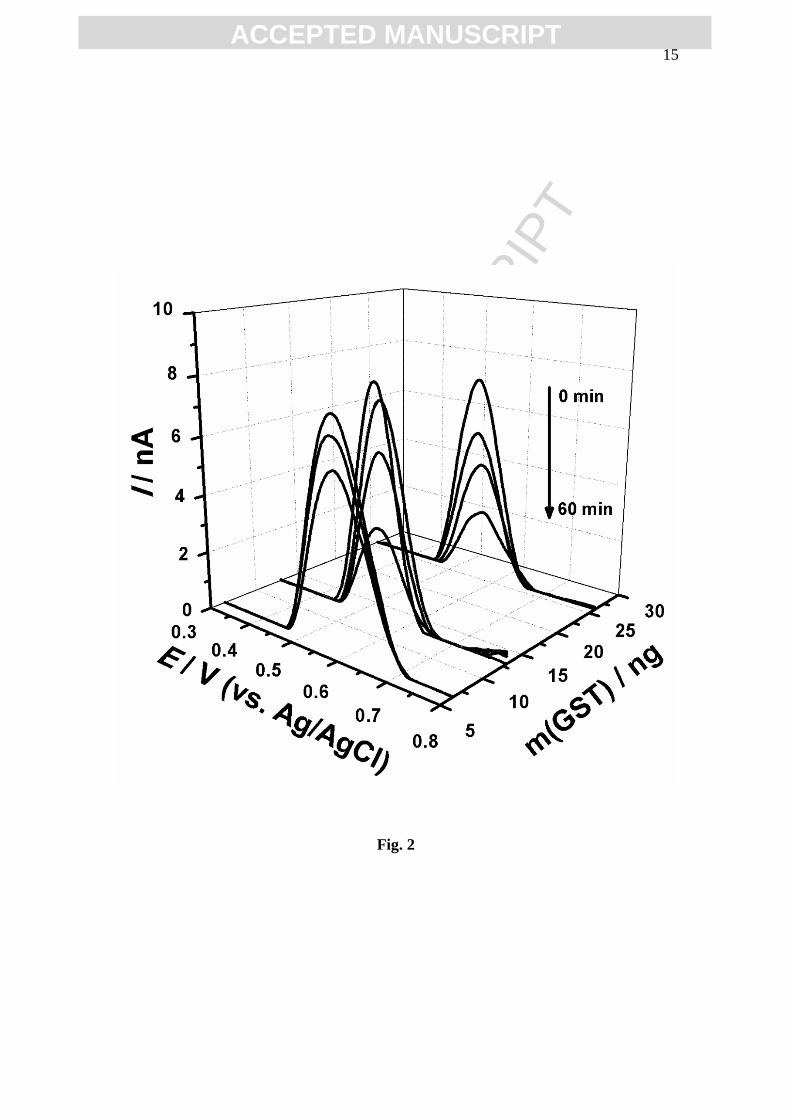
At 0 min, no significant differences were observed on the GSH oxidation peak
current, even in a GST concentrated solution, Fig. 2. Increasing the incubation time and
GST concentration, the GSH oxidation peak current decreased slowly for a small
concentration of enzyme and faster in GST concentrated solutions, Fig. 2.
Here Fig. 2
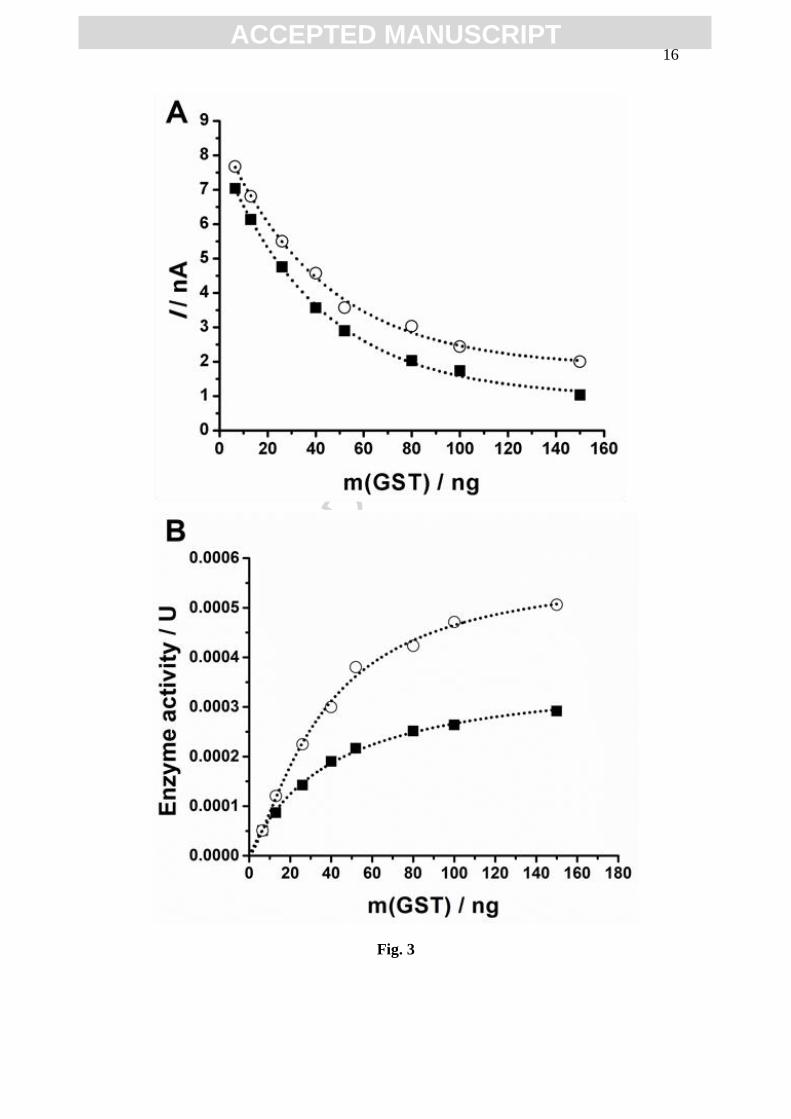
The DP voltammograms in solution containing [GSH] = 50 µM and
[CDNB] = 50 µM incubated for 15 and 30 min and for a varying m(GST) concentration,
between 6 - 150 ng, showed a decrease of the GSH oxidation peak current Ip with
increasing enzyme concentration, Fig. 3A.
Here Fig. 3
The enzyme activity are the number of moles of substrate converted per unit
time or the rate of a reaction times the reaction volume, and the units used are one
enzyme unit (U) equal to 1 μmol min−1
. The rate of a reaction is determined by the
concentration of substrate disappearing (or product produced) per unit time, and the rate
of a reaction units are mol L-1
s-1
.
The initial current Ii, measured before enzymatic reaction, i.e. before incubation,
corresponds to a given initial [GSH]i concentration, and follows the linear relationship
I(nA) = 0.145 [GST] + 0.87. The final current If is obtained after incubation and is
related to the remaining unconjugated [GSH]f concentration in solution.
The difference between initial [GSH]i and unconjugated [GSH]f corresponds to
the [GS-DNB] formed, and Ii – If is the decrease in current due to the conjugated [GSH]
formation. Therefore, the molar concentration of conjugation reaction product
[GS-DNB], for each experimental condition can be calculated as:
Eq. 1
The enzyme activity, Eq.2, describes the µmol of GSH that reacted with CDNB
per minute. The [GSH]i = 50 µM used is within the linear calibration curve region,
where the current is directly proportional to concentration. The GSH concentration
conjugated to CDNB corresponds to the difference between the initial oxidation peak
current (Ii), obtained for [GSH] = 50 µM before incubation, and the [GSH] final
oxidation peak current (If), measured after incubation (15 or 30 min), in 200 µL, 0.1 M
phosphate buffer pH=6.5. The Enzyme Activity = ([GSH]i·(Ii – If)·Vr)/Ii·t, Eq. 2. Where
the enzyme activity is in U (enzyme units); 1U = 1 µmol/min; [GSH]i = 50 µM (50
µmol/L) is the GSH initial concentration; Ii = 8.3 nA is the oxidation peak current for
[ci] = 50 µM before incubation; If is the oxidation peak current of unconjugated [ci] after
incubation; Vr = 200 x 10-6
L is the reaction volume; t is the incubation time in minutes
(15 or 30 min).
𝐺𝑆 − 𝐷𝑁𝐵 = 𝐺𝑆𝐻 𝑖(𝐼𝑖 − 𝐼𝑓)
𝐼𝑖
ACC
EPTE
D M
ANU
SCR
IPT
ACCEPTED MANUSCRIPT7
The enzyme activity increases linearly with the enzyme concentration up
to ~50 ng, where the reaction starts to be limited by substrate concentration, Fig. 3B,
and the reaction rate becomes constant. The enzyme activity calculated for 30 min
incubation time was lower than the enzyme activity calculated for 15 min incubation
time, due to the decrease of substrates concentration, Fig. 3B.
3.3 GST determination of KM and Vmax values
The GST kinetic parameters, for different concentrations of GSH and CDNB
incubated for two time periods (15 and 30 min) with m(GST) = 13 x 10-6
mg, in 200 µL,
in 01M phosphate buffer pH=6.5, were determine, Figs. 4 and 5. GST is a two substrate
enzyme, which catalysis the formation of a thioether conjugate between the endogenous
tripeptide glutathione (GSH) and a xenobiotic compound, here CDNB, and only the
consumption of GSH was detected. After incubation, the DP voltammograms were
recorded at a clean GCE surface and the GSH oxidation peak current was used for the
indirect quantification of GS-DNB complex formed.
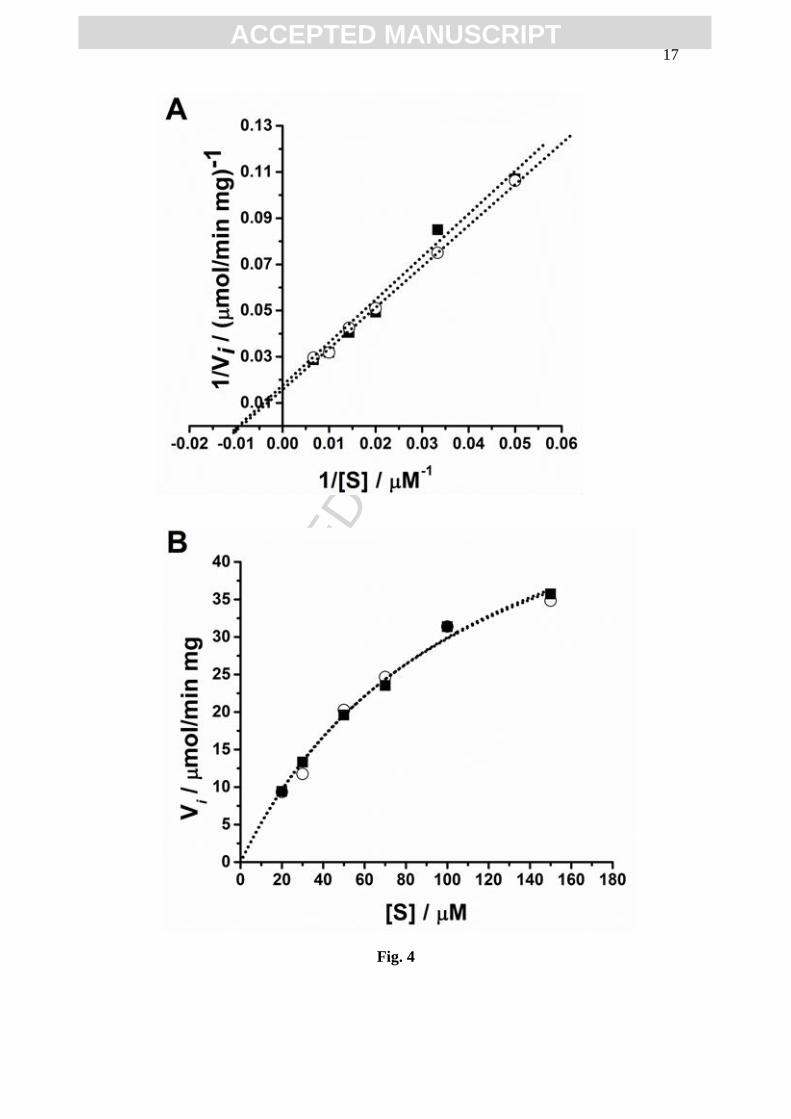
The Michaelis–Menten equation model was derived to account for the kinetic
properties of enzymes. The kinetic parameters – the Michaelis constant (KM) and the
maximal reaction velocity (Vmax) – were determined by two methods: Lineweaver–Burk
(double reciprocal) transformation, Figs. 4A and 5A, and nonlinear curve-fiting of
Michaelis–Menten reciprocal plot, Figs. 4B and 5B.
Here Fig. 4
Here Fig. 5
The GST activity was investigated for concentrations varying between
20-150 µM for CDNB or GSH. The concentration of the one substrate, [CDNB] or
[GSH], was kept constant at 100 µM. The values of the KM and Vmax of GST for
substrates CDNB and GSH, were determined, Table 1.
Here Table 1
The GST initial reaction velocities for GSH (Vi-GSH), equation (3), and CDNB
(Vi-CDNB), equation (4), were calculated as µmol of GSH conjugated to CDNB per
minute per mg m(GST). Considering the [GSH] calibration curve, the conjugated
[GSH] was calculated as [GSH]i-[GSH]f, and the conjugated [GSH] current is Ii – If,
with m(GST) = 13x10-6
mg, in 200 µL, in 0.1 µM phosphate buffer pH=6.5.
Therefore, Vi-GSH = ([GSH]i·(Ii – If)·Vr)/Ii·t·m(GST), Eq. 3, where:
[GSH]i = 20-150 µM (20-150 µmol/L) is the initial GSH concentration; Ii is the initial
current obtained for [ci] before incubation; and Vi-CDNB = ([GSH]i·(Ii –
If)·Vr)/Ii·t·m(GST), Eq. 4, where: [GSH]i = 100 µM (100 µmol/L) is the initial GSH
concentration; Ii = 14 nA is the initial current obtained for [ci] before incubation; in both
Eq. 3 and 4, Vi-GSH is the initial velocity in µmol min-1
mg-1
; m(GST) = 13x10-6
mg is
the enzyme amount; If is the final current obtained for remaining [ci] after incubation;
Vr = 200 x 10-6
L is the reaction volume; t is the incubation time in minutes (15 or 30
min).
The Lineweaver–Burk plot is a classic method but as the Y-axis takes the
reciprocal of the Vi any small errors in the measurements will be increased. Also, when
experimental conditions do not allow large concentrations of substrate, e.g. saturation or
low solubility, there will be no small values for 1/[S], which will give a large intercept
ACC
EPTE
D M
ANU
SCR
IPT
ACCEPTED MANUSCRIPT8
extrapolation value [33]. The nonlinear curve-fitting of Michaelis–Menten reciprocal
plot, Fig.4, ensure an accuracy value of Vmax since the fit Eq. 5:
Eq.5
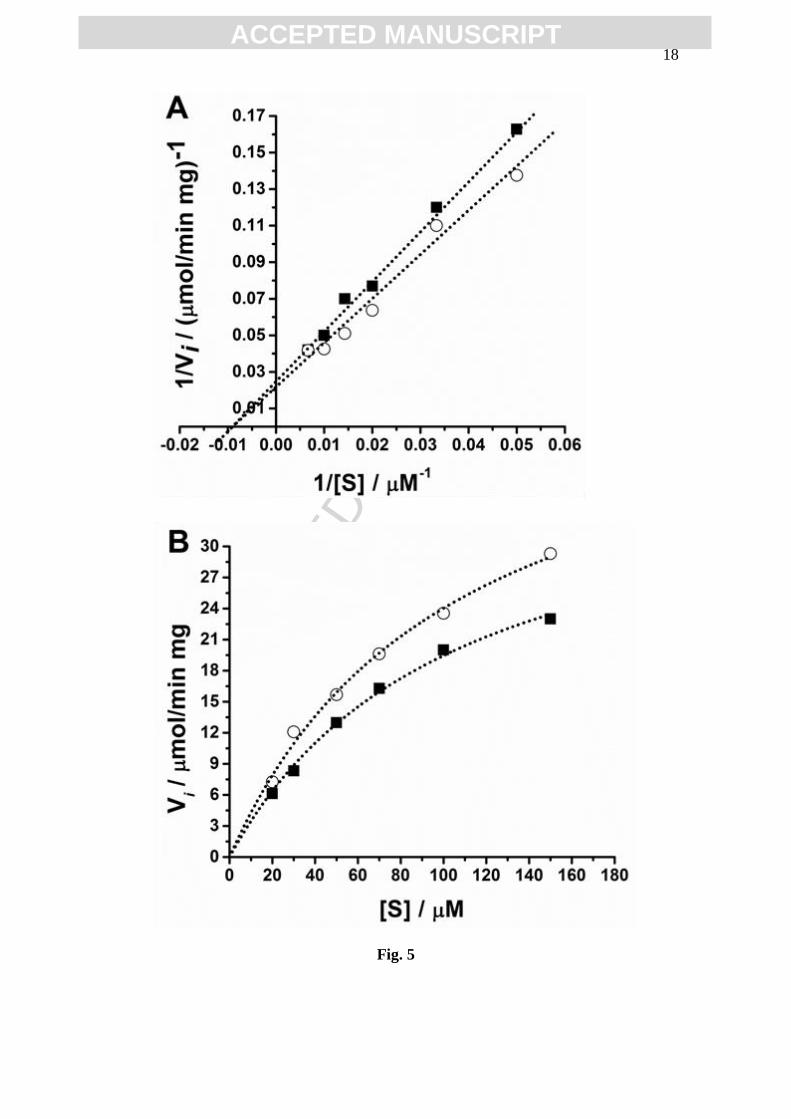
The results obtained for different concentrations of [GSH] and [CDNB]
incubated for 15 and 30 min, Figs. 4 and 5, showed slightly different KM values varying
between 96-111 µM, whereas for short incubation times Vmax highest values were
obtained, Table 1. The statistical analysis revealed that GST showed the same affinity to
the either substrate CDNB or GSH. Nevertheless, the Lineweaver–Burk plots indicated
that both GSH and CDNB are GST uncompetitive substrates.
The most common method employed for the evaluation of GST kinetic
parameters is spectroscopy [18-26, 32]. Usually, depending on the GST isozyme type
and experimental assay, KM varies between 0.1 mM [25] and more than 1 mM [26].
However, spectroscopic methods request large quantities of analytes, 0.1 – 5 mM for
substrates and more than 10 µg of enzyme, in order to ensure a reasonable time for each
assay. On the other hand, in agreement with the lowest values reported [25], due to the
high sensitivity of DP voltammetry was possible to use a low GST concentration, and a
low KM was determined.
4 Conclusions
A rapid, efficient and sensitive electrochemical method for the determination of
the kinetic Michaelis constants of glutathione S-transferase activity was developed
measuring the GSH sulfhydryl group’s oxidation peak current at GCE by
DP voltammetry. The GSH detection limit was 6.4 μM and quantification limit was
21.5 μM. The effect of enzyme and substrates concentration on the enzymatic reaction
rate, as well as the influence of GST and CDNB on the GSH oxidation peak current,
was investigated. The optimum experimental conditions were low enzyme
concentration, below 250 ng/mL (50 ng in 200µL reaction volume), and 15 min
incubation time. The KM ~ 100 µM for either GSH or CDNB was obtained, showing the
same affinity of GST for both substrates.
The sensitivity of the electrochemical methodologies has the advantage of
enabling low detection limits which means low reagent consumption and can contribute
to a diminution of the total costs associated with cancer therapy research. The use of
screen printed electrodes is foreseen, thus enhancing the applicability of electrochemical
methodologies for the determination of the kinetic Michaelis constants with a
miniaturised and portable device.
5 Acknowledgements
Financial support from Fundação para a Ciência e Tecnologia (FCT),
Post-Doctoral Grant SFRH/BPD/80195/2011 (T.A. Enache), projects
PTDC/QEQ-MED/0586/2012, PEst-C/EME/UI0285/2013 and CENTRO-07-0224-
FEDER-002001 (MT4MOBI) (co-financed by the European Community Fund
FEDER), FEDER funds through the program COMPETE–Programa Operacional
Factores de Competitividade, is gratefully acknowledged.
Vi =Vmax [𝑆]
𝐾M + [𝑆]
ACC
EPTE
D M
ANU
SCR
IPT
ACCEPTED MANUSCRIPT9
6 References
[1] C.C. McIlwain, D.M. Townsend and K.D. Tew, Glutathione S-transferase
polymorphisms: cancer incidence and therapy, Oncogene 25 (2006) 1639–1648.
[2] D.M. Townsend and K.D. Tew, The role of glutathione-S-transferase in anti-
cancer drug resistance, Oncogene 22 (2003) 7369–7375.
[3] P. Jancova, P. Anzenbacher, E. Anzenbacherova, Phase ii drug metabolizing
enzymes, Biomed Pap Med Fac Univ Palacky Olomouc Czech Repub. 154
(2010)103–116.
[4] F. J. Gonzales, R.H. Turkey, Drug metabolism, in L.L. Brunton, J.S. Lazo, K.L.
Parker (Eds.), Goodman & Gilman's The pharmacological basis of therapeutics,
11e, McGraw Hill, New York, 2006, pp 71-91.
[5] D. Sheehan, G. Meade, V.M. Foley, C.A. Dowd. Structure, function and evolution
of glutathione transferases: implications for classification of non-mammalian
members of an ancient enzyme superfamily. Biochem. J. 360 (2001) 1–16.
[6] R.N. Armstrong. Structure, catalytic mechanism, and evolution of the glutathione
transferases. Chem. Res. Toxicol. 10 (1997) 2–18.
[7] S. Jana, S. Mandlekar, Role of Phase II Drug Metabolizing Enzymes in Cancer
Chemoprevention, Curr. Drug. Metab. 10, (2009) 595-616.
[8] T.H. Rushmore, A.N. Kong, Pharmacogenomics, Regulation and Signaling
Pathways of Phase I and II Drug Metabolizing Enzymes, Curr. Drug Metab. 3
(2002) 481-490.
[9] C. Ntais, A. Polycarpou, J.P. Ioannidis, Association of GSTM1, GSTT1, and
GSTP1 Gene Polymorphisms with the Risk of Prostate Cancer: A Meta-analysis,
Cancer Epidemiol Biomarkers Prev. 14 (2005) 176-181.
[10] M. Pasello, F. Michelacci, I. Scionti, C. M. Hattinger, M. Zuntini, A.M. Caccuri,
K. Scotlandi, P. Picci, M. Serra, Overcoming Glutathione S-Transferase P1–
Related Cisplatin Resistance in Osteosarcoma, Cancer Res. 68 (2008) 6661-6668.
[11] P.D. Josephy, Genetic Variations in Human Glutathione Transferase Enzymes:
Significance for Pharmacology and Toxicology, Hum Genomics Proteomics. 2
(2010) 1-14.
[12] P.J. van Bladeren Glutathione conjugation as a bioactivation reaction. Chem Biol
Interact. 129 (2000); 129 61–76.
[13] E. Hoque, S. Pflugmacher, J. Fritscher,
and M. Wolf, Induction of Glutathione S-
Transferase in Biofilms and Germinating Spores of Mucor hiemalis Strain EH5
from Cold Sulfidic Spring Waters, Appl Environ Microbiol. 73 (2007)
2697–2707.
[14] M. McGuinness, C. Ivory, N. Gilmartin, D.N. Dowlin, Investigation of substrate
specificity of wildtype and mutant BphKLB400
(a glutathione S-transferase) from
Burkholderia LB400, Int. Biodeterior. Biodegrad.58 (2006) 203–208.
[15] S. G. George. Enzymology and molecular biology of phase II xenobiotic-
conjugating enzymes in fish. in D. C. Malins and G. K. Ostrander (ed.), Aquatic
toxicology: molecular, biochemical and cellular perspective. Lewis, Searcy, AK.
1994, pp. 37-85.
[16] S. Aliya, P. Reddanna, K. Thyagaraju, Does glutathione S-transferase Pi (GST-Pi)
a marker protein for cancer?, Mol Cell Biochem. 253 (2003) 319-327.
[17] D.M. Townsend, Y. Manevich, L. He, S. Hutchens, C. J. Pazoles, K.D. Tew,
Novel Role for Glutathione S-Transferase-P, JBC. 284 (2009). 436–445.
ACC
EPTE
D M
ANU
SCR
IPT
ACCEPTED MANUSCRIPT10
[18] L. Srinivasan, N. Mathew, T. Karunan, K. Muthuswamy, Biochemical studies on
glutathione S-transferase from the bovine filarial worm Setaria digitata, Parasitol
Res 109 (2011):213–219.
[19] H.A. Nguyen, Y.A. Bae, E.G. Lee, S.H. Kim, S.P. Diaz-Camacho, Y. Nawa, I.
Kang, Y. Kong, A novel sigma-like glutathione transferase of Taenia solium
metacestode, Int. J. Parasitol. 40 (2010) 1097–1106.
[20] T. Fang, D.F. Li, N.Y. Zhou, Identification and clarification of the role of key
active site residues in bacterial glutathione S-transferase zeta/maleylpyruvate
isomerase, Biochem Biophys Res Commun. 410 (2011) 452-456.
[21] P.A. Adams, C.N.T. Sikakana, Factors affecting the inactivation of human
placental glutathione S-transferase π: The kinetic mechanism and pH-dependence
of solvational and 1-chloro-2,4-dinitrobenzene-mediated inactivation of the
enzyme, Biochem. Pharmacol. 39 (1990) 1883-1889.
[22] A. Grammou, C. Papadimitriou, P. Samaras, E. Vasara, A. I. Papadopoulos, Effect
of municipal waste water effluent upon the expression of Glutathione S-
transferase isoenzymes of brine shrimp Artemia, Chemosphere, 84 (2011)
105-109.
[23] J.M. Goodrich, N. Basu, Variants of glutathione s-transferase pi 1 exhibit
differential enzymatic activity and inhibition by heavy metals, Toxicol. in Vitro.
26 (2012) 630-635.
[24] M.S. Stoelting, R. S. Tjeerdema, Glutathione-dependent biotransformation of 1-
chloro-2,4-dinitrobenzene in arterial and venous blood of the striped bass
(Morone saxitilis), Aquat Toxicol.50 (2000) 177–187.
[25] S. M. Valles, O.P. Perera, C.A. Strong, Purification, biochemical characterization,
and cDNA cloning of a glutathione S-transferase from the red imported fire ant,
Solenopsis invicta, Insect Biochem Mol Biol. 33 (2003) 981–988.
[26] I. Zibaee, A.R. Bandani, S. Haghani, A. Zibaee, Partial characterization of
glutathione s-transferase in two populations of the sunnpest, eurygaster
integricepsputon(heteroptera: scutellaridae), Mun. Ent. Zool. 4 (2009) 564-571.
[27] C.M.A Brett, A.M. Oliveira-Brett, Cyclic voltammetry and linear sweep
techniques., in Electrochemistry. Principles, methods and applications., Oxford
University Press, UK. 1993 pp. 174-198.
[28] T.A. Enache, A.M. Oliveira-Brett, Peptide methionine sulfoxide reductase A
(MsrA): direct electrochemical oxidation on carbon electrodes,
Bioelectrochemistry. 89 (2013) 11-8.
[29] V.C. Diculescu, A.-M. Chiorcea-Paquim, R. Eritja, A.M. Oliveira-Brett,
Evaluation of the structure-activity relationship of thrombin with thrombin
binding aptamers by voltammetry and atomic force microscopy. J. Electroanal.
Chem. 656 (2011) 159–166.
[30] S.C.B. Oliveira, I.B. Santarino, A.M. Oliveira-Brett, Direct Electrochemistry of
Native and Denatured Anticancer Antibody Rituximab at a Glassy Carbon
Electrode, Electroanalysis. 25 (2013) 1029–1034.
[31] T.A. Enache, A.M. Oliveira-Brett., Boron doped diamond and glassy carbon
electrodes comparative study of the oxidation behaviour of cysteine and
methionine., Bioelectrochemistry. 81 (2011) 46-52.
[32] E.M. Van der Aar, T. Bouwman, J.N.M. Commandeur, N.P.E. Vermeulen,
Structure–activity relationships for chemical and glutathione S-transferase-
catalysed glutathione conjugation reactions of a series of 2-substituted 1-chloro-4-
nitrobenzenes, Biochem. J. 320 (1996) 531–540.

ACC
EPTE
D M
ANU
SCR
IPT
ACCEPTED MANUSCRIPT11
[33] J.M. Berg, J.L. Tymoczko, L. Stryer, The Michaelis-Menten Model Accounts for
the Kinetic Properties of Many Enzymes, in Biochemistry. 5th ed. W H Freeman,
New York, 2002.
ACC
EPTE
D M
ANU
SCR
IPT
ACCEPTED MANUSCRIPT12
Table Captions
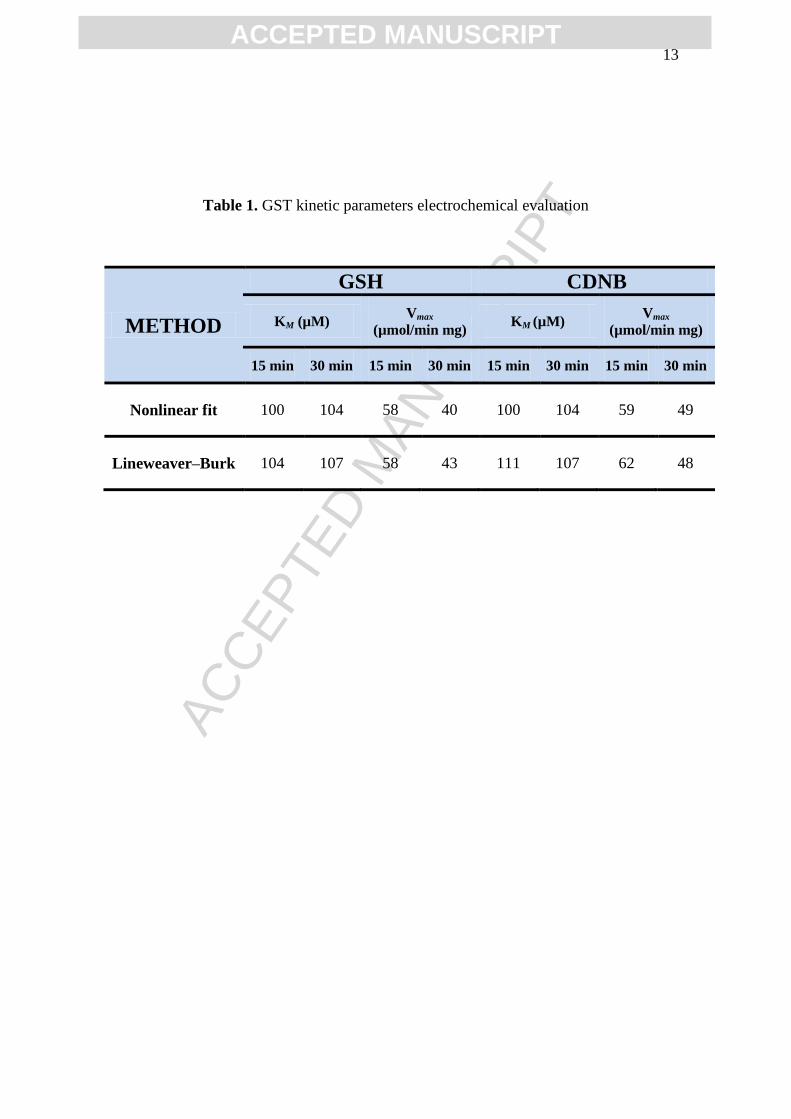
Table 1. GST kinetic parameters electrochemical evaluation
Figure Captions
Fig. 1 DP voltammograms baseline corrected in 0.1 M phosphate buffer pH = 6.5 after
1 hour incubation period: (▬) 50 µM GSH, () 50 µM GSH + 50 ng GST, and
() 50 µM GSH + 50 µM CDNB; and after 12 hours incubation period
() in 50 µM GSH + 50 µM CDNB + 50 ng GST.
Fig. 2 3D plots of DP voltammograms in 50 µM GSH + 50 µM CDNB with different
GST concentration for different incubation periods.
Fig. 3 Variation of GSH: (A) Ip oxidation peak current and (B) enzyme activity for
(○) 15 and (■) 30 min incubation time of [GSH] = 50 µM with
[CDNB] = 50 µM, and m(GST) varying between 6 - 150 ng;
1 U = 1 µmol min-1
; The dotted lines represent the data fit.
Fig. 4 Plots after 15 min incubation period: (■) GSH and (○) CDNB:
(A) Lineweaver–Burk double reciplocal and (B) Michaelis–Menten reciprocal.
The dotted lines represent the data fit.
Fig. 5 Plots after 30 min incubation period: (■) GSH and (○) CDNB:
(A) Lineweaver–Burk double reciprocal and (B) Michaelis–Menten reciprocal.
The dotted lines represent the data fit.
ACC
EPTE
D M
ANU
SCR
IPT
ACCEPTED MANUSCRIPT13
Table 1. GST kinetic parameters electrochemical evaluation
METHOD
GSH CDNB
KM (µM) Vmax
(µmol/min mg) KM (µM)
Vmax
(µmol/min mg)
15 min 30 min 15 min 30 min 15 min 30 min 15 min 30 min
Nonlinear fit 100 104 58 40 100 104 59 49
Lineweaver–Burk 104 107 58 43 111 107 62 48
ACC
EPTE
D M
ANU
SCR
IPT
ACCEPTED MANUSCRIPT14
Fig. 1
ACC
EPTE
D M
ANU
SCR
IPT
ACCEPTED MANUSCRIPT15
Fig. 2
ACC
EPTE
D M
ANU
SCR
IPT
ACCEPTED MANUSCRIPT16
Fig. 3
ACC
EPTE
D M
ANU
SCR
IPT
ACCEPTED MANUSCRIPT17
Fig. 4
ACC
EPTE
D M
ANU
SCR
IPT
ACCEPTED MANUSCRIPT18
Fig. 5
ACC
EPTE
D M
ANU
SCR
IPT
ACCEPTED MANUSCRIPT19
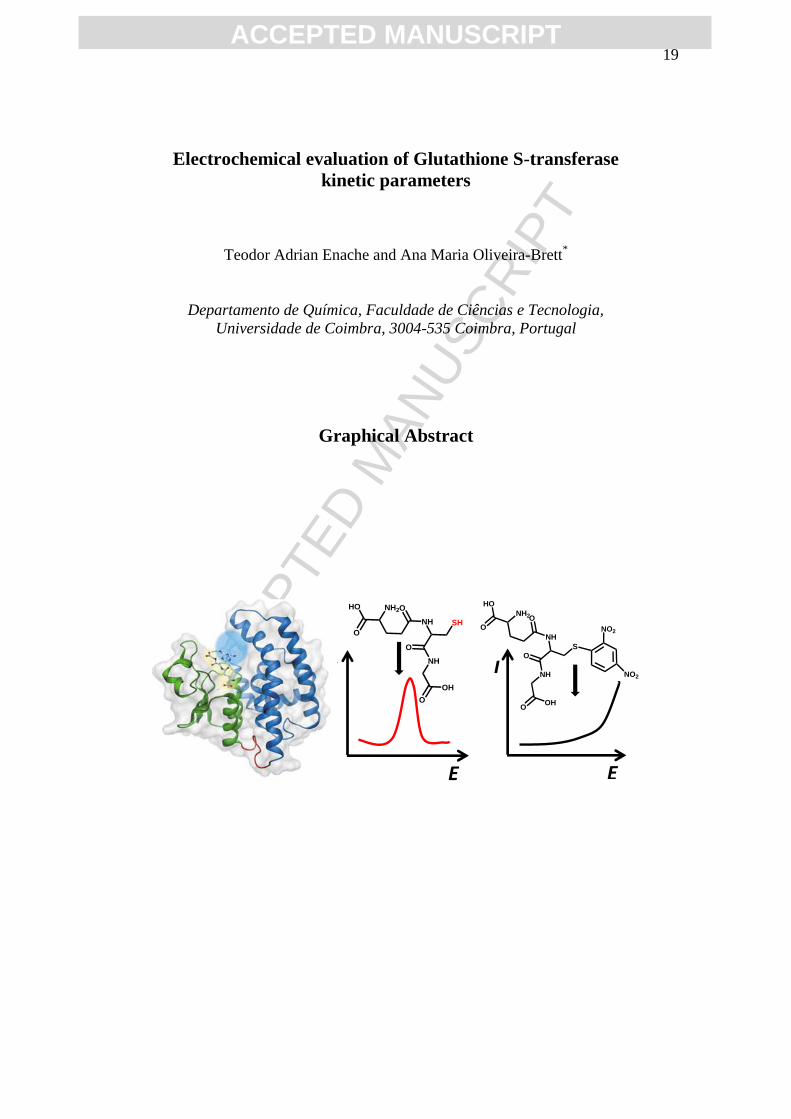
Electrochemical evaluation of Glutathione S-transferase
kinetic parameters
Teodor Adrian Enache and Ana Maria Oliveira-Brett*
Departamento de Química, Faculdade de Ciências e Tecnologia,
Universidade de Coimbra, 3004-535 Coimbra, Portugal
Graphical Abstract
I
E
O
NH
OH
O
SHNH
NH2HO
O
O
I
E
O
NH
OHO
S
NH
NH2
HO
O
O
NO2
NO2
ACC
EPTE
D M
ANU
SCR
IPT
ACCEPTED MANUSCRIPT20
Electrochemical evaluation of Glutathione S-transferase kinetic
parameters
Teodor Adrian Enache and Ana Maria Oliveira-Brett*
Departamento de Química, Faculdade de Ciências e Tecnologia, Universidade de
Coimbra, 3004-535 Coimbra, Portugal
Highlights
This work deals with GST kinetic parameters evaluation
GSH as endogenous and CDNB as xenobiotic substrates, were used
Electrochemical detection of the kinetic parameters at low enzyme concentration
Michaelis–Menten and Lineweaver–Burk plots gave a KM ~ 100 μM for either
GSH or CDNB