recycling wastewater for hydraulic fracturing by use of
TRANSCRIPT

University of Arkansas, FayettevilleScholarWorks@UARKChemical Engineering Undergraduate HonorsTheses Chemical Engineering
12-2014
Recycling wastewater for hydraulic fracturing byuse of nanofiltration membranesHaley D. CleousUniversity of Arkansas, Fayetteville
Follow this and additional works at: http://scholarworks.uark.edu/cheguht
Part of the Hydraulic Engineering Commons, Membrane Science Commons, and theNanoscience and Nanotechnology Commons
This Thesis is brought to you for free and open access by the Chemical Engineering at ScholarWorks@UARK. It has been accepted for inclusion inChemical Engineering Undergraduate Honors Theses by an authorized administrator of ScholarWorks@UARK. For more information, please [email protected], [email protected].
Recommended CitationCleous, Haley D., "Recycling wastewater for hydraulic fracturing by use of nanofiltration membranes" (2014). Chemical EngineeringUndergraduate Honors Theses. 108.http://scholarworks.uark.edu/cheguht/108

Recycling Produced Water for Hydraulic Fracturing using Nanofiltration Membranes
An Undergraduate Honors College Thesis
in the
Ralph E. Martin Department of Chemical Engineering College of Engineering University of Arkansas
Fayetteville, AR
by Haley Cleous
12/5/2014

3
Table of Contents
Introduction ................................................................................................................ 4 Hydraulic Fracturing Process ............................................................................................................................... 4 Water Treatment ........................................................................................................................................................ 4 Water Characteristics ............................................................................................................................................... 5 Nanofiltration .............................................................................................................................................................. 6 Materials and Methods ............................................................................................... 7 Commercial Nanofiltration Membranes .......................................................................................................... 7 Membrane Rejection ................................................................................................................................................ 8 Membrane Titration .............................................................................................................................................. 10 Evapoporometry ..................................................................................................................................................... 10 Results and Discussion ............................................................................................... 12 Rejection ..................................................................................................................................................................... 12 Charge .......................................................................................................................................................................... 13 Pore Sizes ................................................................................................................................................................... 14 Economics .................................................................................................................................................................. 15 Conclusions and Recommendations ........................................................................... 17
References ................................................................................................................. 19
Appendix ................................................................................................................... 21
4
Introduction
Hydraulic Fracturing Process
Hydraulic fracturing has become a controversial topic in the United States
with the natural gas boom in recent years. Previously unattainable reserves of shale
gas are now accessible due to horizontal drilling. Hydraulic fracturing accompanies
horizontal drilling to maximize the extraction of natural gas and oil from fissures in
the rock.
Hydraulic fracturing occurs after a well has been drilled but before it begins
producing fuel. A mixture of fluids including water, sand, and chemicals are pumped
into the well under extremely high pressures. The fluids open ore enlarge fractures
in the rock. This maximizes the extraction possible of the underground resources.
Each well requires approximately 5 million gallons of water. Up to 80% of this water
may return to the ground’s surface over the lifetime of the well. [1] The water returns
to the surface heavily contaminated and is ineligible for direct discharge to surface
water bodies. Water contamination by fossil fuel production is not a new problem.
Globally, approximately 15-‐18 billion m3 of freshwater is contaminated in
correlation with fuel production. [2] Unconventional extraction methods such as
fracking require more water than conventional methods.
Water Treatment
The water that returns to the surface from hydraulic fracturing wells must be
treated or disposed of in Class II injection wells. Disposal to injection wells, although
5
viewed as the simplest solution, is harmful to the environment. The carbon dioxide
emissions from trucks driving the massive amounts of water from the well site to
the disposal well can add up to 8,000 tons per year. [3] Water treatment and reuse is
a far superior alternative to deep well injection.
The extent that water must be treated depends on what it is used for. Water
can be recycled and used for future hydraulic fracturing wells, irrigation, livestock
or wildlife watering, or industrial purposes. The water will not generally be treated
to a potable level because it is not economical. Reusing water for future hydraulic
fracturing wells is preferable and the objective of this research study.
Water Characteristics
Water returned from a hydraulic fracturing well contains three categories of
containments: organics, suspended solids, and dissolved solids. The water
characteristics and concentrations vary widely based on well location and time. The
water returned is divided into two categories: flowback and produced water.
Flowback is the term for water that comes up 10-‐14 days after fracking,
before gas production. The water characteristics are related to the chemicals used
in hydraulic fracturing and the containments are in low concentrations.
Produced water is the water that comes up accompanying gas production for
the duration of the well. This may be up to 40 years, or however long the well is in
service. The volume of water increases with time and can range from two to ten
barrels per day. [4] The water characteristics are related to the geochemistry of the
formation and the containments are in high concentrations. For this research,
produced water was used because it is the more difficult target for treatment.

6
It was determined that the containments with the highest concentrations and
the most significance in produced water are sodium and calcium. Table 1 displays
concentrations of these two minerals in waters tested in our lab.
Table 1: Major Ion Concentration in Produced Water
Sodium (ppm) Calcium (ppm) TX 50,000 16,000 OK 43,000 8,100 UT 17,200 113 ND 18,200 8,700
Salinity may range from 1,500 – 205,000 ppm depending on the location,
with the Marcellus, Barnett, and Haynesville shale locations always greater than
40,000 ppm. [5] This is higher than the concentration of seawater, which has a
salinity of 35,000 ppm. Although the concentration of sodium is very high, there are
not major impacts on the frac fluid performance due to sodium reported. Therefore,
it can be assumed that sodium removal is not a top priority in order to reuse water
in hydraulic fracturing.
Calcium may be found in concentrations ranging from 454 – 23,500 ppm. [6]
Calcium and magnesium cause scale, which impacts frac fluid performance by
interfering with breakers. Concentrations of these contaminants should be reduced
to less than 2,000 ppm in order to reuse produced water in future hydraulic
fracturing wells. [7]
Nanofiltration

7
Nanofiltration (NF) membranes are ideal for treatment of produced water for
hydraulic fracturing because they are designed to remove divalent ions but not
monovalent ions. Like ultrafiltration (UF), microfiltration (MF), and reverse osmosis
(RO), NF uses pressure as a driving force to push water across the membrane.
Membranes are often thought of as dense, but unlike reverse osmosis (RO)
membranes there are small pores that allow components to pass through. Small
monovalent ions travel through the pores or diffuse across the membrane with the
water, but anything too large is rejected. Operating pressures and costs are lower
for nanofiltration than reverse osmosis.
Nanofiltration is used as a secondary treatment step to remove the dissolved
components in the water. It is not a good target to remove organics and suspended
solids because they would cause fouling on the membrane surface. Fouling reduces
flux and requires replacement membranes more frequently. A primary treatment
step to remove organics and suspended solids is required before the water can be
sent to a nanofiltration membrane. The pretreatment step used in this study was UF.
Materials and Methods
Commercial Nanofiltration Membranes
Five commercial Sepro Membranes were obtained from ULTURA Water. NF
membranes are asymmetric in design, with a porous support structure and a dense
top layer that controls separation. The active layer of the membranes is made of
trimesoyl chloride and piperazine chemistry. The reaction is depicted in Figure 1.

8
Each membrane had an unknown ratio of TMC and PIP, which changes the number
and size of the pores. Additionally, unknown additives were added to some of the
membranes to change the hydrophobicity and surface characteristics.
Figure 1: Trimesoyl chloride and piperazine chemical reaction.
Membrane Rejection
These membranes were tested using simulated fracking water and produced
fracking water obtained from a frac site in Texas. A lab scale, cross-‐flow membrane
filtration system was used for the experiments. Figure 2 displays the experimental
apparatus. Figure 3 is a photograph of the Osmonics unit used in the experiments.
Membranes were loaded one at a time into the filtration cell. Pressure was set and
water was recycled through the system until steady state was achieved. At steady
state, approximately 5 mL of permeate was collected. Samples were analyzed for
calcium and sodium using ion-‐selective electrodes. Probes were used according to
the procedure in the user manual. A calibration curve was created each time probes
were used to ensure accuracy.

9
Figure 2: Nanofiltration cell experimental apparatus.
Figure 3: Photograph of NF membrane cell.
Permeate
Retentate
Feed Feed Tank
Feed Pump NF Membrane Cell

10
Membrane Titration
In order to determine the charge on the commercial membranes, a titration
was carried out. The titration procedure used loosely follows that of Schaep
published in 2001. First, the amount of negative charge was tested. Solutions of 0.1
M NaCl and 0.1 M MgCl were prepared. Samples of 3 cm by 3 cm were cut from each
of the Sepro membranes. Samples were immersed in 50 mL of the NaCl solution for
one hour so that all original counter-‐ions are replaced with sodium. Membrane
samples were removed from the solution and rinsed thoroughly with demineralized
water. Next, samples were immersed in 50 mL of the MgCl solution for one hour. It
is assumed that after one hour the magnesium ions replaced the sodium ions. The
solution was then tested for sodium concentration using atomic absorption
spectroscopy (AA). The concentration of sodium ions is translated into equivalents
per square meter of membrane area. This is the amount of negative charge on the
membrane.
Second, the amount of positive charge was tested. The same procedure was
used as that for negative charge except that NaCl and Na2SO4 were used. A chloride
electrode was used to determine the amount of charge instead of AA.
Evapoporometry
Evapoporometry was used to determine the pore sizes of each commercial
membrane. Figure 4 shows the experimental apparatus. This apparatus exactly
matches that of Mirriam et. al.[8] A circular section of membrane was placed in a
diffusion chamber and edges were sealed tightly. This apparatus was placed on an
11
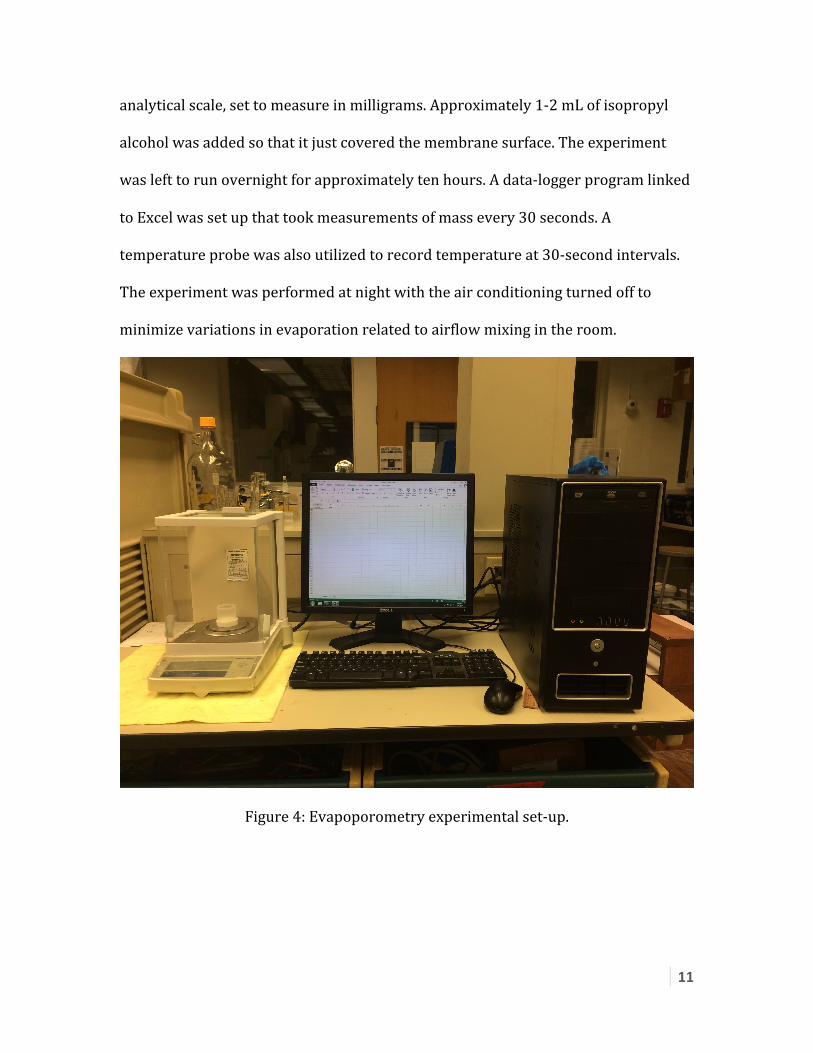
analytical scale, set to measure in milligrams. Approximately 1-‐2 mL of isopropyl
alcohol was added so that it just covered the membrane surface. The experiment
was left to run overnight for approximately ten hours. A data-‐logger program linked
to Excel was set up that took measurements of mass every 30 seconds. A
temperature probe was also utilized to record temperature at 30-‐second intervals.
The experiment was performed at night with the air conditioning turned off to
minimize variations in evaporation related to airflow mixing in the room.
Figure 4: Evapoporometry experimental set-‐up.

12
Results and Discussion
Rejection
The objective of this experiment was to have the highest possible rejection of
calcium and the lowest possible rejection of sodium. Of the five membranes tested,
NF3A best met this objective with a 69.8% rejection of calcium and a 4% rejection of
sodium at 700 psi. Unfortunately this rejection of calcium is not enough to reduce
TX water from 16,000 ppm to <2,000 ppm in one pass. It is desired to improve the
membrane performance to 90% calcium rejection.
Figure 5: Calcium rejection at pressures ranging from 250 to 800 psi.
0.0
10.0
20.0
30.0
40.0
50.0
60.0
70.0
80.0
250 400 600 700 800
Rejec0on
%
Pressure psi
RejecPon of Calcium for Ultrua NF Membranes (TX Water)
NF3A NF3.1A NF2A NF6 XN45

13
Figure 6: Sodium rejection at pressures ranging from 250 to 800 psi.
Charge
Results from membrane titrations show that the amount of charge on the
membranes is very low but quantifiable. When determining the amount of negative
charge, the atomic absorption standards used were between zero and 500 ppm.
Results showed values that were approximately zero. It is assumed that there is a
slight charge, but results from the test are not conclusive. In order to get a better
estimate about the amount of negative charge, samples should be analyzed using a
different AA procedure and standards an order of magnitude smaller. When
measuring positive charge, smaller standards were used. All five commercial
membranes were found to have a positive charge in the range of 2.72 to 3.11 milli-‐
equivalents per square meter.
0.0
5.0
10.0
15.0
20.0
25.0
30.0
35.0
250 400 600 700 800
Rejec0on
%
Pressure psi
RejecPon of Sodium for Ultura NF Membranes (TX Water)
NF3A NF3.1A NF2A NF6 XN45

14
Table 2: Positive charge on nanofiltration membranes.
Sample Cl Concentration (ppm) Charge (meq/m^2) NF2A 1.901446772 2.979857032 NF3A 1.739199417 2.725590686 NF3.1A 1.818514536 2.849889572 NF6 1.739199417 2.725590686 XN4 1.988161082 3.115751578
Pore Sizes
Evapoporometry relates evaporation rate, W (measured in the experiment)
to vapor pressure, P using the Irving Langmuir’s Equation.
𝑊 = (𝑃! − 𝑃!)!
!!"# (1)
The vapor pressure can then be used in the Kelvin Equation to solve for the
pore radius, r.[9]
𝑙𝑛 !!!= − ! ! !
! ! ! !"#! (2)
The evaporation rate was fairly constant initially, dropped suddenly, and
then went to zero. Figure 6 shows the evaporation rate curve for one of the
evapoporometry runs performed. Using this evaporation curve, pore sizes can be
determined.
It was assumed that only results below 15 nanometers are actually pores in
the membrane. Evapoporometry has been proven down to a minimum size of two
nanometers, however it has been stated that this technique can be used for all
nanofiltration membranes. Therefore, histograms were created for each NF
membrane of the pore size distribution from 1-‐15 nm. The histograms are located in
the Appendix.

15
Figure 7: Evaporation rate curve from sample evapoporometry experiment.
Results were summarized in percent of pores at or below two nanometers
and compared to rejection in Table 3. Results show that when there are to many
small pores, the sodium is rejected. When there are larger pores there is not enough
calcium rejected. The best membrane from this study, NF3A had 63% of pores in the
range of two nm or less.
Table 3: Correlation between percent of pores below 2nm and rejection of Na & Ca.
Membrane % of Pores at or Below 2 nm
Na Rejection at 700 psi
Ca Rejection at 700 psi
NF2A 68.94 % 29.2 % 29.2 % NF3A 63.35 % 4.00 % 69.8 % NF3.1A 44.53 % 21.1 % 63.6 % NF6 41.06 % 11.3 % 7.10 % XN45 43.16 % 16.2 % 20.2 %
Economics
Fracking companies spend approximately $5 per barrel for disposal to deep
well injection. Of the $5, $2 is spent on injecting the water into the ground and $3 is
-‐1E-‐07
0
0.0000001
0.0000002
0.0000003
0.0000004
0.0000005
0.0000006
0.0000007
0 10000 20000 30000 40000 50000 60000 70000
Evaporation Rate (m
ol/s)
Time (sec)
Evapoporometry Evaporation Rate -‐ NF3A 10-‐13-‐14

16
spent on transportation. In order for companies to consider treating water, the
treatment cost must be less than the cost for injection. NF is desirable because
treatment costs are only $1.31 per barrel compared to RO, which costs $4.28 per
barrel.
The high sodium concentration is the reason it is not economical to treat
produced water to a potable level. If one had to remove all of the sodium, treatment
technologies would be limited to reverse osmosis, evaporation, or distillation. These
options require either high pressure or temperatures, which make them more
expensive.
The main determination of treatment cost is the water recovery attainable. In
order to calculate treatment cost, the water recovered by NF and RO membranes
was estimated using the Van’t Hoff Equation.
∆𝜋 = 𝑖𝐶𝑅𝑇 (3)
The Van’t Hoff equation is intended for dilute ion concentrations, but with
high concentrations it is an appropriate estimation. This equation uses only the
molar concentration of the species removed to calculate an osmotic pressure. The
osmotic pressure must be overcome in order for permeate to penetrate the
membrane. Table 4 displays the theoretical water recovery for RO and NF based on
the concentrations of sodium and calcium measured in the lab. Water recovery is
the amount of water that can be reused. All water that is not recovered still has to be
disposed of by deep well injection. RO is not an applicable treatment for produced
water because the osmotic pressure is sometimes so large that normal operating

17
pressures cannot overcome it to generate clean water. NF, however, has water
recoveries ranging from 86 – 98%.
Table 4: Theoretical water recoveries of produced water by RO and NF.
Maximum Water Recoveries
RO -‐ 99.9 % Rejection of Ca & Na -‐ 1,500
psi
High Pressure RO -‐ 99.9 % Rejection of Ca & Na -‐ 3,000 psi
NF -‐ 67% Rejection of Ca & 5%
Rejection of Na -‐ 700 psi
NF -‐ 67% Rejection of Ca & 5%
Rejection of Na -‐ 1,500 psi
TX Water 0% 25% 86% 88% OK Water 0% 42% 90% 92% ND Water 35% 70% 86% 90% UT Water 55% 80% 97% 98%
When calculating treatment costs, the following assumptions were made.
Pretreatment cost before the water reaches NF or RO is $0.50 per barrel. RO and NF
treatment costs are based on calculations from Al-‐Sahali et. al. It is assumed that NF
cost is approximately the same as RO except that NF membranes are approximately
double the cost of RO membranes due to demand. A water recovery of 25% for RO
and 86% for NF was selected based on the Texas water concentrations.
Conclusions and Recommendations
It is concluded that the treatment and reuse of produced water from
hydraulic fracturing has both environmental and economic advantages. Treatment
requires a primary step to remove organics and suspended solids. Nanofiltration
membranes remove divalent ions but retain monovalent ions. The result is lower
osmotic pressures and higher water recoveries.

18
Of the commercial membranes tested, NF3A had the optimum separation,
rejecting 4% sodium and 69.8% calcium. This rejection is promising, however in
order to reduce ion concentrations below the goal for reuse a membrane with 90%
calcium rejection is desired. For future research optimizing membranes, it was
necessary to characterize the membranes tested. Membranes were tested for charge
and pore size. It was determined that membranes have a low but quantifiable
surface charge. Pore size ranged from 1-‐15 nm. The optimum membrane has a high
concentration of pores at or below 2 nm and few pores in the 6-‐7 nm range. It is
recommended that future experiments include creating and testing charged
membranes and comparing to the ones used in this study. It is also recommended
that a membrane be created with fewer defects and more pores of the optimum size
to reject calcium.

19
References
[1] "Hydraulic Fracturing Study Fact Sheet." Epa.gov. US Environmental
Protection Agency, June 2010. Web. 4 Apr. 2014.
[2] "Water and Energy Facts and Figures." The United Nations World Water
Development Report 2014 (n.d.): n. pag. Unesco.org. United Nations
Educational Scientific and Cultural Organization, 2014. Web. 29 Nov. 2014.
[3] Ely, John W., Aaron Horn, Robbie Cathey, Michael Fraim, Dr., and Sanjeev
Jakhete. "Game Changing Technology for Treating and Recycling Frac Water."
Society of Petroleum Engineers PP SPE.145454 (2011): n. pag.
[4] Hammer, Rebecca, and Jeanne VanBriesen, Ph.D, PE. “In Fracking's Wake:
New Rules Are Needed to Protect Our Health and Environment from
Contaminated Wastewater” Natural Resources Defence Council, 2012.
[5] Dahlen Journal of Environmental Hydrology, 2013
[6] Miller, Daniel J., Xiaofei Huang, Hua Li, Sirirat Kasemset, Albert Lee, Dileep
Agnihotri, Thomas Hayes, Donald R. Paul, and Benny D. Freeman. "Fouling-‐
resistant Membranes for the Treatment of Flowback Water from Hydraulic
Shale Fracturing: A Pilot Study." Journal of Membrane Science 437 (2013):
265-‐75.
[7] Katie Guerra, US Bureau of Reclamation.
[8] Merriam, Lauren, Alex Moix, Robert Beitle, and Jamie Hestekin. "Carbon
Dioxide Gas Delivery to Thin-‐film Aqueous Systems via Hollow Fiber
Membranes." Chemical Engineering Journal 253 (2014): 165-‐73.

20
[9] Krantz, William B., Alan R. Greenberg, Elmira Kujundzic, Adrian Yeo, and
Seyed S. Hosseini. "Evapoporometry: A Novel Technique for Determining the
Pore-‐size Distribution of Membranes." Journal of Membrane Science 438
(2013): 153-‐66.
[10] Al-‐Sahali, Mohamad, and Samar Al-‐Qattan. "Performance Analysis of Small
Capacity Reverse Osmosis Desalination Plants." Kuwait J. Science Engineering
39.2B (2012): 231-‐53.
[11] Schaep, Johan, and Carlo Vandecasteele. "Evaluating the Charge of
Nanofiltration Membranes." Journal of Membrane Science 188.1 (2001): 129-‐
36.

21
Appendix
0%
10%
20%
30%
40%
50%
60%
0.5 1 1.5 2 2.5 3 4 5 6 7 8 9 10 11 12 13 14 15
Percent of Pores
Pore Diameter (nm)
NF2A Pore Size Distribution
0%
5%
10%
15%
20%
25%
30%
35%
40%
0.5 1 1.5 2 2.5 3 4 5 6 7 8 9 10 11 12 13 14 15
Percent of Pores
Pore Diameter (nm)
NF3A Pore Size Distribution

22
0%
5%
10%
15%
20%
25%
30%
35%
0.5 1 1.5 2 2.5 3 4 5 6 7 8 9 10 11 12 13 14 15
Percent of Pores
Pore Diameter (nm)
NF3.1A Pore Size Distribution
0%
5%
10%
15%
20%
25%
30%
35%
0.5 1 1.5 2 2.5 3 4 5 6 7 8 9 10 11 12 13 14 15
Percent of Pores
Pore Diameter (nm)
NF6 Pore Size Distribution

23
0%
5%
10%
15%
20%
25%
30%
35%
40%
0.5 1 1.5 2 2.5 3 4 5 6 7 8 9 10 11 12 13 14 15
Percent of Pores
Pore Diameter (nm)
XN45 Pore Size Distribution