reconciling work and family: issues and policies in japan · reconciling work and family: issues...
TRANSCRIPT
INTERNATIONAL LABOUR OFFICE – GENEVA
Conditions of Work and Employment Series No. 5 Conditions of Work and Employment Programme
Reconciling work and family: Issues and policies in Japan
Masahiro Abe Dokkyo University Chizuka Hamamoto Daito Bunka University Shigeto Tanaka Tohoku University

Copyright © International Labour Organization 2003 Publications of the International Labour Office enjoy copyright under Protocol 2 of the Universal Copyright Convention. Nevertheless, shortexcerpts from them may be reproduced without authorization, on condition that the source is indicated. For rights of reproduction ortranslation, application should be made to the Publications Bureau (Rights and Permissions), International Labour Office, CH-1211 Geneva 22, Switzerland. The International Labour Office welcomes such applications. Libraries, institutions and other users registered in the United Kingdom with the Copyright Licensing Agency, 90 Tottenham Court Road,London W1T 4LP [Fax: (+44) (0)20 7631 5500; email: [email protected]], in the United States with the Copyright Clearance Center, 222Rosewood Drive, Danvers, MA 01923 [Fax: (+1) (978) 750 4470; email: [email protected]] or in other countries with associatedReproduction Rights Organizations, may make photocopies in accordance with the licences issued to them for this purpose.
ISBN 92-2-114265-5 (softcover) ISBN 92-2-114266-3 (.pdf version)
First published 2003
Cover: DTP/Design Unit, ILO
The designations employed in ILO publications, which are in conformity with United Nations practice, and the presentation of materialtherein do not imply the expression of any opinion whatsoever on the part of the International Labour Office concerning the legal status ofany country, area or territory or of its authorities, or concerning the delimitation of its frontiers. The responsibility for opinions expressed in signed articles, studies and other contributions rests solely with their authors, and publicationdoes not constitute an endorsement by the International Labour Office of the opinions expressed in them. Reference to names of firms and commercial products and processes does not imply their endorsement by the International Labour Office,and any failure to mention a particular firm, commercial product or process is not a sign of disapproval. ILO publications can be obtained through major booksellers or ILO local offices in many countries, or direct from ILO Publications,International Labour Office, CH-1211 Geneva 22, Switzerland. Catalogues or lists of new publications are available free of charge from theabove address, or by email: [email protected] Visit our website: www.ilo.org/publns
Printed by the International Labour Office, Geneva, Switzerland

Conditions of Work and Employment Series No. 5 iii
Contents
Page
Preface .............................................................................................................................................. ix
Overview........................................................................................................................................... 1
I. Introduction and context ............................................................................................................. 3 Outline..................................................................................................................................... 3 The socio-economic context.................................................................................................... 3
The general economic context....................................................................................... 3 The bursting of the bubble economy............................................................................. 4 Economic globalization................................................................................................. 6 The influence of information and communications technology.................................... 7 The ageing population................................................................................................... 8
The employment context ......................................................................................................... 8 The employment context in the 1990s .......................................................................... 8 The rising unemployment rate ...................................................................................... 10 Changes in the external and internal labour markets .................................................... 11 Administrative reform and privatization ....................................................................... 13 Poverty level.................................................................................................................. 13 The economic context of fatherless households............................................................ 14 Employment context of fatherless households.............................................................. 16 Education ...................................................................................................................... 17 Industrial relations......................................................................................................... 18 Labour law .................................................................................................................... 18
II. Family trends: The implications for work of changing family needs .................................... 21 Trends in the family and family responsibilities ..................................................................... 21
Concepts related to “family” in administrative terms ................................................... 21 Life cycle....................................................................................................................... 22 Household composition................................................................................................. 26 Industry and employment.............................................................................................. 28 Distance between home and workplace ........................................................................ 31 Use of time .................................................................................................................... 33
Implications of trends for the capacity of workers to meet their family and work responsibilities......................................................................................................................... 36
Decline of home-based business ................................................................................... 36 Less support by grandparents........................................................................................ 37 Emergence of nursing-care needs ................................................................................. 37 Inefficiency due to the male-exemption rule................................................................. 37 What kind of family are in the greatest need of support ............................................... 38
iv Conditions of Work and Employment Series No. 5
Page
III. Working conditions and family support measures: Their impact on family....................... 41 Time-related family support .................................................................................................... 41
Working hours: Facts and policies ................................................................................ 42 Changes in total annual working hours............................................................... 42 Changes in working hours by industry ............................................................... 43 The problem of non-scheduled working hours and overtime rates..................... 43 The problem of “service overtime”..................................................................... 46 Flexible working hours ....................................................................................... 46 The annual paid holiday system.......................................................................... 47 Provision rates for annual paid holidays............................................................. 48 Taking of annual paid holidays........................................................................... 48
Working hours and private life for men and women..................................................... 51 The trade-off between working hours and private time...................................... 51 The increase in non-marriage.............................................................................. 52 Men’s participation in housework ...................................................................... 53 Part-timers and their employment conditions ..................................................... 54 Division of labour within the family and society’s role...................................... 56
The Child-care Leave Law and its effects..................................................................... 57 Rates of taking, and the effectiveness of, child-care leave ................................. 57
Family-care leave and nursing care insurance .............................................................. 58 The Japanese government’s plan of action ................................................................... 59
Employment arrangements...................................................................................................... 60 Changes in numbers of self-employed and family-employed workers ......................... 60 Estimated number of teleworkers.................................................................................. 61 Telework employment conditions................................................................................. 62
Welfare facilities and financial compensation for the cost of family responsibilities............. 62 Developing measures in Japan to assist family responsibilities.................................... 62 Financial compensation................................................................................................. 65
The child allowance ............................................................................................ 65 Deduction for dependents ................................................................................... 66 Child rearing allowance ...................................................................................... 66
Child-care services ........................................................................................................ 67 Child-care centres ............................................................................................... 67 Changes in measures toward day-care centres.................................................... 68 Day-care charges................................................................................................. 69 Present status of day-care facilities in Japan....................................................... 70 Kindergartens...................................................................................................... 72 After-school child care........................................................................................ 73 Family support centres........................................................................................ 74

Conditions of Work and Employment Series No. 5 v
Page
IV. What is missing? The gap between work-family needs and work-family support.............. 75 The value given to work-family support by employers and workers ...................................... 75 The impact of work-family support on work and on families ................................................. 79
Core workers ................................................................................................................. 79 Non-core workers.......................................................................................................... 80 Female professionals..................................................................................................... 80 Local divergence ........................................................................................................... 81 Implications................................................................................................................... 81
Filling the work-family gaps: Effective sharing of support .................................................... 82 Recent debates on work-family support........................................................................ 82 “Who” (family, company, community or government) would be most effective in bearing the burden and how the different measures are linked..................................... 82
IV. Overview of the major issues.................................................................................................... 85 Work-family implications of the lifecycle from a family perspective .................................... 85 Implications of the changing nature of work on the family .................................................... 86 Efficiency and effectiveness in achieving a work-family balance .......................................... 86 Gender impact of work-family measures ................................................................................ 88 Work-family measures and the poverty of families ................................................................ 88
V. Summary and conclusions.......................................................................................................... 91 Summary ................................................................................................................................. 91 Recommendations ................................................................................................................... 92
Increased efforts towards further reduction of working hours ...................................... 92 Rapid elimination of the wage gap between men and women ...................................... 92 Quick resolution of various issues concerning part-time workers ................................ 93 Efforts to heighten public awareness of work-family policies...................................... 93 Comprehensive measures to assist economically disadvantaged families .................... 93 Spurring on economic growth with a view to lowering the unemployment rate .......... 94
Bibliography..................................................................................................................................... 95

vi Conditions of Work and Employment Series No. 5
List of figures
Page
Figure 1-1. GDP at constant price and its growth rate (at market prices in 1995) ............................ 4 Figure 1-2. Land and stock prices...................................................................................................... 5 Figure 1-3. Numbers of bankruptcies and total debts........................................................................ 6 Figure 1-4. Balance of international payment (at market prices in 1995) ......................................... 6 Figure 1-5. Foreign direct investment (by region)............................................................................. 7 Figure 1-6. Penetration rate of information and communication technology devices ....................... 8 Figure 1-7. Numbers of workers and employees............................................................................... 9 Figure 1-8. Unemployment rate......................................................................................................... 9 Figure 1-9. Structural frictional unemployment rate and demand shortage unemployment rate....... 10 Figure 1-10. Lilien’s index ................................................................................................................ 11 Figure 1-11. Number of employees and non-regular workers........................................................... 13 Figure 1-12. Monthly income by family composition....................................................................... 14 Figure 1-13. Trends in divorce and divorce rates .............................................................................. 15 Figure 1-14. Percentage distribution of fatherless households .......................................................... 15 Figure 1-15. Advancement rate by type of school............................................................................. 17 Figure 1-16. Percentage of married women who work by age and education................................... 18 Figure 2-1. Concepts related to family in administrative terms......................................................... 22 Figure 2-2. Trends in percentage of unmarried people by age .......................................................... 24 Figure 2-3. Total fertility rate: Trends from 1950-2000 and projections until 2050 ......................... 25 Figure 2-4. Employment status by age of women and men: 2000..................................................... 30 Figure 3-1. Yearly total of working hours ......................................................................................... 41 Figure 3-2. Overtime ......................................................................................................................... 44 Figure 3-3. Variational working hours systems................................................................................. 47 Figure 3-4. Rate of unmarried persons and average age of first marriage......................................... 53 Figure 3-5. Self-employed and family workers ................................................................................. 60 Figure 3-6. Rate of start-up and closure of businesses (average) ...................................................... 61 Figure 3-7. The number of children born and total fertility rate........................................................ 63 Figure 3-8. Change in the number of day-care facilities ................................................................... 68 Figure 3-9. Change in the number of children admitted and admission capacity by age .................. 69 Figure 3-10. Monthly day-care charges by municipalities (children under 3 years of age) .............. 70 Figure 3-11. Change in the rate of nursery capacity.......................................................................... 71 Figure 3-12. The ratio of children waiting for admission.................................................................. 71 Figure 3-13. Rate of implementation of extended nursery care......................................................... 72 Figure 3-14. Rate of implementation of extended care in kindergartens........................................... 73 Figure 3-15. The number of after-school child care .......................................................................... 74

Conditions of Work and Employment Series No. 5 vii
List of tables
Page
Table 1-1. Share of employees by industry ....................................................................................... 11 Table 1-2. Changes in the rate of those wanting to change jobs (by age group) ............................... 12 Table 1-3. Distribution of income group (OECD equivalence scale: 50%) ...................................... 14 Table 1-4. Recipients of child support............................................................................................... 16 Table 1-5. Child support by number of children ............................................................................... 16 Table 1-6. Worries arising from fatherless households ..................................................................... 17 Table 1-7. Number of labour unions and organization rates ............................................................. 18 Table 2-1. Age structure of the population (percentage) ................................................................... 23 Table 2-2. People living without relatives (percentage of the whole population) ............................. 26 Table 2-3. Composition of relatives’ households .............................................................................. 27 Table 2-4. Proportion of nuclear and extended families among households including children
under 6 years of age.......................................................................................................... 27 Table 2-5. Employment status of women and men, 1950-2000 ........................................................ 29 Table 2-6. Continuity rate of full-time employment (CRFE) ............................................................ 31 Table 2-7. Changes in the place of work (percentage of employed persons) .................................... 32 Table 2-8. Time use of men and women in 1976 and 1996 (weekly average of hours per day) ....... 33 Table 2-9. Time use of wives and husbands by household type (weekly average of hours per day) 34 Table 2-10. Time use of wives and husbands with their children (weekly average of hours per
day)................................................................................................................................... 35 Table 2-11. Time use of workers by working hours.......................................................................... 39 Table 3-1. International comparison of working hours (production workers)................................... 42 Table 3-2. Working hours by industry and size................................................................................. 43 Table 3-3. Average premium rates for overtime work and its distribution ....................................... 45 Table 3-4. Number of holidays.......................................................................................................... 47 Table 3-5. Legal annual leave with pay............................................................................................. 49 Table 3-6. Circumstances of taking paid leave.................................................................................. 50 Table 3-7. Time spent per day on activities by sex (weekly average) ............................................... 52 Table 3-8. Rate of workers temporarily transferred without family to total employees.................... 55 Table 3-9. Numbers of employees and part-timers by gender........................................................... 55 Table 3-10. Hours per day and monthly labour days for part-time workers...................................... 56 Table 3-11. Hourly wages for regular workers and part-time workers (in yen) ................................ 56 Table 3-12. Return rate of mothers in Japan...................................................................................... 58 Table 3-13. Percentage of companies regulating family-care leave by industry and company size . 59 Table 3-14. Achievements of Five-Year Program on Emergency Measures for Nursery Care and
Other Related Matters ...................................................................................................... 64 Table 3-15. The new Angel Plan ....................................................................................................... 65 Table 3-16. Income restrictions ......................................................................................................... 67 Table 3-17. Monthly day-care charges set by state (2001)................................................................ 70 Table 4-1. The percentage of companies regulating child-care and family-care leave, by industry
and size of company......................................................................................................... 75 Table 4-2. Percentage of those taking child-care leave by industry and size of company ................ 76 Table 4-3. Reasons for leaving work................................................................................................. 77 Table 4-4. Percentage of men prioritizing the family........................................................................ 78 Table 4-5. What is needed for men to get involved in housework, child rearing and education....... 78 Table 4-6. On men taking child-care and family-care leave.............................................................. 79 Table 5-1. Retention of women after childbirth in Japan: Marginal effects from probit models ...... 87


Conditions of Work and Employment Series No. 5 ix
Preface
The ILO’s Conditions of Work and Employment Programme seeks to promote decent conditions of employment on the basis of international labour standards and the analysis of the policy experience in its member States. One of the key aspects of working conditions which this Programme addresses is the reconciliation of work and family life. On the one hand, how can working conditions be adapted to facilitate workers’ ability to fulfill their family responsibilities; and, on the other hand, how can the family responsibilities of men and women be lightened or made less incompatible with employment so that they are not a source of discrimination in the labour market?
Based in part on the recognition that the problems of workers with family responsibilities are part of wider issues regarding family and society and that family responsibilities can be a source of discrimination in employment, the International Labour Conference adopted a Convention on Workers with Family Responsibilities (No. 156) in 1981. The core of this Convention stipulates that the aim of national policies should be to enable persons with family responsibilities, who are engaged or wish to engage in employment, to exercise their right without being subject to discrimination and, to the extent possible, without conflict between their employment and their family responsibilities. The accompanying Recommendation on Workers with Family Responsibilities, 1981 (No. 165), provides guidance on how work-family issues can be addressed. In addition, it is important to examine how different countries actually experience and address work-family conflicts. What are countries doing to reduce conflicts between work and family? How are these measures compatible with increasing productivity in the face of global competition? What are the factors which exacerbate or reduce this conflict?
Although a considerable and growing literature exists on the nature of work-family conflicts and how they are being addressed in western industrialized countries, little is available on the experiences in other countries. As valuable lessons can be learned by examining different experiences, this paper presents the example of an Asian country: Japan. Although an industrialized country, Japan provides a very different cultural context, as reflected in its values and traditions with respect to both family and work. The paper provides considerable data tracing recent trends in the life cycle of Japanese families as well as trends related to the economy and work. It reviews recent policies concerning work and family life and, in particular, shows that legal provisions supporting work-family reconciliation are actually utilized by few workers. This is explained by social and economic constraints, such as long working hours and wage inequalities. Based on an analysis of facts and trends, the paper suggests priorities for the future.
I wish to than the authors of this paper — Masahiro Abe (Dokkyo University), Chizuka Hamamoto (Daito Bunka University) and Shigeto Tanaka (Tohoku University) — for all their efforts in preparing the study. I would also like to thank Ms. Horiuchi and her colleagues in the ILO Office in Tokyo for their support and assistance.
François Eyraud, Director,
Conditions of Work and Employment Programme. Social Protection Sector.


Conditions of Work and Employment Series No. 5 1
Overview
Since the collapse of the bubble economy of the late 1980s and early 1990s, Japan has experienced low economic growth and high unemployment. Meanwhile, the number of employed persons and employees has fallen, while the employment of irregular workers, especially part-timers, is on the rise. In the internal labour market, the ageing of employees and steep rises in labour costs have caused problems, resulting in increased employment outsourcing. On the other hand, deregulation of the external labour market has progressed, with the derestriction of employment introduction in the private sector, and of worker dispatch businesses. In such an economic context, the introduction of work-family policies in companies raises costs and is, therefore, quite likely to be shunned.
Words in modern Japanese commonly used to refer to the family are kazoku (family), katei (home) and setai (household). The most important of these in the administrative context is “household”, which is defined as “a group of people who live and make a living together”. A household is further understood to comprise two of the following factors: “family kinship”, “shared dwelling” and “shared livelihood”. As well as being the research unit for a variety of designated statistics, the household is the unit for the composition of the Basic Resident Registers, national health insurance insurants, and social welfare accreditation.
In post-war Japan, more than half the households were always two-generation households made up of parents and unmarried children, with three-generation households never amounting to more than 30 per cent of the total. Up until and throughout the 1960s the pattern of household composition remained relatively unchanged (apart from a rise in households consisting simply of a husband-and-wife couple). Since 1970, the ratio of three-generation households has fallen. If we look only at households with a child under 6 years of age, three-generation families comprised about 30 per cent up until and throughout the 1980s. Since the start of the 1990s, however, there are signs that this ratio is falling.
Changes in the life-cycle of Japanese families can be seen in such phenomena as the ageing of society, the increase of non-marriage, and the declining total fertility rate (TFR). According to the National Institute of Population and Social Security Research, the decline in the TFR will bottom out and stabilize at the start of the 21st century.
The rate of those going on to higher education is high in Japan and the rate of women going to university, in particular, has risen in the 1990s. However, the majority of married women university graduates do not pursue a career, which, from the perspective of effective utilization of labour resources, is a serious problem. Further, the labour force participation rate for women by age describes an M-shaped curve that continues to dip for marriage, childbirth and child care. Factors contributing to this are:
� the low level of economic assistance (such as allowances for dependent children and the dependency tax exemption) for families raising children;
� the shortage of child-care centres, which is particularly severe in large cities; and
� the fact that men work long hours, and participate little in housework and child care.
In 2000, total annual working hours in Japan averaged 1,859 hours, remaining longer than the government target of 1,800 hours. The rate of taking annual paid holidays was not more than 50 pre cent, as it remains difficult for workers to take their allotted paid
2 Conditions of Work and Employment Series No. 5
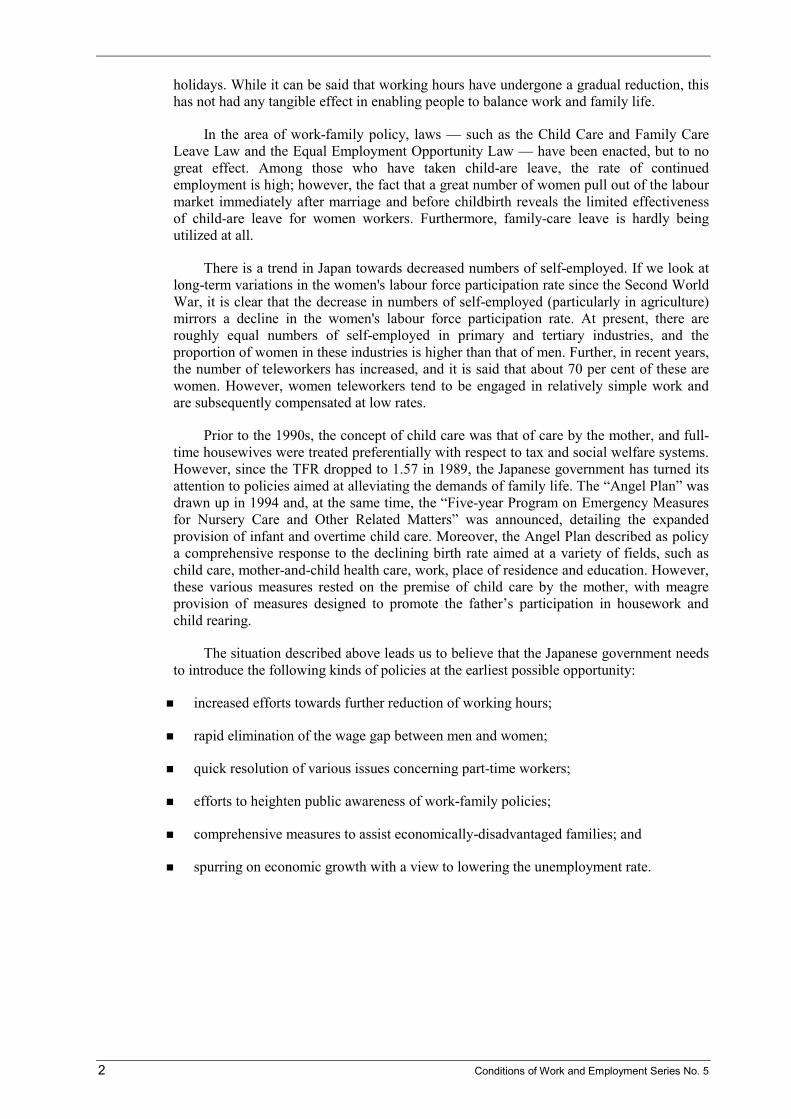
holidays. While it can be said that working hours have undergone a gradual reduction, this has not had any tangible effect in enabling people to balance work and family life.
In the area of work-family policy, laws — such as the Child Care and Family Care Leave Law and the Equal Employment Opportunity Law — have been enacted, but to no great effect. Among those who have taken child-are leave, the rate of continued employment is high; however, the fact that a great number of women pull out of the labour market immediately after marriage and before childbirth reveals the limited effectiveness of child-are leave for women workers. Furthermore, family-care leave is hardly being utilized at all.
There is a trend in Japan towards decreased numbers of self-employed. If we look at long-term variations in the women's labour force participation rate since the Second World War, it is clear that the decrease in numbers of self-employed (particularly in agriculture) mirrors a decline in the women's labour force participation rate. At present, there are roughly equal numbers of self-employed in primary and tertiary industries, and the proportion of women in these industries is higher than that of men. Further, in recent years, the number of teleworkers has increased, and it is said that about 70 per cent of these are women. However, women teleworkers tend to be engaged in relatively simple work and are subsequently compensated at low rates.
Prior to the 1990s, the concept of child care was that of care by the mother, and full-time housewives were treated preferentially with respect to tax and social welfare systems. However, since the TFR dropped to 1.57 in 1989, the Japanese government has turned its attention to policies aimed at alleviating the demands of family life. The “Angel Plan” was drawn up in 1994 and, at the same time, the “Five-year Program on Emergency Measures for Nursery Care and Other Related Matters” was announced, detailing the expanded provision of infant and overtime child care. Moreover, the Angel Plan described as policy a comprehensive response to the declining birth rate aimed at a variety of fields, such as child care, mother-and-child health care, work, place of residence and education. However, these various measures rested on the premise of child care by the mother, with meagre provision of measures designed to promote the father’s participation in housework and child rearing.
The situation described above leads us to believe that the Japanese government needs to introduce the following kinds of policies at the earliest possible opportunity:
� increased efforts towards further reduction of working hours;
� rapid elimination of the wage gap between men and women;
� quick resolution of various issues concerning part-time workers;
� efforts to heighten public awareness of work-family policies;
� comprehensive measures to assist economically-disadvantaged families; and
� spurring on economic growth with a view to lowering the unemployment rate.

Conditions of Work and Employment Series No. 5 3
I. Introduction and context
Outline
The Japanese economy has transformed such that, since the collapse of the bubble economy that developed from the late 1980s to the early 1990s, its GDP no longer achieves even 1% growth. In particular, 1998 recorded a growth rate of -0.56%, along with an unemployment rate of 5% for the first time since the Second World War. Various factors contributed to this economic situation.
� The collapse of the bubble economy and the occurrence of non-performing loans brought about a credit crunch and an increase in corporate bankruptcies.
� Economic globalization brought about not only a shift in Japan's trade structure from one of processing trade (importing raw materials and exporting manufactured goods) to international specialization, but also caused deflation resulting from the importing of low-priced goods, leading to the weeding out of non-competitive domestic corporations.
� The rapid spread of information and communications technology and equipment has had a significant effect on Japan's employment structure, particularly in the form of an increase in non-regular workers.
� In response to the ageing of society, the starting age for pension benefits has been raised from 60 to 65, and reform of medical insurance is being carried out. Accordingly, measures to secure employment for the elderly in their early 60s are being prioritized, and there is concern that this will crowd out similar measures for employment of the young.
In this environment the employment context is changing markedly, as is summarized in the four points below:
� Since the beginning of the 1990s, both the number of employed persons and the number of employees have decreased.
� The unemployment rate has reached a post-war high of 5 per cent, and the mismatch problem is assuming serious proportions.
� The deregulation of the external labour market has progressed, with the opening of job placement to the private sector and the liberalization of employee dispatch enterprises. On the other hand, in the internal labour market, a movement towards re-evaluation of the lifetime employment system and the nenkô wage profile (where wages increase with seniority) can be discerned.
� While the number of employees has decreased, the number of non-regular workers is on the rise.
The socio-economic context
The general economic context
Following the collapse of the bubble economy in the early 1990s, the Japanese economy entered into an extended period of low growth (Figure 1-1). In contrast to the
4 Conditions of Work and Employment Series No. 5
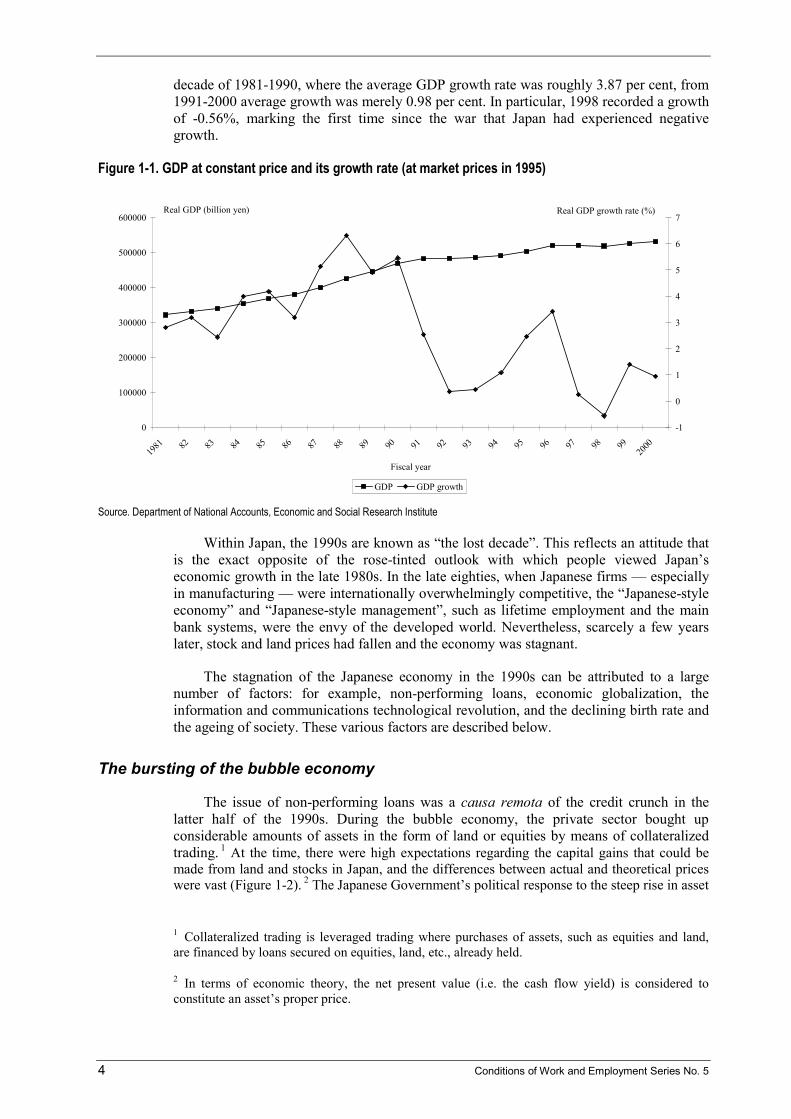
decade of 1981-1990, where the average GDP growth rate was roughly 3.87 per cent, from 1991-2000 average growth was merely 0.98 per cent. In particular, 1998 recorded a growth of -0.56%, marking the first time since the war that Japan had experienced negative growth.
Figure 1-1. GDP at constant price and its growth rate (at market prices in 1995)
0
100000
200000
300000
400000
500000
600000
1981 82 83 84 85 86 87 88 89 90 91 92 93 94 95 96 97 98 99
2000
Fiscal year
Real GDP (billion yen)
-1
0
1
2
3
4
5
6
7Real GDP growth rate (%)
GDP GDP growth
Source. Department of National Accounts, Economic and Social Research Institute
Within Japan, the 1990s are known as “the lost decade”. This reflects an attitude that is the exact opposite of the rose-tinted outlook with which people viewed Japan’s economic growth in the late 1980s. In the late eighties, when Japanese firms — especially in manufacturing — were internationally overwhelmingly competitive, the “Japanese-style economy” and “Japanese-style management”, such as lifetime employment and the main bank systems, were the envy of the developed world. Nevertheless, scarcely a few years later, stock and land prices had fallen and the economy was stagnant.
The stagnation of the Japanese economy in the 1990s can be attributed to a large number of factors: for example, non-performing loans, economic globalization, the information and communications technological revolution, and the declining birth rate and the ageing of society. These various factors are described below.
The bursting of the bubble economy
The issue of non-performing loans was a causa remota of the credit crunch in the latter half of the 1990s. During the bubble economy, the private sector bought up considerable amounts of assets in the form of land or equities by means of collateralized trading. 1 At the time, there were high expectations regarding the capital gains that could be made from land and stocks in Japan, and the differences between actual and theoretical prices were vast (Figure 1-2). 2 The Japanese Government’s political response to the steep rise in asset
1 Collateralized trading is leveraged trading where purchases of assets, such as equities and land, are financed by loans secured on equities, land, etc., already held.
2 In terms of economic theory, the net present value (i.e. the cash flow yield) is considered to constitute an asset’s proper price.

Conditions of Work and Employment Series No. 5 5
prices came in the shape of policies such as the introduction of ceilings on real estate financing and land value tax. This was partly because land prices in major cities and their surroundings far exceeded the purchasing capabilities of normal employees. This series of political actions did affect a significant decrease in land prices; however, the decline in value of assets used in collateralized trading caused a shortage of securities and many banks were left holding non-performing loans.
Figure 1-2. Land and stock prices
0
100
200
300
400
500
600
1980 1981 1982 1983 1984 1985 1986 1987 1988 1989 1990 1991 1992 1993 1994 1995 1996 1997 1998 1999 2000
Year
1980
= 1
00
Land price index (average) Land price index (6 big cities) Stock price index
Source. Bank of Japan: Bank of Japan statistics and other key statistics
Non-performing loans have continued to increase yearly as the Japanese economy has slowed down. At the end of March 2001, the total amount of bad loans (disclosed under SEC standards) held by financial institutions in Japan amounted to 43.4 trillion yen, causing serious damage to said institutions’ capital-asset ratios. Incidentally, the Bank for International Settlements (BIS) resolved in 1991 that banks with international business should maintain capital-asset ratios of over 8%; 3 however, to this end, the various financial institutions amassed reserves for non-collectible loans and controlled bank lending. This credit crunch on the part of the financial institutions led to repercussions in corporate management, particularly between 1997 and 1998, and in the midst of this, the business environment for small to middle-sized enterprises deteriorated and corporate bankruptcies followed one after the other (Figure 1-3).
3 For banks engaged only in domestic business, the figure was 4%.

6 Conditions of Work and Employment Series No. 5
Figure 1-3. Numbers of bankruptcies and total debts
0
5'000
10'000
15'000
20'000
25'000
1980 81 82 83 84 85 86 87 88 89 90 91 92 93 94 95 96 97 98 99 2000
Year
Number of bankruptcies
0
5'000'000
10'000'000
15'000'000
20'000'000
25'000'000
30'000'000Total debt (million yen)
Bankruptcies Total debt (million yen)
Source. Bank of Japan: Bank of Japan statistics and other key statistics
Economic globalization
Economic globalization also greatly affected the Japanese economy. Japan’s economy has been characterized by its importing of raw materials from abroad to process and export as manufactured goods. In particular, at times when the domestic economy has weakened, economic recovery has been achieved by “export drives” boosting exports, such has been the Japanese economy’s dependence on trade (Figure 1-4). However, industrialization throughout South-east Asia has meant that Japan’s trade structure has changed from a simple processing trade pattern to one of international specialization where highly processed intermediate commodities are imported and high value-added goods exported. At the same time, low-priced finished products are increasingly being imported, with the effect that domestic producers are being forced into fierce competition.
Figure 1-4. Balance of international payment (at market prices in 1995)
0
2000
4000
6000
8000
10000
12000
14000
16000
1981 82 83 84 85 86 87 88 89 90 91 92 93 94 95 96 97 98 99 2000
Fiscal Year
Net exports (billion yen)
0
10000
20000
30000
40000
50000
60000
70000Export, Import (billion yen)
Net exports Exports Imports Source. Bank of Japan: Bank of Japan statistics and other statistics

Conditions of Work and Employment Series No. 5 7
Consequently, Japanese producers have been increasing direct investment worldwide, starting with South-east Asia, closing their domestic production sites and moving their production bases abroad, or simply reducing the size of their domestic production base (Figure 1-5). This trend of “industrial hollowing out” (i.e. the negative effect of economic globalization on industry and employment) is a serious problem, despite the fact that this concept remains underdeveloped in economic science.
Figure 1-5. Foreign direct investment (by region)
0
10'000
20'000
30'000
40'000
50'000
60'000
70'000
80'000
90'000
100'000
89 90 91 92 93 94 95 96 97 98 99 2000
Year
FDI
OceaniaAfricaEuropeMiddle and Near EastAsiaMiddle and South AmericaNorth America
Source. Ministry of Finance: Trade statistics
Economic textbooks hold that the spread of international trade and direct investment transform the comparative advantage of national industries and promote international specialization. By this line of reasoning, it would be fair to say that it is due to the international division of labour that the Japanese economy has, until now, been enjoying the fruits of growth brought about by industrial development. Certainly, in recent years, relations with South-east Asian countries have developed along the lines of the international division of labour, and the low value-added manufacturing sector has declined; however, on the other hand, it is also true that industrial development has progressed via a shift to the high value-added sector, and that foreign direct investment in Japan concentrated on the financial, real estate and service industries has had a positive effect on the economy.
Nevertheless, insofar as there is a negative side to economic globalization, it is possible that Japan is witnessing “market failure”. In particular, it is likely that the transfer of resources from declining industries to growing industries is not taking place smoothly. As will be discussed below, at the end of the 1990s in Japan, the issue of resource transfer has given rise to the mismatch problem of human resources in the labour market. This mismatch problem is greatly aggravating the seriousness of the unemployment situation.
The influence of information and communications technology
The technological revolution that began with information and communications technology (ICT) is also having a great impact on the Japanese economy. The spread of ICT has taken place more slowly in Japan than in the United States; however, at present, computers are used in a great number of homes and workplaces (Figure 1-6). Under the former Prime Minister Mori Yoshiro, a number of policies were put into effect aimed at further spreading the use of ICT, policies which are currently having an effect. Although

8 Conditions of Work and Employment Series No. 5
ICT caused something of a boom in its early stages in the Japanese economy as in the United States, at present it does not appear to be contributing to economic recovery. In the games industry, Japan’s international competitiveness is such that it is no exaggeration to say that Japan monopolizes the international market, but the effect that this has on Japan’s macro economy is extremely limited. The effects of ICT on employment are discussed below.
Figure 1-6. Penetration rate of information and communication technology devices
0
10
20
30
40
50
60
70
80
1995 96 97 98 99 2000
Year
Penetration rate (%)
Word processor Personal computer Fax Mobile phone
Source. Ministry of Public Management, Home Affairs, Posts and Telecommunications: Communication in Japan
The ageing population
Japan’s ageing population and declining birth rate are cited as factors having a considerable impact on changes in the Japanese economic environment. Japan already boasts an elderly society, and the effects of this can be seen in, for example, the country’s funding, pension, medical and employment systems. In contrast to the United States and Western Europe, Japanese society has aged at such a rate that the political response has tended to consist of “too little too late”. Among measures taken, the starting age for receipt of the welfare pension has been raised from 60 to 65 with effect from 2003. Further, the medical insurance system was revised in 2000, increasing the financial burden on the elderly. As a result of these reforms, there have been increasing calls to secure employment for those in their early 60s, and the Government has been encouraging companies to employ the elderly by providing subsidies. However, it is likely that, by promoting the employment of older workers in the midst of low economic growth, society will be faced with the dilemma of being unable to provide employment for its youth.
The employment context
The employment context in the 1990s
The employment situation in Japan in the 1990s has undergone a great transformation along with the economy. Firstly, both the numbers of employed persons and of employees have declined. Total numbers of male and female employed were steadily increasing, but reached a peak of 65,570,000 in 1997, thereafter shrinking to 64,460,000 in 2000. Further, the total of 53,910,000 employees recorded in 1997 had decreased to 53,560,000 by 2000 (Figure 1-7). The decrease in numbers of employed persons and employees in the

Conditions of Work and Employment Series No. 5 9
manufacturing industry has been particularly big, and the number of employees affected by the unavoidable transfer of labour between industries has risen.
Figure 1-7. Numbers of workers and employees
0
1'000
2'000
3'000
4'000
5'000
6'000
7'000
1980 81 82 83 84 85 86 87 88 89 90 91 92 93 94 95 96 97 98 99 2000
Year
10 thousand persons
Total (both sexex) Employees (both sexes) Total (male)
Employees (male) Total (female) Employees (female)
Source. Ministry of Public Management, Home Affairs, Posts and Telecommunications: Labour force survey
With the decrease in numbers of employed persons and employees, the second change in Japan’s labour market has been that the unemployment rate has rocketed to a post-war high. Since the second oil shock, while unemployment rates in the United States and Western Europe were rising, Japan’s remained low. As a result, many countries took note of the performance of Japan’s labour market and its employment system (in particular, the life-time employment system and the nenkô wage profile, or the trade unions organized on a company basis). After the collapse of the bubble economy, however, the unemployment rate rose from 2.1% in 1990 to 4.1% in 2000 (Figure 1-8). In 2000, Japan had 3,200,000 unemployed.
Figure 1-8. Unemployment rate
0.0
1.0
2.0
3.0
4.0
5.0
6.0
1980 81 82 83 84 85 86 87 88 89 90 91 92 93 94 95 96 97 98 99 2000
Year
Labour force participation ratio
Male Female
Source. Ministry of Public Management, Home Affairs, Posts and Telecommunications: Labour force survey

10 Conditions of Work and Employment Series No. 5
The rising unemployment rate
The rise in the unemployment rate has been caused by a combination of several factors. It has not risen merely because economic cycles are affecting the labour market. If one separates the unemployment rate into structural and frictional unemployment and demand deficiency unemployment as in Figure 1-9, the following becomes clear. Certainly, since the collapse of the bubble economy in 1992, the demand deficiency unemployment rate has risen; however, the greater part of the unemployment rate is occupied by the structural and frictional unemployment rate. Moreover, although since 1999 the demand deficiency unemployment rate has started to drop, the structural and frictional unemployment rate has continued to rise with the result that the overall unemployment rate has not decreased. This would seem to suggest that the mismatch problem in the labour market is becoming yet more serious.
Figure 1-9. Structural frictional unemployment rate and demand shortage unemployment rate
-1.00
-
1.00
2.00
3.00
4.00
5.00
6.00
80 83 86 89 92 95 98 01
Year
%
Structural frictional Demand shortage Total unemployment rate
Source. Ministry of Public Management, Home Affairs, Posts and Telecommunications: Labour force survey
To place the mismatch problem in context, one must understand the changes in Japan’s industrial structure. Table 1-1 shows the percentage of employees by industry over the last 25 years, revealing that the percentage of employees in manufacturing has dropped from 31.5% in 1975 to 22.5% in 2000. On the other hand, the service industry shows a rise from 18.2% to 27.6% over the same period. Moreover, Figure 1-10 presents the Lilian Index, revealing how the mismatch problem was already occurring due to labour transfers between industries in the 1980s. However, while redistribution of labour between industries has previously been carried out mainly by means of the allocation of recent graduates, it seems likely that, with numbers of school leavers already in decline, such re-allocation will henceforth be achieved primarily through job transfers. The acquirement by workers of industry-specific skills means that re-allocation by job transferral is surely contributing to the mismatch problem. 4
4 Abe and Ohta (2001) have shown that the existence of industry-specific skills was the principal factor behind the rising unemployment rate in Japan in the latter half of the 1990s.

Conditions of Work and Employment Series No. 5 11
Table 1-1. Share of employees by industry
Year Mining Construction Manufacturing Electricity/ Gas
Transportation/ Communication
Wholesale/ Retail
Finance Service Public service
1975 0.415 10.423 31.463 0.885 8.681 19.657 4.341 18.220 5.419
1980 0.254 10.835 28.800 0.761 8.339 20.934 4.491 19.995 5.049
1985 0.187 9.662 28.821 0.770 7.561 21.284 4.644 21.937 4.644
1990 0.125 9.613 27.174 0.624 7.345 21.785 5.015 23.762 4.057
1995 0.096 10.404 25.014 0.803 7.286 21.763 4.666 25.378 4.169
2000 0.093 10.063 22.498 0.635 7.338 22.349 4.276 27.595 3.996
Source. Statistics Bureau and Statistics Centre: Labour force survey
Figure 1-10. Lilien’s index
0
0.5
1
1.5
2
2.5
3
1980 81 82 83 84 85 86 87 88 89 90 91 92 93 94 95 96 97 98 99 2000
YearSource. Abe and Ohta (2001).
Changes in the external and internal labour markets
The third change in the employment context involves the progress of deregulation in the external labour market and the review of the employment system in the internal labour market. As described above, since the dominant employment practices in Japan have been life-time employment and the nenkô wage profile, not many workers would change jobs, and the external labour market remained underdeveloped. However, with job transfer having become the chief method of labour reallocation, expansion of the external labour market has become unavoidable. The changing rate of job transfers is shown in Table 1-2, and it is noteworthy that while the rate of job transfers has hitherto tended to increase during times of economic growth, recently the trend is one of increase during recession. In particular, it is clear that the rate of job transfer among young workers is increasing yearly.

12 Conditions of Work and Employment Series No. 5
Table 1-2. Changes in the rate of those wanting to change jobs (by age group)
Year Total 15-24 25-34 35-44 45-54 55-64 65 and older 1971 4.5 7.1 5.6 3.9 2.6 2.4 1.0 1974 4.9 8.5 6.0 4.5 3.0 2.4 1.2 1977 7.6 12.5 9.5 7.8 5.0 4.0 1.5 1979 8.7 14.9 10.8 8.8 6.2 4.6 1.8 1982 8.6 15.8 10.8 8.8 6.2 4.0 1.4 1987 9.9 19.7 12.8 9.9 7.2 5.3 1.5 1992 9.4 18.4 13.7 9.5 6.4 4.4 1.4 1997 10.7 21.8 16.1 10.8 7.3 4.7 1.3 Source. Statistics Bureau and Statistics Centre: Employment status survey
Revisions of the law in 1999 allowed for private sector job placement and, under the negative list method, loosened the restrictions on temporary worker supply agencies, which had previously been limited to 23 types of business. Detailed analysis of the effects of these deregulatory policies on the external labour market remains to be done; however, they are said to be causing increasing fluidity in the labour market. On the other hand, with long-term employment a prerequisite for employment in Japan, there are also those who claim that fluidization of the labour market will not progress as long as the legal principle of the abuse of the right of dismissal makes the cost of dismissal high for companies. 5
Further, labour management in companies has also greatly changed. Companies that have reviewed life-time employment and the nenkô wage profile and have introduced market principles into the internal labour market are on the increase. Even now, the majority of companies continue to decide pay levels with particular regard to length of service, but the number of companies that has introduced the annual salary system and merit-based pay (new piece-work payment) has risen. According to the General Survey on Wage and Working Hours Systems carried out by the Ministry of Health, Labour and Welfare (MHLW), the percentage of companies that had introduced the annual salary system rose from 8.6% to 12.3% between 1995 and 1997, and the percentage of companies that took into account factors such as performance and results in deciding wage levels rose from 55.1% in 1998 to 64.2% in 2000.
The fourth change in the employment context has been the increase in non-regular workers. Figure 1-11 shows the numbers of employees and part-time workers, revealing that since 1997 the number of employees has dropped, while the number of part-time workers has risen yearly. Further, the number of dispatched workers has also risen, with MHLW data putting the figure in 2000 at 390,000, representing an increase of 28.5% from the previous year. Factors discussed above, such as economic globalization and ICT, have contributed to the rise in non-regular workers, but the legal system has also influenced the rise. Revision of the Worker Dispatch Law in 1999 made it easier for companies to employ dispatched workers in a wide variety of job descriptions.
5 In Japan, the law gives companies the freedom to make dismissals. Nevertheless, in the courts, a series of judicial precedents have been set circumscribing dismissals. It is for this reason that the cost to companies of dismissals in Japan is said to be high.

Conditions of Work and Employment Series No. 5 13
Figure 1-11. Number of employees and non-regular workers
2'000
2'500
3'000
3'500
4'000
4'500
5'000
5'500
6'000
1980 81 82 83 84 85 86 87 88 89 90 91 92 93 94 95 96 97 98 99 2000300
350
400
450
500
550
600
650
700
750
Employees Non-Regular Worker
(In ten thousands of persons�
Source. Ministry of Public Management, Home Affairs, Posts and Telecommunications: Labour force survey
Administrative reform and privatization
The Japanese Government has been engaging in administrative reform with positive results: for example, state-run railways and telegraph and telephone companies have been broken up and privatized and the number of civil servants has been reduced. Privatization has brought about improved services and lower charges, but has also given rise to a number of problems. For example, rail services have been discontinued in rural areas and some have suffered temporary unemployment as a result.
At present, with further and more sweeping reforms being envisaged, measures to turn national universities into government agencies, and the privatization of government-affiliated organizations (such as the Japan Highway Public Corporation and the Housing Loans Corporation) are on the chopping board.
Poverty level
Figure 1-12 indicates the average income trends for elderly-only households, fatherless households and other kinds of households. As opposed to an increase in the income of elderly-only households, the income of fatherless households in recent years has shown a declining trend, thereby widening the income differential between the former and latter. To a large degree this demonstrates the effectuation of the pension system. However, it should be pointed out that the figures represent averages; the problem of the wide income differentials between elderly-only households has been noted by Iwata (1996).

14 Conditions of Work and Employment Series No. 5
Figure 1-12. Monthly income by family composition
0
100
200
300
400
500
600
700
800
1970 71 72 73 74 75 76 77 78 79 80 81 82 83 84 85 86 87 88 89 90 91 92 93 94 95 96 97 98
Year
In 1
0 th
ousa
nd y
en Other kinds of householdsElderly-only householdsFatherless households
Source. Ministry of Health, Labour and Welfare: Comprehensive survey of the living conditions of people on health and welfare
Japan does not issue any official figures concerning poverty rates. For this reason, researchers extrapolate data from the National Survey of Family Income and Expenditure which is issued by the Ministry of Public Management, Home Affairs, Posts and Telecommunications. Setting the poverty line as 50 per cent of the median income adjusted to the OECD equivalence scale, and examining the household income distribution in this range (in other words, the below 0.5 group and impoverished households that are below the 1.0 group), as shown in Table 1-3, demonstrates that single elderly-only and fatherless households tend to suffer from high poverty rates (Iwata, 1996). This shows that of the quintile groups that are delineated for equivalence disposable income, the risk of fatherless households to fall into the first level is high (Nishizaki et al., 1998). It is often said that Japan is a prosperous country with relatively narrow differences in income gaps, but in fact many fatherless homes are impoverished, symbolizing the contradictions inherent in the country’s social security systems.
Table 1-3. Distribution of income group (OECD equivalence scale: 50%)
One-person (less than 55 years)
One-person (65 years and older)
Married couple with aged person
Married couple and children
One parent and children
Below 0.5 1.3 7.8 2.5 0.4 3.2 Below 1.0 6.6 22.2 10.6 6.1 19.3 Below 1.5 11.6 28.3 23.8 22.5 26.1 Below 2.0 14.2 18.3 24.7 27.4 22.3 2.0 and over 66.6 23.5 38.3 43.6 29.1 Source. M. Iwata (1995).
Below, the issue of poverty in fatherless households will be examined in the context of their economic and employment circumstances.
The economic context of fatherless households
As shown in Figure 1-13, as a consequence of the rising divorce rate, the number of fatherless households created due to divorce have been increasing. In recent years, fatherless households headed by unwed mothers have also been increasing (Figure 1-14).

Conditions of Work and Employment Series No. 5 15
Figure 1-13. Trends in divorce and divorce rates
0
50'000
100'000
150'000
200'000
250'000
300'000
1947 49 51 53 55 57 59 61 63 65 67 69 71 73 75 77 79 81 83 85 87 89 91 93 95 97 99
Year
Div
orce
s
0.00
0.50
1.00
1.50
2.00
2.50
Div
orce
rate
s (pe
r 1,0
00 p
opul
atio
n)
DivorcesDivorce rates (per 1,000 population)
Source. Ministry of Health, Labour and Welfare: Vital statistics
Figure 1-14. Percentage distribution of fatherless households
0%
20%
40%
60%
80%
100%
1952 56 61 67 73 78 83 88 93 98
Year
Bereavement Divorce Unwed mother Other
Source. Ministry of Health, Labour and Welfare: Nationwide survey on fatherless families, etc.
At 2.29 million yen in 1997, the average annual income of fatherless households was only 34.8 per cent that of ordinary households, which averaged 6.58 million yen. Among the reasons for this low income was the failure by many fathers to pay child support. Only 20.8 per cent of fathers made such payments, and even when adding those who had made payments at some point in the past, the figure is only 37.2 per cent (Table 1-4).

16 Conditions of Work and Employment Series No. 5
Table 1-4. Recipients of child support
Year Receiving Received at some point in
the past
Never received
1983 11.3 10.1 78.6
1988 14.0 10.6 75.4
1993 14.9 16.4 68.7
1998 20.8 16.4 60.1
Source. Ministry of Health, Labour and Welfare: Nationwide survey on fatherless families, etc.
In cases where child support payments were made, the amount per child (in the case of a single child) ranged from 20,000 to 40,000 yen in 50.5 per cent of all cases. In the case of two children, the amount was quite low: 36.1 per cent of payments ranged from 40,000 to 60,000 yen, and 24.2 per cent between 20,000 to 40,000 yen (Table 1-5).
Table 1-5. Child support by number of children
(in 10 thousand yen) Children Under 1 Under 2 Under 4 Under 6 Under 8 Under 10 10 and
over Irregular Total
1 child 4.4 13.6 50.5 24.2 3.4 2.5 1.3 0.1 100.0 2 children 3.9 7.6 24.2 36.1 13.1 10.2 4.8 0.1 100.0 3 children 2.5 6.1 16.9 27.8 7.6 19.9 19.1 0.0 100.0 4 children 3.4 0.0 15.7 14.6 9.0 11.2 46.1 0.0 100.0 5 or more children
10.0 20.0 20.0 10.0 10.0 10.0 20.0 0.0 100.0
Source. General Secretariat, Supreme Court: Annual report of judicial statistics: Family cases, 2000
As shown, the living standard of fatherless households tends to be low. Poverty was especially severe among elderly divorced women up to 1985. One reason for this was that when a full-time housewife divorced, in many cases she lost any claim to a pension. This situation was rectified through the 1985 Pension Reform, in which pension eligibility for women was established. A bill is under consideration that would award a divorced woman the right to one-half of her husband’s pension at the time of divorce.
Employment context of fatherless households
In households in Japan made fatherless through divorce, the percentage of mothers who work is high. Although 86.8 per cent of divorced women hold jobs, due to the difficulties of reconciling work and family, many women work as part-timers, notwithstanding their desire to work full time. In addition to the large differential between male and female wages and the generally low salaries for women, women are obliged to work at part-time jobs because they are raising children. According to the Nationwide Survey on Fatherless Families, etc., 57.1 per cent of the women in fatherless households expressed the desire to change their jobs, mainly due to low wages. Because of the prolonged economic recession, the number of women in fatherless households who work has declined, leading to an increase in the number answering “job” to the question as to what they consider to be their main problems (Table 1-6).
Conditions of Work and Employment Series No. 5 17
Table 1-6. Worries arising from fatherless households
Year Financial problems
Job Housing Health Domestic work
Other
1988 33.5 14.9 15.2 21.2 4.2 11.1 1993 35.8 12.8 23.6 17.3 2.0 8.5 1998 37.9 22.4 18.5 12.6 1.8 6.8 Source. Ministry of Health, Labour and Welfare: Nationwide survey on fatherless families, etc.
In this manner, from the economic context and employment context of fatherless households, it is necessary to consider such problems as women’s wages, the child-rearing environment, working hours and the economic recession as they relate to raising a family while working.
Education
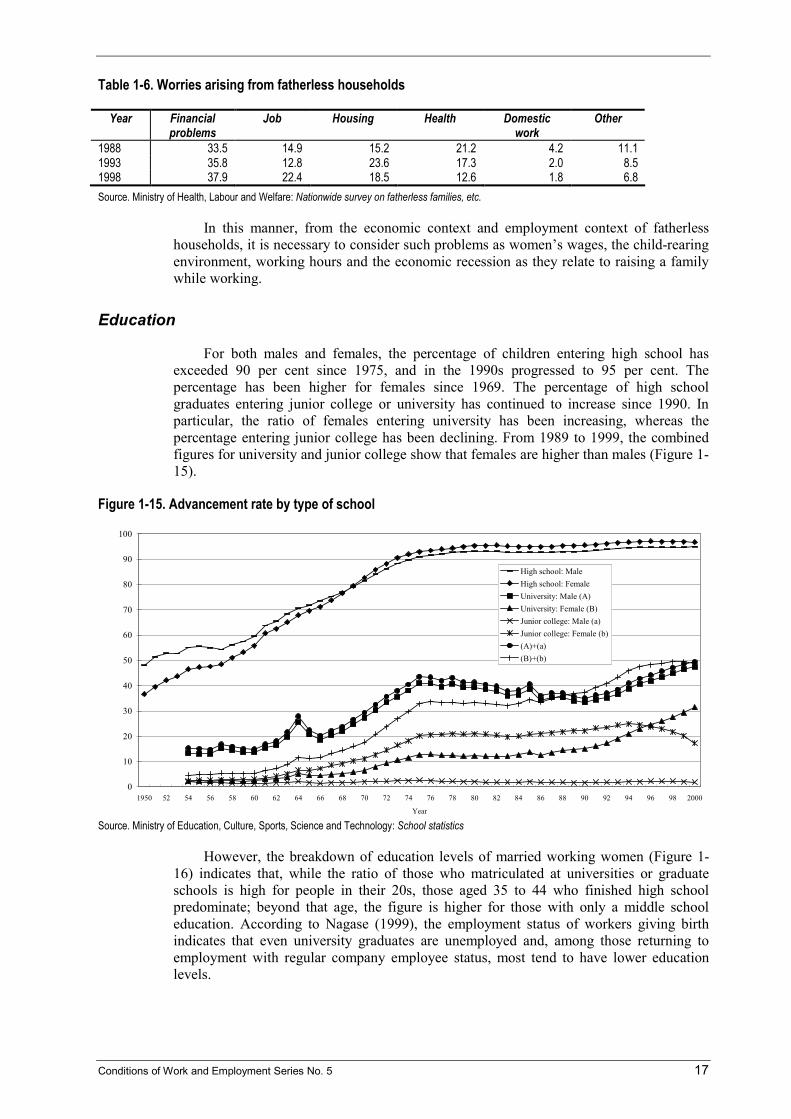
For both males and females, the percentage of children entering high school has exceeded 90 per cent since 1975, and in the 1990s progressed to 95 per cent. The percentage has been higher for females since 1969. The percentage of high school graduates entering junior college or university has continued to increase since 1990. In particular, the ratio of females entering university has been increasing, whereas the percentage entering junior college has been declining. From 1989 to 1999, the combined figures for university and junior college show that females are higher than males (Figure 1-15).
Figure 1-15. Advancement rate by type of school
0
10
20
30
40
50
60
70
80
90
100
1950 52 54 56 58 60 62 64 66 68 70 72 74 76 78 80 82 84 86 88 90 92 94 96 98 2000
Year
High school: MaleHigh school: FemaleUniversity: Male (A)University: Female (B)Junior college: Male (a)Junior college: Female (b)(A)+(a)(B)+(b)
Source. Ministry of Education, Culture, Sports, Science and Technology: School statistics
However, the breakdown of education levels of married working women (Figure 1-16) indicates that, while the ratio of those who matriculated at universities or graduate schools is high for people in their 20s, those aged 35 to 44 who finished high school predominate; beyond that age, the figure is higher for those with only a middle school education. According to Nagase (1999), the employment status of workers giving birth indicates that even university graduates are unemployed and, among those returning to employment with regular company employee status, most tend to have lower education levels.

18 Conditions of Work and Employment Series No. 5
Figure 1-16. Percentage of married women who work by age and education
0
10
20
30
40
50
60
70
80
20-24 25-29 30-34 35-39 40-44 45-49 50-54 55-59 60-64
Age group
%
Elementary school, junior high schoolSenior high schoolJunior college, technological collegeCollege or university, including graduate school
Source. Ministry of Public Management, Home Affairs, Posts and Telecommunications: Employment status survey (1997)
Industrial relations
Table 1-7 shows the numbers of labour unions and organization rates, revealing that both are declining yearly. Labour union organization rates in secondary industries were originally high, but the rise of employment in tertiary industries has contributed to the decrease in organization rates, as has the increase in part-time workers.
Table 1-7. Number of labour unions and organization rates
Year Number of labour unions
Rate of organization
1980 72,693 30.8 1985 74,499 28.9 1990 72,202 25.2 1995 70,839 23.8 1996 70,699 23.2 1997 70,821 22.6 1998 70,084 22.4 1999 69,387 22.2 2000 68,737 21.5
It appears that, despite declining numbers of labour unions and organization rates, communication between labour and management has not been adversely affected. Tsuru’s (1997) research shows that, even where there are no labour unions, information is exchanged between employees and management by means of labour-management consultations and ordinary business communications.
Labour law
Over the course of the last ten years, a significant number of laws have been revised or promulgated in response to changes in the labour market, such as the revision of the Labour Standards Law, the Job Introduction Law and the Worker Dispatch Law, and the enactment of the Equal Employment Opportunity Law and the Child-care and Family-care Leave Laws. The principal labour laws enacted since 1980 are as follows:

Conditions of Work and Employment Series No. 5 19
1985 Laws pertaining to equal opportunities for men and women in the field of employment, and to increased welfare for and fair treatment of women workers
Human Resources Development Promotion Law
Laws pertaining to securing proper management of worker dispatch businesses and to defining employment conditions for dispatched workers
1986 Laws pertaining to securing employment for elderly workers
1987 Regional Employment Development Promotion Law
Laws pertaining to promoting the employment of disabled persons
1991 Laws pertaining to child-care leave
1992 Temporary measures laws pertaining to promoting the reduction of working hours
1993 Laws pertaining to improving the employment management of temporary workers
1995 Laws pertaining to the welfare of workers taking child-care or family-care leave
1997 Laws pertaining to equal opportunities for men and women in the field of employment and to securing fair treatment


Conditions of Work and Employment Series No. 5 21
II. Family trends: The implications for work of changing family needs
Trends in the family and family responsibilities
Concepts related to “family” in administrative terms
In feudal Japan, a family registration system served a necessary function in controlling social mobility. Personal histories of marriage and parent-child relationships (including adoption) were filed in a paper-based record-keeping system. Each local administrator maintained such systems and there was no established national standard.
After the modern national administrative system was instituted in the late 19th century, the family registration system was restructured according to the national standard prescribed in the Family Registration Law of 1871. The family register was named koseki, since it took the form of bound papers (seki) in which the members of a ko (ie: a family unit prescribed by the Civil Law) were recorded together.
In 1947, with the amendment of the Civil Law as part of the post-war reforms, the nuclear family — a married couple and their unmarried children — was employed as the unit of family registration, instead of the ie unit system. 6 Despite that reform, the new system performed basically the same role as the old system: it provided the entire history of marriage and parent-child relationships of all Japanese nationals.
The Family Register held static information about people’s kinship. It did not reflect people’s real lives that were always dynamically changing. For an effective administration, another framework was necessary to survey the real status of people’s lives.
From 1910, the national and local administrative offices introduced a new concept: setai. The definition of setai, corresponding to the English word “household”, was the following: a group consisting of those who were sharing living quarters and living expenses (the first population census in 1920). It soon became widely used, for example, for the population census, for local resident registration and in social security laws.
The current administrative system inherits the “household” (setai) concept from the old system. A household is regarded as the basic unit in various administrative affairs: various national statistical surveys; resident registration in local administrations; those covered under the National Health Insurance; and the screening examination for receiving welfare benefits under the Livelihood Protection Law. The definition of household is concerned only with living quarters and expenses. It therefore does not specify the members’ kinship.
However, kinship is not meaningless in administrative terms. It is important in the tax system and the health insurance system, where relatives of a taxpayer (or of an insured person) economically dependent on her or him can be specified as “dependents”: the
6 The Family Registration Law and the Civil Law provide that all people in the same register must have the same family name. When men and women of different family names are getting married, one of them must change his/her family name. These provisions have come under criticism: (1) they make identification of individuals difficult; (2) they sometimes bring about the extinction of family names; and (3) they result in gender inequality when the vast majority of married women change their name. Amendments to these provisions have been under consideration in the National Diet since 1998.

22 Conditions of Work and Employment Series No. 5
income tax system allows an exemption for the taxpayer’s dependents; the Health Insurance covers medical expenses not only for the insured, but also for their dependents.
Figure 2-1 summarizes the definition of family-related concepts. The current administrative system uses three criteria to identify family membership: kinship, living quarters and sharing of living expenses. A combination of these three criteria defines a person’s household and dependents. Those who share living quarters and living expenses (B and C0 in Figure 2-1) are members of the same household. Those who are relatives of an individual and are economically dependent on that person (A and C1 in Figure 2-1) are his/her dependents.
Figure 2-1. Concepts related to family in administrative terms
C1: Economically dependent
Household (B and C0)
Population
A: Relatives
B: Living together
C0: Sharing living
expenses
Dependents (A and C1)
Life cycle
The Japanese population is rapidly aging (Table 2-1). The population of people 65 years old and over has constantly increased throughout the past 50 years. At the same time, the population of young people (under 15 years) has constantly decreased; by 2000, their number was smaller than the population of aged people. As a result of ageing, the production-age population (15–64 years old) has started to decrease. It is predicted that the production-age population will continue to decrease through the 21st century, resulting in a serious labour shortage.

Conditions of Work and Employment Series No. 5 23
Table 2-1. Age structure of the population (percentage)
Age Year 0-14 15-64 65 and over
Total
1950* 35.4 59.7 4.9 100.0 1955* 33.4 61.3 5.3 100.0 1960* 30.0 64.2 5.7 100.0 1965* 25.6 68.1 6.3 100.0 1970* 23.9 69.0 7.1 100.0 1975 24.3 67.7 7.9 100.0 1980 23.5 67.4 9.1 100.0 1985 21.5 68.2 10.3 100.0 1990 18.2 69.7 12.1 100.0 1995 16.0 69.5 14.6 100.0 2000 14.6 67.9 17.6 100.0 Note: Population at 1 October; omitting those whose ages were unknown.
* Excluding Okinawa
The average age of a first marriage has been rising and the marriage rate has been declining. The ratio of unmarried people relative to the general population has been growing since the late 1970s (Figure 2-2). In 1995, among people in their late 30s, 10% of women and 22.6% of men were unmarried.

24 Conditions of Work and Employment Series No. 5
Figure 2-2. Trends in percentage of unmarried people by age
(a) Female
0
20
40
60
80
100
15 25 35 45 55 65 75 85
1960197519851995
(b) Male
0
20
40
60
80
100
15 25 35 45 55 65 75 85
1960197519851995
Source. Statistics Bureau: Population census
Fertility rates show a long-time declining trend (Figure 2-3). By the mid-1970s, the total fertility rate (TFR) fell below the estimated replacement level of 2.08. Subsequently, the TFR has continued to drop. In 1999, the TFR was estimated to be 1.34.

Conditions of Work and Employment Series No. 5 25
Figure 2-3. Total fertility rate: Trends from 1950-2000 and projections until 2050 7
0
1
2
3
4
1940 1960 1980 2000 2020 2040 2060
Year
Tota
l fer
tility
rat
e
Actual High Medium Low
Source. National Institute of Population and Social Security Research (IPSS), 2000.
The decline in the fertility rate is attributable to either (1) the decline of the marriage rate or (2) the decline of marital fertility, since out-of-wedlock births are rare in Japan. According to the Japanese Government’s Vital Statistics, which are numerical collections of notifications required by the Family Registration Law, more than 98% of births between 1952 and 1999 were to married parents (IPSS, 2000, p. 69). Although false notifications may have concealed existing out-of-wedlock births, the number would be negligible due to strict enforcement of the Family Registration Law. 8
Demographers had interpreted the fertility decline since the mid-1970s as a consequence of the decline in the marriage rate, on the grounds that there were no changes observed in marital fertility (IPSS, 1997). However, recent studies reveal that the effect of the declining marriage rate is less significant, and that the number of children born to married couples is decreasing. The decline in marital fertility is a major cause of the fertility decline in addition to the decline in the marriage rate (Suzuki, 2000; Hirosima, 2000).
7 The TFR projection has three variants (high, medium and low) according to different settings of parameters determining fertility. See IPSS, 1997.
8 It was a common practice that when birth parents, especially unmarried mothers, were not capable of parenting the infants were given up to foster parents, who would then secretly register the newborn as their own. This custom can be understood as a form of adoption, although it was not legal (see Hikaku Kazokusi Gakkai, 1996, pp. 824 and 882). However, Article 49 of the Family Registration Law went into effect in 1948, which provided that a certificate signed by the attending doctor or midwife must be submitted for birth registration. As a result, such deceptive registration is difficult and rare today (see Tamura, 1996, pp. 131-132). Nowadays, when unmarried couples face an unexpected pregnancy, they usually get married hastily to legitimize the child (unless they decide to terminate the pregnancy) instead of giving the child up for “adoption”. It is estimated that births following such “emergency marriages” have constituted over 20% of legitimate first births since the 1990s (see Ministry of Health, Labour and Welfare, 2002.

26 Conditions of Work and Employment Series No. 5
The National Institute of Population and Social Security Research has reported the projections for Japan’s future population, where the fertility rate is postulated to stop declining and level out in the early 21st century (see Figure 2-3). That projected future population provides a basis for social policies in various fields concerned with population issues, such as labour, education, health and social welfare.
Household composition
Most Japanese live with their relatives. Ninety per cent or more of the Japanese population live in households consisting of only their relatives (Table 2-2). Family sociologists argue that this situation has not changed since the early 20th century (Toda, 1937, pp. 118-120).
Table 2-2. People living without relatives (percentage of the whole population)
Year Non-relatives in relatives’ household **
In non-relative household +
One-person households
Quasi- and institutional households ++
Total
1960* 1.92 0.21 0.98 4.34 7.45 1965* 1.26 0.22 1.83 4.84 8.15 1970* 0.81 0.24 2.81 4.49 8.35 1975 0.33 0.14 3.79 3.46 7.72 1980 0.21 0.12 4.60 2.78 7.71 1985 0.13 0.13 5.28 2.62 8.16 1990 0.10 0.13 6.41 2.61 9.25 1995 0.08 0.21 9.09 1.45 10.83 * Excluding Okinawa ** Those who are not related to the head of household + Members of a household, including non-relatives ++ People in lodgings, dormitories or institutions Source. Morioka (1993, p. 119) for 1960-1990; Statistics Bureau: Population census reports for 1995.
Among the few people living without relatives, we found two major categories: single persons and “quasi-households” (people in lodgings, dormitories or institutions). Table 2-2 shows that the former is increasing, while the latter is decreasing. Morioka (1993, pp. 123 and 138-140) explains that these trends have arisen from two conditions: (1) young people prefer single life to life in lodgings or dormitories because of high-quality residencies available on the housing market; (2) the number of aged people has increased, who often live alone after being widowed.
Now we turn to households of relatives, to which the majority of Japanese belong. Table 2-3 indicates trends in the composition of these households.

Conditions of Work and Employment Series No. 5 27
Table 2-3. Composition of relatives’ households
Nuclear family Extended family Year Couple only Couple and
children One parent
and children Lineal Lineal and
collateral Nucleus and
collateral
Unclassified Total
1955* 7.1 44.9 10.1 24.8 7.5 2.8 3.0 100.0 1960* 8.8 45.7 9.0 24.7 6.2 2.8 2.8 100.0 1965* 10.7 49.5 8.0 23.3 4.1 2.3 2.1 100.0 1970* 12.4 51.8 7.2 16.8 6.0 3.1 2.7 100.0 1975 14.4 53.0 6.7 16.6 4.4 2.4 2.4 100.0 1980 15.6 52.6 7.2 17.4 3.5 1.6 2.1 100.0 1985 17.4 50.6 8.0 17.3 3.0 1.6 2.2 100.0 1990 20.2 48.6 8.8 16.2 2.5 1.5 2.2 100.0 * Excluding Okinawa Source. Morioka (1993), p. 148 (for 1955-1990); population census reports for 1995.
Throughout the entire period appearing in the table, households containing married couples and children are the largest category at more than 45%: the typical nuclear family has been the majority household type.
The most significant trend shown in Table 2-3 is the growth of couples-only households. This trend is greatly influenced by the increase of aged people living with only their spouses (Morioka, 1993, p. 104).
Extended family households were in a downward trend, while nuclear family households grew. In particular, lineal families — typically including grandparents, parents and children — had a quarter share among relatives’ households in the 1950s, in contrast to a 16% to 17% share since the 1970s. Throughout the 1980s and 1990s, extended families remained at a steady percentage.
A slightly different trend is observed in the composition of households bringing up infants. Table 2-4 indicates composition of households with children under 6 years old. In the 1970s and 1980s, the nuclear family household consisted of 70% 9 of households with children under 6, with 30% made up of extended families. This may parallel the trend in the whole household composition seen in Table 2-3. In the 1990s, however, nuclear families have shown further growth. In 2000, nuclear families made up almost 80% of households with children under 6.
Table 2-4. Proportion of nuclear and extended families among households including children under 6 years of age
Year Number of households Number of nuclear family households
Percentage of nuclear family households
1970* 7,695,570 5,148,270 66.9 1975 8,547,922 6,018,801 70.4 1980 7,542,511 5,251,380 69.6 1985 6,559,018 4,474,293 68.2 1990 5,776,760 4,059,607 70.3 1995 5,380,231 3,981,568 74.0 2000 5,356,379 4,209,254 78.6 * Excluding Okinawa Source. Statistics Bureau: Population census
These complicated trends in the composition of relatives’ households arise from the following three factors: (1) decrease in the number of children, (2) lengthening of lifespan,
9 This figure was probably lower before 1970. See Atou, 1997, pp. 14-15, and Atou, 1999, p. 127.

28 Conditions of Work and Employment Series No. 5
and (3) tendency of household separation between parents and their married children. The first two factors promote the formation of extended family households, while the last factor promotes the formation of nuclear family households. These contradictory factors thus produced changes in the household composition as follows.
Until the mid-20th century, an heir — commonly the eldest son — was expected to live with the parents after his/her marriage. Although the social system enhanced the formation of extended family households, there were actually many nuclear family households because children other than the heir had to leave their birth homes to start their own household or simply because the heir’s parents had died early.
Such demographic constraints have relaxed in the last 50 years. Because people are having fewer children, the chance for a child to be born as an heir has become relatively greater. The lengthening of lifespan should also work for increasing the number of extended households, since more parents are likely to be alive at the time of their children’s marriage. These changes should encourage married couples to start extended family households.
Nevertheless, many people are leaving their parents’ households to start their own nuclear family households, even if they could live with their parents. There has been a consistent growth in the number of household separation between parents and married children, as Hirosima (1997, p. 64) observes by the decomposition of the trends in household structures. Such tendency and demographic conditions determine the trend of household formations and the trend has been toward nuclear family households since the 1990s (Atou, 1997, pp. 14-15).
Industry and employment
The most significant trend in industry and employment was the decline of the agricultural sector. As seen in Table 2-5, 30% of both women and men in the 1950s were agricultural workers, that is, farmers. Subsequently, during the High Economic Growth Era, the share of the agricultural workers decreased sharply. Today they comprise only 3% of the population.

Conditions of Work and Employment Series No. 5 29
Table 2-5. Employment status of women and men, 1950-2000
Non-agricultural Year Population (x 10000)
Not employed (1)
Agriculture (2) Self-employed
(3) Part-time
employee (4) Full-time
employee (5) Women 1950 (2887) 51.2 30.4 8.0 10.4* 1955 (3155) 46.0 26.1 12.8 1.7 12.3 1960 (3370) 46.4 19.6 13.2 1.7 17.3 1965 (3758) 50.0 14.7 11.5 2.2 20.5 1970 (4060) 50.7 10.9 11.6 3.2 23.1 1975 (4344) 55.0 7.4 10.8 4.6 21.6 1980 (4591) 53.3 5.9 11.4 5.6 23.2 1985 (4863) 52.6 4.8 10.8 6.8 24.3 1990 (5178) 51.0 3.9 9.7 9.7 25.0 1995 (5402) 51.6 3.0 7.6 11.7 25.3 2000 (5583) 52.9 2.5 6.4 13.5 23.9 Men 1950 (2637) 17.9 32.8 14.9 34.4* 1955 (2857) 15.6 27.3 16.0 2.8 35.4 1960 (3151) 16.0 20.9 14.3 2.4 44.2 1965 (3529) 18.8 15.1 12.7 2.4 50.3 1970 (3825) 19.2 10.5 13.0 2.2 54.1 1975 (4099) 20.2 7.2 12.4 3.8 55.2 1980 (4341) 21.8 6.0 12.2 3.1 56.0 1985 (4602) 23.9 5.1 11.1 3.0 56.0 1990 (4911) 24.4 4.2 10.4 4.5 55.6 1995 (5108) 24.8 3.5 9.0 5.2 56.7 2000 (5253) 27.3 3.0 8.5 5.7 54.6 Note: Percentage in population aged 14 and over for 1950-1955; 15 and over for 1960-2000. Totals are less than 100 because of the exclusion of unclassified, no answer and employees not at work. (1) Persons unemployed or not in labour force. (2) Agricultural and forestry industries (3) Including home handicraft workers and family workers. (4) Working for less than 35 hours per week, including side jobs. (5) Working for more than 35 hours per week, including side jobs. * Total for non-agricultural employees Source. Statistics Bureau: Labour force survey
As the number of farmers decreased, the number of employees in non-agricultural industries increased. In the 1950s and 1960s, full-time employees made up an increasing share of the population. By 1970, 23% of women and 54% of men worked in full-time, non-agricultural industries.
Subsequently the trend diverged by sex. Among men, those who were not employed have increased. They may mostly be aged people. In contrast, among women, part-time employment has increased. In the 1990s, more than 10% of the female population worked as part-time employees. It is noteworthy that the growth in women’s employment since the 1970s can be fully explained by the growth of part-time employment, with no increase in full-time employment for women.
Life-stage-specific profiles of employment status present another aspect of gender difference. Figure 2-4(a) shows a typical M-shaped curve of women’s lifetime workforce participation. Most women in their 20s have full-time jobs. However, a considerable number of women in their 30s quit their jobs in order to undertake household responsibilities, especially to care for their children. They return to work as part-time workers in their 40s, when there may be less household responsibilities.

30 Conditions of Work and Employment Series No. 5
Figure 2-4. Employment status by age of women and men: 2000
0
20
40
60
80
100
10 20 30 40 50 60 70
Part timeFull time
(b) Men
Source. Statistics Bureau: Labour force survey (2000)
0
20
40
60
80
100
10 20 30 40 50 60 70
Part timeFull time
(a) Women

Conditions of Work and Employment Series No. 5 31
Most women experience a career interruption due to marriage or childbirth. Now we analyze a dataset of personal occupational history to know how many people experience career interruptions. 10 We use an index called CRFE, the proportion of people continuing regular full-time employment among those who were regular full-time employees before marriage (Tanaka, 1999). As summarized in Table 2-6, women’s CRFE has been steady at about 20%. Among women who were regular full-time employees before marriage, about 80% have discontinued their career. There was no change observed over time.
Table 2-6. Continuity rate of full-time employment (CRFE)
Women Men Birth % (N) % (N)
1925-1935 21.6 (88) 97.6 (124) 1935-1945 23.0 (126) 100.0 (132) 1945-1955 21.4 (224) 100.0 (175) 1955-1975 22.4 (214) 99.1 (117) Total 22.1 (652) 99.3 (548) Source. 1995 Social Stratification and Social Mobility (SSM) survey; see Tanaka (1999), pp. 26-27.
In contrast, men do not follow such a life-stage dependent course as women do. Men from their late 20s through their 50s show a workforce participation at a constantly high level. More than 80% of them work as full-time workers [see Figure 2-4(b)]. Men scarcely experience career interruption due to marriage or childbirth (see Table 2-6).
Distance between home and workplace
As a consequence of the industrialization of Japanese society, self-employed workers — most of them were farmers — rapidly decreased in number (see Table 2-5). Working in places separate from the home has thereby become a common way of working. As shown in Table 2-7(a), almost 40% of workers worked at home in 1970. This ratio declined to 14.9% in 1995.
10 Data were collected through the Social Stratification and Social Mobility (SSM) survey, a national representative survey repeated in ten-year intervals by a temporary organization of volunteer sociologists. The permission of the 1995 SSM Kenkyuukai to use data and publish the result is gratefully acknowledged.

32 Conditions of Work and Employment Series No. 5
Table 2-7. Changes in the place of work (percentage of employed persons)
(a) Both sexes Year Home Same municipality Same prefecture Other prefecture Total
1955* 86.4 11.5 21. 100.0 1960* 83.0 14.1 2.9 100.0 1965* 79.0 17.2 3.8 100.0 1970* 37.2 39.1 19.0 4.6 100.0 1975 30.0 41.3 23.1 5.7 100.0 1980 26.0 41.9 25.8 6.3 100.0 1985 21.4 43.5 28.2 6.9 100.0 1990 19.1 42.3 30.8 7.8 100.0 1995 14.9 44.4 32.5 8.1 100.0 (b) Men
Year Home Same municipality Same prefecture Other prefecture Total 1970* 70.9 22.9 6.1 100.0 1975 24.1 41.3 34.5 100.0 1980 21.2 40.4 30.2 8.2 100.0 1985 18.0 40.4 32.6 9.0 100.0 1990 16.5 38.6 35.0 10.0 100.0 1995 13.2 40.4 26.1 10.3 100.0 (c) Women
Year Home Same municipality Same prefecture Other prefecture Total 1970* 84.8 13.0 2.3 100.0 1975 39.9 41.2 18.9 100.0 1980 34.0 44.3 18.6 3.0 100.0 1985 26.8 48.3 21.3 3.5 100.0 1990 23.1 47.9 24.5 4.5 100.0 1995 17.4 50.5 27.2 4.9 100.0 * Excluding Okinawa Source. Statistics Bureau: Population census
In addition, the distance between home and the workplace has grown further, due to the growth of megacities and their suburbs. In 1955, 86.4% of workers worked within the same municipality as they lived. In those days, people commuting to other prefectures were a distinct minority. Today, by contrast, almost 10% of workers commute to another prefecture on a daily basis. Much labour is thus supplied to cities such as Tokyo, Nagoya and Osaka, from their distant satellite towns.
Gender differences in Table 2-7 show that men tend to work at more distant workplaces than women do. The trend mentioned above has had a deep effect on men, rather than women.
Comparing two surveys carried out in 1991 illustrates how long-distance commuting affects male workers’ lives. One was undertaken in two satellite towns in the north of the Tokyo metropolitan area,11 and the other was the national 1991 Survey on Time Use and Leisure Activities (Statistics Bureau, 1993, p. 266). The former survey shows that male workers in the two towns spent an average of 2.8 hours commuting per working day, which was 1.8 hours longer than the national male worker’s average. The longer the time spent in commuting leaves less time for activities. However, the survey results also suggest that men did not reduce time in their daily routine, such as sleeping, to make up for the loss caused by long commuting hours. The male workers in the two towns spent seven hours
11 The survey was carried out in Wasimiya (in Saitama Prefecture) and Nogi (in Totigi Prefecture). It takes more than one hour from each town to commute to central Tokyo. The results mentioned here are based on the analysis of the sub-sample of male household commuting by train (Umezaki et al., 1999, p. 73).

Conditions of Work and Employment Series No. 5 33
for sleeping per weekday, which was only shorter by 0.5 hours than the national male worker’s average. Provided that their working hours are not shorter than those of shorter-distance commuters, they consequently have to reduce the time for other activities, such as leisure and unpaid work (unfortunately time spent for these activities is not surveyed). Long-distance commuting thus squeezes male workers’ time budgets. It may lower their potential to participate in housework. 12
Use of time
Time use of Japanese, measured with weekly average time, has been stable. Comparing 1976 and 1996 data, we find no significant change over the past 20 years, except that men’s work hours slightly decreased and their tertiary activity time (i.e. leisure) increased (Table 2-8).
Table 2-8. Time use of men and women in 1976 and 1996 (weekly average of hours per day)
Year Sex Housework (1) Work (2) Tertiary activities (3)
Primary activities (4)
Total
Men 0.20 7.42 5.68 10.68 24.00 1976 Women 3.87 4.22 5.23 10.70 24.00 Men 0.40 6.73 6.35 10.48 24.00 1996 Women 3.57 3.70 6.05 10.67 24.00
(1) Including nursing and child care (2) Including commuting and school work (3) Leisure, sports, social activities, medical examinations, rest, watching TV, etc. (4) Sleep, meals and personal care Source. Statistics Bureau: Survey on time use and leisure activities (1996)
Of more concern are gender differences, rather than longitudinal changes. In primary and tertiary activities, time spent by men and women is balanced; but for work and housework, time use is extremely imbalanced between the sexes. Time spent by women on work amounts to only half of that spent by men, while almost all housework is done by women.
Table 2-9 shows differences by household types. We find the presence of children increases women’s housework time. In contrast, men’s housework shows quite different characteristics: it is steady and at a very low level, whether they have children or not. This situation has been the same from 1976 to 1996, with only a slight increase in the time men spend on housework.
12 Shorter commuting time will not necessarily make men participate in housework (Kohara, 2000). We consider this is due to a common belief that men should not be held responsible for domestic duties, as we will argue later on under Implications of trends for the capacity of workers to meet their family and work responsibilities.

34 Conditions of Work and Employment Series No. 5
Table 2-9. Time use of wives and husbands by household type (weekly average of hours per day)
Wives Husbands Household Type House-
work Work Tertiary
activities Primary activities
Total House-work
Work Tertiary activities
Primary activities
Total
1976 3.94 3.93 5.49 10.65 24.00 0.20 7.87 5.28 10.66 24.00 Young* couples only
Children & parents
5.68 2.98 4.90 10.43 24.00 0.20 7.82 5.35 10.63 24.00
Children, parents & grandparents
4.95 4.95 3.92 10.20 24.00 0.15 8.33 4.97 10.55 24.00
Couple & parents
3.73 5.18 4.57 10.52 24.00 0.13 7.92 5.30 10.63 24.00
Old** couple only 4.33 2.79 5.93 10.98 24.00 0.29 5.02 7.40 11.31 24.00 1996 Young* couples only
4.00 3.58 6.04 10.39 24.00 0.33 7.88 5.57 10.21 24.00
Children & parents
5.82 2.68 5.37 10.12 24.00 0.43 7.77 5.57 10.22 24.00
Children, parents & grandparents
5.42 4.12 4.46 10.00 24.00 0.37 8.10 5.31 10.20 24.00
Couple & parents
4.28 4.26 5.08 10.38 24.00 0.43 7.15 5.95 10.47 24.00
Old** couple only 4.65 1.39 6.76 11.20 24.00 0.72 3.18 8.64 11.46 24.00 *Under 60 years of age ** Over 60 years of age Hours spent by the wife/husband of the youngest couple in the household. Source. Statistics Bureau: Survey on time use and leisure activities (1996)
Turning to the effect of life-stages, we observe an M-shaped curve — as well as women’s employment rate — in women’s time use by life-stages. Table 2-10 shows that a wife’s work time is the least when she has a newborn infant. Her work time then increases as her child grows. At the same time, child-care time rapidly decreases, but housework time does not decrease.

Conditions of Work and Employment Series No. 5 35
Tabl
e 2-1
0. Ti
me u
se o
f wive
s and
hus
band
s with
their
child
ren
(wee
kly av
erag
e of h
ours
per
day
) W
ife
Husb
and
Hous
ehol
d ty
pe/
Age o
f you
nges
t ch
ild
Hous
ewor
k*
Child
care
W
ork
Terti
ary
activ
ities
Pr
imar
y ac
tiviti
es
Tota
l Ho
usew
ork*
Ch
ild ca
re
Wor
k Te
rtiar
y ac
tiviti
es
Prim
ary
activ
ities
To
tal
Child
ren
& pa
rent
s
Un
der 1
4.6
5 4.6
2 0.6
2 4.1
3 9.9
8 24
.00
0.38
0.52
8.33
4.75
10.03
24
.00
1-2
4.77
2.93
1.12
4.75
10.42
24
.00
0.35
0.28
8.50
4.85
10.02
24
.00
3-5
5.27
1.33
1.85
5.27
10.28
24
.00
0.30
0.17
8.62
4.90
10.02
24
.00
6-9
5.45
0.38
2.47
5.70
9.98
24.00
0.3
0 0.0
5 8.4
3 5.2
2 10
.00
24.00
10
-14
5.32
0.08
3.40
5.43
9.78
24.00
0.2
7 0.0
2 8.4
3 5.2
7 10
.00
24.00
15
and o
ver
4.90
0.03
3.33
5.57
10.17
24
.00
0.35
0.00
6.98
6.18
10.46
24
.00
Child
ren,
par
ents
&
gran
dpar
ents
Unde
r 1
4.43
4.62
1.13
3.82
10.00
24
.00
0.38
0.45
8.17
4.55
10.45
24
.00
1-2
4.45
2.70
2.58
3.82
10.45
24
.00
0.27
0.25
8.57
4.68
10.25
24
.00
3-5
4.65
1.12
3.68
4.10
10.43
24
.00
0.23
0.17
8.55
4.98
10.05
24
.00
6-9
4.85
0.33
4.53
4.27
10.00
24
.00
0.30
0.07
8.30
5.27
10.05
24
.00
10-1
4 4.7
2 0.0
8 5.1
5 4.3
5 9.7
0 24
.00
0.23
0.02
8.43
5.23
10.10
24
.00
15 an
d ove
r 4.3
5 0.0
2 5.2
2 4.4
8 9.9
3 24
.00
0.23
0.00
8.10
5.38
10.27
24
.00
Child
ren,
par
ents
&
one g
rand
pare
nt
Unde
r 1
4.50
4.73
1.15
3.32
10.32
24
.00
0.47
0.47
8.27
4.60
10.20
24
.00
1-2
4.75
2.72
2.03
4.20
10.30
24
.00
0.32
0.32
8.08
4.98
10.27
24
.00
3-5
5.12
1.08
3.03
4.42
10.33
24
.00
0.28
0.28
8.28
5.13
10.20
24
.00
6-9
5.28
0.27
3.85
4.65
9.97
24.00
0.4
0 0.0
7 8.1
2 5.2
8 10
.15
24.00
10
-14
4.93
0.07
4.50
4.82
9.68
24.00
0.2
8 0.0
2 8.3
2 5.3
5 10
.05
24.00
15
and o
ver
4.82
0.03
4.43
4.73
9.97
24.00
0.3
0 0.0
0 7.6
8 5.6
8 10
.32
24.00
* H
ouse
work
exclu
ding c
hild c
are.
The o
ther c
atego
ries f
or ac
tivitie
s are
the s
ame a
s Tab
le 2-
8. Ho
urs s
pent
by th
e wife
/husb
and o
f the y
oung
est c
ouple
in th
e hou
seho
ld So
urce
. Stat
istics
Bur
eau:
Surve
y on t
ime u
se an
d leis
ure a
ctivit
ies (1
996)

36 Conditions of Work and Employment Series No. 5
Living with grandparent(s) has the effect of increasing the wife’s work. Wives in nuclear family households do not work for more than 3.5 hours per day on average, even if their children are grown up. In contrast, wives living with grandparents work about five hours per day when their children are teenagers. This is not because wives pass the burden of child care onto grandparents; child-care time spent by wives in three-generation households is as long as the time spent by wives in nuclear family households. Though wives’ housework time in three-generation households is shorter than in the nuclear family, the difference is small — a half-hour at most. The long work hours of wives in three-generation households are balanced with the short hours in tertiary activities. They work for longer time at the cost of leisure time.
Table 2-10 also demonstrates how men’s lives are independent of life-stages. Husbands’ time use shows no variation by children’s age or by household types, except for the slight increase in child-care time when they have young children. In particular, their work time keeps a constant level and is not affected by family affairs.
Implications of trends for the capacity of workers to meet their family and work responsibilities
As a result of such changes in household composition and in industrial structures seen above, it has been more difficult for workers to meet family and work responsibilities. Moreover, the aging population will constitute a heavy burden on families. The fixed idea regarding men’s work restricts the capacity of families to coordinate work and family matters. In this section, we will summarize those trends and will evaluate what types of families are in great need of support.
Decline of home-based business
In the past, most workers worked at home (see Table 2-7), including farmers, artisans, shopkeepers or their family workers. Such a work-system, which we call “home-based business”, allows workers to coordinate work and housework flexibly.
As a consequence of industrialization since the 1960s, people running home-based businesses have rapidly decreased in number. Working in a firm or in an office as an employee has replaced home-based business. Today, most workers work in workplaces separated from home. Flexible time-sharing between work and housework is difficult, because each should be done at home and at the workplace respectively.
Furthermore, as populations concentrate in the satellite cities around such megacities as Tokyo, Osaka and Nagoya, the distance between home and the workplace has become greater. A long commute squeezes workers’ time budget. This is another reason why harmonization of work and family matters is difficult for workers.
Conditions of Work and Employment Series No. 5 37
Less support by grandparents
Grandparents have been a valuable human resource in housework 13 for working parents (Maeda 1998). Three-generation households have an advantage over nuclear family households in sharing family responsibilities with grandparents.
Those resources are being depleted. Until the 1980s, three-generation households made up 30 per cent or more among households with children under 6 years old (see Table 2-4). The percentage of three-generation families then decreased. About 80 per cent of parents today have to bring up their child without the support of grandparents. This trend may exacerbate the work-family tension.
Emergence of nursing-care needs
Today, human resources allocated to nursing are few in number. According to the 1996 Survey on Time Use and Leisure Activity, only 0.7 per cent of men and 2.9 per cent of women do nursing (Statistics Bureau, 1998). If you restrict your attention to those who do any nursing, you will find that the average nursing time per day is 155 minutes for men and 169 minutes for women. A heavy burden of nursing is thus distributed to a few people.
Along with the aging population, care and support for aged person will engender serious social problems in future. National debates have already arisen about what system is suitable for supporting the aged population. Since 1995, the family care leave system, prescribed in the Child Care and Family Care Leave Law, has worked to support those caring for their family members. Since 2000, the nursing-care insurance system, which was passed in 1997, has covered aged people who need nursing care.
Inefficiency due to the male-exemption rule
Male work life is characterized by its independence from life-stages. The male employment rate is steady at a high level irrespective of age, in contrast to the female’s M-shaped curve (see Figure 2-4). Time-use data also show that men hardly shift their work time to housework or to child care (see Table 2-10). Though it is natural for anyone undertaking household responsibilities to shift their time dynamically according to the necessity of housework, men do not behave as naturally expected.
Social scientists argue that there is a prevalent unwritten rule that men should work as full-time workers, regardless of household responsibilities (Shimada, 1986, p. 28). The employment behavior of men and women in contemporary Japan can be explained as a result of rational choices in the household constrained by such unwritten rules (Higuchi, 1991; Tanaka, 1999). This unwritten rule exempts men from household responsibilities. We call this “the male-exemption rule”.
Since many families follow the male-exemption rule, women — not men — always carry the responsibility of balancing work and family. For example, in a typical nuclear family, only the wife undertakes family responsibilities even when the husband has time. Table 2-11 confirms the situation: male workers spend little time on housework irrespective of their working hours. More detailed quantitative analyses on couples’ time allocation also demonstrate that the length of husbands’ working hours has little effect on
13 It is notable that there is no difference found between wives’ child-care time in nuclear families and in three-generation families (Table 2-10); that is, grandparents do not substitute mothers for child care. They share only a part of the burden of young parents.

38 Conditions of Work and Employment Series No. 5
the sharing of housework between the husband and wife (Matsuda and Suzuki, 2002, p. 78; Tsuya and Bumpass, 2002, pp. 91 and 100). The male-exemption rule is thus the major obstacle to effective task sharing, without which human resources within the household will be properly allocated.
What kind of family are in the greatest need of support
Here we summarize what kind of family is in the greatest need of support. Families face a variety of external and internal conditions. Below we list the essential points determining needs of support for work-family affairs. A family satisfying the following conditions is probably in great need of support.
1. Families with members needing nursing cares (e.g. infant, aged, sick or handicapped person).
2. Families with only one member in charge of meeting work and family responsibilities:
(a) Only one member is capable of working (e.g. one-parent family), or
(b) Nuclear family governed by the male-exemption rule.
3. Families not running home-based business.
4. Families where a long commute is necessary for the breadwinner.
Work-family policies should aim to improve these conditions or support families under these conditions.
Although the current fertility rate is relatively lower than in the past, the absolute number of infants needing care is still large. The growing aging population will elevate needs for nursing care of aged people. Condition 1 above will thus continue to be forced upon large numbers of families.
Condition 2(a) may take on importance if marriage becomes more vulnerable and the number of one-parent families increases.
It is uncertain whether people will continue to follow the male-exemption rule in future. In case they reform the rule and start a gender-free allocation of human resources, condition 2(b) will decline in importance. Otherwise, it should be considered the most urgent problem because of its prevalence and due to the gender inequality resulting from it.
Condition 3 is a common characteristic of contemporary families. Home-based businesses, which constituted a large share in the economic system of the past, form only a small part of the current system. It might be possible, however, that new variants of home-based businesses, such as SOHO or telework, will become an important part of the future economy.
Condition 4 is a problem requiring prompt improvement. The population continues to be concentrated in megacities. Workers and their employers pay a considerable amount of time and money by commuting. It is a huge waste of resources. Reduction of commuting costs is desirable for the sake of both the family and the economy.

Conditions of Work and Employment Series No. 5 39
Tabl
e 2-1
1. Ti
me u
se o
f wor
kers
by w
orkin
g ho
urs
Fem
ale w
orke
rs
Male
work
ers
Wor
king
hour
s pe
r wee
k Ho
use-
work
Ch
ild
care
W
ork
Terti
ary
activ
ities
Pr
imar
y ac
tiviti
es
Tota
l Ho
use-
work
Ch
ild
care
W
ork
Terti
ary
activ
ities
Pr
imar
y ac
tiviti
es
Tota
l
Less
than
35
3.88
0.22
4.13
5.45
10.32
24
.00
0.43
0.02
5.82
6.98
10.77
24
.00
35 or
mor
e 2.2
3 0.1
2 6.9
5 4.4
3 10
.28
24.00
0.3
2 0.0
5 8.1
8 5.3
2 10
.15
24.00
Flexib
le 3.5
7 0.1
8 4.2
0 5.4
2 10
.62
24.00
0.3
7 0.0
3 6.8
5 6.1
5 10
.60
24.00
See T
able
2-10
So
urce
. Stat
istics
Bur
eau:
Surve
y on t
ime u
se an
d leis
ure a
ctivit
ies (1
996)


Conditions of Work and Employment Series No. 5 41
III. Working conditions and family support measures: Their impact on family
Time-related family support
In the 1980s, average total annual working hours in Japan, including non-scheduled working hours, exceeded 2,100 hours, and it was pointed out that Japanese workers were being made to work considerably longer than their counterparts in other developed countries. Consequently, the Japanese government fixed a target of 1,800 total annual working hours and, through such measures as the Revised Labour Standards Law, steadily brought about a reduction in working hours. By 2000, although the government target had not quite been reached, the total had dropped to 1,859 hours (Figure 3-1).
Figure 3-1. Yearly total of working hours
1700
1750
1800
1850
1900
1950
2000
2050
2100
2150
2200
198
0 8
1 8
2 8
3 8
4 8
5 8
6 8
7 8
8 8
9 9
0 9
1 9
2 9
3 9
4 9
5 9
6 9
7 9
8 9
9
200
0
Year
Hours
All industry Manufacturing
Source. Ministry of Health, Labour and Welfare: Monthly labour survey
As working hours are influenced by economic cycles, this influence merits consideration; however, if we compare the recent Japanese figures with those of manufacturing production workers in other countries, it can be seen that, while longer than Germany and France, the Japanese total is not dissimilar to that of the United Kingdom and the United States (Table 3-1).

42 Conditions of Work and Employment Series No. 5
Table 3-1. International comparison of working hours (production workers)
Year Japan USA UK Germany France 1988 2,189 1,962 1,948 1,618 1,682 1989 2,159 1,957 1,957 1,614 1,681 1990 2,124 1,948 1,953 1,598 1,683 1991 2,080 1,943 1,902 1,582 1,682 1992 2,017 1,957 1,911 1,570 1,682 1993 1,966 1,976 1,902 1,529 1,678 1994 1,966 2,005 1,920 1,542 1,679 1995 1,975 1,986 1,943 1,550 1,680 1996 1,993 1,986 1,929 1,517 1,679 1997 1,983 2,005 1,934 1,517 1,677 1998 1,947 1,991 1,925 1,672 1999 1,942 1,991 1,902 Source. Year book of labour statistics
Nevertheless, despite the gradual realization of a reduction in working hours, it is probably fair to say that this reduction has not had much effect in helping people to strike a good balance between career and family. There are several problematic issues here. Firstly, working hours are unlikely to decrease any further. Secondly, working hours are not flexible enough. Third is the inadequate amount of vacation. Fourthly, despite the legal implementation of child-care and family-care leave systems, there remain considerable obstacles to the taking of such leave. These issues are discussed in more detail below.
Working hours: Facts and policies
Changes in total annual working hours
Figure 3-1 shows the total annual working hours for all industries and for the manufacturing industry. Throughout the 1980s, the total annual working hours per person in Japan exceeded 2,100 hours, which was the highest total among the OECD countries at the time. Consequently, there were calls from both within Japan and abroad for reductions in working hours, resulting in much debate on reduced working hours by research groups and advisory councils set up by the Ministry of Labour, producing the "Working Hours Provisions Plan for Promoting Two Days Off per Week" (1980) and the "Plan for Promoting Reduced Working Hours" (1987).
Furthermore, in April 1988, the Revised Labour Standards Law came into effect whereby the legal total of working hours was reduced in stages to 46 then 44 hours per week. As Figure 3-1 shows clearly, this legal provision had a substantive effect on the reduction of total annual working hours. By the 1990s, the total had decreased to 1,900 hours and the government, setting a target of 1,800 total annual working hours, was adopting policies aimed at further reductions. The Revised Labour Standards Law of 1999 (Article 32) stipulated a further legal reduction in working hours: “(1) Employers are prohibited from making workers work for more than 40 hours per week, rest breaks excepted. (2) Employers are prohibited from making workers work for more than 8 hours on any one day of the week, rest breaks excepted.” 14
However, unlike in the late 1980s, it is not clear how effective these latest legal provisions have been in reducing total working hours. In fact, total working hours may have actually increased since the legislation came into force.
14 The stipulated total is 44 hours in the case of businesses with less than ten employees, film and theatre, health and sanitation, and recreation and entertainment companies.

Conditions of Work and Employment Series No. 5 43
Whether or not the legislation for reduced working hours will actually bring about a reduction in total working hours will depend, to a large extent, on the economic context. In 1988, the economic conditions in Japan were favourable, and because labour productivity increases in such conditions, this increase is redistributed via increased employment and higher hourly wages, which is unlikely to depend on either labour or management. On the other hand, in the latter half of the 1990s, with sluggish economic growth, neither employment nor wages were increasing. Accordingly, employers could not afford to consider working hour reductions that would cause a rise in real wages, and workers preferred employment security over wages. Consequently, it would seem that this time round the legislation for reduced working hours will be limited in its effectiveness.
Changes in working hours by industry
Let us examine how working hours differ according to industry and company size. Table 3-2 shows total monthly working hours for regular workers in 2000. From 167 hours in the utility industries to 193 hours in the transport and communications industries, the difference in working hours between all regular workers among industries is roughly 26 hours. If one posits 20 working days per month, this difference among industries works out at about 1.3 hours per day.
Table 3-2. Working hours by industry and size
Both sexes Male Female A. Industry
Mining 185 186 175
Construction 182 183 174
Manufacturing 183 186 178
Electricity/gas 167 168 162
Transportation/communication 193 194 174
Wholesale/retail 178 180 175
Finance/insurance 164 168 158
Real estate 175 177 170
Services 177 180 173
B. Size of establishment
Total 180 184 174
Over 1,000 persons 175 178 166
100 to 999 persons 181 184 174
Under 99 persons 185 188 177
Source. Ministry of Health, Labour and Welfare: Basic survey on wage structure (2000)
A similar difference can be observed according to company size. Irrespective of industry, the average total monthly working hours for regular workers in companies with more than 1,000 employees is 175 hours; in companies of between 100 and 999 employees, 181 hours; and in companies of less than 100 employees, 185 hours, revealing an overall difference of ten hours.
The problem of non-scheduled working hours and overtime rates
Further to the difficulty of further reducing working hours in Japan, we must also consider the length of non-scheduled working hours (hereafter “overtime”). Although

44 Conditions of Work and Employment Series No. 5
scheduled working hours have decreased yearly, overtime has not been significantly reduced. Figure 3-2 shows changes in overtime, with totals in manufacturing of 15 hours per month in the early 1980s, 20 hours per month in the late 1980s, and 14 hours per month in the 1990s. We saw above that total working hours were reduced in the late 1980s, but it seems that the bulk of this reduction consisted of decreases in scheduled working hours. It seems, moreover, that most Japanese companies responded to the good economic conditions of the late 1980s by increasing overtime. Disregarding the bubble period of the late 1980s, there is little evident change in figures for overtime.
Figure 3-2. Overtime
0
5
10
15
20
25
198
0 8
1 8
2 8
3 8
4 8
5 8
6 8
7 8
8 8
9 9
0 9
1 9
2 9
3 9
4 9
5 9
6 9
7 9
8 9
9
200
0
Year
Hours
All industry Manufacturing
Source. Ministry of Health, Labour and Welfare: Basic survey on wage structure
One reason for the length of overtime in Japan is that overtime premiums are low. The Labour Standards Law (Article 38) stipulates absolute minimum premiums of 25 per cent for overtime, 35 per cent for vacation work and 25 per cent for late-night work. The majority of Japanese companies tend to compensate overtime according to these provisions. Table 3-3 shows the results of a survey of 164 private sector companies undertaken in 2001 by Japan’s independent Institute of Industry and Labour Research. The average overtime compensation rate consists of a 27.3 per cent premium, with more than half of companies restricting compensation to the legally stipulated rates. Further, the average overtime premium for late-night work is 41.2 per cent, with about 40 per cent of companies paying a premium of more than 50 per cent. Moreover, as for vacation work, irrespective of statutory holidays or not, the average wage increase for companies paying overtime premiums is 37.1 per cent, with about 70 per cent of companies sticking to the legally stipulated rate. Differentiating between statutory and non-statutory holidays, for companies paying overtime premiums the average premium for statutory holidays is 35.1 per cent and for non-statutory holidays, 26.7 per cent.

Conditions of Work and Employment Series No. 5 45
Tabl
e 3-3
. Ave
rage
pre
miu
m ra
tes f
or o
verti
me w
ork a
nd it
s dist
ribut
ion
Prem
ium
rate
To
tal
25%
25
-30%
30
%
30-3
5%
35%
35
-40%
Ov
er 40
%
No an
swer
Av
erag
e Ov
ertim
e wor
k 10
0.0
51.8
5.5
28.0
1.2
3.7
---
0.6
9.1
27.3
Size
of f
irm
Over
1,00
0 per
sons
(6
6)
43.9
9.1
32.3
1.5
3.0
---
---
9.1
27.6
300-
999 p
erso
ns
(51)
51
.0 5.9
29
.4 2.0
5.9
---
2.0
3.9
27
.8
Unde
r 299
perso
ns
(47)
63
.8 ---
19
.1 ---
2.1
---
---
14
.9 26
.4
Pr
emiu
m ra
te
Tota
l 25
%
25-3
0%
30%
30
-35%
35
%
35-4
0%
40%
40
-50%
50
%
Over
50%
No
an
swer
Av
erag
e
Wor
k on a
day o
ff 10
0.0
17.7
---
13.4
1.2
9.1
1.2
6.1
1.2
24.4
15.2
10.4
41.2
Size
of f
irm
Over
1,00
0 per
sons
(6
6)
18.2
---
16.7
1.5
13.6
3.0
7.6
3.0
13.6
15.2
7.6
38.8
300-
999 p
erso
ns
(51)
21
.6 ---
9.8
2.0
3.9
---
3.9
---
35
.3 17
.6 5.9
44
.0
Unde
r 299
perso
ns
(47)
12
.8 ---
12
.8 ---
8.5
---
6.4
---
27
.7 12
.8 19
.1 41
.5
Note:
Figu
re is
the r
esult
of a
surve
y und
ertak
en in
2000
. So
urce
. Insti
tute o
f Indu
stry a
nd La
bour
Res
earch

46 Conditions of Work and Employment Series No. 5
The problem of “service overtime”
The problem of so-called “service overtime” (unpaid overtime working hours) is widespread. This type of overtime is illegal and, as it evades the payment of overtime premiums, should be completely eradicated. However, as general labour statistics do not include surveys of service overtime, it is difficult to get a grasp of the actual situation, and political measures to deal with the problem are thoroughly lacking.
According to the Japanese Trade Union Confederation (Rengo) (Rengo, 1999) 49.6 per cent of workers engaged in service overtime, with 15.1 per cent doing so “very frequently”, 5.5 per cent “about half the days in a month”, and 29 per cent “sometimes”. What is more, the average amount for trade union members doing more than one hour of service overtime was 29.3 hours per month. Service overtime was most common in specialized and technical work, and in sales, retail and services. As many as 17.8 per cent of male workers in sales, retail and services did over 40 hours of service overtime per month, as did more than 15.3 per cent of female workers in specialized and technical work. In the white-collar sector in Europe and the United States, workers exempt under labour law are said to work long hours, but in Japan, even non-exempt workers constantly work overtime. In order for workers to be able to successfully balance work and family life, the eradication of service overtime needs to be prioritized.
Flexible working hours
The 1987 revisions to the Labour Standards Law introduced a modified working schedule system based on three-month units, while the 1993 revisions recognized a modified working schedule system based on units of one year. This system, which aims to increase vacation time on a yearly basis, is held to be valuable in bringing about reductions in overtime. The modified working schedule system based on one-year units is explained as being “based on the premise that, except where unavoidable, constant overtime will not be the norm, as working hours are to be alloted with foresight according to expected busy periods and lulls” (Labour Standards Bureau, Ministry of Labour). In other countries, Canada and France recognize modified working schedule systems based on one-year units, while in Germany, the unit is six months; the United States holds to a maximum unit of 52 weeks.
Figure 3-3 shows the percentage of companies that have introduced the modified working schedule system and the percentage of workers to which it applies. In 1988, 7.0 per cent of companies had introduced the system and it applied to 15.3 per cent of workers; in 2000, these figures had risen to 54.3 and 49.5 per cent respectively. However, neither figure has, in fact, risen since 1997.
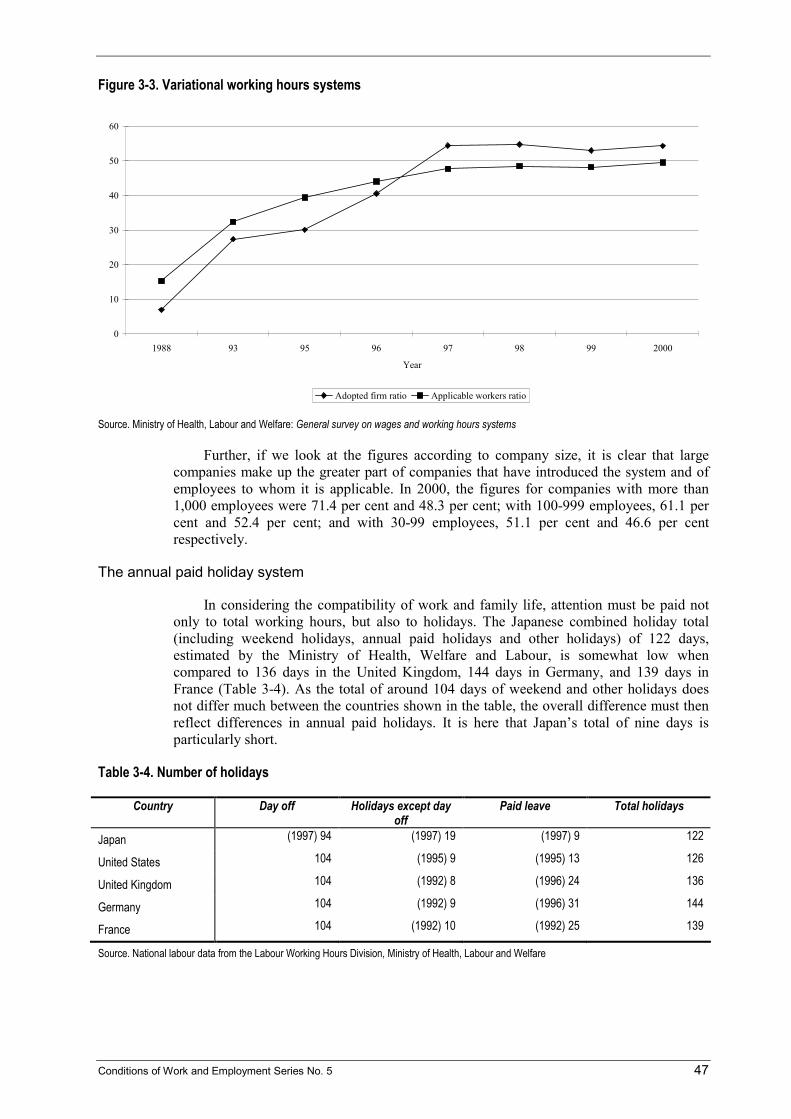
Conditions of Work and Employment Series No. 5 47
Figure 3-3. Variational working hours systems
0
10
20
30
40
50
60
1988 93 95 96 97 98 99 2000
Year
Adopted firm ratio Applicable workers ratio
Source. Ministry of Health, Labour and Welfare: General survey on wages and working hours systems
Further, if we look at the figures according to company size, it is clear that large companies make up the greater part of companies that have introduced the system and of employees to whom it is applicable. In 2000, the figures for companies with more than 1,000 employees were 71.4 per cent and 48.3 per cent; with 100-999 employees, 61.1 per cent and 52.4 per cent; and with 30-99 employees, 51.1 per cent and 46.6 per cent respectively.
The annual paid holiday system
In considering the compatibility of work and family life, attention must be paid not only to total working hours, but also to holidays. The Japanese combined holiday total (including weekend holidays, annual paid holidays and other holidays) of 122 days, estimated by the Ministry of Health, Welfare and Labour, is somewhat low when compared to 136 days in the United Kingdom, 144 days in Germany, and 139 days in France (Table 3-4). As the total of around 104 days of weekend and other holidays does not differ much between the countries shown in the table, the overall difference must then reflect differences in annual paid holidays. It is here that Japan’s total of nine days is particularly short.
Table 3-4. Number of holidays
Country Day off Holidays except day off
Paid leave Total holidays
Japan (1997) 94 (1997) 19 (1997) 9 122
United States 104 (1995) 9 (1995) 13 126
United Kingdom 104 (1992) 8 (1996) 24 136
Germany 104 (1992) 9 (1996) 31 144
France 104 (1992) 10 (1992) 25 139
Source. National labour data from the Labour Working Hours Division, Ministry of Health, Labour and Welfare
48 Conditions of Work and Employment Series No. 5
Provision rates for annual paid holidays
The explanation for Japan having less annual paid holidays than Western countries lies in the fact that the number of annual paid holidays provided is low. The Labour Standards Law (Article 39) stipulates that a worker who has worked for more than 80 per cent of all working days for the first six months of his/her employment must be given ten days’ paid holiday. The Law further stipulates that workers who remain in employment for 18 months must be given an additional one day of paid holiday each year. Moreover, the 1987 revision to the Law stipulates the provision of annual paid holiday to part-time workers but, as is shown in table 3-4, the number of days is decided proportional to the number of years and regular days worked.
Table 3-5 shows numbers of days of paid holidays provided. In 1980, the average (across industry and company size) was 14.4 days, while in 1999 an average of 17.8 annual paid holidays were provided, showing a yearly increase. On the other hand, one must differentiate according to industry and company size. In 1999, in the utilities industry, the provision was 20.1 days, while in the less generous service sector, it was 17.2 days; a difference of roughly three days. Again, in companies with over 1,000 employees, the provision was 19.2 days, and in companies with 30-99 employees, it was 16.0 days; a difference of roughly three days. These differences probably, in part, reflect differences in provision according to total years worked; however, this does not discount the existence of differences according to industry and company size.
This 1999 average of between 17 and 20 annual paid holidays is small by comparison with the France, Germany and the United Kingdom.
Taking of annual paid holidays
The difference in numbers of holidays between Japan and the West is not only due to low provision of annual paid holidays in Japan. It is also the case that workers in Japan take few paid holidays, and this is a serious problem. Table 3-6 shows numbers of days taken and the rate of taking (= number of days taken ÷ number of days provided), with 8.8 days taken in 1980 rising to only 9.0 days taken in 1999 — a minimal increase. As the number of days provided rose over the same period, moreover, the taking rate decreased from 61.3% in 1980 to 50.5% in 1999. With increases in the provision of annual paid holidays evidently unrelated to the taking thereof, such that less days are taken than the ten days stipulated by law, it is clear that the circumstances surrounding the taking of annual paid holiday constitute a serious hindrance to the compatibility of work and family life.

Conditions of Work and Employment Series No. 5 49
Tabl
e 3-5
. Leg
al an
nual
leave
with
pay
Norm
al ye
arly
work
ing
days
6 m
onth
s 18
mon
ths
30 m
onth
s 42
mon
ths
54 m
onth
s 66
mon
ths
78 m
onth
s 90
mon
ths
102
mon
ths
114
mon
ths
Over
126
mon
ths
Part-
time w
orke
r
48 to
72 da
ys
1 day
s 2 d
ays
2 day
s 2 d
ays
2 day
s 2 d
ays
3 day
s 3 d
ays
3 day
s 3 d
ays
3 day
s
73 to
120 d
ays
3 day
s 4 d
ays
4 day
s 4 d
ays
5 day
s 5 d
ays
6 day
s 6 d
ays
6 day
s 7 d
ays
7 day
s
121 t
o 168
days
5 d
ays
6 day
s 6 d
ays
7 day
s 7 d
ays
8 day
s 9 d
ays
9 day
s 10
days
10
days
11
days
169 t
o 216
days
7 d
ays
8 day
s 9 d
ays
10 da
ys
10 da
ys
11 da
ys
12 da
ys
12 da
ys
13 da
ys
14 da
ys
15 da
ys
Regu
lar w
orke
r 10
days
11
days
12
days
13
days
14
days
15
days
16
days
17
days
18
days
19
days
20
days
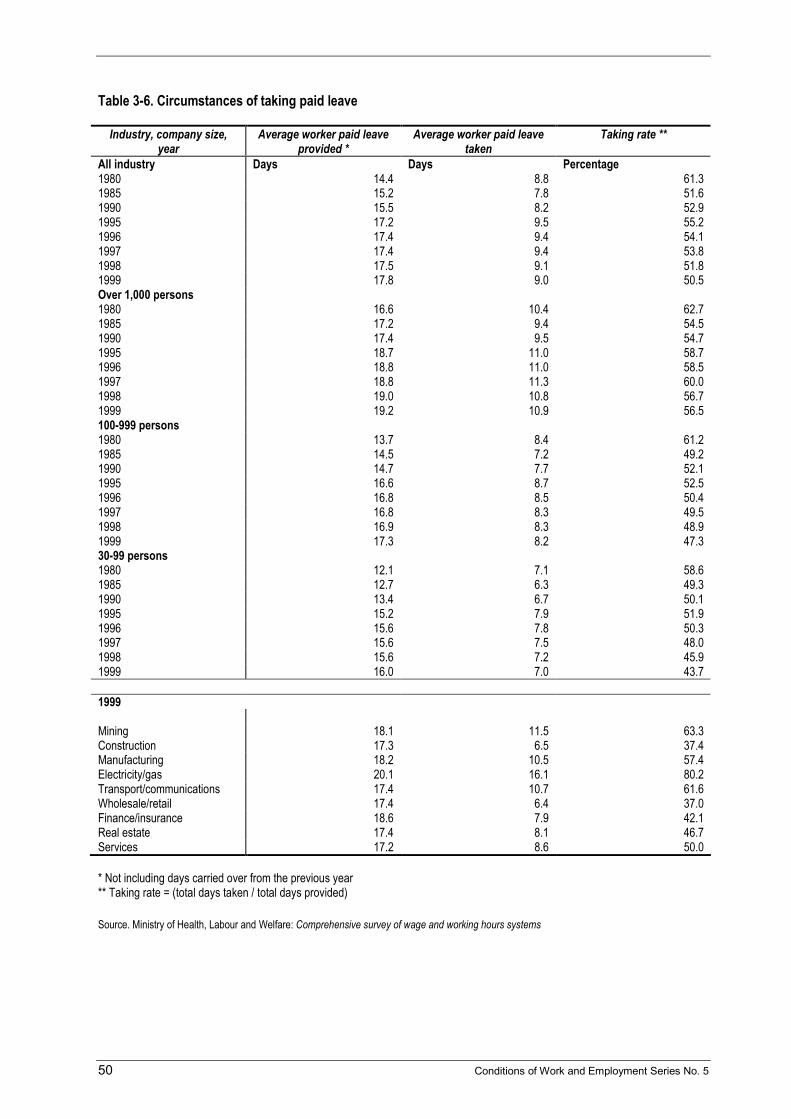
50 Conditions of Work and Employment Series No. 5
Table 3-6. Circumstances of taking paid leave
Industry, company size, year
Average worker paid leave provided *
Average worker paid leave taken
Taking rate **
All industry Days Days Percentage 1980 14.4 8.8 61.3 1985 15.2 7.8 51.6 1990 15.5 8.2 52.9 1995 17.2 9.5 55.2 1996 17.4 9.4 54.1 1997 17.4 9.4 53.8 1998 17.5 9.1 51.8 1999 17.8 9.0 50.5 Over 1,000 persons 1980 16.6 10.4 62.7 1985 17.2 9.4 54.5 1990 17.4 9.5 54.7 1995 18.7 11.0 58.7 1996 18.8 11.0 58.5 1997 18.8 11.3 60.0 1998 19.0 10.8 56.7 1999 19.2 10.9 56.5 100-999 persons 1980 13.7 8.4 61.2 1985 14.5 7.2 49.2 1990 14.7 7.7 52.1 1995 16.6 8.7 52.5 1996 16.8 8.5 50.4 1997 16.8 8.3 49.5 1998 16.9 8.3 48.9 1999 17.3 8.2 47.3 30-99 persons 1980 12.1 7.1 58.6 1985 12.7 6.3 49.3 1990 13.4 6.7 50.1 1995 15.2 7.9 51.9 1996 15.6 7.8 50.3 1997 15.6 7.5 48.0 1998 15.6 7.2 45.9 1999 16.0 7.0 43.7 1999 Mining 18.1 11.5 63.3 Construction 17.3 6.5 37.4 Manufacturing 18.2 10.5 57.4 Electricity/gas 20.1 16.1 80.2 Transport/communications 17.4 10.7 61.6 Wholesale/retail 17.4 6.4 37.0 Finance/insurance 18.6 7.9 42.1 Real estate 17.4 8.1 46.7 Services 17.2 8.6 50.0 * Not including days carried over from the previous year ** Taking rate = (total days taken / total days provided) Source. Ministry of Health, Labour and Welfare: Comprehensive survey of wage and working hours systems

Conditions of Work and Employment Series No. 5 51
Working hours and private life for men and women
The Law for Equal Employment Opportunity for Men and Women (hereafter the Equal Opportunity Law), enacted in 1985, aimed at equal opportunities for, and equal treatment of, men and women in the field of employment, and prohibited discriminatory treatment of female workers. The Law was revised in 1997 and the equality of employment opportunity more stringently emphasized. Further, a noteworthy point is that the revised law deleted the phrases “increased welfare for female workers” and “harmony between work and family life” from Article 1. It is mentioned in this context that the change occurred with a view to female protection and sexual equality. It came to be pointed out that protection regulations for women rather restricted their adoption and promotion. While the Equal Opportunity Law forces a company into treating men’s and women’s employment opportunities equally, the Labour Standard Law forces a company into female protection regulation. For this reason, a company has high expenses in employing women. It will be necessary to solve the trade-off problem between equal employment opportunity and the labour costs of female protection.
As a result, at the same time as the Equal Opportunity Law was enacted, the Labour Standards Law was revised, and regulations restricting overtime, vacation and late-night work for women were repealed, thus abolishing discrimination between men and women in terms of working hours. In actual fact, although there was a legal revision, total working hours for regular female workers are about ten hours less than for men, and this pattern does not change from before.
The trade-off between working hours and private time
The difference between men’s and women’s working hours is due in part to their working in different industries; however, the fact that the difference is influenced by a deep-rooted way of thinking that allocates roles according to gender must not be overlooked.
Table 3-7 shows the breakdown in hours of an average day for men and women who chiefly work, women who work while doing housework, and women who chiefly do housework. For men and women who chiefly work, women work 6.13 hours, while men work almost an hour longer at 7.10 hours. On the other hand, women do 1.37 hours of housework compared to men, who do not more than 0.07 hours. Perhaps it is because women are doing most of the housework that they spend less time at work.
Furthermore, women who work while doing housework spend 3.39 hours at work and 3.36 hours doing housework. Women who do not work spend 4.24 hours on housework. Compared with women who chiefly work, women who focus on housework spend two to three hours longer at it per day.
In terms of economic theory, it is thought that, as long as an individual is maximizing his/her effectiveness, it does not matter how time is allocated. However, it is unclear as to whether the time allocations for men and women in Table 3-7 are the results of maximizing individual effectiveness. The following facts may shed some light on this issue. Firstly, the labour force participation rate for women in Japan is rising, as is their length of employment; however, this is largely due to a rise in women who stay unmarried. Secondly, women who work after giving birth and raising children mostly work as part-timers rather than full-timers. Thirdly, a high percentage of women working full time live with either their husbands or parents.

52 Conditions of Work and Employment Series No. 5
Table 3-7. Time spent per day on activities by sex (weekly average)
Main activity Male( working) Female (working) Female (working and housework)
Female (housework only)
Sleeping 7.42 7.24 7.18 7.38
Personal care 0.56 1.21 1.16 1.18
Meals 1.34 1.34 1.45 1.53
Commute to and from work 0.49 0.41 0.18 0.00
Household work 7.10 6.13 3.39 0.06
Nursing 0.07 1.37 3.36 4.24
Child care 0.01 0.02 0.06 0.09
Shopping 0.03 0.07 0.15 0.46
Move 0.11 0.26 0.37 0.48
TV/radio/newspaper/magazine 2.18 1.51 2.14 3.03
Relaxation 1.03 0.58 1.05 1.23
Study 0.06 0.06 0.05 0.06
Hobbies 0.34 0.21 0.23 0.39
Sports 0.11 0.06 0.07 0.09
Social activities 0.04 0.02 0.05 0.05
Acquaintances 0.27 0.28 0.22 0.29
Cure 0.04 0.04 0.05 0.11
Other 0.14 0.16 0.22 0.27
First activity 10.13 10.20 10.19 10.48
Second activity 8.20 9.06 8.31 6.13
Third activity 5.26 4.34 5.10 6.59
Source. Statistics Bureau: Survey on time use and leisure
The increase in non-marriage
In Japan, where few children are born outside of marriage, the rise of unmarried persons is contributing to the declining birthrate. Figure 3-4 shows the changes in the rate of non-marriage, and that the rate is increasing yearly.
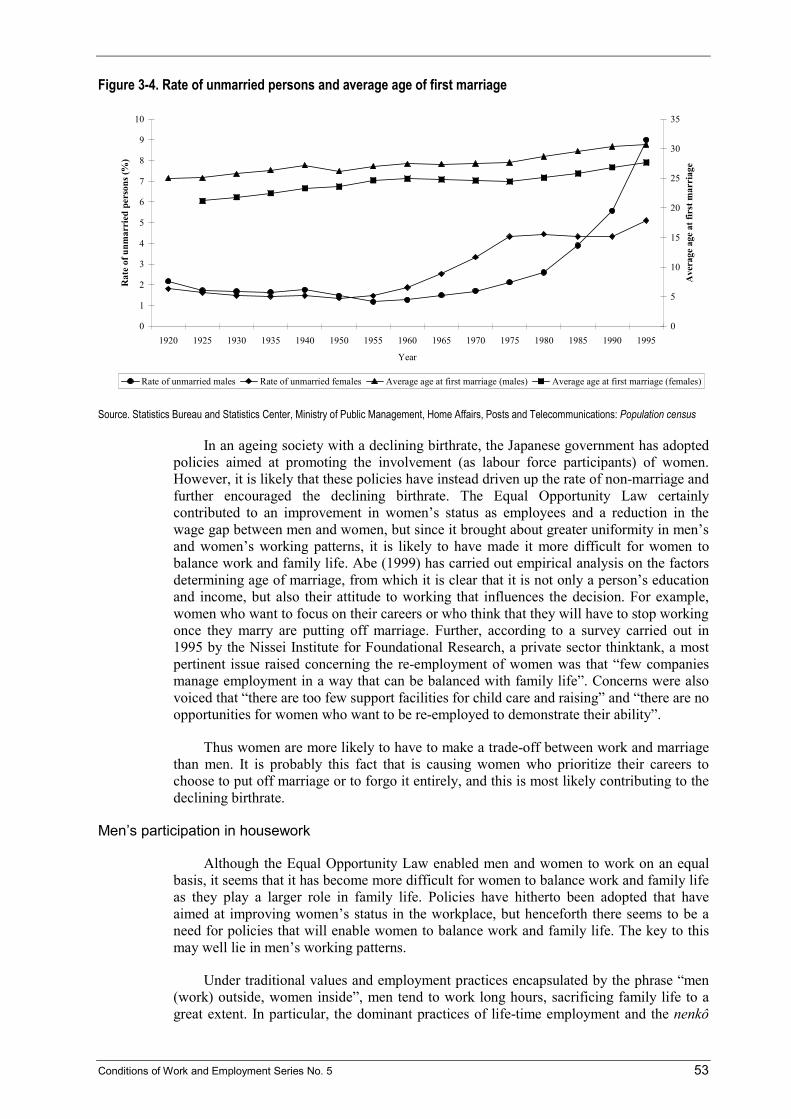
Conditions of Work and Employment Series No. 5 53
Figure 3-4. Rate of unmarried persons and average age of first marriage
0
1
2
3
4
5
6
7
8
9
10
1920 1925 1930 1935 1940 1950 1955 1960 1965 1970 1975 1980 1985 1990 1995
Year
Rat
e of
unm
arri
ed p
erso
ns (%
)
0
5
10
15
20
25
30
35
Ave
rage
age
at f
irst
mar
riag
e
Rate of unmarried males Rate of unmarried females Average age at first marriage (males) Average age at first marriage (females)
Source. Statistics Bureau and Statistics Center, Ministry of Public Management, Home Affairs, Posts and Telecommunications: Population census
In an ageing society with a declining birthrate, the Japanese government has adopted policies aimed at promoting the involvement (as labour force participants) of women. However, it is likely that these policies have instead driven up the rate of non-marriage and further encouraged the declining birthrate. The Equal Opportunity Law certainly contributed to an improvement in women’s status as employees and a reduction in the wage gap between men and women, but since it brought about greater uniformity in men’s and women’s working patterns, it is likely to have made it more difficult for women to balance work and family life. Abe (1999) has carried out empirical analysis on the factors determining age of marriage, from which it is clear that it is not only a person’s education and income, but also their attitude to working that influences the decision. For example, women who want to focus on their careers or who think that they will have to stop working once they marry are putting off marriage. Further, according to a survey carried out in 1995 by the Nissei Institute for Foundational Research, a private sector thinktank, a most pertinent issue raised concerning the re-employment of women was that “few companies manage employment in a way that can be balanced with family life”. Concerns were also voiced that “there are too few support facilities for child care and raising” and “there are no opportunities for women who want to be re-employed to demonstrate their ability”.
Thus women are more likely to have to make a trade-off between work and marriage than men. It is probably this fact that is causing women who prioritize their careers to choose to put off marriage or to forgo it entirely, and this is most likely contributing to the declining birthrate.
Men’s participation in housework
Although the Equal Opportunity Law enabled men and women to work on an equal basis, it seems that it has become more difficult for women to balance work and family life as they play a larger role in family life. Policies have hitherto been adopted that have aimed at improving women’s status in the workplace, but henceforth there seems to be a need for policies that will enable women to balance work and family life. The key to this may well lie in men’s working patterns.
Under traditional values and employment practices encapsulated by the phrase “men (work) outside, women inside”, men tend to work long hours, sacrificing family life to a great extent. In particular, the dominant practices of life-time employment and the nenkô

54 Conditions of Work and Employment Series No. 5
wage profile foster long-term employment competition among workers and, at the same time, the internal company information structure of Japanese companies, known as “the tacit knowledge” and “human networking”, subordinates workers to the company. These employment practices are reflected in long working hours for male workers and unpaid overtime.
The practice of unaccompanied (by family) job transfers is also a problem. According to the Ministry of Health, Labour and Welfare’s Comprehensive Survey of Wage and Working Hours Systems, in 1998 28.1 per cent of companies made personnel transfers that required a change of address, and 19.1 per cent of companies transferred married workers without their spouses. The larger the company, the higher the percentage in this regard: for companies with over 1,000 employees, the figures are 90.9 per cent and 79.4 per cent respectively. As for total numbers of married workers transferred without their spouses, the figure in December 1998 was 314,000: an increase of 60,000 on the previous (1994) survey’s total (see Table 3-8). This practice is detrimental to family life in a number of ways.
Part-timers and their employment conditions
Gender-based division of labour for women in the workplace is disappearing; however, they still have to shoulder the same role in the home that they always have. Accordingly, even if women want to work full time, the long working hours of men and their minimal participation in housework make it difficult for them to do so, and the proportion of married women working as part-timers is as high as ever. As Table 3-9 shows, the proportion of employees who are part-time workers is increasing, and the majority of these are women. Moreover, research undertaken by the Ministry of Labour (1994) shows that about 30 per cent of part-time workers would like to work full time, but are working as part-timers because full-time employment conditions do not accommodate their needs.
Table 3-10 shows working hours for part-time workers. The average for all industries and company sizes shows a slight decrease from 5.9 hours per day in 1991 to 5.5 hours in 1999. The figures by company size show little variation in working hours, unlike the case for regular workers. On the other hand, part-time workers in manufacturing work roughly one hour longer than those in wholesale, small retailers and the service sector. Average working hours for part-timers in manufacturing in 1999 were 6.2 hours; only about 2.7 hours shorter than the 8.9 hours of regular workers. It has been pointed out that part-timers in Japan work within almost the same system as regular workers, giving rise to the appellation “regular part-timers”. The greater part of part-timers, therefore, do the same work as regular workers, only under a different name, while their wage levels and systems differ drastically.

Conditions of Work and Employment Series No. 5 55
Tabl
e 3-8
. Rat
e of w
orke
rs te
mpo
raril
y tra
nsfe
rred
with
out f
amily
to to
tal e
mpl
oyee
s Av
erag
e num
ber o
f mar
ried
pers
ons
All
firm
s Co
mpa
nies
tra
nsfe
rring
em
ploy
ees t
o a n
ew ad
dres
s
Com
pani
es
with
mar
ried
trans
fere
es
Wom
en
mar
ried
trans
fere
es
Tota
l nu
mbe
r of
mar
ried
trans
fere
es
Tota
l num
ber o
f wo
men
mar
ried
trans
fere
es
All
com
pani
es
Com
pani
es w
ith tr
ansf
eree
s re
quiri
ng a
chan
ge o
f ad
dres
s
Com
pani
es w
ith
mar
ried
trans
fere
es
%
%
%
%
By 10
0 pe
rson
s By
100 p
erso
ns
Pers
ons
Pers
ons
Pers
ons
By ye
ar
19
90
100
20.1
15.7
---
2,047
---
2.1
10
.6 13
.6 19
94
100
20.2
15.9
0.2
2,540
5
2.4
12.1
15.3
1999
10
0 28
.1 19
.1 0.4
3,1
41
9 2.6
9.4
13
.8 By
size
of f
irm
Ov
er 1,
000 p
erso
ns
100
90.9
79.4
5.0
1,977
5
73.8
81.2
93.0
100-
999 p
erso
ns
100
53.5
39.4
0.9
893
3 2.7
5.1
7.0
30
-99 p
erso
ns
100
16.2
9.3
0.0
272
1 0.3
2.0
3.5
So
urce
. Insti
tute o
f Indu
stry a
nd La
bour
Res
earch
surve
y (20
00)
Tabl
e 3-9
. Num
bers
of e
mpl
oyee
s and
par
t-tim
ers b
y gen
der
Both
sexe
s Ma
le Fe
male
Ye
ar
Empl
oyee
s +
Part-
timer
s *
Shar
e **
Empl
oyee
s *
Part-
timer
s *
Shar
e **
Empl
oyee
s *
Part-
timer
s *
Shar
e **
1987
4,0
48
561
14
2,541
92
4
1,507
46
9 31
19
88
4,132
59
9 14
2,5
77
104
4 1,5
55
496
32
1989
4,2
69
656
15
2,636
12
3 5
1,634
53
3 33
19
90
4.369
71
0 16
2,6
74
126
5 1,6
95
584
34
1991
4,5
36
734
16
2,752
13
1 5
1,784
60
3 34
19
92
4,664
78
2 17
2,8
20
143
5 1,8
43
638
35
1993
4,7
43
801
17
2,881
15
4 5
1,862
64
7 35
19
94
4,776
80
0 17
2,8
81
145
5 1,8
95
656
35
1995
4,7
80
825
17
2,876
15
0 5
1,904
67
5 35
19
96
4,843
87
0 18
2.9
09
170
6 1,9
35
700
36
1997
4,9
63
945
19
2,950
19
0 6
2,014
75
4 37
19
98
4,967
98
6 20
2,9
39
195
7 2,0
28
791
39
1999
4,9
13
1,024
21
2,9
17
207
7 1,9
96
817
41
2000
4,9
03
1,078
22
2,8
92
232
8 2,0
11
846
42
* Ten
thou
sand
peop
le **
Perce
ntage
shar
e of p
art-t
imer
s to e
mploy
ees
Sour
ce. M
inistr
y of P
ublic
Man
agem
ent, H
ome A
ffairs
, Pos
t and
Tele
comm
unica
tions
: Lab
our f
orce
surv
ey sp
ecial
surve
y

56 Conditions of Work and Employment Series No. 5
Table 3-10. Hours per day and monthly labour days for part-time workers
1991 1992 1993 1994 1995 1996 1997 1998 1999 Hours per day Total 5.9 5.8 5.7 5.7 5.7 5.6 5.7 5.5 5.5 Over 1,000 5.7 5.7 5.5 5.5 5.4 5.4 5.4 5.4 5.4 100-999 6.0 5.8 5.8 5.8 5.8 5.7 5.8 5.6 5.7 10-99 5.9 5.8 5.7 5.7 5.7 5.7 5.8 5.6 5.6 Manufacturing 6.3 6.2 6.2 6.2 6.2 6.2 6.2 6.1 6.2 Wholesale/retail 5.6 5.6 5.5 5.4 5.4 5.4 5.4 5.3 5.3 Service sector 5.5 5.4 5.4 5.4 5.4 5.4 5.5 5.4 5.4 Monthly labour day Total 21.2 20.9 19.9 20.3 20.2 20.0 19.8 19.4 19.4 Over 1,000 20.4 20.1 19.1 19.9 19.6 19.4 19.1 18.9 18.7 100-999 21.4 20.9 20.1 20.8 20.6 20.3 20.2 19.8 19.9 10-99 21.4 21.2 20.1 20.5 20.4 20.1 20.0 19.5 19.7 Manufacturing 21.2 20.9 20.1 20.6 20.5 20.6 20.4 20.1 20.2 Wholesale/retail 21.3 21.0 19.7 20.0 20.1 19.8 19.6 19.2 19.3 Service sector 21.2 21.0 20.0 20.5 20.3 19.9 19.8 19.4 19.0 Source. Ministry of Health, Labour and Welfare: Basic survey on wage structure
Hourly wages for part-time workers in Japan are, as is shown in Table 3-11, lower than those of regular workers. If we set hourly wages for regular workers at 100, then we can see that, with part-time wages falling from 71 in 1991 to 67 in 1999, the gap is widening. The majority of married women who stop working to give birth and raise children then opt for part-time work in order to balance work and family life, but this of course means that they are then engaging in work with relatively lower wages. It is not an exaggeration to say that this shows that married women are making quite a sacrifice in order to balance work and family life. There is a need to lessen the burden on part-time workers who have to juggle their schedules, and to correct the difference in wage levels between part-timers and regular workers by applying the principle of same work, same pay. However, raising the relative wages of part-time workers would be a case of putting the cart before the horse, as the demand for part-time workers would then fall.
Table 3-11. Hourly wages for regular workers and part-time workers (in yen)
1991 1992 1993 1994 1995 1996 1997 1998 1999 Female Regular workers [1] 1,072 1,127 1,187 1,201 1,213 1,255 1,281 1,295 1,318 Part-timers workers [2] 770 809 832 848 854 870 871 886 887 [2] ÷ [1] 0.72 0.72 0.70 0.71 0.70 0.69 0.68 0.68 0.67 Male Regular workers [1] 1,756 1,812 1,904 1,915 1,919 1,976 2,006 2,002 2,016 Part-time workers [2] 1,023 1,053 1,046 1,037 1,061 1,071 1,037 1,040 1,025 [2] ÷ [1] 0.58 0.58 0.55 0.54 0.55 0.54 0.52 0.52 0.51 Source. Ministry of Health, Labour and Welfare: Basic survey on wage structure
Division of labour within the family and society’s role
There are also working women who leave some of the housework to their parents. Empirical analysis on the probability of women finding work shows that women in extended families (living with parents) are more likely than those in nuclear families to gain employment, and that living with parents is an important determinant in women’s employment [see, for example, Higuchi (1991)]. Living with parents greatly influences the behavioural patterns of women under 40, while the question of whether or not parents can help during childbirth and child-rearing greatly influences their employment patterns. Kishi (2002) finds out the reverse correlation between the female labour force rate and the standby child rate for nurseries (= the number of children on waiting lists for entering

Conditions of Work and Employment Series No. 5 57
nurseries ÷ the number of children whose parents hope to enter them into nurseries); the difficulty to look for the nursery in the area with many standby children makes it difficult for women with infants to work or find a job.
The Child-care Leave Law and its effects
Here we consider the issue of trade-off between work and private time that workers face during their lifecycle. First we consider the trade-off between childbirth and child care and work.
The Labour Standards Law provides for leave before and after childbirth, such that employers must grant leave to any woman who applies for it who is due to give birth within six weeks, and in principal must not force a woman to work for eight weeks following childbirth. 15 Further, the law demands that employers allow the necessary time off to pregnant women for health checks and guidance, and gives workers the right to demand two periods of nursing time (minimum 30 minutes) each day for one year after childbirth.
Moreover, with the establishment of the Childcare Leave Law in 1991 (enacted in 1992), workers can take child-care leave on request in order to rear children under 1 year of age. However, the 1991 law did not stipulate income guarantees for workers on child-care leave. As a result, the 1994 revision of the Employment Insurance Law established a benefits system for child-care leave, providing for 40 per cent of standard compensation. Further, while leave before and after childbirth is limited to women, child-care leave can be taken by either parent.
Rates of taking, and the effectiveness of, child-care leave
Waldfogel, Higuchi and Abe (1999) have compared Japan, the United States and the United Kingdom as to what effects the respective child-care leave systems had on women working until right before childbirth. Table 3-12 shows how the employment situation of women changed during the year of childbirth, and how these changes differed according to whether they were able to use child-care leave or childbirth leave systems. The percentage of women working during the year before the birth of their youngest child (the child born most recently at the time of the survey) was 38.5 per cent in Japan, 63.4 per cent in the United States, and 53.3 per cent in the United Kingdom, with the Japanese rate low compared to the other two countries. Nevertheless, of women working during the year before childbirth, the percentage working in the same company the year after childbirth (the continued employment rate) was 54.9 per cent in Japan, 56.7 per cent in the United States, and 52.1 per cent in the United Kingdom, with little difference between the countries. Moreover, if we calculate the difference in the continued employment rate between those who can and cannot use the child-care (childbirth) leave systems, the Japanese figure of 43.6 percentage points (79.2%-35.6%), as compared to the United States’ 21.7 percentage points (63.4%-42.6%) and the United Kingdom’s 16.9 percentage points (60.1%-43.2%) shows that Japan’s child-care leave system is relatively more effective than those of the other two countries. These results, if controlled for age, education and continuous years worked, show that the child-care (childbirth) leave systems have a positive influence on continued employment after childbirth in each country, but that the effect is particularly great in Japan. Moreover, Higuchi and Abe (1992) have analysed how the child-care leave system has affected the length of employment of women
15 When six weeks have passed since childbirth and the woman requests leave, it is possible for an employer to engage her in work approved by a doctor.
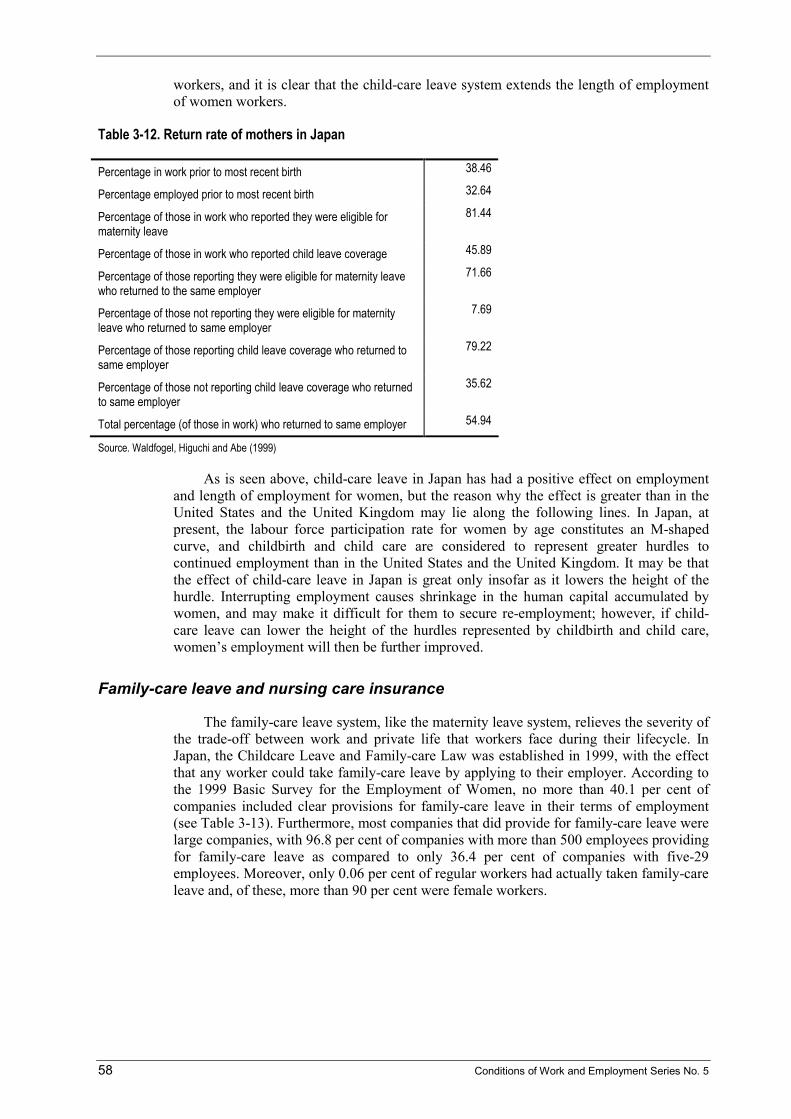
58 Conditions of Work and Employment Series No. 5
workers, and it is clear that the child-care leave system extends the length of employment of women workers.
Table 3-12. Return rate of mothers in Japan
Percentage in work prior to most recent birth 38.46
Percentage employed prior to most recent birth 32.64
Percentage of those in work who reported they were eligible for maternity leave
81.44
Percentage of those in work who reported child leave coverage 45.89
Percentage of those reporting they were eligible for maternity leave who returned to the same employer
71.66
Percentage of those not reporting they were eligible for maternity leave who returned to same employer
7.69
Percentage of those reporting child leave coverage who returned to same employer
79.22
Percentage of those not reporting child leave coverage who returned to same employer
35.62
Total percentage (of those in work) who returned to same employer 54.94
Source. Waldfogel, Higuchi and Abe (1999)
As is seen above, child-care leave in Japan has had a positive effect on employment and length of employment for women, but the reason why the effect is greater than in the United States and the United Kingdom may lie along the following lines. In Japan, at present, the labour force participation rate for women by age constitutes an M-shaped curve, and childbirth and child care are considered to represent greater hurdles to continued employment than in the United States and the United Kingdom. It may be that the effect of child-care leave in Japan is great only insofar as it lowers the height of the hurdle. Interrupting employment causes shrinkage in the human capital accumulated by women, and may make it difficult for them to secure re-employment; however, if child-care leave can lower the height of the hurdles represented by childbirth and child care, women’s employment will then be further improved.
Family-care leave and nursing care insurance
The family-care leave system, like the maternity leave system, relieves the severity of the trade-off between work and private life that workers face during their lifecycle. In Japan, the Childcare Leave and Family-care Law was established in 1999, with the effect that any worker could take family-care leave by applying to their employer. According to the 1999 Basic Survey for the Employment of Women, no more than 40.1 per cent of companies included clear provisions for family-care leave in their terms of employment (see Table 3-13). Furthermore, most companies that did provide for family-care leave were large companies, with 96.8 per cent of companies with more than 500 employees providing for family-care leave as compared to only 36.4 per cent of companies with five-29 employees. Moreover, only 0.06 per cent of regular workers had actually taken family-care leave and, of these, more than 90 per cent were female workers.

Conditions of Work and Employment Series No. 5 59
Table 3-13. Percentage of companies regulating family-care leave by industry and company size
Companies regulating family-care leave
Companies not regulating family-care
leave All industries 40.2 59.8 Mining 32.0 68.0 Construction 26.6 73.4 Manufacturing 30.7 69.3 Electricity/gas/water 94.2 5.8 Transportation/communication 47.9 52.1 Wholesale/retail 43.3 56.7 Finance 90.6 9.4 Real estate 38.5 61.5 Services 40.4 59.6 Over 500 workers 96.8 3.2 100-499 workers 78.1 21.9 30-99 workers 58.7 41.3 5-29 workers 36.4 63.6 Source. Ministry of Health, Labour and Welfare: Survey on female employment management (1999)
Separate to the legal provision of family-care leave, which enabled workers to directly participate in care, in 2000 the government introduced the nursing care insurance system. The basic aim of nursing care insurance was to relieve families of the burden of having to care for their elderly only by themselves, and to move towards broader social support for care of the elderly. Accordingly, if the nursing care insurance system is to be effective along these lines, one would expect it to have a significant effect on the schedules of the family members of families requiring care.
Nagase (2000) has researched the extent to which care restricts women’s employment. The results of her analysis show that the probability of working women leaving work in response to the ageing of a co-habitant and giving care as the reason is increasing. The research confirms that the ageing of a co-habitant restricts the job-hunting of unemployed women. Moreover, the existence of home help services and special care homes for the elderly have no statistical effect on leaving work or restricting job-hunting, showing that society’s bearing the burden for care has had no effect on the employment behaviour of women. Okusa (1999), using the National Livelihood Surveys, has carried out analysis similar to Nagase’s, finding that day services and short-stay programmes facilitate the employment of the carer, while home-help services restrict employment. These two pieces of research, while leaving room for further research, suggest that society’s bearing the burden for care has had no effect on the employment of women and carers, let alone promoting it.
The Japanese government’s plan of action
With the target of reducing total annual working hours to 1,800 hours, the Japanese government is concentrating on (1) promoting the taking of annual paid holidays, (2) promoting the realization of a system of two full holidays per week, and (3) reducing overtime work. However, as is shown above, efforts with regard to (1) and (3) have not produced satisfactory results, and the total annual working hours figure for 2000 had not reached the government target. The Japanese government, therefore, has announced that future measures to reduce working hours will lay emphasis on the following areas:
� Supporting the improvement of working hours systems through, for example, the introduction of flexible working hours systems to facilitate autonomous and effective work.

60 Conditions of Work and Employment Series No. 5
� Promoting the taking of “long vacations”, vacations of several days in a row, and other vacations throughout the year.
� Reviewing internal corporate systems to allow for effective work and reduced working hours.
� Reviewing the levels of standard limits on overtime work.
� Stamping out “service overtime” (unpaid overtime).
� Reducing holiday work.
� Reviewing the rates for overtime premiums for overtime, vacation and late-night work.
Employment arrangements
Changes in numbers of self-employed and family-employed workers
Figure 3-5 shows changes in the numbers of self-employed and family-employed workers, revealing a year-by-year decrease in Japan. Figure 3-6 shows changes in the opening and closure rates of individual enterprises, revealing that since 1980 the closure rate has overtaken the opening rate, and that the number of individual enterprises has decreased. In the late 1990s, the opening rate shows a rise, but the closure rate has been greater.
Figure 3-5. Self-employed and family workers
0
200
400
600
800
1000
1200
1400
1953 55 57 59 61 63 65 67 69 71 73 75 77 79 81 83 85 87 89 91 93 95 97 99
In ten thousands of persons
Self- employed Family workers Self- employed (male)Family workers (male) Self- employed (female) Family workers (female)
Source. Ministry of Public Management, Home Affairs, Posts and Telecommunications: Labour force survey

Conditions of Work and Employment Series No. 5 61
Figure 3-6. Rate of start-up and closure of businesses (average)
0.0
1.0
2.0
3.0
4.0
5.0
6.0
7.0
1975-1978 1978-1981 1981-1986 1986-1991 1991-1996 1996-1999
Year
Perc
enta
ge
Rate of start-up Rate of closure
Source. Ministry of Public Management, Home Affairs, Posts and Telecommunications: Establishment and enterprise census
The decrease in numbers of self-employed and family-employed workers has had a significant effect on the labour supply of women, an effect which can be traced back to the period of high economic growth. The employment rate for women (the percentage of employed women in the total population over 15 years old) steadily decreased from immediately after the Second World War to the mid-1970s, due to the declining numbers of those engaged in agriculture during the period of high economic growth. During this period, the development of secondary and tertiary industry caused a gradual absorption, as employed workers, of those who had previously been working as self-employed or family-employed workers in the agricultural sector. The majority of women who had worked in the traditional agricultural sector found it difficult to work as employed workers due to the demands of housework.
At present, it is not the case that the majority of self-employed and family-employed workers are in the agricultural sector. According to the Special Labour Survey of February 2001, there are many such workers in the agricultural sector, but about the same amount work in wholesale and small retailing and in the service sector. Further, the percentage of self-employed and family-employed workers out of all employed workers is 15.9 per cent for men, but 19.3 per cent for women. This would seem to suggest that women find it easier to work in self-employed and family-employed types of employment.
Estimated number of teleworkers
The number of at-home workers has increased in recent years. Differing from previous at-home work — that tended to be in-cottage labour related to manufacturing processing — at-home work in recent years has constituted a new type of work characterized by its relation to the development of information technology, known as telework. The number of teleworkers in Japan can still only be guessed at; in 1998, it was estimated to be somewhere in the region of 174,000, of which 70 per cent were women, with 70 per cent of these women having children and, what is more, more than half of these had children under 6 years of age.
The advantage of at-home work is said to be that it allows one to work at one’s own pace, which would particularly seem to benefit women with children. According to a

62 Conditions of Work and Employment Series No. 5
survey undertaken by the Japan Institute of Labour (hereafter the “JIL survey”), 90.5 per cent of women with children under 6 years old and 66.7 per cent of women with children over 7 years old said that they chose to work at home because of the demands of family and housework. This infers that women make up the bulk of at-home workers because they are thus able to balance work and family life.
It must be noted that the name “telework” includes a wide variety of job types. The greater part of at-home workers are engaged in comparatively simple and formulaic work, such as data and text input or transcribing tape recordings. It is also characteristic of this simple and formulaic work that the majority of those engaged in it are women. About 60 per cent of at-home workers have been engaged in such work for less than five years, and about 40 per cent of women with children under 6 years of age for less than one year.
Telework employment conditions
While telework has the advantage of allowing one to work at one’s own pace, it also has its disadvantages. This is certainly the case in terms of payment. According to the JIL survey, payment for at-home work, while depending to a certain extent on time worked, is on average 1,460,000 yen per year. However, bargaining power regarding payment levels differs from case-to-case and there is great variation between payment levels. Enterprising at-home workers with bargaining power regarding payment, doing work for two or more companies, amount to no more than a quarter of all at-home workers. At-home workers engaged in graphic and design work and male at-home workers have relatively higher bargaining power concerning payment, but even among such workers, more than half do not have bargaining power. Women with children and at-home workers engaged in uncomplicated work, such as text and data input and processing, have little say in decisions regarding payment levels.
There is also the problem of trouble occurring between at-home workers and the contracter regarding actual payment of wages. According to the JIL survey, about half of at-home workers have only oral contracts with contracters, and of those who have contracts in writing, many are in the form of vouchers or memos, such that those who have actual contract documents certainly constitute no more than a quarter of at-home workers. About 15 per cent of at-home workers have experienced problems with their contracter over payment of wages as a result of ill-defined contracts.
There is a tendency for women with children to work short hours and men to work long hours, such that even these so-called at-home workers are facing a trade-off between work, housework and child care: 93.3 per cent of women at-home workers with children under 6 work less than 35 hours per week, as do 73.4 per cent of women with children over 7. Furthermore, 54.1 per cent of women with children under 6 work between 20 and 24 hours. By comparison, 59.6 per cent of women without children work less than 35 hours, but 14 per cent work over 50 hours. Among male at-home workers, 62 per cent work more than 35 hours and 25.4 per cent work over 50 hours.
Welfare facilities and financial compensation for the cost of family responsibilities
Developing measures in Japan to assist family responsibilities
Up to the beginning of the 1990s, the perception predominated that a mother’s role was to raise children, and the tax and social security systems provided preferential measures for full-time housewives or working housewives who performed part-time work

Conditions of Work and Employment Series No. 5 63
that earned income below a specified level. For example, in addition to the marriage deduction, which was added to the tax code in 1961, and special deductions for dependents added in 1987, a system applied to the insured person in the third category was enacted, by which wives whose annual income was below 1.3 million yen were exempted from the paying contributions into the national pension system, though they were still able to receive an old-age basic pension. In addition to this system at the national level, slightly less than 80 per cent of businesses paid family allowances to workers. The percentage of such businesses has, however, declined recently. On the other hand, day-care facilities have been increasing for female workers. Nevertheless, it is generally taken for granted that a woman’s share of family responsibilities includes caring for the children.
As is shown in Figure 3-7, the total fertility rate for 1989 had declined to 1.57, a figure even lower than the 1.58 for 1966, which was unusually low due to an old superstition that women born in the “hinoeuma” or “fire horse” year (which occurs only once every 60 years in the Chinese zodiacal calendar) are thought to be headstrong and likely to kill their husbands. It was at this time that the government began to turn its attention in earnest to measures to support child care. One such measure was the “Angel Plan,” formulated in 1994. The plan’s basic direction called for:
� Supporting child rearing concurrent with work;
� Supporting child rearing in the home;
� Realization of housing and living environment suitable for the child’s upbringing;
� The realization of liberal education and rearing children in a sound manner; and
� Reducing the cost of child rearing.
Figure 3-7. The number of children born and total fertility rate
0
500'000
1'000'000
1'500'000
2'000'000
2'500'000
3'000'000
1947 49 51 53 55 57 59 61 63 65 67 69 71 73 75 77 79 81 83 85 87 89 91 93 95 97
1999
Year
Num
ber o
f chi
ldre
n bo
rn
0.00
0.50
1.00
1.50
2.00
2.50
3.00
3.50
4.00
4.50
5.00
Tota
l fer
tility
rate
Number of children bornTotal fertility rate
Source. Ministry of Health, Labour and Welfare: Vital statistics

64 Conditions of Work and Employment Series No. 5
To this end, emphasis was to be placed on seven major points:
1. Implementation of child-care leave benefits;
2. The providing of a variety of day-care services;
3. A significant increase in community centers to support child care;
4. The fulfilling of a mother and child medical treatment system;
5. The providing of adequately spacious habitations;
6. Improvements in the contents and methods of education; and
7. Reduction in day-care charges, and fair application of the burden of payment.
In addition, the Five-year Program on Emergency Measures for Nursery Care and Other Related Matters, which essentially encompassed the objectives of the Angel Plan, was announced in 1994. As far as nursery care, this indicates the degree to which effectuation of infant nursery care and extended nursery care has progressed. Table 3-14, which contains the data for fiscal 1999, the most currently available data, makes it apparent that the realization of temporary nursery care and community centres to support child care reached only about 20 to 30 per cent of their initial objectives, indicating that these measures are insufficient.
Table 3-14. Achievements of Five-Year Program on Emergency Measures for Nursery Care and Other Related Matters
A B C D 1994 results 1999 results Objective values for
the end of 1999 B ÷ C
Nursery care for infants (age 0-2) 45.1 infants 56.4 infants 60 infants 94%
Extended nursery care 1,649 facilities 5,125 facilities 7,000 facilities 73%
Day-service programme to support the health of infants and toddlers
7 locations 110 locations 500 locations 22%
After-school children’s clubs 5,313 locations 8,392 locations 9,000 locations 93%
Community centres to support child care
118 centres 997 centres 3,000 centres 33%
Temporary nursery care 387 facilities 685 facilities 3,000 facilities 23%
Development of multi-functional nurseries
--- 1,391 facilities (development volume
in five years)
1,500 facilities (development volume
in five years)
93%
In 1999, the Angel Plan was extended with the establishment of the New Angel Plan, which incorporated as its three main pillars the setting up of day-care service facilities to meet a variety of needs; a consultation and support system for child rearing; and a mother and child health system, with objective values to be realized from fiscal year 2000 to 2004. The objective values for the day-care service and the consultation and support system are indicated in Table 3-15.

Conditions of Work and Employment Series No. 5 65
Table 3-15. The new Angel Plan
1999 2004 Nursery care for infants (age 0-2) 58 infants º 68 infants
Enhancement of diverse nursery care services
(a) Extended nursery care 7,000 facilities º 10,000 facilities
(b) Holiday nursery care 100 facilities º 300 facilities
(c) Day-service programme to support the health of infants and toddlers
450 locations º 500 municipalities
(d) Development of multi-functional nurseries 1,600 facilities º 2,000 facilities
Promotion to support child care, including children at
(a) Community centres to support child care 1,500 centres º 3,000 centres
(b) Temporary nursery care 1,500 facilities º 3,000 facilities
(c) Family support centres 62 centres º 180 centres
After-school children’s clubs 9,000 locations º 11,500 locations
In the above manner, measures exist in Japan to promote assistance for women who work, but problems remain related to measures that would promote the participation by fathers in household chores and child rearing.
Financial compensation
The child allowance
The child allowance went into effect in January 1972. Its adoption in Japan came comparatively late compared to other countries. In addition to the strong belief that the responsibility for children’s upbringing lies with the parents, it provides for a family allowance within the scope of Japan’s wage structure. Because the system of wages that increases by increments in conjunction with job seniority is being maintained, some hold to the viewpoint that the child allowance is not necessary.
At the time the child allowance was adopted, it provided for payment of 3,000 yen per month from the third child onward, until the child reached the end of his or her compulsory education. A 1985 amendment changed this to 2,000 yen per month from the second child, prior to the start of compulsory education, with the allowance raised to 5,000 yen per month from the third child onward. In 1991, an amendment raised the former to 5,000 and 10,000 yen respectively. Up to then, payments were concurrently expanded or reduced, but from June 2000, they were expanded prior to the start of the child’s compulsory education. From the initiation of the system, income restrictions had been imposed on payment of the child allowance, but from June 2000 this was elevated to enable the percentage of children eligible to receive the allowance increase from 72.5 per cent to 85.0 per cent. In this manner, child allowances have expanded in Japan in recent years, but when compared to other countries the range is still relatively restricted (lower age for eligibility, income restrictions, etc.) and the expenditures needed to support child care are not being paid. The costs required for payment of the child allowance are borne not only by the national, prefectural and municipal governments, but by the employers.
Apart from child allowances, some companies also provide employees with a family allowance. According to the “General Survey on Wages and Working Hours System” conducted by the Ministry of Health, Labour and Welfare in 1999, 77.3 per cent of businesses provided such allowances. However, these allowances are mainly provided to spouses, and compared with the amount allotted to wives, that paid out for children tends

66 Conditions of Work and Employment Series No. 5
to be smaller (Oshio, 1996). Because a majority of the companies that pay these allowances place restrictions on payment in cases based on the earnings by wives, so-called spouse allowances tend not to be paid to double-income households.
Deduction for dependents
The tax system allows for a deduction for dependents for children under 16 years of age, and a deduction for specified dependents in the case of dependents aged 16 to 23. In the same manner as the child allowance, this provides economic assistance for child support. However, because of the progressive tax rate, tax deductions are greater for a person with a higher income, and of little benefit to those in the lower income bracket. As a result, little economic support exists through the tax system for the lower-income household due to this problem of regressiveness.
According to an international comparison conducted by Tsumura (2000), the percentage of child allowances plus dependent deductions allowed through the tax system relative to disposable income for a family with one earner and two children aged 5 to 12 is only 2.1 per cent in Japan, making it the lowest of 16 countries covered in the comparison, while there are countries that guarantee 15 to 20 per cent.
Child rearing allowance
In January 1962, the Child Rearing Allowance Law was promulgated. This provided a stipend in households made fatherless due to separation, etc., in which the child was being raised solely by the mother (in the case of motherless households, no provision was made for the allowance). Until the end of July 1985, the size of the stipend paid to households with income below a certain level was fixed. From August 1985, a two-tiered system was adopted (full or partial payment) depending on the income level. 16
This income restriction was lowered in August 1998, resulting in it becoming lower than the income restriction of the child allowance (see Table 3-16). At present, the introduction of a system where the stipend is reduced by increments and other means of holding down increases in the amount of the stipend are undergoing review. The Ministry of Health, Labour and Welfare is projecting that the revision to the child-rearing allowance will affect 46 per cent of households (in terms of reductions in amount paid). By this, if the mother works, payment of the child-rearing allowance will be halted. The policy is aimed at promoting one-parent households to achieve independence through work rather than through allowances. Because, at present, working measures are not being sufficiently considered, it is expected that the revisions will create additional hardships for one-parent households.
16 In 2001, the full monthly stipend to a household with one child was 42,370 yen and 47,370 yen for two children; the partial monthly stipend was 28,350 and 33,350 yen, respectively.
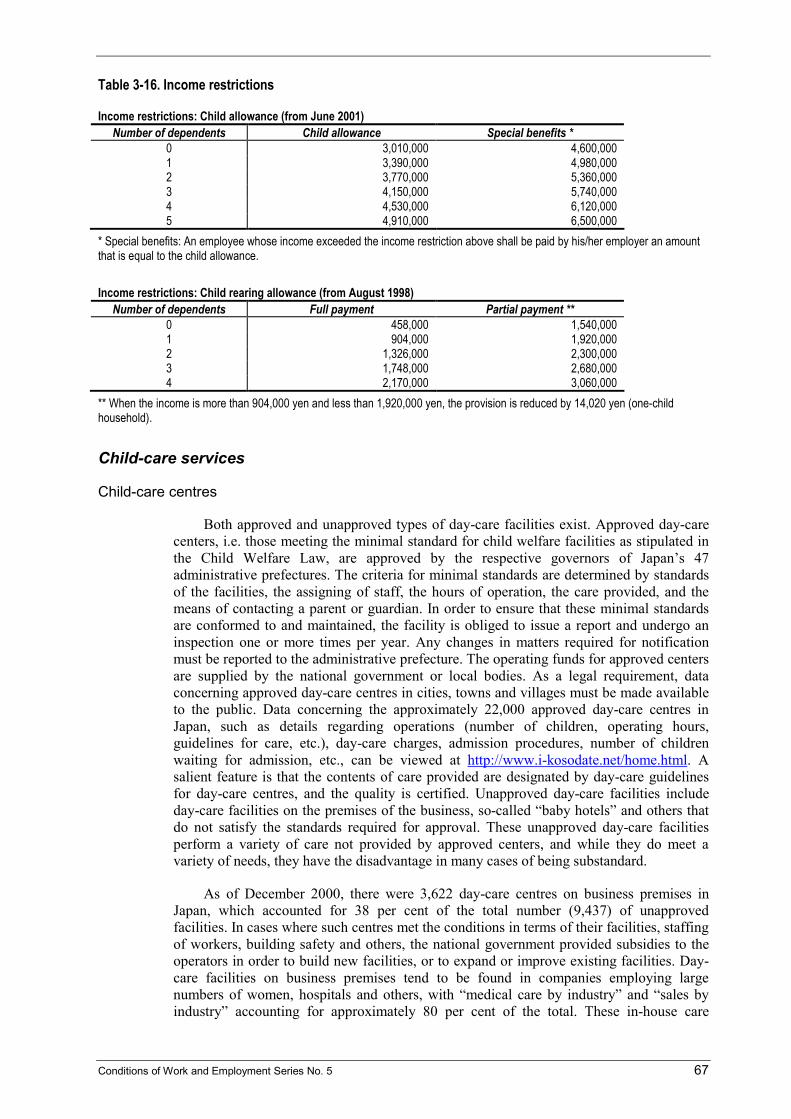
Conditions of Work and Employment Series No. 5 67
Table 3-16. Income restrictions
Income restrictions: Child allowance (from June 2001) Number of dependents Child allowance Special benefits *
0 3,010,000 4,600,000 1 3,390,000 4,980,000 2 3,770,000 5,360,000 3 4,150,000 5,740,000 4 4,530,000 6,120,000 5 4,910,000 6,500,000
* Special benefits: An employee whose income exceeded the income restriction above shall be paid by his/her employer an amount that is equal to the child allowance. Income restrictions: Child rearing allowance (from August 1998)
Number of dependents Full payment Partial payment ** 0 458,000 1,540,000 1 904,000 1,920,000 2 1,326,000 2,300,000 3 1,748,000 2,680,000 4 2,170,000 3,060,000
** When the income is more than 904,000 yen and less than 1,920,000 yen, the provision is reduced by 14,020 yen (one-child household).
Child-care services
Child-care centres
Both approved and unapproved types of day-care facilities exist. Approved day-care centers, i.e. those meeting the minimal standard for child welfare facilities as stipulated in the Child Welfare Law, are approved by the respective governors of Japan’s 47 administrative prefectures. The criteria for minimal standards are determined by standards of the facilities, the assigning of staff, the hours of operation, the care provided, and the means of contacting a parent or guardian. In order to ensure that these minimal standards are conformed to and maintained, the facility is obliged to issue a report and undergo an inspection one or more times per year. Any changes in matters required for notification must be reported to the administrative prefecture. The operating funds for approved centers are supplied by the national government or local bodies. As a legal requirement, data concerning approved day-care centres in cities, towns and villages must be made available to the public. Data concerning the approximately 22,000 approved day-care centres in Japan, such as details regarding operations (number of children, operating hours, guidelines for care, etc.), day-care charges, admission procedures, number of children waiting for admission, etc., can be viewed at http://www.i-kosodate.net/home.html. A salient feature is that the contents of care provided are designated by day-care guidelines for day-care centres, and the quality is certified. Unapproved day-care facilities include day-care facilities on the premises of the business, so-called “baby hotels” and others that do not satisfy the standards required for approval. These unapproved day-care facilities perform a variety of care not provided by approved centers, and while they do meet a variety of needs, they have the disadvantage in many cases of being substandard.
As of December 2000, there were 3,622 day-care centres on business premises in Japan, which accounted for 38 per cent of the total number (9,437) of unapproved facilities. In cases where such centres met the conditions in terms of their facilities, staffing of workers, building safety and others, the national government provided subsidies to the operators in order to build new facilities, or to expand or improve existing facilities. Day-care facilities on business premises tend to be found in companies employing large numbers of women, hospitals and others, with “medical care by industry” and “sales by industry” accounting for approximately 80 per cent of the total. These in-house care

68 Conditions of Work and Employment Series No. 5
facilities are not operated by the companies directly, but through links with babysitting firms. Certain other firms also subsidize fees when their employees make use of day-care or babysitting services. Japanese corporations do not generally provide these as part of their fringe benefits. According to the “Survey of Expenditures on Welfare” (2000) published by the Japan Federation of Employers’ Associations, expenditures related to child care and education were only 20 yen per capita per month, accounting for only 0.1 per cent of the total of non-designated welfare expenditures.
Many people make use of these facilities because they are unable to get their children admitted into approved centres. In 2000, cases of abuse to children were recorded in such facilities and, in 2001, fatalities due to abuse were also recorded. For that reason, an amendment to the Child Welfare Law is being considered that would oblige these unapproved centres to improve their quality.
Changes in measures toward day-care centres
From 1965 to 1975, the Japanese government emphasized welfare. Day-care centres improved quantitatively by the 1980s. As can be seen in Figure 3-8 and Figure 3-9, the number of day-care centres, their capacity and the number of children admitted reached a peak; after this, they declined. The 1973 oil crisis led to less emphasis being put on prioritizing welfare, and as was previously noted, measures were adopted instead to favour full-time housewives or housewives with income below a certain fixed level. Further, as can be seen in Figure 3-7, the declining birth rate can be cited. Thus by the 1980s, quantitative objectives had been achieved, but at the same time a strong feeling persisted that extended nursery care and night-time nursery care were undesirable from the perspective of welfare, and measures to meet diversified day-care needs remained insufficient. “Baby hotels” and other types of unapproved child-care facilities made their appearance, but they suffered in terms of quality, and in a few instances fatalities even occurred. In the 1990s with the decrease in the number of children, day-care measures were promoted as a work-family measure to provide more support to dual-income families, and child-care services began to be provided in a manner that supported women who held jobs.
Figure 3-8. Change in the number of day-care facilities
0
5'000
10'000
15'000
20'000
25'000
1956 58 60 62 64 66 68 70 72 74 76 78 80 82 84 86 88 90 92 94 96 98
Year
PrivatePublic
Source. Ministry of Health, Labour and Welfare: Survey on social welfare institutions, etc.

Conditions of Work and Employment Series No. 5 69
Figure 3-9. Change in the number of children admitted and admission capacity by age
0
500'000
1'000'000
1'500'000
2'000'000
2'500'000
1956 58 60 62 64 66 68 70 72 74 76 78 80 82 84 86 88 90 92 94 96 98
Year
Pers
ons
Age 6+Age 5Age 4Age 3Age 2Age 1Age 0Admission capacity
Source. Ministry of Health, Labour and Welfare: Survey on social welfare institutions, etc.
With the implementation of an amendment to the Child Welfare Law in 1997, from day-care centres in which entry was gained through arrangements with the municipalities, plans were advanced to make centres easier to use, such as through measures that enabled parents or guardians to select the facility. However, it was still necessary for parents to make their application through the municipality, and entry was determined based on operation standards. According to these operation standards, priority for entry into day care is given to mothers who are regular company staff over mothers who work as part-timers or non-regular company employees.
Day-care charges
The payment for day-care charges are determined based on the total household income of the parent; in other words, a method based on the parent’s or guardian’s ability to pay. The standard charges set by the state for 2001 are shown in Table 3-17. Presently, seven levels have been set, with the first level paid by households receiving public assistance; the second level determined by exemption from income tax and local residence tax; the third level in which income is treated as non-taxable, but the family is liable for local resident’s tax; and so on, for the fourth through the seventh, which are treated as taxpaying households. If a wife who does not work takes up employment, or if only one spouse in a household was working changes to both spouses working, the amount of charges to be borne by the household increases. As shown in the right side of Table 3-17, which gives the breakdown of the day-care center users broken down by charge levels, from levels 4 to 6, the respective figure is about 20 per cent, and level 7 is about 10 per cent; thus levels 4 through 7 combined account for 70 per cent. However, the actual day-care charges paid by the users are set lower by the municipalities than the basic amount set by the national government. The difference reduces the burden on the day-care user. For that reason, although households with the same conditions receive essentially the same services, the amount paid may vary according to municipalities (see Figure 3-10).

70 Conditions of Work and Employment Series No. 5
Table 3-17. Monthly day-care charges set by state (2001)
Amount of income tax Children aged 1-3 Children aged 4+ Distribution (%) Level 1 Recipients of pubic assistance 0 yen 0 yen 1.2 Level 2 Exempt from municipal tax and income
tax 9,000 yen 6,000 yen 13.3
Level 3 Exempt from income tax 19,500 yen 16,500 yen 14.8 Level 4 Income tax less than 64,000 yen 30,000 yen 27,000 yen 19.7 Level 5 Income tax 64,000 yen to less than
160,000 yen 44,500 yen 41,500 yen 21.5
Level 6 Income tax 160,000 yen to less than 408,000 yen
61,000 yen 58,000 yen 21.1
Level 7 Income tax 408,000 yen or more 80,000 yen 77,000 yen 8.5
Figure 3-10. Monthly day-care charges by municipalities (children under 3 years of age)
0
10'000
20'000
30'000
40'000
50'000
60'000
70'000
80'000
90'000
National standardCity ACity BCity C
Present status of day-care facilities in Japan
To review the current status of day-care facilities, we shall briefly review (1) the ratio of capacity at which they are functioning; (2) the ratio of children awaiting admission; and (3) the ratio of extended nursery care.
Rate of nursery capacity. Looking at the number of children admitted to day-care centres as the indicator of their capacity, the number of children admitted since the implementation of the Angel Plan in 1994 increased rapidly, reaching 99 per cent in 2000 (see Figure 3-11). From Figure 3-9, which shows the number of children admitted broken down by age, it can be seen that day-care centres for children under 3 has increased. While nursery care measures matched to the needs of users has led to sharp increases in the number of users of day care, the centres have failed to keep up with demand in terms of their facilities.

Conditions of Work and Employment Series No. 5 71
Figure 3-11. Change in the rate of nursery capacity
80
82
84
86
88
90
92
94
96
98
100
1956 58 60 62 64 66 68 70 72 74 76 78 80 82 84 86 88 90 92 94 96 98
2000
Year
Perc
enta
ge
Source. Ministry of Health, Labour and Welfare: Survey on social institutions, etc.
Rates of those waiting for admission. From the number of children waiting for admission, relative to those admitted and broken down by age, we see that the 1994 Angel Plan and the 1999 New Angel Plan resulted in increases in the number of children admitted. However, these numbers were exceeded by the number of children waiting for admission, which continued to increase (see Figure 3-12). Since 1999, the rate of those waiting for admission declined, but as of April 2000, 32,933 children were wait-listed. The rate was particularly high for infants.
Figure 3-12. The ratio of children waiting for admission
0
2
4
6
8
10
12
1994 95 96 97 98 99 2000
Year
Percentage
0
5'000
10'000
15'000
20'000
25'000
30'000
35'000
40'000
45'000
Children
Age 3+ (waiting children)Age 1-2 (waiting children)Age 0 (wating children)Age 0 (waiting rate)Age 1-2 (waiting rate)Age 3+ (waiting rate)
Source. Equal Employment, Children and Families Bureau, Ministry of Health, Labour and Welfare

72 Conditions of Work and Employment Series No. 5
Rate of implementation of extended nursery care. In principle, each child is to be cared for eight hours on any given day, but since 1994, when a Five-year Program on Emergency Measures for Nursery Care and Other Related Matters came into effect, one of the recommendations was that day-care centres remain open for 11 hours. At present, centers remaining open longer than 11 hours receive financial assistance from the state. The number of centres offering extended nursery care beyond 11 hours is increasing, reaching 40.3 per cent of the total in 2000. This figure is mainly privately operated nurseries, where the percentage of extended nursery care has reached 64.7 per cent (see Figure 3-13).
Figure 3-13. Rate of implementation of extended nursery care
0
10
20
30
40
50
60
70
1995
1996
1997
1998
1999
2000
Year
Perc
enta
ge
Public
Private
Source. Ministry of Health, Labour and Welfare: Survey on social welfare institutions, etc.
Measures to address day-care needs continue to show progress.
Kindergartens
Kindergartens also play an important support role in the area of pre-schooling. However, the distinctions between day-care centres and kindergartens should be noted.
Day-care centres are facilities for “children who are lacking in care”; are positioned as child welfare facilities under the Child Welfare Law; are under the control of the Ministry of Health, Labour and Welfare; care for children from infancy to when they start school; operate for eight or more hours per day; and operate approximately 300 days a year, with no break for summer or winter holidays.
Kindergartens are facilities that engage in pre-school education for children under school age; are considered as school education facilities under the School Education Law; are under the control of the Ministry of Education, Culture, Sports, Science and Technology; care for children from age 3 to when they start school; provide instruction for four hours per day; and operate for 39 or more weeks a year, with spring, summer and winter holidays.
Due to the above, even though a child attends kindergarten, in the case of households where both parents work, or in the case of a one-parent household, taking the child to and from school within the standard four-hour period might not be practical, in which case the

Conditions of Work and Employment Series No. 5 73
family is faced with the problem of having no alternative but to rely on day care, a situation that does not fit the needs of the working parent. To meet the needs of such individuals, from fiscal 1997, extended-care (by which the child would remain on the kindergarten premises and be cared for after the prescribed school hours) was promoted. By 2000, such arrangements were available in more than 70 per cent of private kindergartens (Figure 3-14).
Figure 3-14. Rate of implementation of extended care in kindergartens
0%
10%
20%
30%
40%
50%
60%
70%
80%
90%
100%
Total Private Public
Implementation Non-implementation
Source. Ministry of Education, Culture, Sports, Science and Technology
In this manner, through cooperation between kindergartens and day-care centres, more detailed forms of assistance in child care are being provided in Japan.
After-school child care
After-school child care for households in which both parents work, one-parent households, etc., comes under a 1997 amendment to the Child Welfare Law that provides for an “after-school sound child rearing program”. In the Five-year Program on Emergency Measures for Nursery Care and Other Related Matters, this involved some 9,000 facilities up to 1999, and under the New Angel Plan it is envisaged that student care facilities be increased to 11,500 by fiscal year 2004 (see Figure 3-15). While 59.6 per cent of local autonomous bodies in Japan’s municipalities currently offer such after-school care, it is apparent that many still do not.

74 Conditions of Work and Employment Series No. 5
Figure 3-15. The number of after-school child care
0
2'000
4'000
6'000
8'000
10'000
12'000
14'000
1980 81 82 83 84 85 86 87 88 89 90 91 92 93 94 95 96 97 98 99
2000
2001
Year Note. The survey was not undertaken in 1992. Source. Japan Association of After-school Child Care
The need for after-school care in all communities has taken on an added sense of urgency, and it is expected that this will be promoted in the future.
Family support centres
Family support centres are community organizations that introduce and make arrangements between members seeking child care and the assisting members who undertake care of the children, who pick up and return children to day-care centres, and who engage in other mutual support activities in response to temporary or short-term child-care needs. In April 2000, 76 such facilities existed; but funds were allocated in 2001 to increase the number to 182. According to the results of the “Nationwide Survey of In-home Child-Care Services” conducted by the All-Japan Babysitter Association in 1999, family support centres not only respond to the needs of work-family support, but also provide an opportunity for the members and assisting members in the same community, as well as for people of different generations, to encounter each other. The establishment of family support centres has become yet another urgent issue.
From the above, salient measures aimed at the reduced responsibility of the family in Japan, in particular the reduction of economic assistance, the need for expansion of day-care services matched to working hours, and the importance placed on support for assistance to child rearing in the community can be raised. However, problems persist in that the effectuation of these policies has not benefitted from a commensurate reconsideration of working hours.

Conditions of Work and Employment Series No. 5 75
IV. What is missing? The gap between work-family needs and work-family support
As we saw in Part III, standard work-family support programmes have been established in Japan. However, these programmes are not yet being effectively utilized. This part looks at why the programmes are not effectively utilized despite their legal provision.
The value given to work-family support by employers and workers
First we look at the extent to which the legally established work-family support programmes have been regulated by companies. The Childcare and Family-care Leave Law provides all workers with the right to take child-care and family-care leave, and prohibits employers from preventing this. Nevertheless, there are cases of companies that have not regulated child-care and family-care leave, and where taking leave has been problematic despite regulation by the company, showing a reality where legal provisions are not having a great enough effect. Moreover, there is a growing trend of young women who are unable to balance the demands of work and family life retiring from the labour market.
Table 4-1 shows the percentage of companies that have regulated child-care and family-care leave: 53.5 per cent of all companies have regulated child-care leave; 40.2 per cent of companies have not regulated family-care leave. In the utility industries and in finance and insurance, more than 90 per cent of companies have regulated child-care and family-care leave, while in other industries, only 30 to 60 per cent of companies have done so.
Table 4-1. The percentage of companies regulating child-care and family-care leave, by industry and size of company
Regulated child-care leave Regulated family-care leave All industry 53.5 40.2 Mining 42.8 32.0 Construction 39.9 26.6 Manufacturing 42.1 30.7 Electricity/gas/water 95.4 94.2 Transportation/communications 61.0 47.9 Wholesale/retail 58.8 43.3 Finance 94.0 90.6 Real estate 45.0 38.5 Services 53.2 40.4 Over 500 workers 98.7 96.8 100-499 workers 88.5 78.1 30-99 workers 74.0 58.7 5-29 workers 49.4 36.4 Source. Ministry of Health, Labour and Welfare: Survey on female employment management (1999).
The reasons why most companies in the utility industries and in finance and insurance have regulated work-family support programmes are not necessarily for the purpose of balancing work and family life. These industries are the so-called regulatory industries, and it is likely that they have introduced these systems in exchange for the rent they can obtain from the regulations. The fact that the aims for which the programmes were created have not necessarily been realized in industries where a high percentage of companies have regulated child-care and family-care leave is shown in Table 4-2. This table shows the
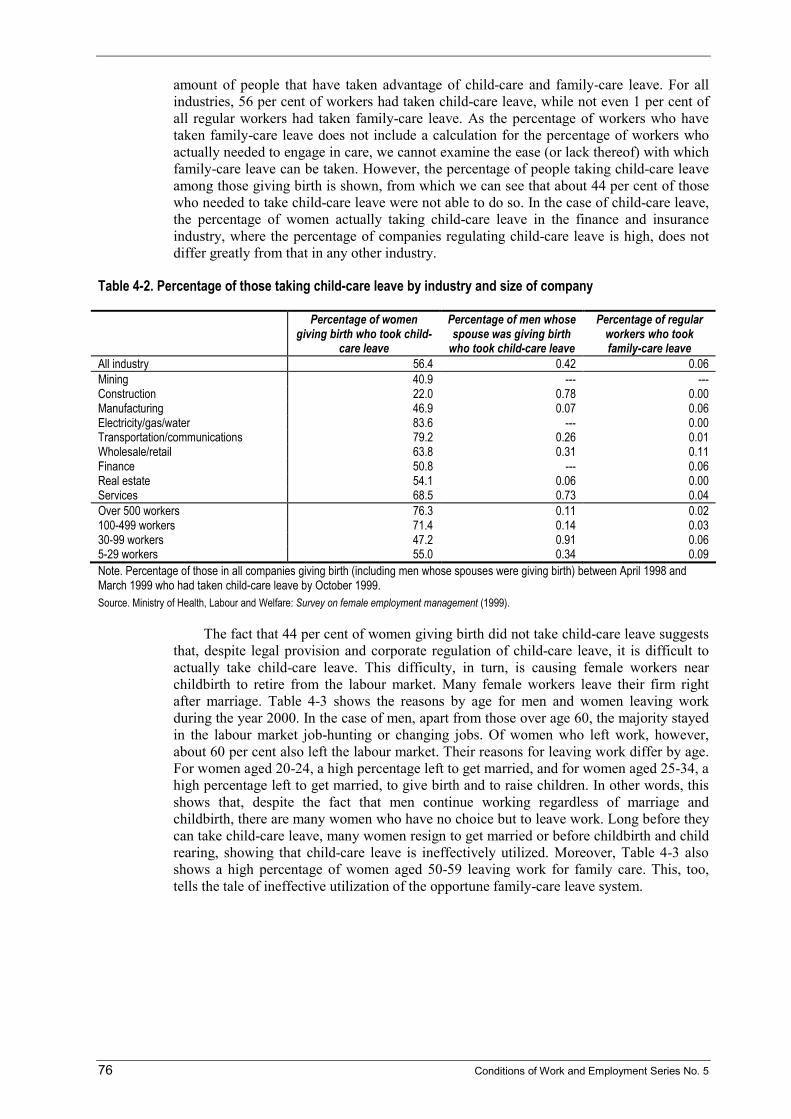
76 Conditions of Work and Employment Series No. 5
amount of people that have taken advantage of child-care and family-care leave. For all industries, 56 per cent of workers had taken child-care leave, while not even 1 per cent of all regular workers had taken family-care leave. As the percentage of workers who have taken family-care leave does not include a calculation for the percentage of workers who actually needed to engage in care, we cannot examine the ease (or lack thereof) with which family-care leave can be taken. However, the percentage of people taking child-care leave among those giving birth is shown, from which we can see that about 44 per cent of those who needed to take child-care leave were not able to do so. In the case of child-care leave, the percentage of women actually taking child-care leave in the finance and insurance industry, where the percentage of companies regulating child-care leave is high, does not differ greatly from that in any other industry.
Table 4-2. Percentage of those taking child-care leave by industry and size of company
Percentage of women giving birth who took child-
care leave
Percentage of men whose spouse was giving birth
who took child-care leave
Percentage of regular workers who took family-care leave
All industry 56.4 0.42 0.06 Mining 40.9 --- --- Construction 22.0 0.78 0.00 Manufacturing 46.9 0.07 0.06 Electricity/gas/water 83.6 --- 0.00 Transportation/communications 79.2 0.26 0.01 Wholesale/retail 63.8 0.31 0.11 Finance 50.8 --- 0.06 Real estate 54.1 0.06 0.00 Services 68.5 0.73 0.04 Over 500 workers 76.3 0.11 0.02 100-499 workers 71.4 0.14 0.03 30-99 workers 47.2 0.91 0.06 5-29 workers 55.0 0.34 0.09 Note. Percentage of those in all companies giving birth (including men whose spouses were giving birth) between April 1998 and March 1999 who had taken child-care leave by October 1999. Source. Ministry of Health, Labour and Welfare: Survey on female employment management (1999).
The fact that 44 per cent of women giving birth did not take child-care leave suggests that, despite legal provision and corporate regulation of child-care leave, it is difficult to actually take child-care leave. This difficulty, in turn, is causing female workers near childbirth to retire from the labour market. Many female workers leave their firm right after marriage. Table 4-3 shows the reasons by age for men and women leaving work during the year 2000. In the case of men, apart from those over age 60, the majority stayed in the labour market job-hunting or changing jobs. Of women who left work, however, about 60 per cent also left the labour market. Their reasons for leaving work differ by age. For women aged 20-24, a high percentage left to get married, and for women aged 25-34, a high percentage left to get married, to give birth and to raise children. In other words, this shows that, despite the fact that men continue working regardless of marriage and childbirth, there are many women who have no choice but to leave work. Long before they can take child-care leave, many women resign to get married or before childbirth and child rearing, showing that child-care leave is ineffectively utilized. Moreover, Table 4-3 also shows a high percentage of women aged 50-59 leaving work for family care. This, too, tells the tale of ineffective utilization of the opportune family-care leave system.

Conditions of Work and Employment Series No. 5 77
Table 4-3. Reasons for leaving work
Ratio to not in the labour force Ratio of those who are not in the
labour force to job leaver
for marriage for childbirth and child rearing
for nursing
Male 46.02 0.08 0.08 0.86 15-19 52.94 20-24 37.18 25-29 27.23 30-34 25.81 1.56 35-39 24.20 2.63 40-44 28.37 2.50 45-49 34.38 1.82 50-54 34.11 0.00 55-59 47.65 1.23 60-64 76.08 0.63 Over 65 85.80 1.47 Female 59.76 11.21 4.27 15-19 57.72 2.82 0.00 20-24 45.45 9.68 0.65 25-29 62.36 24.77 1.35 30-34 60.84 27.04 2.15 35-39 45.82 15.87 3.97 40-44 44.23 3.48 8.70 45-49 54.33 1.84 9.82 50-54 66.21 1.38 11.03 55-59 79.90 1.29 10.32 60-64 88.89 0.54 3.80 Over 65 94.05 0.00 4.43 Source. Statistics Bureau and Statistics Center, Ministry of Public Management, Home Affairs, Posts and Telecommunications: Employment status survey
It is clear that, despite the existence of work-family support programmes in Japan, these programmes are ineffectively utilized. Why is this the case? More problematic is the fact that many women are unable to take child-care leave because they have left work long before they would be entitled to such leave. There are two main reasons for this.
The first reason is that the work that women engage in is not as attractive as that performed by men. Wage differences between men and women can be represented by allotting men a total of 100, to which the equivalent women’s total is no more than 65. This is a significant gap when compared to other developed countries. Moreover, in response to the enactment of the Equal Opportunity Law, many companies, in particular large companies, created the new employment classifications of career-track level and general level. Career-track-level jobs are provided with training programmes, while general-level jobs receive comparatively little training, so that career types will inevitably differ. More importantly, most career-track-level jobs are occupied by men, while most general-level jobs are occupied by women. By means of this two-track employment management system, companies are able to legally discriminate against women in terms of promotion and pay, and the incentives for women to continue in their jobs are thereby reduced.
The second reason why women leave work on account of marriage or childbirth is the problem of men. According to an opinion poll conducted by the Cabinet Office Bureau for Gender Equality, men now pay less attention to family matters than before (see Table 4-4). When the poll was conducted in 1993, 40.4 per cent of respondents thought that “men who concern themselves with family matters are increasing”, while in 2000, the percentage thinking this way had dropped to 31.5 per cent. This trend was evident among both men and women.

78 Conditions of Work and Employment Series No. 5
Table 4-4. Percentage of men prioritizing the family
October 1993 September 2000 Total Total Female Male
Increasing 40.4 31.5 31.0 32.1 Slightly increasing 31.7 35.0 38.1 31.3 No change 25.1 28.3 26.1 31.0 Other 0.2 0.6 0.2 1.1 Don’t know 2.6 4.6 4.6 4.5 Source. Public opinion poll conducted by the Gender Equality Bureau, Cabinet Office
Why, then, has the number of men who concern themselves with family matters apparently dropped? Table 4-5 shows the Cabinet Office opinion poll answers (multiple answer) to the question: “What is necessary in order for men to get involved in housework and child rearing and education?” The answers, in order of popularity, were “sufficient discussion between husband and wife”; “rethinking social customs, conventions and traditions”; “reducing working hours and expanding holiday systems”; “rethinking a social structure centred on companies”; and “rethinking men’s company centred way of living and thinking”. The issue of division of roles within the family has previously been understood as one of conventional gender-based division of labour and then as one of working hours and holidays; namely, an issue of Japanese work and employment practices. In other words, we might say that it has been thought of as an issue of Japanese society. However, as is shown in Table 4-5, the answer “sufficient discussion between husband and wife” was more popular in 2000 than in 1993, showing that people are at last attempting to understand the issue of division of roles in the family as a domestic issue. Perhaps with increased higher education for women, the increased proportion of service industries and new legal provisions women’s social advancement has progressed with the result that the structure of social problems has steadily been resolved. The other answers, however, show that there are still problems that society needs to resolve. What is more, while total annual working hours were reduced in the early 1990s, working hours have recently shown a tendency to increase; thus it is likely that men will again find it difficult to shoulder more domestic responsibilities.
Table 4-5. What is needed for men to get involved in housework, child rearing and education
October 1993 September 2000 Total Total Female Male
Sufficient discussion between husband and wife
33.7 41.3 45.2 36.6
Rethinking social customs, conventions and traditions
37.1 34.9 36.1 33.5
Reducing working hours and expanding holiday systems
39.9 33.5 33.3 33.9
Rethinking a social structure centred on companies
29.8 30.6 28.7 32.9
Rethinking men’s company centred way of living and thinking
22.5 24.8 24.7 24.9
Source. Public opinion poll conducted by the Gender Equality Bureau, Cabinet Office
What, then, do people think about the issue of men taking on domestic responsibilities itself? Table 4-6 shows answers (multiple answers) to a question about men taking child-care and family-care leave. It is interesting to note that, although there are almost no men actually taking such leave, more than half of those polled — both men and women — replied that men should be able to take child-care and family-care leave. Why, then, is it that they cannot take it even should they wish to?
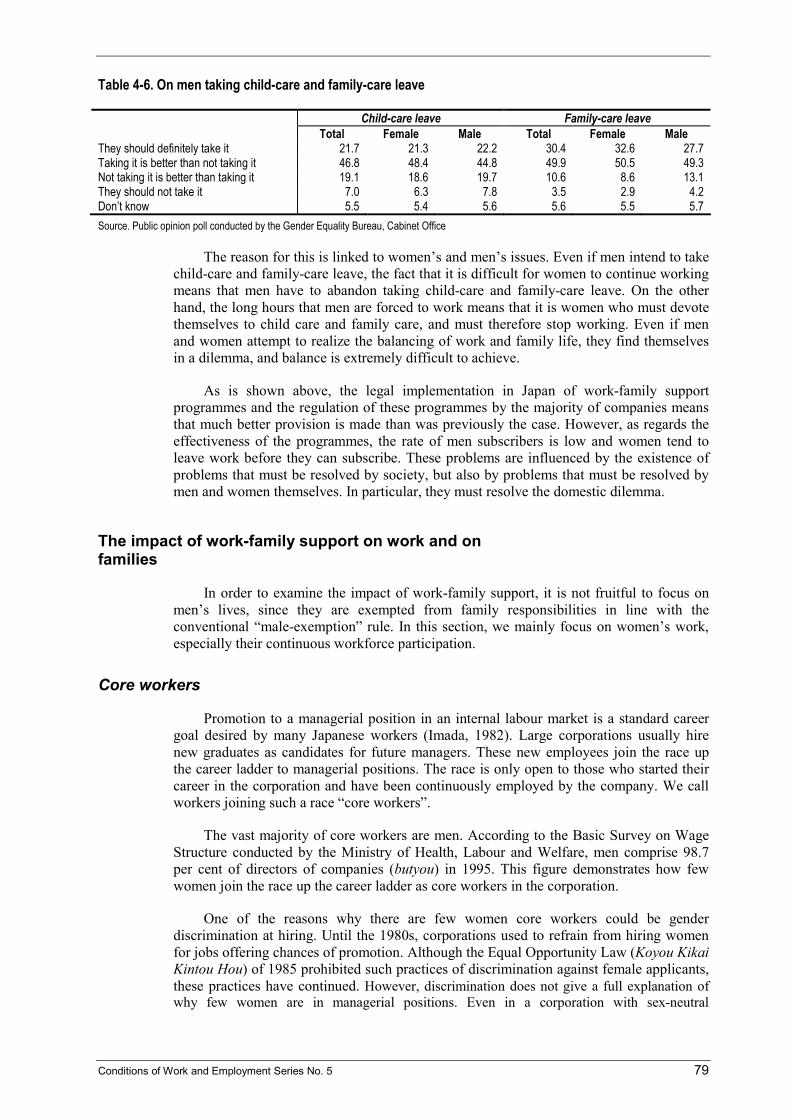
Conditions of Work and Employment Series No. 5 79
Table 4-6. On men taking child-care and family-care leave
Child-care leave Family-care leave Total Female Male Total Female Male
They should definitely take it 21.7 21.3 22.2 30.4 32.6 27.7 Taking it is better than not taking it 46.8 48.4 44.8 49.9 50.5 49.3 Not taking it is better than taking it 19.1 18.6 19.7 10.6 8.6 13.1 They should not take it 7.0 6.3 7.8 3.5 2.9 4.2 Don’t know 5.5 5.4 5.6 5.6 5.5 5.7 Source. Public opinion poll conducted by the Gender Equality Bureau, Cabinet Office
The reason for this is linked to women’s and men’s issues. Even if men intend to take child-care and family-care leave, the fact that it is difficult for women to continue working means that men have to abandon taking child-care and family-care leave. On the other hand, the long hours that men are forced to work means that it is women who must devote themselves to child care and family care, and must therefore stop working. Even if men and women attempt to realize the balancing of work and family life, they find themselves in a dilemma, and balance is extremely difficult to achieve.
As is shown above, the legal implementation in Japan of work-family support programmes and the regulation of these programmes by the majority of companies means that much better provision is made than was previously the case. However, as regards the effectiveness of the programmes, the rate of men subscribers is low and women tend to leave work before they can subscribe. These problems are influenced by the existence of problems that must be resolved by society, but also by problems that must be resolved by men and women themselves. In particular, they must resolve the domestic dilemma.
The impact of work-family support on work and on families
In order to examine the impact of work-family support, it is not fruitful to focus on men’s lives, since they are exempted from family responsibilities in line with the conventional “male-exemption” rule. In this section, we mainly focus on women’s work, especially their continuous workforce participation.
Core workers
Promotion to a managerial position in an internal labour market is a standard career goal desired by many Japanese workers (Imada, 1982). Large corporations usually hire new graduates as candidates for future managers. These new employees join the race up the career ladder to managerial positions. The race is only open to those who started their career in the corporation and have been continuously employed by the company. We call workers joining such a race “core workers”.
The vast majority of core workers are men. According to the Basic Survey on Wage Structure conducted by the Ministry of Health, Labour and Welfare, men comprise 98.7 per cent of directors of companies (butyou) in 1995. This figure demonstrates how few women join the race up the career ladder as core workers in the corporation.
One of the reasons why there are few women core workers could be gender discrimination at hiring. Until the 1980s, corporations used to refrain from hiring women for jobs offering chances of promotion. Although the Equal Opportunity Law (Koyou Kikai Kintou Hou) of 1985 prohibited such practices of discrimination against female applicants, these practices have continued. However, discrimination does not give a full explanation of why few women are in managerial positions. Even in a corporation with sex-neutral
80 Conditions of Work and Employment Series No. 5
hiring/training systems, most female workers retire before they reach the first chance for promotion (Taniguti, 2001, p. 71). There may be another reason why women discontinue their career as core workers.
In the context of work-family coordination, core workers experiences poor life conditions. They have long working hours, undertake heavy responsibilities in their jobs and experience frequent transfers. In other words, they have to meet the same standard of those undertaking no family responsibilities and devoting themselves entirely to their work. This may be a reason why women, most of whom unavoidably undertake family responsibilities when married, discontinue their career.
Non-core workers
In large Japanese corporations, many employees work as “non-core workers”, who are in charge of routine jobs assisting core workers. Female office workers — so-called office ladies — are representative non-core workers (Ogasawara, 1998). Generally speaking, they have no chance for promotion. Nevertheless, they are different from “secondary” workers defined in dual labour market theory (Doeringer and Piore, 1971), because they are guaranteed stable employment and show a low rate of mobility between employers (Tanaka, 1996; Seiyama, 1999).
The situation of non-core workers is the exact reverse of core workers. They enjoy flexibility in their working schedule, take on minor decision-making responsibilities in business affairs, and are free from transfers (Ogasawara, 1998). They thereby take advantage to coordinate work and family responsibilities. Non-core workers are in a favorable position with regard to work-family coordination.
In spite of these observed conditions, non-core workers (such as office ladies) do not succeed in continuing their career simultaneous with their family responsibilities. They demonstrate a strong tendency to quit jobs upon marriage or childbirth (Brinton, 1998; Hirata, 1998).
Since jobs of non-core workers are always routine and monotonous, they rarely have a commitment to such jobs. In addition, female non-core workers are required by unwritten “marriage bar” rules to quit upon getting married. Such practices have been regarded as illegal ever since the judicial precedent in 1967 that ruled against the marriage bar provision in an employment contract. However, these practices still survive today (Tanaka, 1998). Favorable conditions for work-family coordination may not work out satisfactorily because of psychological and institutional barriers.
Female professionals
The professional career is another desirable career path for Japanese workers. There are some professional occupations dominated by female workers: teachers, nurses and other medical/welfare professionals. These occupations have often been coveted by career-oriented women. Among these female occupations, female teachers and nurses in public institutions have been guaranteed child-care leave by law since 1975. These guarantees preceded the general Child Care Leave Law of 1995 by 20 years.
It is known that professional women show strong career continuity. Female workers in these professions show a high rate of continuing their full-time regular employment: more than 30 per cent (Tanaka, 1998), in contrast to the general continuity rate of 20 per cent (see Table 2-6). In particular, those in the public sector and in the teaching profession show higher rates of continuity (Hirao, 1997; Tanaka, 1998).

Conditions of Work and Employment Series No. 5 81
Local divergence
Divergence among local districts also provides insight regarding work-family issues. It has been known that women’s employment behaviour differs by district: generally speaking, women in urban areas tend not to work compared to those in rural areas. Recent studies focusing on particular life-stages detected local differences in the continuity rate of full-time regular employment at the child-rearing stage. Women in suburbs of megacities show a low continuity rate at about 10 per cent. In contrast, the continuity rate is 30 per cent for those in local cities or rural area (Tanaka, 2000). This suggests that working with family responsibilities is somewhat incompatible with the highly urbanized lifestyle.
The source of such incompatibility is still debated. A variety of factors have been subjected to scrutiny, including normative/cultural differences in gender ideology (Sechiyama, 1996), availability of support for child care (Nagase, 1998), and the length of commuting time (Kohara, 2000).
Nagase (1998, p. 37) pointed out that the supply of day-care centres is insufficient for urban residents’ needs, and that thereby a considerable number of parents are waiting their turn to leave their child in a day-care centre. Such unequal distribution of day-care centres may be a reason why work-family coordination is difficult in highly urbanized areas.
Another explanation focuses on the distance between the home and workplace. As a consequence of urbanization, many workers commute long distances. Much time is spent commuting, especially by those living in the suburbs of megacities such as Tokyo, Nagoya and Osaka. Kohara (2000) analyses time-use data of couples, and detects that the husband’s long commute decreases his wife’s work time. It is thus suggested that the distance between home and workplace is disadvantageous for those undertaking family responsibilities and pursuing their career in megacities.
Implications
The subjects discussed above give some models for future work-family lifestyles.
The work-system of female professionals offers support for family responsibilities, such as child-care leave. It also provides opportunities for achievements in their jobs if they have family responsibilities. Those aspects of the work-system are desirable for work-family harmonization, since family and work responsibilities do not take priority over each other.
In contrast, the work-system in large corporations is problematic because it separates core and non-core workers. Core workers have great chances for achievement in their jobs, at the cost of their ability to fulfill family responsibilities. On the other hand, non-core workers should give up career achievement, but their working conditions are suitable for work-family coordination. Those hired in corporations face the dilemma of whether to give up their career achievement or ignore their family responsibilities. The solution for that dilemma has been long awaited: a new work-system allowing workers to purse both their career achievement and their family responsibilities.
Locality is another key aspect for work-family policies. Administrative affairs on the basis of locality, such as city planning or public day-care centres, have a great influence on work-family matters. To fulfill both work and family responsibilities is difficult for anyone, without full support by the local administration. Local administrative affairs should be oriented to work-family harmonization.

82 Conditions of Work and Employment Series No. 5
Filling the work-family gaps: Effective sharing of support Recent debates on work-family support
Recent debates concerning child allowances, child-rearing allowances and day-care facilities, in terms of measures to be undertaken by the government and private business, is summarized below.
Child allowances. In 2000, in conjunction with the raising of the maximum age, the amount of tax deductions for a dependent child below 16 years of age was lowered from 480,000 yen to 380,000 yen. Nevertheless, there has been little debate concerning the integration of the child allowance and deductions permitted in the tax code. In addition to an expansion of the range eligibility for benefits, the income restrictions were raised in 2001. Some argue that there is no justification for payment of the child allowance in Japan, describing it as a “shotgun approach” to welfare. Rather than economic assistance for the upbringing of children, they argue that the employment environment and child-care facilities need to be boosted.
As for the child-rearing allowance paid to fatherless households, as was previously noted, the present trend is toward reduced payouts. When a reduction in income restrictions was debated in 1998, the debate concerned what effects, if any, the child-rearing allowance would have on a fatherless household’s ability to achieve financial self-sufficiency; whether, due to the increasing rate of divorce, it would become necessary to apply weight-placing importance on low-income, fatherless households to the child-rearing allowance; whether or not support to fatherless households should focus on employment measures; and others.
The debate leaned more toward financial self-sufficiency through employment than outright economic assistance, but the problem was that support strategy for employment was lacking, and due to the unfavorable system as relates to wages and working conditions for women, any reduction in the allowance was believed likely to result in a further decline in a fatherless household’s standard of living. During the past and present period of economic recession, this problem has become more severe.
Day-care facilities, which have not been able to eliminate the waiting list for applicants, are being expanded to accommodate 50,000 within fiscal 2002 and 100,000 by 2004. The Japanese government has proposed such work-family measures as (1) making use of vacant classrooms at schools and other public facilities and convenient places, such as rail stations, as well as encouraging private sector initiatives; and (2) taking rapid steps to set up facilities that meet appropriate standards. The entry into operation of public day-care facilities by private enterprises was recognized from April 2000, and from April 2001, the first joint public-private day-care facilities commenced operation. From October 2001, government agencies themselves opened an unauthorized day-care facility in Kasumigaseki, Tokyo’s government office district. Some day-care operators have voiced opposition to such private sector activities, but the government has energetically taken up this issue.
“Who” (family, company, community or government) would be most effective in bearing the burden and how the different measures are linked
Day-care facilities have an extensive range of functions in Japan, providing numerous services, such as time extension and so on. In their present state, which does not take working time into consideration, efforts have been made to promote measures on a community basis. Maeda (2000), however, reported that unemployed women who desire to

Conditions of Work and Employment Series No. 5 83
work and hold down a job say that, more than salary paid during child-care leave and extension of the child-care leave, they would prefer to have shorter working hours while rearing their child or flexibility that would allow for reduction of working hours. In the future, it will be desirable to actively implement shorter working hours or reduction in working time. To realize such measures, adoption of such improvements as part-time work and work from home will be needed. Ideally, the apportionment of male-female working times needs to be reconsidered. It is not a question of “who” will conduct this work-family support, but rather measures to improve the process need to be adopted by the government, employers and families.
Concerning day-care centres, a variety of services are being provided and, along with their increasing privatization, day-care facilities on business premises have become conspicuous. However, such facilities are mainly friendly to those employed by the organization, and have the merit of making it possible for that company to secure outstanding human resources that will elevate its productivity and profitability. On the other hand, there is the possibility that companies facing financial difficulties will scale down or abolish such facilities. Such day-care facilities provide services matched to the parent’s working times, but this brings with it the disadvantage of providing a day-care environment that is determined by matching to the parent’s income or the size of the company. Other problems would involve the burden on parent or child commuting or disadvantages related to the community.
Considering the merits and demerits of the above, and beyond this, the Child Welfare Law, and the spirit behind the Convention on the Rights of the Child that was ratified by Japan in 1994, it will be necessary to consider the matter from the perspective of assuring the best type of child-care facility. In other words, in terms of the promotion of measures for day-care centres, it is desirable to achieve a balance between the government, employer, the private sector, the family and the community.
Summing up in terms of work-family measures, the respective government, employer and family entities will need to recognize that:
(1) when work times and the day-care services do not match, rather than just extending the day-care period, review should be given to the working time as well; and
(2) as such services become further commercialized, it will become increasingly difficult to link children, parents, community and businesses, necessitating day-care conditions that form the nucleus around which participation and linkage revolve.


Conditions of Work and Employment Series No. 5 85
IV. Overview of the major issues
Work-family implications of the lifecycle from a family perspective
Japan has made legal provision for child-care and family-care leave systems as work-family support programmes. If workers apply to their companies for such leave, their companies are obliged to grant it. While among small- and medium-sized enterprises it remains rare, the majority of large companies have regulated the child-care and family-care leave systems.
Despite the provision of these programmes, however, the number of workers who have actually taken advantage of them is low. For example, only 56 per cent of women giving birth took child-care leave. Moreover, less than 1 per cent of men took child-care leave. The percentage of workers taking family-care leave is similarly low. Why is it, then, that workers refrain from taking the leave available to them?
As seen in Part IV, both men’s and women’s issues are tied up with this problem. For men, long working hours make it difficult for them to shoulder family responsibilities. For women, it is evident that there is a wage gap between men and women, with women’s relative wages lower than men’s. As a result, the issue of domestic resource distribution when a family faces a time of child care or family care becomes something of a dilemma. Even if the man attempts to balance work and family life, if his spouse is a full-time housewife he must prioritize work. On the other hand, even if the woman attempts to balance work and family life, if her spouse prioritizes work she must then prioritize the family, because the social and family conditions which make work and family life balance are not still improved.
This domestic dilemma comes to the forefront at certain times during the lifecycle, in particular at the times of childbirth and family care. The problem lies in whether or not child care and family care can be effectively carried out after the leave period has ended. If people are concerned about their ability to care for children or parents after leave, the dilemma comes into play and the leave systems become ineffective.
A further aspect to this problem lies in the fact that unmarried men and women observing the family dilemma are then less likely to marry. Being aware in advance of the dilemma likely to befall them after marriage, working women in particular are tending to put off marriage. According to the Basic Survey for Birth Movement carried out by the National Institute of Population and Social Security Research, the average length of the courting period between meeting and marriage is increasing yearly, with the present length 32 per cent longer than ten years ago. Japan’s trend towards late marriage, then, continues in the form of increasing courting time. This trend towards late marriage is lowering the birthrate and significantly contributing to the continued development of a top-heavy society.
Reduced working hours and the elimination of the wage gap between men and women would likely complement the effectiveness of the work-family support programmes in Japan. As policies supporting the compatibility of work and family life, child-care and family-care leave have been highlighted, but the Japanese government needs to work towards resolving the more fundamental issues of reduced working hours and the elimination of the wage gap between men and women.

86 Conditions of Work and Employment Series No. 5
Implications of the changing nature of work on the family
In Japan, the idealized life course for females has been the “re-employment” pattern, in which they marry, leave work to bear children and then return to the workplace. In most cases, when they take up re-employment, they seek part-time work that enables them to balance work with their family lives. However, this has the effect of substantially reducing their lifetime earnings. Through the tax system, favourable social insurance premiums and the payment of dependent allowances, this currently enables work adjustment.
Employment of part-time workers has advantages to employers as well, since it lowers employment costs. In households with couples, even with the discrepancies of this system, since there are both merits and demerits, reform of its various problems has been negligible.
More recently, the number of women who desire to maintain a lifelong career even when marrying and bearing children has increased. Considering the promotion of the present level of work-family support, in the future a system can be foreseen in which both men and women reduce their working time or select part-time jobs. In such cases, it would be expected that the discrepancies for those who work shorter hours or at part-time jobs that have not yet surfaced up to now would become more apparent. In Japan, workers can be contracted to work more than 35 hours a week, plus overtime, and still be regarded as part-timers. When compared with other countries, however, a considerable gap exists in terms of wages and working conditions for part-time workers as opposed to regular company staff.
At present, consideration is being given to reforming the present unequal social pension system, which has the merit for part-time workers of making pension payments even though contributions are not collected from these workers. This would be replaced with a system withholding a portion of the wages from part-time workers as well. The review of this system would also call for a child-care leave system and other work-family measures. It is desirable to apply work-family measures, whether the individual involved is male or female, even for those who make the choice for reduced working hours or part-time work.
Efficiency and effectiveness in achieving a work-family balance
Let us now examine the effects of the child-care leave system in order to determine the effectiveness of the work-family support programmes. Table 5-1 shows the results of a probit analysis of the rate of continued employment of women who remained in employment prior to giving birth (see Waldfogel et al., 1999). The data used were from the Panel Survey on Consumers carried out by the Institute for Household Economy. In the case where a woman was employed before childbirth, the dependent variable is 1; if not, it is 0. The table reveals the following. First, if the child-care leave system is added as an explanatory variable, there is no variation in the probability of continued employment according to education. Further, compared to the birth of the first child, the probability of continued employment rises after the birth of a second child. Moreover, the probability of continued employment for people who have taken advantage of the child-care leave system is 35 per cent higher than for those who have not.

Conditions of Work and Employment Series No. 5 87
Table 5-1. Retention of women after childbirth in Japan: Marginal effects from probit models
(1) (2) Age at birth 0.0200
(0.0180) 0.0104
(0.0165) Job tenure at birth 0.0414
(0.0138) 0.0504
(0.0139) College 0.5494
(0.3185) 0.4337
(0.3089) Junior college 0.4424
(0.2931) 0.2364
(0.2871) High school 0.4889
(0.2977) 0.2093
(0.2841) Not first birth 0.3163
(0.1051) 0.2207
(0.0969) Eligible for maternity leave 0.5927
(0.1738)
Covered by child-care leave 0.2211 (0.1061)
Large firm (over 1,000 workers) 0.2427 (0.1394)
0.0788 (0.1333)
Medium firm (100-999 workers) -0.01055 (0.1173)
-0.0588 (0.1150)
Pseudo R2 0.4367 0.2961 Observations 134 138 Note. Standard error in parenthesis Source. Waldfogel et al., op. cit., Table 5.
In this respect, at least, the child-care leave system would seem to be greatly effective, but this effectiveness is, of course, limited to those who remain in employment up until childbirth. As we saw in Table 3-12, only 32.6 per cent of women remained in employment during the year before childbirth. Almost 70 per cent of women had already stopped working, such that the child-care leave system had no effect on them whatsoever. If it were the case that none of these 70 per cent of women wanted to continue working, then there would be no problem; however, if it were a case of them wanting to work but having no choice but to resign, then there would clearly be much room for improvement. When one considers the fact that most women re-enter the labour market as part-timers after the demands of child care have somewhat decreased, it would appear that the situation where women retire to give birth and raise children demands improvement.
Concrete measures to this effect would include reduced working hours and the elimination of the wage gap between men and women, which would greatly help to solve the domestic dilemma. However, these, in turn, would give rise to the following problems. Reductions in working hours without changes in wage levels would push up the levels of hourly wages. Without a rise in labour productivity, this would increase labour costs. Reducing working hours in this way would decrease Japan’s international competitiveness, and would likely then bring about a decrease in national income. If, on the other hand, working hours were reduced without a change in hourly wage levels, income levels would decrease. Consequently, there would be a trade-off between the availability of more time with family and lower income. This would not be such a problem if income levels could be maintained through both men and women working. However, should it remain difficult to balance work and family life, living in Japan, where purchasing power parity is higher than in other developed countries, would likely become more taxing.
Further, the elimination of the wage gap between men and women is no small task. Of particular concern is that it would reduce the demand for female labour. If one understands the demand for female labour to depend on their relative wages being lower than men’s, then this would be the consequence. Hourly wages for part-timers are, in fact, lower than those of full-timers, and it is this that has increased the demand for part-timers in recent

88 Conditions of Work and Employment Series No. 5
years. Reducing working hours and eliminating the wage gap between men and women both have their downside. The question, perhaps, is, in light of these trade-offs, what kind of lifestyle the Japanese want.
Gender impact of work-family measures
We have examined a variety of work-family measures. Regrettably, the impact of these measures on the traditional gender model was insignificant. Here we discuss three issues: reduction of working hours, non-core tracks in corporations, and the child-care leave system.
(1) Since the 1980s, the Japanese government has aimed to reduce standard working hours. Though the government did not concern itself with gender issues at that time, that policy is reasonable from the gender perspective, because men can afford time for housework if their working time is reduced. However, when average working hours were reduced under the new policy, there was no corresponding increase in men’s participation in housework.
(2) When the 1985 Equal Opportunity Law prohibited the exclusion of women from any employment process, a number of major corporations established a gender-free, two-track system: one track for core workers was called sougousyoku; the other, for non-core workers, was called ippansyoku. Under the pretence of a gender-free employment system, those tracks in practice have been clearly segregated by sex: male core workers and female non-core workers, with a few exceptions of female core workers (Watanabe, 1995). Though the non-core track offers an advantage for coordinating work and family responsibilities, men do not enjoy that advantage.
(3) Until the 1980s, child-care leave was for women only. The Child Care Leave Law of 1992 established the right for both sexes to take child-care leave. However, only a few men take child-care leave.
There has been a prevalent unwritten rule to exempt men from household responsibilities. As long as people follow that unwritten rule, the clear division of labour between the sexes will continue, whether or not any gender-free work-family measure is introduced.
Article 8 of the 1999 Basic Law for a Gender-Equal Society first addressed affirmative action to recover the gender balance. Work-family measures should promote affirmative functions to make men undertake household responsibilities; for example, a system where men can take child-care leave on favourable terms. Encouragement and support for discontinuous careers for males is also important.
Work-family measures and the poverty of families
One-parent households, as has been demonstrated herein, tend to be economically disadvantaged irrespective of whether or not the parent is working. At the same time, contradictions in the system exist in that the favourable provisions in the tax system and social insurance premiums do not apply to one-parent households. However, in the future, through the elimination of differentials between male and female wage levels, application of work-family measures even to part-time workers and short-time workers, and the adoption of neutral tax and social security systems for workers, are likely to diminish poverty.
Nevertheless, if the working hours of the breadwinner in a one-parent household are reduced, this is likely to result in a lowered living standard. In many cases, they can no

Conditions of Work and Employment Series No. 5 89
longer afford to say that working hours are incompatible, and there is no luxury to reduce them. Moreover, the resulting decline in the living standard is also likely to affect the child.
Considering these points, even if working hours are reduced, it is important to promote future improvements without a reduction in the standards of day-care services from their current level. Without disregarding the perspective of child welfare, it will be necessary to take work-family measures in a manner that always takes the child’s rights into consideration. Whatever the type of household — whether in households where both parents work or one-parent households — measures to guarantee safe and secure living will enable parents to work while maintaining peace of mind.


Conditions of Work and Employment Series No. 5 91
V. Summary and conclusions
Summary
Since the collapse of the bubble economy of the late 1980s and early 1990s, Japan has experienced low economic growth and high unemployment. Meanwhile, numbers of the employed and employees have fallen, while the employment of irregular workers, especially part-timers, is on the rise. In the internal labour market, the ageing of employees and steep rises in labour costs have caused problems, resulting in increased employment outsourcing. On the other hand, deregulation of the external labour market has progressed, with the derestriction of employment introduction in the private sector and of worker dispatch businesses. In such an economic context, the introduction of work-family policies in companies raises costs and is, therefore, quite likely to be shunned.
Words in modern Japanese commonly used to refer to the family are “family” (kazoku), “home” (katei) and “household” (setai). The most important of these in the administrative context is “household”, which is defined as “a group of people who live and make a living together”. A household is further understood to comprise two of the following factors: “family kinship”, “shared dwelling” and “shared livelihood”. As well as being the research unit for a variety of designated statistics, the household is the unit for the composition of the Basic Resident Registers, National Health Insurance insurants, and social welfare accreditation.
In post-war Japan, more than half the households were always two-generation households made up of parents and unmarried children, with three-generation households never amounting to more than 30 per cent of the total. Up until and throughout the 1960s, the pattern of household composition remained relatively unchanged (apart from a rise in households consisting simply of a husband-and-wife couple). Since 1970, the ratio of three-generation households has fallen. If we look only at households with a child under 6 years of age, three-generation families comprised about 30 per cent up until and throughout the 1980s. Since the start of the 1990s, however, there are signs that this ratio is falling.
Changes in the lifecycle of Japanese families can be seen in such phenomena as the ageing of society, the increase of non-marriage, and the declining total fertility rate (TFR). According to the National Institute of Population and Social Security Research, the decline in the TFR will bottom out and stabilize at the start of the 21st century.
The rate of those going on to higher education is high in Japan and the rate of women going to university, in particular, has risen in the 1990s. However, the majority of women who are married and university graduates does not pursue a career, which, from the perspective of effective utilization of labour resources, is a serious problem. Further, the labour force participation rate of women by age describes an M-shaped curve that continues to dip for marriage, childbirth and child care. Factors contributing to this are:
� the low level of economic assistance (such as the allowance for dependent children and the dependency tax exemption) for families raising children;
� the shortage of child-care centres, which is particularly severe in large cities; and
� the fact that men work long hours, and participate little in housework and child care.
In 2000, total annual working hours in Japan averaged 1,859 hours, remaining longer than the government target of 1,800 hours. The rate of taking annual paid holidays was not more than 50 per cent, as it remains difficult for workers to take their allotted paid
92 Conditions of Work and Employment Series No. 5
holidays. While it can be said that working hours have undergone a gradual reduction, this has not had any tangible effect in enabling people to balance work and family life.
In the area of work-family policy, laws such as the Childcare and Family-care Leave Law and the Equal Employment Opportunity Law between Men and Women have been enacted, but to no great effect. Among those who have taken child-care leave, the rate of continued employment is high; however, the fact that a great number of women pull out of the labour market immediately after marriage and before childbirth reveals the limited effectiveness of child-care leave for women workers. Furthermore, family-care leave is hardly being utilized at all.
There is a trend in Japan towards decreased numbers of self-employed persons. If we look at long-term variations in the women’s labour force participation rate since the Second World War, it is clear that the decrease in numbers of self-employed (particularly in agriculture) mirrors a decline in the women’s labour force participation rate. At present, there are roughly equal numbers of self-employed in primary and tertiary industries, and the proportion of women in these industries is higher than that of men. In recent years, the number of teleworkers has increased, and it is said that about 70 per cent of these are women. However, women teleworkers tend to be engaged in relatively simple work and are, therefore, compensated at low rates.
Prior to the 1990s, the concept of child care was that of care by the mother, and full-time housewives were treated preferentially with respect to tax and social welfare systems. However, since the TRF dipped to 1.57 in 1989, the Japanese government has turned its attention to policies aimed at alleviating the demands of family life. The Angel Plan was drawn up in 1994 and, at the same time, the Five-year Program on Emergency Measures for Nursery Care and Other Related Matters was announced, detailing the expanded provision of infant and overtime child care. Moreover, the Angel Plan described as policy a comprehensive response to the declining birth rate aimed at a variety of fields, such as child care, mother-and-child health care, work, place of residence and education. However, these various measures rested on the premise of child care by the mother, with meagre provision of measures designed to promote the father’s participation in housework and child rearing.
Recommendations
The situation described above leads us to believe that the Japanese government needs to introduce the following kinds of policies at the earliest possible opportunity.
Increased efforts towards further reduction of working hours
The Japanese government needs to enact an action programme in order to bring about the earliest possible realization of its stated target of 1,800 total annual working hours. Policies requiring implementation include, for example, those aimed at raising the amount of annual paid holiday actually taken (currently only 50 per cent of provided holiday is taken), raising overtime premiums for non-scheduled work, and eliminating “service” (unpaid) overtime.
Rapid elimination of the wage gap between men and women
The wage gap between men and women is greater than that in other developed countries, which is one factor discouraging women from remaining in the labour market

Conditions of Work and Employment Series No. 5 93
during childbirth and child rearing. As a result, despite its implementation, the child-care leave system is not proving as effective as expected. If the wage gap is not eliminated, it will, in turn, prove difficult to eliminate the phenomenon of gender-based division of labour, ensuring that work-family policies remain limited in their effectiveness.
Quick resolution of various issues concerning part-time workers
There are many women hoping for re-employment after childbirth/care in Japan, and most of them choose part-time work in order to integrate their work with the demands of family life. Choosing this kind of work, however, means a large drop in lifetime earnings, with concomitant results, such as a lower place in the priority ranking for a place for one’s child in a nursery. Further, the preferential treatment accorded married women by the tax and social insurance systems causes an employment adjustment problem as more women refrain from re-entering the labour market. There is a need for the immediate recasting of a neutral system with respect to this kind of employment behaviour, and the improvement of the conditions in which part-timers work. In fact, a legislative bill has been introduced proposing that, as of the next pension reform, part-timers also be made to pay pension premiums; a proposal that stems from efforts to revise a system that is not neutral as regards employment choice.
There is a need, moreover, for measures to ensure that even those who choose part-time work will be able to benefit from work-family policies, such as the child-care leave system. It is hoped that any household with any work pattern will be able to balance work and family life and benefit from work-family policies.
Efforts to heighten public awareness of work-family policies
Work-family policies — reflecting the fact the male labour force has never been thought of as a resource for balancing work and family life — have been drawn up in such a way as to make them largely irrelevant to men and are, consequently, gender-biased. Certain developments have taken place, such as making women’s clerical work in large companies available to men as “general level employment”, in line with the enactment of the Equal Opportunity Law, and the provision of leave to men also under the terms of the Childcare Leave Law. Nevertheless, there has been almost no increase in the number of men taking advantage of these provisions.
In order to address this problem, conceptual change is vital: the male labour force needs to be recognized as a resource that can play a role in family life. There is, as yet, no evidence that merely making the aims of work-family policy gender-neutral will bring about a concomitant change at this conceptual level. If, however, policies were implemented that effectively induced the male labour force into such a role, it might be a different story: child-care leave that only men can take, for example. There is surely room to experiment with such policies.
Comprehensive measures to assist economically disadvantaged families
One-parent households, which find it difficult to escape from a state of comparative poverty despite working, need more support than they have hitherto received. This, too, will necessitate the elimination of the wage gap between men and women, the application of measures supporting balanced work and family life even for part-time and temporary workers, non-preferential tax and social welfare systems, and the like.
94 Conditions of Work and Employment Series No. 5
However, because reduced working hours mean even lower standards of living for one-parent families, in many instances considering a different or reduced schedule is not a viable option. Such an environment invariably affects a child’s development. Consequently, it must be ensured that children’s welfare is not overlooked and that child-care facilities are amply provided. Policy related to the compatibility of work and family life must be formed in such a way as to protect the rights of children.
Spurring on economic growth with a view to lowering the unemployment rate
Since the introduction of new work-family policies would mean an increased burden on companies, it is unlikely that these could be smoothly introduced in Japan’s present economic context. For example, a reduction in working hours with no corresponding reduction in yearly income would raise the cost of hourly wages, making the introduction of reduced hours both difficult and unappealing to employers. Accordingly, appropriate economic and financial policy needs to be adopted in order to enable Japan to recover its “lost decade”. At the same time, the unemployment rate needs to be lowered via suitable labour market policy.

Conditions of Work and Employment Series No. 5 95
Bibliography
M. Abe [1999]: “Shoshi-ka zidai ni okeru rodo shizyo” (The effect of the declining birthrate on the Japanese labour market), in Kikan syakai hosho kenkyu (Journal of Social Security), 1999 (National Institute of Population and Social Security Research) [in Japanese].
M. Abe and S. Ohta [2001]: “Fluctuations in unemployment and industry labor markets”, in Journal of Japanese and International Economy, 2001.
M. Atou [1997]: “Zinkou hendou to kazoku hendou” (Demographic changes and family changes), in M. Atou and K. Hiroyuki (eds.): Sirīzu zinkougaku kenkyuu 7: Zinkou hendou to kazoku (Population studies series 7: Demographic changes and the family) (Tokyo, Taimeidou, 1997), pp. 11-24 [in Japanese].
— [1999]: “Zyendā toukei no genzyou to kadai” (Current gender statistics and their problems), in K. Tosiko, Y. Sumiko and K. Kimiko (eds.): Sociology in Japan 14: Gender studies (Tokyo, University of Tokyo Press, 1999), pp. 109-150 [in Japanese].
Bank of Japan: Bank of Japan statistics and other key statistics.
M.C. Brinton [1998]: “The evolution of the clerical sector” (translated by T. Kaoru), in Nihon roudou kenkyuu zassi (Journal of the Japan Institute of Labour), No. 453, 1998, pp. 36-49 [in Japanese].
Council for Gender Equality (Danzyo Kyoudou Sankaku Singikai) [1996]: Vision of gender equality (translation of Danzyo Kyoudou Sankaku Singikai, report submitted to the Prime Minister on 30 July 1996) (http://www.gender.go.jp/toshin-e at 14 December 2001).
P.B. Doeringer and M.J. Piore [1971]: Internal labor markets and manpower analysis (Lexington, MA, DC Heath, 1971).
Economic and Social Research Institute, Department of National Accounts, Cabinet Office: National account.
Gender Equality Bureau, Cabinet Office: Public opinion poll.
Y. Higuchi [1991]: Nihon keizai to syuugyou koudou (Labour supply behaviour and the Japanese economy) (Tokyo, Touyo Keizai Shinposha, 1991) [in Japanese].
Y. Higuchi and M. Abe [1992]: “Rodo zikan seido to zyugyo in no teichaku ritu” (The working hours system and employees’ length of employment), in Keizai Kenkyu (Economic research), Vol. 43, No. 3, 1992 (Institute of Economic Research, Hitotsubasi University) [in Japanese].
Hikaku Kazokusi Gakkai [1996]: Ziten Kazoku (Encyclopaedia of family) (Tokyo, Koubundou, 1996).
K. Hirao [1997]: Work histories and home investment of married Japanese women, PhD dissertation (Department of Sociology, University of Notre Dame), UMI No. 9720968.
S. Hirata [1998]: “Female occupations and occupational career”, in S. Kazuo and I. Sachiko (eds.): SSM Research Series 12: Changing career structures of women (Tokyo, University of Tokyo, 1998) [in Japanese].
K. Hirosima [2000]: “Decomposition of the decline in the total fertility rate since the 1970s in Japan”, in Journal of Population Studies (Jinkogaku kenkyu), No. 26, 2000, pp. 1-20 [in Japanese].
S. Imada [1982]: “Occupational careers and labour market structure”, in Koyou Syokugyou Kenkyuu (Employment and vocational research), Vol. 19, 1982 [in Japanese].

96 Conditions of Work and Employment Series No. 5
M. Iwata [1995]: “Social policy and the measurement of social need”, in Journal of Social Sciences and Humanities (Jimbun Gakuho), No. 261 (Tokyo Metropolitan University) [in Japanese].
— [1996]: “Independence of the elderly and ageing of poverty”, in Journal of Ohara Institute for Social Research, No. 447 (Hosei University) [in Japanese].
Japan Institute of Labour (JIL) [1998]: Jouhou tsuushin kiki no katsuyou ni yoru zaitaku shuugyou no jittai to kadai (Conditions and problems of at-home work as related to the use of information and communications technology), Surveillance Study No. 113 [in Japanese].
Japan Supreme Court [2000]: Annual report of judicial statistics: Family case.
Japanese Trade Union Confederation (RENGO) [1999]: The spring struggle for better life.
T. Kishi [2001]: Zyosei no syugyo to katei-hoiku sisetu no ikuzi buntan (Female labour supply and allotment of child care between home and nursery school), paper presented at the Autumn meeting of the Japanese Economic Society, 2001 [in Japanese].
M. Kohara [2000]: “Commuting time, work at home and work in the marketplace”, in Nihon roudou kenkyuu zassi (Journal of the Japan Institute of Labour), No. 476, 2000, pp. 35-45 [in Japanese].
N. Maeda [1998]: “The effects of the extended household on women in the workforce”, in Nihon roudou kenkyuu zassi (Journal of the Japan Institute of Labour), No. 459, 1998, pp. 25-38 [in Japanese].
— [2000]: “Harmonization between work and child care: Some implications for social policy”, in Kikan Shakai Hosho Kenkyu (Social Security Research), Vol. 36, No. 3, 2000 (National Institute of Population and Social Security Research) [in Japanese].
S. Matsuda and Y. Suzuki [2002]: “Relation of labour time and domestic labour time of the couple: Primary factors of household division of labour in Japan through analysis of Survey of Time Use and Leisure Activities”, in Kazoku syakaigaku kenkyuu (Journal of family sociology), Vol. 13, No. 2, 2002, pp. 73-84 [in Japanese].
Ministry of Education, Culture, Sports, Science and Technology: School statistics.
Ministry of Health, Labour and Welfare: General survey on wages and working hours systems.
— : Vital statistics.
— : Comprehensive survey of wages and working hours systems.
— : Basic survey on wage structure.
— : Monthly labour survey.
— : Survey on social welfare institutions, etc.
— [1994]: Report of the investigation for diversification of employment formation.
— [1999]: Survey on female employment management.
— [2002]: Live births: Special report of vital statistics (Tokyo, Kousei Toukei Kyoukai, 2002) [in English and Japanese].
Ministry of Finance: Trade statistics.

Conditions of Work and Employment Series No. 5 97
Ministry of Public Management, Home Affairs, Posts and Telecommunications: Communication in Japan (white paper).
— : Labour force survey.
— : Labour force survey: Special survey.
— : Employment status survey.
— : Establishment and enterprise census.
— : Population census.
— : Survey on time use and leisure activities.
K. Morioka [1993]: Gendai kazoku hendouron (Changes in contemporary families) (Kyoto, Mineruva Syobou, 1993), ISBN 4-623-02301-X [in Japanese].
N. Nagase [1998]: “Hoikusyo, youtien no riyou zittai to kodomo eno koukyou seisaku” (Public policies for children: Demand for and supply of kindergartens and day-care centres), in Hattatu (Development), Vol. 74, 1998, pp. 34-43 [in Japanese].
— [1999]: “Work and childbearing choice of married women in Japan: The effect of labour practices”, in Journal of Population Problems (Jinko Mondai Kenkyu), Vol. 55, No. 2, 1999 (National Institute of Population and Social Security Research) [in Japanese].
— [2000]: “Kazoku kea: josei no shuugyou to kouteki kaigo hoken” (Informal care for the elderly, female labour supply and the impact of the introduction of nursing care insurance), in Kikan Shakai Hosho Kenkyu (Journal of Social Security Research), Vol. 36, No. 2, 2000 (National Institute of Population and Social Security Research) [in Japanese].
National Institute of Population and Social Security Research (IPSS) [1997]: Population projections for Japan: 1996-2100 (Tokyo, Kousei Toukei Kyoukai, 1997) [in Japanese].
— [2000]: Zinkou no doukou: Nihon to sekai: Zinkou toukei siryousyuu 2000 (Demographic trends: Japan and the world: Population statistics 2000) (Tokyo, Kousei Toukei Kyoukai, 2000) [in Japanese].
F. Nishizaki, Y. Yamada and E. Ando [1998]: “Income inequality in Japan with cross-national perspectives”, in Economic Analysis-A Series of Policy Research, No. 11, 1998 (Economic Planning Agency Economic Research Institute) [in Japanese].
Y. Ogasawara [1998]: Office ladies and salaried men (Berkley, University of California Press, 1998).
Y. Okusa [1999]: “Kaigo basho no sentaku to kaigosha no shuugyou sentaku” (The care giver’s choice of where they care for the elderly and of whether or not they remain in the labour market), in Iryo to Shakai (Health Care and Society), Vol. 9, No. 1, 1999 [in Japanese].
M. Oshio [1996]: Kazoku Teate no Kenkyu (Study of family allowance) (Kyoto, Houritu Bunkasha, 1996) [in Japanese].
K. Sechiyama [1996]: Higasi Azia no kahutyousei (Patriarchy in East Asia) (Tokyo, Keisou Syobou, 1996) [in Japanese].
K. Seiyama [1999]: “Is the career structure for women changing?”, in Nihon roudou kenkyuu zassi (Journal of the Japan Institute of Labour), No. 472, 1999, pp. 36-45 [in Japanese].
98 Conditions of Work and Employment Series No. 5
H. Shimada [1986]: Roudou keizaigaku (Labour economics) (Tokyo, Iwanami Syoten, 1986), ISBN 4-00-004328-5 [in Japanese].
Statistics Bureau, Management and Coordination Agency [1993]: 1991 Survey on time use and leisure activities: Volume 1 (Tokyo, 1993) [in English and Japanese].
— [1998]: 1996 Survey on time use and leisure activities: Volume 1-1 (Tokyo, 1998) [in English and Japanese].
T. Suzuki [2000]: “Ken’nen no kekkonryoku to syussyouryoku no teika ni tuite” (On recently declining fertility and nuptiality), in Kikan Kakei Keizai Kenkyuu (Japanese journal of research on household economics), Vol. 47, 2000, pp. 13-19 [in Japanese].
G. Tamura [1996]: Oyako no saiban koko 30nen (Judgements for the past 30 years on parental relations) (Hatiouzi, Tyuuou Daigaku Shyuppanbu, 1996) [in Japanese].
S. Tanaka [1996]: “Occupational structure and continuity of women’s work-force participation”, in Sosiorozi (Sociology), No. 126, 1996, pp. 69-85 [in Japanese].
— [1999]: “The rational household theory examined”, in Riron to houhou (Sociological theory and methods), No. 14, 1999, pp. 19-34 [in Japanese].
— [2000]: “Seibetu bungyou o izi site kita mono” (What has perpetuated the sexual division of labour), in K. Seiyama (ed.): Stratification system in Japan 4: Gender, market and family (Tokyo, University of Tokyo Press, 2000) [in Japanese].
M. Taniguti [2001]: “Zyosei ni totte no Nihongata keiei” (Japanese management for women), in S. Youko, S. Masamitu and S. Sumito (eds.): Gender management (Tokyo, Touyou Keizai Sinpousya, 2001) [in Japanese].
T. Toda [1937]: Kazoku kousei (The composition of the family) (Tokyo, Koubundou Syobou, 1937) [in Japanese].
A. Tsumura [2000]: “Child allowance and inter-generational solidarity”, in Syukan Shakai Hosho (Weekly of Social Security), Vol. 54, No. 2091, 2000 [in Japanese].
T. Tsuru [1997]: “Mu-Kumiai Kigyou no Roushi Kankei: Hatsugen Sanka Chingin Kettei” (Industrial relations in non-labour union companies: Voice, commitment and wage determination), in The Economic Review, Vol. 48, No. 2, 1997 (Institute of Economic Research, Hitotsubashi University) [in Japanese].
N.O. Tsuya and L.L. Bumpass [2002]: “Time allocation between employment and housework in Japan, South Korea and the United States”, in K. Oppenheim Mason, N.O. Tsuya and M.K, Choe (eds.): The changing family in comparative perspective: Asia and the United States (Honolulu, East-West Center, 2002), pp. 83-104.
M. Umezaki, I. Hitoshi and O. Ryutaro [1999]: “Daily time budgets of long-distance commuting workers in Tokyo megalopolis”, in Journal of Biosocial Science, Vol. 31, 1999, pp. 71-78.
J. Waldfogel, Y. Higuchi and M. Abe [1999]: “Family leave policies and women’s retention after childbirth: Evidence from the United States, Britain and Japan”, in Journal of Population Economics, Vol. 12, No. 4, 1999.
T. Watanabe [1995]: Kōsu betu koyou kanri to zyosei roudou (Women’s work and the course-based management system) (Tokyo, Tyuuou Keizaisya, 1995) [in Japanese].