recommended minimum flow for the rainbow river system
TRANSCRIPT

June 2017
Kym Rouse Holzwart, Yonas Ghile, Ron Basso, Doug Leeper, Sean King
Southwest Florida Water Management District Brooksville, Florida
Recommended Minimum Flow for the Rainbow River System
REVISED FINAL DRAFT

Recommended Minimum Flow for the Rainbow River System
REVISED FINAL DRAFT
June 2017
Kym Rouse Holzwart, Yonas Ghile, Ron Basso, Doug Leeper, Sean King
Southwest Florida Water Management District Brooksville, Florida
The Southwest Florida Water Management District (District) does not discriminate on the basis of disability. This nondiscrimination policy involves every aspect of the District’s functions, including access to and participation in the District’s programs and activities. Anyone requiring reasonable accommodation as provided for in the Americans with Disabilities Act should contact the District’s Human Resources Bureau Chief, 2379 Broad St., Brooksville, FL 34604-6899; telephone (352) 796-7211 or 1-800-423-1476 (FL only), ext. 4703; or email [email protected]. If you are hearing or speech impaired, please contact the agency using the Florida Relay Service, 1(800)955-8771 (TDD) or 1(800)955-8770 (Voice).
2

Recommended Minimum Flow for the Rainbow River System
June 2017
The geological evaluation and interpretation contained in the report entitled Recommended Minimum Flow for the Rainbow River System has been prepared by or approved by a Certified Professional Geologist in the State of Florida, in accordance with Chapter 492, Florida Statutes.
Ronald J. Basso, Jr. Professional Geologist License No. PG 0001325
3

Table of Contents ACKNOWLEDGEMENTS ................................................................................................................ 6 EXECUTIVE SUMMARY .................................................................................................................. 7 CHAPTER 1 – INTRODUCTION TO MINIMUM FLOWS AND LEVELS AND THE RAINBOW
RIVER SYSTEM ...................................................................................................................... 9 1.1 LEGAL DIRECTIVES FOR MINIMUM FLOWS AND LEVELS ESTABLISHMENT ..................................... 9 1.2 DEVELOPMENT OF MINIMUM FLOWS AND LEVELS IN THE SOUTHWEST FLORIDA WATER MANAGEMENT DISTRICT .............................................................................................................. 10
1.2.1 Overview of Minimum Flows Development for Flowing Systems 10 1.2.2 Defining Significant Harm 12
1.3 VERTICAL DATUM .................................................................................................................. 13 1.4 DESCRIPTION OF THE RAINBOW RIVER SYSTEM ...................................................................... 13 1.5 INDEPENDENT SCIENTIFIC PEER REVIEW AND PUBLIC WORKSHOP FOR THE RECOMMENDED MINIMUM FLOW FOR THE RAINBOW RIVER SYSTEM ....................................................................... 17
CHAPTER 2 – HYDROLOGIC EVALUATION OF THE RAINBOW RIVER WATERSHED ......... 18 2.1 HYDROLOGIC SETTING ........................................................................................................... 18 2.2 CLIMATE AND RAINFALL.......................................................................................................... 22 2.3 RAINBOW SPRINGS GROUP DISCHARGE AND UPPER FLORIDAN AQUIFER WATER LEVELS ......... 25
2.3.1 Rainfall, Upper Floridan Water Levels, and Rainbow Springflow 29 2.3.2 Rainbow River Flow and Rainbow Springs Well Near Dunnellon, FL Water Levels Since 2000 31
2.4 IMPACTS OF GROUNDWATER WITHDRAWALS ON THE RAINBOW RIVER SYSTEM ......................... 33 2.4.1 Predicting Groundwater Withdrawal Impacts Using the Northern District Model 33 2.4.2 Water Budget and Groundwater Withdrawals in the Vicinity of Rainbow Springs 37 2.4.3 Rainbow Springshed Water Budgets for 1995 and 2010 39 2.4.4 Rainbow Springshed Boundary Changes Through Time 41
CHAPTER 3 – WATER QUALITY OF THE RAINBOW RIVER SYSTEM .................................... 44 3.1 RAINBOW RIVER WATER QUALITY STATUS, TOTAL MAXIMUM DAILY LOAD, AND BASIN MANAGEMENT ACTION PLAN ........................................................................................................ 44 3.2 RAINBOW RIVER SYSTEM WATER QUALITY ............................................................................. 46 3.3 RAINBOW RIVER SYSTEM NITRATE CONCENTRATIONS VS. FLOW ............................................. 55 3.4 RAINBOW RIVER SYSTEM CHLOROPHYLL CONCENTRATIONS VS. FLOW .................................... 58
CHAPTER 4 – ECOLOGICAL RESOURCES OF THE RAINBOW RIVER SYSTEM .................. 60 4.1 FLOODPLAIN WETLANDS VEGETATION .................................................................................... 60 4.2 AQUATIC VEGETATION ........................................................................................................... 63 4.3 BENTHIC MACROINVERTEBRATES ........................................................................................... 65 4.4 FISH ...................................................................................................................................... 65 4.5 TURTLES ............................................................................................................................... 67 4.6 BIRDS AND MAMMALS ............................................................................................................ 69
CHAPTER 5 – ENVIROMENTAL VALUES THAT MUST BE CONSIDERED WHEN DEVELOPING THE MINIMUM FLOW FOR THE RAINBOW RIVER SYSTEM ................... 70
5.1 RECREATION IN AND ON THE WATER ....................................................................................... 70 5.2 FISH AND WILDLIFE HABITATS AND THE PASSAGE OF FISH ....................................................... 71 5.3 ESTUARINE RESOURCES ........................................................................................................ 71 5.4 TRANSFER OF DETRITAL MATERIAL ......................................................................................... 71 5.5 MAINTENANCE OF FRESHWATER STORAGE AND SUPPLY .......................................................... 72 5.6 AESTHETIC AND SCENIC ATTRIBUTES ..................................................................................... 72 5.7 FILTRATION AND ABSORPTION OF NUTRIENTS AND OTHER POLLUTANTS ................................... 72 5.8 SEDIMENT LOADS .................................................................................................................. 73 5.9 WATER QUALITY .................................................................................................................... 73 5.10 NAVIGATION ........................................................................................................................ 74
CHAPTER 6 – RAINBOW RIVER SYSTEM MINIMUM FLOW DEVELOPMENT METHODOLOGIES ............................................................................................................... 75
6.1 RAINBOW RIVER SYSTEM LONG-TERM FLOW RECORD ............................................................ 75 6.2 RAINBOW RIVER SYSTEM HEC-RAS MODELING ..................................................................... 76
4

6.2.1 Withlacoochee River Backwater Effect 79 6.2.2 HEC-RAS Model Scenarios 81 6.2.3 HEC-RAS Modeling Sources of Uncertainty 83
6.3 MINIMUM LOW-FLOW THRESHOLD EVALUATION ...................................................................... 83 6.3.1 Evaluation of Fish Passage 84 6.3.2 Evaluation of Wetted Perimeter/Instream Habitat Quantity 84
6.4 EVALUATION OF INSTREAM HABITAT FOR FISH AND MACROINVERTEBRATES USING THE PHYSICAL HABITAT SIMULATION MODEL ....................................................................................................... 85
6.4.1 PHABSIM Sites 86 6.4.2 Development of PHABSIM Model Habitat Suitability Curves 88 6.4.3 PHABSIM Modeling Methodology 90 6.4.4 Sources of Uncertainty in PHABSIM Model Results 92
6.5 EVALUATION OF INSTREAM WOODY HABITAT INUNDATION ........................................................ 92 6.5.1 Instream Woody Habitat Sites 93 6.6 Rainbow River Floodplain Wetlands Inundation Analyses 94
CHAPTER 7 – RAINBOW RIVER SYSTEM MINIMUM FLOW DEVELOPMENT RESULTS ...... 98 7.1 MINIMUM LOW-FLOW THRESHOLD EVALUATION RESULTS ........................................................ 98
7.1.1 Fish Passage Evaluation 98 7.1.2 Instream Habitat Quantity Evaluation 98 7.1.3 Summary of Minimum Low-Flow Threshold Evaluation 99
7.2 PHABSIM MODEL RESULTS ................................................................................................ 100 7.3 RESULTS OF WOODY HABITAT INUNDATION ANALYSES .......................................................... 102 7.4 RESULTS OF FLOODPLAIN WETLANDS HABITAT INUNDATION ANALYSES .................................. 103
CHAPTER 8 – RECOMMENDED MINIMUM FLOW FOR THE RAINBOW RIVER SYSTEM .... 107 8.1 RECOMMENDED MINIMUM FLOW AND STATUS ASSESSMENT .................................................. 107 8.2 MINIMUM FLOW REEVALUATION AND FUTURE DATA NEEDS ................................................... 108 8.3 RECOMMENDED RULE LANGUAGE ........................................................................................ 109
CHAPTER 9 – LITERATURE CITED........................................................................................... 111 APPENDICES .............................................................................................................................. 121
5
Acknowledgements The authors would like to thank the following former Southwest Florida Water Management District staff who were involved in data collection and analysis efforts and completing earlier drafts of this report: Stacey Day, Mike Heyl, Richard Gant, Tammy Hinkle, Adam Munson, Marty Kelly, Jonathan Morales, Jason Hood, Don Hampton, Michelle Dachsteiner, Tammy Schmaltz, and William Grant. Jeff Sowards, Florida Department of Environmental Protection, Manager of Rainbow Springs Aquatic Preserve, assisted with data collection and provided access to the head springs. We also thank Dr. James Gore of the University of Tampa, who performed PHABSIM modeling, for his numerous consultations on the application of the PHABSIM model analyses. Ravi Nalamothu and Ken Watson of HSW Engineering, Inc. performed HEC-GeoRAS modeling and provided useful input to the floodplain habitat inundation analyses. In addition, we thank Dann Yobbi, Matt Cohen, and Lee Wilson, who provided independent, scientific peer review of an earlier draft of this report.
6

Executive Summary The Southwest Florida Water Management District (District) is required by Florida Statutes to adopt the minimum flow for the Rainbow River System by July 1, 2017. The recommended minimum flow for the Rainbow River System described in this report was developed using the best information available, as required by statute; is protective of all relevant environmental values identified for consideration in the Water Resources Implementation Rule when establishing minimum flows and levels (MFLs); and was voluntarily reviewed by an independent scientific peer review panel. This report is a revision of an earlier peer review draft report based on the comments of the peer review panel. The Rainbow River System, located in Southwest Marion County, is a first-magnitude springs system and the fourth largest spring-fed river in Florida. The headwaters of the Rainbow River, the Rainbow Springs Group, are located within Rainbow River State Park and are designated by Florida Statute as an Outstanding Florida Springs. The Rainbow River System is also designated as an Outstanding Florida Water (OFW), an Aquatic Preserve, and a Surface Water Improvement and Management (SWIM) priority water body at the state level. At the federal level, Rainbow Springs is a designated National Natural Landmark. The Rainbow River flows 5.7 miles south from the headsprings before joining the Withlacoochee River, which flows into the Gulf of Mexico. Flow in the Rainbow River System is dominated by springflow, which is generated from a springshed that averages 741 square miles in size. From 1931 through May 2015, the mean annual springflow from the Rainbow Springs Group was 690 cubic feet per second (cfs) or 446 million gallons per day (mgd). The flow record from the United States Geological Survey (USGS) Rainbow River at Dunnellon, FL Gage (No. 02313100) from 1965 through 2015 was used to develop the recommended minimum flow. The long-term average gaged flow during this time period was 677 cfs. The gaged flow record was adjusted for groundwater withdrawal impacts from 1965 through 2015 by accounting for flow reductions of 1.1 percent in 1995 that increased to 1.7 percent in 2010 based on the simulation of 1995 and 2010 pumping conditions using Version 4.0 of the Northern District Model (NDM). The NDM, Version 5.0 was not available during the time of minimum flow development. It was assumed that flow impacts were zero in 1965 and then linearly-interpolated for flow impact through 1995 (1.1 percent). From 1995 to 2010, flow impacts were linearly-interpolated from 1.1 to 1.7 percent. From 2011 through 2015, a flow impact of 1.7 percent was used to adjust the gaged flows. This resulted in a long-term average flow of 683 cfs adjusted for groundwater withdrawals from 1965 through 2015 at the USGS Rainbow River at Dunnellon, FL Gage (No. 02313100). Multiple habitat-based approaches were used to develop the recommended minimum flow for the Rainbow River System. The United States Army Corps of Engineers’ (USACOE’s) Hydrologic Engineering Center’s River Analysis System (HEC-RAS) model was used to account for backwater effects from the Withlacoochee River and to characterize water levels and flows throughout the Rainbow River System. The model was used for assessing flows associated with fish passage and the wetted perimeter of the river bottom or quantity of instream habitat to determine the need for a minimum low flow threshold and characterize inundation of instream woody (exposed root and snag) habitats. Output from
7

the HEC-RAS model for three backwater simulations, representing low (25 percent), medium (50 percent), and high (75 percent) backwater conditions, was used for Physical Habitat Simulation (PHABSIM) modeling to characterize potential changes in the availability of instream habitat due to reductions in flow for 18 functional and taxonomic groups of fish and benthic macroinvertebrates. The HEC-RAS model output was also coupled with HEC-GeoRAS modeling and topographic data to evaluate flow-related inundation of floodplain wetlands habitat on a spatial and temporal basis. The establishment of a low-flow threshold for the Rainbow River System that would be applicable to surface water withdrawals was determined to be unnecessary. The minimum water surface elevation that would allow for fish passage was lower than the elevation associated with the lowest modeled flow, and the lowest wetted perimeter inflection point (LWPIP) was below the elevation associated with the lowest modeled flow for all but one site. Of the various habitat-based methods used to develop the minimum flow for the Rainbow River System, the availability of inundated floodplain wetlands habitat was the most sensitive or restrictive to reductions in flow. A maximum five percent flow reduction was associated with a significant harm threshold based on a 15 percent decrease in availability of inundated floodplain wetlands habitat. Using this most sensitive criterion, the recommended minimum flow for the Rainbow River System is a long-term average flow of 649 cfs, which is a five percent reduction from the long-term average flow of 683 cfs adjusted for groundwater withdrawals for the period of record from 1965 through 2015 at the USGS Rainbow River at Dunnellon, FL Gage. The District recommends reevaluation of this minimum flow within ten years of its adoption into rule. Because updated groundwater modeling (NDM, Version 5.0) indicates that the predicted springflow decline for the Rainbow Springs Group under 2014 pumping conditions is approximately one percent, the proposed minimum flow is being met, and a recovery strategy is currently not required. Similarly, given a flow impact of 2.5 percent associated with withdrawals based on projected demand for 2035, implementation of a specific prevention strategy is also not warranted at this time. The District will continue to implement its general, three-pronged prevention strategy that includes monitoring, protective water-use permitting, and regional water supply planning to ensure that the adopted minimum flow for the system continues to be met. In addition, the District will continue to collect information to further our understanding of the effects of flow on the structure and functions of the Rainbow River System and to develop and refine our minimum flow development methods in the future.
8

CHAPTER 1 – INTRODUCTION TO MINIMUM FLOWS AND LEVELS AND THE RAINBOW RIVER SYSTEM This report presents the recommended minimum flow that was developed for the Rainbow River System. For this effort and implementation of the recommended minimum flow, the Rainbow River System is defined as the entire course of the Rainbow River, from its headwaters formed by the Rainbow Springs Group to its confluence with the Withlacoochee River, as well as all springs and tributaries associated with the river. The best available information, including data that were collected specifically for the purpose of the minimum flow development, was used to develop the recommended minimum flow. Although State law does not require additional studies or data collection when establishing minimum flows, the District voluntarily supported an extensive and diverse data collection effort involving physical, chemical, and biological aspects of the Rainbow River System.
1.1 Legal Directives for Minimum Flows and Levels Establishment
Section 373.042(1), Florida Statutes (F.S.), directs water management districts and the Florida Department of Environmental Protection (DEP) to establish MFLs for specific water bodies. As defined by Section 373.042(1), F.S.:
“the minimum flow for a given watercourse is the limit at which further withdrawals would be significantly harmful to the water resources or ecology of the area. . . The minimum flow and minimum water level shall be calculated by the department and the governing board using the best information available.”
As stated above, the same statute also requires use of “the best information available.” While there is no statutory requirement for the District to acquire new information prior to development of a minimum flow or level, the District has traditionally undertaken broad-reaching studies prior to establishing an MFL. The District’s rules [Chapter 40D-8.011(5), Florida Administrative Code (F.A.C)] expand on this requirement and state:
“(5) the Minimum Flows and Levels established in this Chapter 40D-8, F.A.C., are based on the best available information at the time the Flow or Level was established. The best available information in any particular case will vary in type, scope, duration, quantity, and quality and may be less than optimally desired. In addition, in many instances the establishment of a Minimum Flow or Level requires development of methodologies that previously did not exist and so are applied for the first time in establishing the Minimum Flow or Level. The District has many ongoing environmental monitoring and data collection and analyses programs, and will develop additional programs over time.”
The development of MFLs provides vital support for resource protection and recovery efforts, as well as regulatory compliance, by establishing standards below which significant harm will occur in specific water bodies. Section 373.0421, F.S., requires
9
development of a recovery or prevention strategy for water bodies if the existing flow or level in a water body is below, or is projected to fall below within 20 years, the applicable minimum flow or level. Specifically, Section 373.0421(2), F.S., requires that recovery or prevention strategies be developed to: (a) achieve recovery to the established minimum flow or level as soon as practicable; or (b) prevent the existing flow or level from falling below the established minimum flow or level. Periodic reevaluation and, as necessary, revision of established MFLs are also required by Section 373.0421(3), F.S., but no time interval is specified in the statute. Section 373.0421, F.S., requires the District to consider changes and structural alterations to watersheds (e.g., Inglis Dam), surface waters, and aquifers and the effects such changes or alterations have had, and the constraints such changes or alterations have placed, on the hydrology of the affected watershed, surface water, or aquifer. In addition, according to the State Water Resource Implementation Rule (Chapter 62-40.473, F.A.C.), when developing MFLs, consideration shall be given to the protection of water resources, natural seasonal fluctuations in water flows or levels, and environmental values associated with coastal, estuarine, aquatic, and wetlands ecology, including:
1) Recreation in and on the water; 2) Fish and wildlife habitats and the passage of fish; 3) Estuarine resources; 4) Transfer of detrital material; 5) Maintenance of freshwater storage and supply; 6) Aesthetic and scenic attributes; 7) Filtration and absorption of nutrients and other pollutants; 8) Sediment loads; 9) Water quality; and 10) Navigation.
The Water Resource Implementation Rule also states that MFLs should be expressed as multiple flows or levels defining a minimum hydrologic regime, to the extent practical and necessary, to establish the limit beyond which further withdrawals would be significantly harmful to the water resources or the ecology of the area.
1.2 Development of Minimum Flows and Levels in the Southwest Florida Water Management District
The District has developed specific methodologies for establishing MFLs for lakes, wetlands, rivers, and aquifers; subjected the methodologies to independent, scientific peer-review; and in some cases, incorporated the methods into its Water Level and Rates of Flow Rule (Chapter 40D-8, F.A.C.). Components of recovery strategies needed to restore MFLs that are not currently being met have been incorporated into the District’s Recovery and Prevention Strategies for Minimum Flows and Levels Rule (Chapter 40D-80, F.A.C.). A detailed summary of efforts completed for the District’s MFLs Program is provided by Hancock et al. (2010).
1.2.1 Overview of Minimum Flows Development for Flowing Systems Seerley et al. (2006) identified the following seven guiding principles for instream flow protection:
10

1) Preserving whole functioning ecosystems rather than focusing on a single species;
2) Mimicking, to the greatest extent possible, the natural flow regime, including seasonal and inter-annual variability;
3) Expanding the spatial scope of instream flow studies beyond the river channel to include the riparian corridor and floodplain systems;
4) Conducting studies using an interdisciplinary approach; 5) Using reconnaissance information to guide choices from among a
variety of tools and approaches for technical evaluations in particular river systems;
6) Practicing adaptive management, an approach for recommending adjustments to operational plans in the event that objectives are not achieved; and
7) Involving stakeholders in the process. Using peer reviewed and accepted methodologies that address these principles, the District has established and codified into rule minimum flows for numerous river segments and springs. These flowing systems include the Upper and Lower Alafia River, Upper and Lower Anclote River, Upper Braden River, Buckhorn Springs, Chassahowitzka River System and Springs, Crystal Springs, Dona Bay/Shakett Creek System, Gum Slough Spring Run, Upper and Lower Hillsborough River, Homosassa River System and Springs, Lithia Springs, Upper and Lower Myakka River, three segments of the Upper Peace River, Middle and Lower Peace River, Sulphur Springs, Tampa Bypass Canal, and Weeki Wachee River System and Springs. Information pertaining to the adoption of these minimum flows and other related issues is available from the District’s MFLs (Environmental Flows) Program web page at: www.WaterMatters.org/MFLReports. Minimum flows established by the District and other water management districts in the state (e.g., SFWMD 2002, WRA 2005, Mace 2006, Neubauer et al. 2008) have emphasized the maintenance of natural flow regimes, which include seasonal and inter-annual flow variations that reflect or integrate climatic and watershed characteristics. Consideration of hydrologic regimes when developing or managing for minimum flows is predicated on the concept that many important ecologic and hydrologic functions of streams and rivers are primarily dependent on or supported by the range and pattern of flow conditions (Hill et al. 1991, Richter et al. 1996, Poff et al. 1997, Postel and Richter 2003, Annear et al. 2004, Olsen and Richter 2006). Based on the importance of the flow regime to river system integrity, the District has employed a percent-of-flow method for determining minimum flows for rivers and associated spring systems (Flannery et al. 2002). The percent-of-flow method identifies flow reductions as percentages of flows that may be withdrawn directly from the system without causing significant harm. The percent-of-flow reductions similarly apply to flow reductions that may be caused by indirect flow impacts associated with groundwater withdrawals. In some cases, specific allowable percentage flow reductions may be developed for seasonal flow periods or flow ranges to reflect changes in system sensitivity to flows. By proportionally scaling water withdrawals to the rate of flow, the percent-of-flow method minimizes adverse impacts that could result from the withdrawal of large volumes of water during low-flow periods, when river systems may be especially vulnerable to flow reductions. Similarly, larger volumes may be available for withdrawal during periods of higher flows. A goal of the use of the percent-of-flow method for establishing minimum flows is that the natural flow regime of the river be maintained, albeit with some flow
11

reduction for water supply. The utility of the percent-of-flow approach has been recognized in the development of presumptive, risk-based environmental flow standards that are recommended for river systems where data-intensive approaches to flow protection have not or are not likely to be implemented (Richter et al. 2011). The percent-of-flow approach for rivers is typically superimposed on seasons referred to as “blocks.” However, flow in springflow-dominated systems, such as the Rainbow River System, does not exhibit strong seasonal patterns; therefore, a single minimum or allowable percentage reduction of flow is appropriate. The minimum flow for the Rainbow River System was developed utilizing the percent-of-flow approach and is expressed in cubic feet per second as a long-term average flow adjusted for groundwater withdrawals from 1965 to 2015 at the USGS Rainbow River at Dunnellon, FL Gage. The initial step in developing a minimum flow for a water body requires an examination of the flow record to determine if there is evidence of impacts (both additions and subtractions). Once this question is addressed, the development of a minimum flow involves identifying what can be allowed in terms of withdrawal effects on the unimpacted flow record before significant harm occurs. If there have been changes to the flow regime of a river because of withdrawals, these must be assessed to determine if significant harm has already occurred. If significant harm has already occurred, recovery is required. 1.2.2 Defining Significant Harm While Section 373.042, F.S., requires the establishment of MFLs as limits at which further withdrawals would be significantly harmful to water resources or ecology of an area, “significant harm” is not explicitly defined. In establishing minimum flows, the District has identified flows associated with fish passage and maximization of stream bottom habitat with the least amount of flow and determined that loss of these threshold flows would be significantly harmful to river systems. The District has also used quantifiable reductions in potential habitat or resources to identify significant harm and develop minimum flow recommendations. This latter approach is complicated by the fact that many structural and functional components of flowing ecosystems vary continuously with flow and do not exhibit clear thresholds or break-points. Given the lack of clear environmental change thresholds in flowing ecosystems, the District uses a 15 percent change criterion as constituting significant harm when evaluating flow-based changes in potential habitats or resources. The recommended minimum flow is based on the habitat or resource most sensitive to a flow reduction resulting in a 15 percent decrease in the habitat or resource. The basis for this management decision lies, in part, with a recommendation put forth by the peer review panel that considered the District’s proposed minimum flows for the Upper Peace River. In their report, the panelists noted that “[i]n general, instream flow analysts consider a loss of more than 15 percent habitat, as compared to undisturbed or current conditions, to be a significant impact on that population or assemblage” (Gore et al. 2002). The peer review panel’s assertion was based on consideration of environmental flow studies employing the PHABSIM model for analyzing flow, water depth, and substrate/cover preferences that define aquatic species habitats. Use of a 15 percent change in habitat or resource as constituting significant harm and, therefore, for developing minimum flow recommendations, has been extended by the District to evaluate changes in freshwater fish and invertebrate habitat; days of and areas
12

of inundation of floodplains; snag habitat and woody debris in freshwater river segments; changes in abundances or population center-location tendencies of planktonic (free-floating) and nektonic (actively swimming) fish and invertebrates in estuarine river segments; spatial decreases in the availability of warm-water refuges for manatees during critically cold periods; and decreases in the volume, bottom area, and shoreline length associated with specific salinity zones in estuarine river segments. For the Rainbow River System, the 15 percent change criterion was used to assess flow-related changes in freshwater fish and invertebrate habitat, inundation patterns of floodplain wetland habitat, and days of inundation of woody habitats. Seventeen independent scientific peer review panels convened to assess minimum flows for flowing water bodies within the District have been supportive of the use of 15 percent change criteria as constituting significant harm. The Rainbow River System is a designated OFW, and minimum flows have been adopted for other OFWs using criteria associated with 15 percent changes in habitat or other resources. They include the Chassahowitzka, Homosassa, and Weeki Wachee River Systems. District staff continue to evaluate other environmental flow studies to improve our minimum flow development methods. For example, in reference to the use of PHABSIM model, Dunbar and others (1998) note that “…an alternative approach is to select the flow giving 80 percent habitat exceedance percentile,” which is equivalent to an allowable 20 percent decrease from baseline conditions. For another habitat-based environmental flow study, Jowett (1993) used a one-third loss of existing habitat associated with naturally occurring low flows as a guideline for determining flow recommendations. In Texas, the state established environmental flows for Matagorda Bay based on modeling that limited decreases of selected commercially important species to no more than 20 percent reductions from historical harvest levels (Powell et al. 2002). With regard to allowable changes in flow, the Nature Conservancy (Richter et al. 2011) identified acceptable presumptive criteria for environmental flow protection, noting that a high level of protection will be provided when flow reductions of up to ten percent are allowed and a moderate level of protection can be expected with allowable flow reductions of up to 20 percent.
1.3 Vertical Datum The District is in the process of converting from use of the National Geodetic Vertical Datum of 1929 (NGVD29) to use of the North American Vertical Datum of 1988 (NAVD88) for measuring and reporting vertical elevations. Both datums are used for elevation values included in this report. As necessary, these elevations may be converted to elevations relative to either respective datum in accordance with the District’s internal operating procedure for MFLs data collection, summarization, reporting, and rule development (Leeper 2016).
1.4 Description of the Rainbow River System The Rainbow River is located approximately 75 miles north of Tampa, 20 miles southwest of Ocala, and adjacent to the City of Dunnellon in Southwest Marion County (Figure 1-1). The Rainbow Springs Group forms the headwaters of the Rainbow River, which flows 5.7 miles south into the Withlacoochee River, upstream and to the east of Lake Rousseau. Downstream of the lake, the Withlacoochee River continues west and discharges into the Gulf of Mexico near Yankeetown. The Rainbow Springs Springshed, e.g., the
13

groundwater-contributing area to Rainbow Springs flow, averages 741 square miles in size and is largely located in eastern Levy, western Marion, and southern Alachua Counties (Figure 1-2). The Rainbow Springs Group is considered a first-magnitude springs and, together with the Rainbow River, is an Outstanding Florida Springs system that is the fourth largest spring-fed river system in Florida (SWFWMD 2015a, 2015b). The upper river has exceptional water clarity (over 200 horizontal feet) that declines to an average of 38 to 47 feet in the lower river (SWFWMD 2015a, 2015b, FSI 2016). Water temperature in the river averages around 74° F, water depths range from about four to 25 feet, and the channel width ranges from 60 to 220 feet (HSW 2009). Because the Rainbow River is dominated by groundwater rather than surface water contributions, annual variations in water levels are usually less than one foot, and the difference between the maximum and minimum recorded stage is only about three feet; maximum and minimum flows vary by about a factor of two (HSW 2009). In addition to being designated as an Outstanding Florida Springs and OFW, the Rainbow River System is designated as an Aquatic Preserve, and a SWIM priority water body (SWFWMD 2015a). Rainbow Springs are a designated National Natural Landmark.
Figure 1-1. Location of the Rainbow River.
Inglis Dam is located approximately 12 miles downstream of the Rainbow River confluence with the Withlacoochee River. The dam was constructed in 1909, forming Lake Rousseau, a 4,200-acre impoundment of the river (Downing et al. 1989). Until 1965, a hydroelectric power facility operated at the dam. In 1969, the Inglis Lock, located adjacent to the dam, was completed by the United States Army Corps of Engineers (USACOE) as part of the Cross Florida Barge Canal (CFBC) project. The CFBC intercepted the Withlacoochee River and diverted flow from the downstream portion of the river. The
14

CFBC and associated water control structures have a significant elevating effect on water levels in the Rainbow River due to backwater effects; however, since there is no documentation of water levels in the Rainbow River prior to the construction of Inglis Dam, the amount of change in water levels in the Rainbow River is unknown (Downing et al. 1989). From the 1930s through the 1970s, the lands surrounding the Rainbow Headsprings area were a privately-owned tourist attraction (SWFWMD 2015b). Due to declining tourism resulting from the development of Florida’s interstate highway system and the construction of more modern tourist attractions, the private attraction closed and fell into disrepair. The property was purchased by the Florida Park Service in 1990 and is now a popular state park. The Rainbow River is currently a major recreation area within the state; activities include kayaking, canoeing, boating, tubing, swimming, snorkeling, scuba diving, fishing, and sightseeing. Since the Rainbow River System is almost entirely groundwater supplied, land-use activities in the 741-square-mile springshed affect both the quality and quantity of groundwater entering the river (SWFWMD 2015b). Significant local- and springshed-scale changes in land use have occurred that have negatively affected springflow, water quality, fish and wildlife habitat, and the overall health of the Rainbow River System. About 38 percent of the Rainbow Springshed is currently dominated by agriculture (horses, cattle, row crops, and nursery operations) (Figure 1-2, SWFWMD 2015b). Upland forests make up about 29 percent of current land use, while about 14 percent of the springshed consists of residential areas.
15

Figure 1-2. Current land uses in the Rainbow Springs Springshed (Figure 8 from SWFWMD 2015b).
16
1.5 Independent Scientific Peer Review and Public Workshop for the Recommended Minimum Flow for the Rainbow River System
The District completed a draft minimum flow report for the Rainbow River System in August 2016 (Holzwart et al. 2016) that was then submitted to an independent scientific peer review panel for voluntary review. The peer review panel was composed of three scientists with extensive experience in hydrology, ecology, and freshwater inflow relationships of springs systems. The peer review panel’s charge was to review the validity of the technical approach used by the District to determine if the proposed minimum flow is supported by data, procedures, and analyses completed and to offer recommendations for enhancing or improving the proposed minimum flow. All peer review panel meetings were advertised in the Florida Administrative Register (F.A.R.) and on the District’s web site; in addition, numerous interested parties and local government staff and officials were notified of the meetings. Meetings of the peer review panel were held on September 20 and October 21, 2016, and District staff, local government staff, and stakeholders participated in both peer review panel meetings. A publicly-accessible WebForum, which was also noticed in the F.A.R., was set up by the District for peer review panel communication in accordance with Florida’s Government-in-the-Sunshine Law. The District received the peer review panel’s report on November 21, 2016 (Appendix A). Detailed comments from the peer review panel are included in their report; overall, they state that the draft report recommending the minimum flow for the Rainbow River System meets the requirements of the statute and that the analyses were thorough, scientifically reasonable, and based on best available data. The peer review panel also indicates in the report that their overall assessment of the District effort is supportive and that District staff are to be commended for their response to questions and data requests from the peer review panel. In addition, they state that the District staff did an excellent job of conducting open discussions with the peer review panel regarding the analyses summarized in the draft minimum flow report. In addition to the publicly-accessible independent scientific peer review of the recommended minimum flow for the Rainbow River System, the District facilitated stakeholder review by hosting a public workshop on February 23, 2017 in Dunnellon and meeting and corresponding with individual stakeholders or stakeholder groups. Appendix B contains a summary of the public workshop, which includes written comments, request to speak cards, and documents passed out by stakeholders during the workshop. Comments and questions from the public workshop and other stakeholder input were reviewed. This report is a revision of the Recommended Minimum Flow for the Rainbow River System, Draft Report that is based on consideration of comments of the peer review panel and interested stakeholders. Detailed District responses to the peer review panel’s comments are included in Appendix C. Appendix D contains stakeholder’s comments and District responses regarding the recommended minimum flow for the Rainbow River System that have been received as of March 2017.
17

CHAPTER 2 – HYDROLOGIC EVALUATION OF THE RAINBOW RIVER WATERSHED This chapter provides a description of the Rainbow River watershed, springshed, and surrounding area that includes information on the geology, hydrology, rainfall, water use, springflow, and groundwater withdrawal impacts to the Rainbow River. Prior to the development of a minimum flow, the District evaluates hydrologic changes in the vicinity of the system and determines the impact on flow from existing groundwater withdrawals.
2.1 Hydrologic Setting Much of the Rainbow River watershed is internally-drained. While the surface water runoff contributing area has been identified, very little runoff actually flows into the Rainbow River. It is primarily a baseflow-dominated or spring-fed system; therefore, it is more useful to focus on the groundwater contributing area to the Rainbow Springs Group, e.g., the springshed, rather than the watershed. Jones et al. (1996) and Knowles (1996) delineated the springshed, which was defined in the previous chapter (see Figure 1-2), for a period in the 1990s using the potentiometric surface of the Upper Floridan aquifer (UFA). Springsheds are generally based on the groundwater flow field of the UFA. They may change slightly from year to year based on the measured elevation of the water levels within the UFA. However, they are generally considered semi-permanent areas that contribute flow to a spring. The land area around the Rainbow Springs Group has high rolling sand hills with pine forests, agricultural fields, and developed areas. The hydrogeologic framework in this area includes a surficial aquifer, a discontinuous intermediate confining unit, and a thick carbonate UFA. At land surface and extending several tens of feet deep are generally fine-grained quartz sands that grade into clayey sand just above the contact with limestone. A thin, sometimes absent, sandy clay layer forms the intermediate confining unit (ICU) and overlies the limestone units of the UFA. In general, a regionally extensive surficial aquifer is not present because the clay confining unit is thin, discontinuous, and breeched by numerous karst features (Figure 2-1). Because of this geology, the UFA is unconfined over most of the western Marion County area. In this unconfined setting, high infiltration soils and generally deep water table conditions exist with UFA water levels varying from 10 to more than 50 feet below land surface (Figure 2-2). The geologic units, in descending order, that form the freshwater portion of the UFA include the Upper Eocene age Ocala Limestone and the Middle Eocene age Avon Park Formation (Table 2-1). In Southwest Marion County, the Ocala Limestone forms the top of the UFA, except in extreme southern Levy County, where the Avon Park Formation is exposed near land surface. The entire carbonate sequence of the UFA thickens and dips toward the south and southwest. The average thickness of the UFA ranges from 500 feet in Southwest Marion County to 1,000 feet in Central Pasco County (Miller 1986).
18

Figure 2-1. Generalized hydrogeology within the Rainbow Springshed.
Figure 2-2. Depth below land surface (feet) to the water level in the Upper Floridan aquifer based on the average of May-September 2002 USGS potentiometric surface maps.
19

Table 2-1. Hydrogeology of the Rainbow Springs area (modified from Miller 1986, Sacks and Tihansky 1996).
Series Stratigraphic Unit Hydrogeologic Unit Lithology
Holocene to Pliocene
Undifferentiated Surficial Deposits
Unsaturated Zone, Surficial Aquifer or locally perched Surficial Aquifer
Sand, silty sand, clayey sand,
sandy clay, peat, and shell
Eocene
Ocala Limestone
Upper Permeable
Zone
Upper Floridan Aquifer
Limestone, white to tan, friable to micritic, fine-grained, soft, abundant
foraminifera
Avon Park Formation
Middle Confining Unit 2 or Absent
Dolomite is brown, fractured, sucrosic, hard,
interstitial gypsum in Middle Confining Unit 2
Lower Permeable
Zone
Lower Floridan Aquifer
Limestone and dolomite,
limestone is tan and recrystallized, anhydrite and gypsum inclusions
Oldsmar
Formation
Paleocene Cedar Keys Formation Basal Confining Unit Massive anhydrites
The base of the UFA generally occurs at the first, persistent sequence of evaporitic minerals, such as gypsum or anhydrite, which occur as nodules or discontinuous thin layers in the carbonate matrix. This low permeability unit is regionally extensive and is generally referred to as the Middle Confining Unit (MCU) 2 (Miller 1986). In northern Levy and Northwest Marion Counties, the MCU 2 is absent, and no middle confining unit is present. Limestone and dolomite comprise most of the Floridan aquifer here. In this area, the sub-Floridan confining unit forms the bottom of the freshwater flow system and is found in the top part of the Cedar Keys Formation at an elevation of -1,700 feet NGVD29 (FGS 2009). The Rainbow Springshed is located within the 4,600-square-mile Northern West-Central Florida Groundwater Basin (SWFWMD 1987), which is one of seven regional groundwater basins located on the Florida peninsula (Figure 2-3). Similar to topographic divides that separate surface water drainage basins, groundwater basins are delineated by divides formed by high and low elevations in groundwater levels. Groundwater does not flow laterally between basins. Each basin also generally contains similar geology regarding the confinement of the UFA. In well-confined basins, water level declines due to pumping are greatest and most widespread. In leaky or unconfined basins, regional pumping impacts are confined to within each basin or along their boundaries. These effects are more localized and close to major pumping centers due to leakage from the overlying surficial
20

Figure 2-3. Location of regional groundwater basins in the Upper Floridan aquifer.
aquifer or high storage within the UFA. This limits regional pumping impacts and is demonstrated in the UFA water level change from 1970 to 2010 from the USGS (Figure 2-4). The greatest lowering of water levels in the UFA occurs in well-confined areas of Southeast Georgia, Northeast Florida, and Southwest Florida, where there is large groundwater extraction (Williams et al. 2011). In the unconfined regions, water level changes are small, and changes in UFA water levels largely occur due to rainfall variation. Pumping impacts are more localized and groundwater extraction is low in the unconfined regions. In western Marion County, the UFA is regionally unconfined and is located within a highly karst-dominated region. Dissolution of limestone is an active process via infiltration of rainwater because the limestone units of the UFA are close to land surface and poorly confined. Numerous sinkholes, internal drainage, and undulating topography that is typical of karst geology dominates the landscape. These active karst processes lead to enhanced permeability within the Floridan aquifer. The mean transmissivity value of the UFA based on seven aquifer performance tests in northern Citrus, Levy, and western Marion Counties is 1,070,000 feet2/day (SWFWMD 1999). There are five additional first-magnitude springs (flow greater than 100 cfs discharge) found within the Northern West-Central Florida Groundwater Basin: the Crystal River group, Homosassa group, Chassahowitzka group, Weeki Wachee Springs, and Silver Springs. In addition, the highest recharge rates to the
21

UFA in the state occur in West-Central Marion County, with values ranging between 10 and 25 inches per year (Sepulveda 2002).
Figure 2-4. Water level change in the Upper Floridan aquifer from 1970 through 2010 and the degree of confinement for the Upper Floridan aquifer (from Williams et al. 2011).
2.2 Climate and Rainfall The Rainbow Springshed lies within a humid, subtropical zone that is influenced by its proximity to the Gulf of Mexico. Subtropical zones are characterized by hot, humid summers and mild to cool winters. The temperature of the Gulf waters moderates the air temperatures in the area. The average mean daily temperature is approximately 70o F. Mean summer temperatures are in the low 80s, and the mean winter temperatures are in the upper 50s. Average rainfall is approximately 54 inches per year but varies widely from season to season and year to year. About 60 percent of annual rainfall occurs in the summer rainy season months of June through September, when convective thunderstorms are common due to daytime heating and afternoon sea breezes. In addition, summer and fall rainfall can be enhanced by tropical cyclone activity from June through November. An analysis of median decadal rainfall and 20-year moving average rainfall accumulated from the Ocala, Inverness, and Brooksville National Weather Service (NWS) stations from 1901 through
22

2015 shows an increasing trend up until the mid-1960s and then a declining trend thereafter (Figures 2-5 and 2-6). This is consistent with multi-decadal cycles associated with the Atlantic Multidecadal Oscillation (Enfield et al. 2001, Kelly and Gore 2008). The 20-year average was below the bottom 10th percentile (P90) for most of the averages post-2000 (Figure 2-6). Recent 20-year periods (1994-2013, 1995-2014, and 1996-2015) have, however, exhibited increased rainfall, with averages lying between the P90 and P50 percentiles. The departure in annual rainfall from the mean shows that 19 out of 27 years since 1989 have below average rainfall (Figure 2-7). Therefore, the recent quarter century has been extremely dry; in fact, it is the driest in 115 years of recorded rainfall history. Since 2012, however, rainfall has been near average to above average. In addition to the rainfall recorded at Brooksville, Inverness, and Ocala NWS stations, radar-estimated rainfall became available to the District in 1995 at a 2-kilometer (km) grid scale. Radar-estimated rainfall was averaged for the entire springshed each year from 1995 through 2015 using the 735 square-mile May 2005 boundary of the springshed (Figure 2-8). Similar to the NWS station data, 14 out of 21 years of radar estimated rainfall were below average. The cumulative departure for the 21-year period was -38.1 inches.
Figure 2-5. Atlantic Multidecadal Oscillation (AMO) periods and median decadal rainfall from the Brooksville, Inverness, and Ocala National Weather Service stations from 1901 through 2010.
23

Figure 2-6. Twenty-year moving average rainfall from the Brooksville, Inverness, and Ocala National Weather Service stations from 1901 through 2015.
Figure 2-7. Departure in annual rainfall from the Brooksville, Inverness, and Ocala National Weather Service stations from 1930 through 2015.
24

Figure 2-8. Annual departure in radar-estimated rainfall in the Rainbow Springshed from 1995 through 2015.
2.3 Rainbow Springs Group Discharge and Upper Floridan Aquifer Water Levels The Rainbow Springs Group discharge has been recorded multiple times per year by the USGS beginning in 1931 (Figure 2-9) from the Rainbow River at Dunnellon, FL Gage (No. 02313100) at the County Road 484 Bridge. Continuous daily flow observations began in 1965. In addition to the named spring vents, such as Rainbow No.1, Rainbow No. 4, Rainbow No. 6, and Bubbling Spring, discharge occurs from numerous limestone crevices and sand boils in the bed of the river and along the banks of the upper two miles of the Rainbow River (FGS 2004). As part of a 2005 aquatic vegetation survey of the Rainbow River, 87 spring vents were identified, primarily in the upper two miles (PBS&J and Debra Childs Woithe, Inc. 2007). The main spring vent, called Rainbow No. 1, is found at the head of the Rainbow River. Its spring pool measures 330 feet from north to south and 360 feet from east to west (FGS 2004). The mean annual flow from the Rainbow Springs Group is 690 cfs or 446 mgd, based on the period from 1931 through May 2015 (Figure 2-9). Because rainfall has been near average to above average every year since 2012, the annual average flow at Rainbow Springs has subsequently increased since reaching its period-of-record low of 502 cfs in 2011. In 2014, the average yearly flow rebounded to 687 cfs, which is close to the long-term mean value for the springs.
25
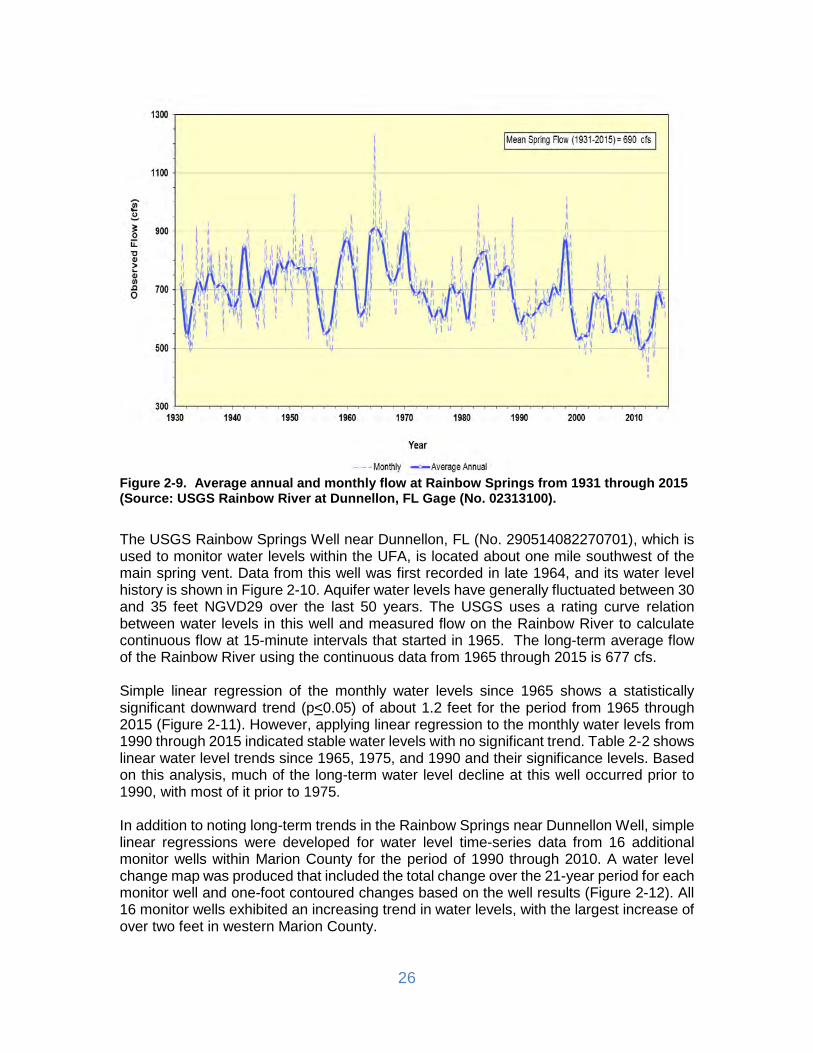
Figure 2-9. Average annual and monthly flow at Rainbow Springs from 1931 through 2015 (Source: USGS Rainbow River at Dunnellon, FL Gage (No. 02313100).
The USGS Rainbow Springs Well near Dunnellon, FL (No. 290514082270701), which is used to monitor water levels within the UFA, is located about one mile southwest of the main spring vent. Data from this well was first recorded in late 1964, and its water level history is shown in Figure 2-10. Aquifer water levels have generally fluctuated between 30 and 35 feet NGVD29 over the last 50 years. The USGS uses a rating curve relation between water levels in this well and measured flow on the Rainbow River to calculate continuous flow at 15-minute intervals that started in 1965. The long-term average flow of the Rainbow River using the continuous data from 1965 through 2015 is 677 cfs. Simple linear regression of the monthly water levels since 1965 shows a statistically significant downward trend (p<0.05) of about 1.2 feet for the period from 1965 through 2015 (Figure 2-11). However, applying linear regression to the monthly water levels from 1990 through 2015 indicated stable water levels with no significant trend. Table 2-2 shows linear water level trends since 1965, 1975, and 1990 and their significance levels. Based on this analysis, much of the long-term water level decline at this well occurred prior to 1990, with most of it prior to 1975. In addition to noting long-term trends in the Rainbow Springs near Dunnellon Well, simple linear regressions were developed for water level time-series data from 16 additional monitor wells within Marion County for the period of 1990 through 2010. A water level change map was produced that included the total change over the 21-year period for each monitor well and one-foot contoured changes based on the well results (Figure 2-12). All 16 monitor wells exhibited an increasing trend in water levels, with the largest increase of over two feet in western Marion County.
26

Figure 2-10. Average monthly water level history of the Rainbow Springs Well near Dunnellon, FL.
Table 2-2. Linear trend and statistical significance level of Rainbow Springs Well near Dunnellon, FL water levels from 1965-2015, 1975-2015, and 1990-2015.
Period of Record
Regression Equation
Slope (feet)
Total Water Level Change
(feet)
Statistically Significant (p <0.05)
1965-2015 y = -0.024x + 79.11 -0.024 -1.20 Yes
1975-2015 y = -0.011x + 53.11 -0.011 -0.44 Yes
1990-2015 y = 0.001x + 28.97 +0.001 +0.02 No
Note: Statistical significance based on an alpha (p value) less than or equal to 0.05.
27

Figure 2-11. Simple linear regression and statistical significance value of the Rainbow Springs Well near Dunnellon, FL monthly water level trend from 1965-2015 and 1990-2015 (Note: Hydrograph from 1990-2015 assigned to secondary y-axis for viewing purposes).
Figure 2-12. Water level change in the Upper Floridan aquifer from 1990-2010 based on regression trends from 16 monitor wells.
28

2.3.1 Rainfall, Upper Floridan Water Levels, and Rainbow Springflow A cumulative sum analysis of annual rainfall averaged from the Brooksville, Inverness, and Ocala NWS stations and average annual water levels at the Rainbow Springs Well near Dunnellon, FL from 1965 through 2015 indicates no significant change in slope for the period (Figure 2-13). In the cumulative sum analysis, any major deviation in slope that occurs for more than five years would indicate an influence other than rainfall affecting water levels in the well. This suggests that water levels in the UFA are fluctuating largely due to the natural variability of rainfall in the area. In a cumulative sum plot of Rainbow Springs flow and average annual water levels at the Rainbow Springs Well near Dunnellon, FL from 1965 through 2015, however, a major break in slope in the year 2000 is indicated (Figure 2-14). This infers that there is a change in the UFA head and flow relation post-2000. Another cumulative sum plot of rainfall and springflow shows the same break in slope occurring in the year 2000 (Figure 2-15). This implies that some factor beyond rainfall and pumping from the Floridan aquifer is affecting flow rates in the Rainbow River post-2000.
Figure 2-13. Cumulative sum of annual water levels at the Rainbow Springs Well near Dunnellon, FL and average annual rainfall from the Brooksville, Inverness, and Ocala NWS stations from 1965-2015.
29

Figure 2-14. Cumulative sum of annual water levels at the Rainbow Springs Well near Dunnellon, FL and average annual flow at Rainbow Springs from 1965-2015.
Figure 2-15. Cumulative sum of average annual flow at Rainbow Springs and average annual rainfall from the Brooksville, Inverness, and Ocala NWS stations from 1965-2015.
30

2.3.2 Rainbow River Flow and Rainbow Springs Well Near Dunnellon, FL Water Levels Since 2000 The USGS utilizes a rating curve that estimates flow for the Rainbow River at Dunnellon, FL Gage given the elevation of the UFA water level in the Rainbow Springs Well near Dunnellon, FL. A rating curve is based on the mathematical relationship between measured flow and water level in the well and is used to predict flow on a 15-minute basis. The USGS periodically adjusts the rating curve if measured flow significantly deviates from the values predicted using the well water levels. Examination of the USGS flow record on the Rainbow River indicates an extremely low-flow period since 2000 that appears anomalous given our understanding of climatic conditions or groundwater withdrawal impacts. Over the period from 2000 through 2015, average annual flow for only four years (2003, 2004, 2005, and 2014) has approached the long-term median value. Flow did not approach the upper quartile (highest 25 percent) during the period, even in response to the extremely wet conditions in 2004. Flow has been well below the long-term mean for the Rainbow River for all other years. While it has been drier than normal for the 15-year period, low rainfall conditions alone do not explain these very low-flows given the historical flow record. A review of monthly average flow versus water levels shows a divergence in post-2000 flow compared with the well water level (Figure 2-16). This becomes especially evident during the extremely wet period in September 2004 associated with multiple hurricane events, when UFA water levels were as high as the 1997-1998 El Niño event; yet, flows were 200 cfs lower. In general, measured flows track 50 to 100 cfs lower after 2000, given the same water level elevation in the Rainbow Springs near Dunnellon Well prior to 2000.
Figure 2-16. Average monthly Rainbow River flow versus Rainbow well water level from 1990 through 2015 that shows divergence in relationship beginning in 2000 and thereafter.
31

Beginning in 1970, mean annual water levels at the Rainbow Springs Well near Dunnellon, FL were plotted against Rainbow River average annual flow (Figure 2-17). The data were grouped by decade and a linear regression was applied to characterize the flow and UFA water level relationship. There is a clear change in the relation between water level and flow after 2000. For example, at the water level elevation of 31 feet NGVD29 in the Rainbow well, flow on the Rainbow River was approximately 650 cfs prior to 2000. However, after 2000, the flow at the same elevation of the UFA in the Rainbow well was 600 cfs (Figure 2-17). This implies that the relationship between aquifer water elevation and Rainbow River discharge changed in 2000. These lower flows do coincide with low-flow conditions documented by the St. Johns River Water Management District (SJRWMD) on the nearby Silver River during the same time period. Reductions in Silver River flows have been attributed to submerged aquatic vegetation (SAV) and invasive hydrilla (Hydrilla verticillata) that increased pool stage at the spring, thereby, significantly lowering flow (Baird et al. 2014). The SJRWMD estimated this flow reduction to be from 100 to 150 cfs. The main cause of reduced flow at Rainbow post-2000 is currently poorly understood except for the fact that it is not related to groundwater withdrawal impacts. In addition, it is not known whether this flow condition at
Figure 2-17. Linear regression of decadal water levels and flow at the Rainbow River from 1970 through 2014 showing the change in the relationship since 2000.
Rainbow Springs is permanent or temporary. Unlike nearby Silver Springs, a continuous pool stage history does not exist that covers the period before and after the post-2000 flow
32
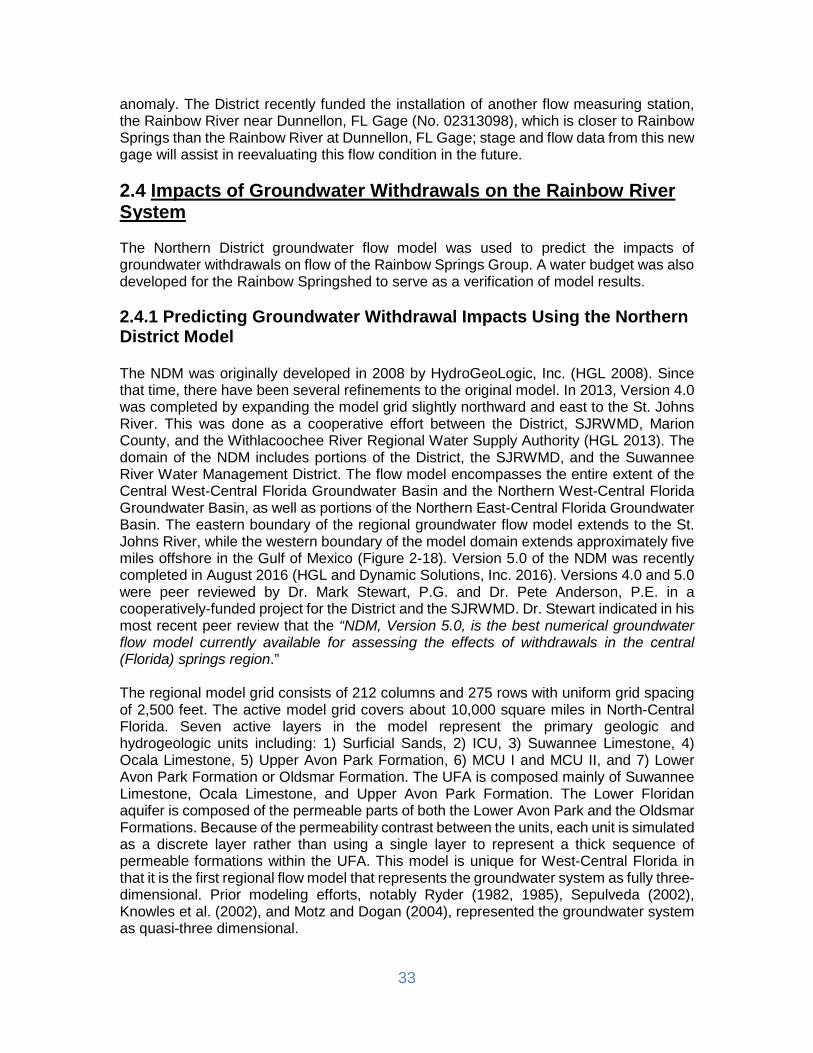
anomaly. The District recently funded the installation of another flow measuring station, the Rainbow River near Dunnellon, FL Gage (No. 02313098), which is closer to Rainbow Springs than the Rainbow River at Dunnellon, FL Gage; stage and flow data from this new gage will assist in reevaluating this flow condition in the future. 2.4 Impacts of Groundwater Withdrawals on the Rainbow River System The Northern District groundwater flow model was used to predict the impacts of groundwater withdrawals on flow of the Rainbow Springs Group. A water budget was also developed for the Rainbow Springshed to serve as a verification of model results. 2.4.1 Predicting Groundwater Withdrawal Impacts Using the Northern District Model The NDM was originally developed in 2008 by HydroGeoLogic, Inc. (HGL 2008). Since that time, there have been several refinements to the original model. In 2013, Version 4.0 was completed by expanding the model grid slightly northward and east to the St. Johns River. This was done as a cooperative effort between the District, SJRWMD, Marion County, and the Withlacoochee River Regional Water Supply Authority (HGL 2013). The domain of the NDM includes portions of the District, the SJRWMD, and the Suwannee River Water Management District. The flow model encompasses the entire extent of the Central West-Central Florida Groundwater Basin and the Northern West-Central Florida Groundwater Basin, as well as portions of the Northern East-Central Florida Groundwater Basin. The eastern boundary of the regional groundwater flow model extends to the St. Johns River, while the western boundary of the model domain extends approximately five miles offshore in the Gulf of Mexico (Figure 2-18). Version 5.0 of the NDM was recently completed in August 2016 (HGL and Dynamic Solutions, Inc. 2016). Versions 4.0 and 5.0 were peer reviewed by Dr. Mark Stewart, P.G. and Dr. Pete Anderson, P.E. in a cooperatively-funded project for the District and the SJRWMD. Dr. Stewart indicated in his most recent peer review that the “NDM, Version 5.0, is the best numerical groundwater flow model currently available for assessing the effects of withdrawals in the central (Florida) springs region.” The regional model grid consists of 212 columns and 275 rows with uniform grid spacing of 2,500 feet. The active model grid covers about 10,000 square miles in North-Central Florida. Seven active layers in the model represent the primary geologic and hydrogeologic units including: 1) Surficial Sands, 2) ICU, 3) Suwannee Limestone, 4) Ocala Limestone, 5) Upper Avon Park Formation, 6) MCU I and MCU II, and 7) Lower Avon Park Formation or Oldsmar Formation. The UFA is composed mainly of Suwannee Limestone, Ocala Limestone, and Upper Avon Park Formation. The Lower Floridan aquifer is composed of the permeable parts of both the Lower Avon Park and the Oldsmar Formations. Because of the permeability contrast between the units, each unit is simulated as a discrete layer rather than using a single layer to represent a thick sequence of permeable formations within the UFA. This model is unique for West-Central Florida in that it is the first regional flow model that represents the groundwater system as fully three-dimensional. Prior modeling efforts, notably Ryder (1982, 1985), Sepulveda (2002), Knowles et al. (2002), and Motz and Dogan (2004), represented the groundwater system as quasi-three dimensional.
33

A large amount of hydrologic and geologic data was utilized to construct and calibrate the NDM. The District utilized hydraulic and geologic information from more than 50 Regional Observation and Monitoring-Well Program (ROMP) sites in the District model area. At nearly every site, coring of the earth materials occurred from land surface to more than 1,000 feet below land surface. Aquifer permeability was tested via slug tests and packer tests at specified intervals within each aquifer. Monitor wells were installed in each aquifer to measure water levels through time. The District installs continuous recorders or manually measures these monitor well water levels every month. These data are stored within a water management information database at the District, with some of the wells having a water level history of 30 to 40 years. Aquifer performance tests were conducted at some of the sites to measure water level response in the UFA from temporarily pumping it at high rates. All of this information assists the District in understanding how the aquifer system responds to groundwater withdrawn and helps staff build better models that represent the real world. The NDM, Version 5.0, was calibrated to steady-state 1995 calendar year conditions and transient conditions from 1996 through 2006 using monthly stress periods. The model was also verified for 2010 steady-state conditions. The calibration process simply involves modifying aquifer parameters within a reasonable range in the model to best match measured aquifer water levels at wells and springflows recorded by the USGS. This process accounts for some of the uncertainty in aquifer parameters between data points. If a model can closely replicate aquifer water levels and flow through time, then it is deemed well-calibrated. This, in turn, provides confidence that it is an effective tool to make predictions. In 2010, water levels from over 384 observation wells in the UFA were matched within the model domain (Figure 2-19). The groundwater flow and solute transport modeling computer code, MODHMS, was used for the groundwater flow modeling (HGL 2011). MODHMS is an enhanced version of the USGS modular, three-dimensional groundwater flow code (McDonald and Harbaugh 1988). This code was selected because of its powerful ability to simulate variably saturated conditions in Layer 1, coupled with its ability to model saltwater intrusion as a solute transport model in the District’s Northern Region. In the NDM, Version 5.0, mean water level error (simulated minus observed) in the UFA for 1995 and the 1996-2006 average transient period was +0.17 feet and +0.41 feet, respectively (HGL and Dynamic Solutions, Inc. 2016). The mean absolute error varied from 3.77 to 3.61 feet for both periods, respectively, based on 137 wells in 1995 and 157 wells from 1996-2006. These statistics were for wells within the 4,600-square mile Northern West-Central Florida Groundwater Basin. The mean error for Rainbow Springs flows (simulated minus observed) for 1995 was less than one percent and for the 1996-2006 period was minus two percent. The mean error during the 2010 verification period was minus one percent.
To determine potential impacts to Rainbow Springs flow, 2010, 2014, and projected 2035 groundwater withdrawals with and without conservation/reuse were simulated in the NDM under long-term transient conditions (five years) and compared to pre-pumping conditions (zero withdrawals) by running the model one year under transient conditions. Groundwater withdrawals include both water use permitted and domestic self-supply withdrawals. The
34
Figure 2-18. The Northern District groundwater flow model, Version 5.0, model grid.
35

Figure 2-19. Location of Upper Floridan aquifer target wells used in the Northern District groundwater flow model, Version 5.0, for 2010.
UFA heads and springflows generated at the end of each period were subtracted from UFA heads and springflows at the end of the non-pumping simulation to determine aquifer water level drawdown and flow changes. The model predicts UFA drawdown of approximately 0.1 feet from pre-pumping to 2010 conditions at Rainbow Springs. The predicted reduction in Rainbow Springs flow from pumping in each period is shown in Table 2-3. Predicted flow changes due to pumping are smaller in 2014, since groundwater
36
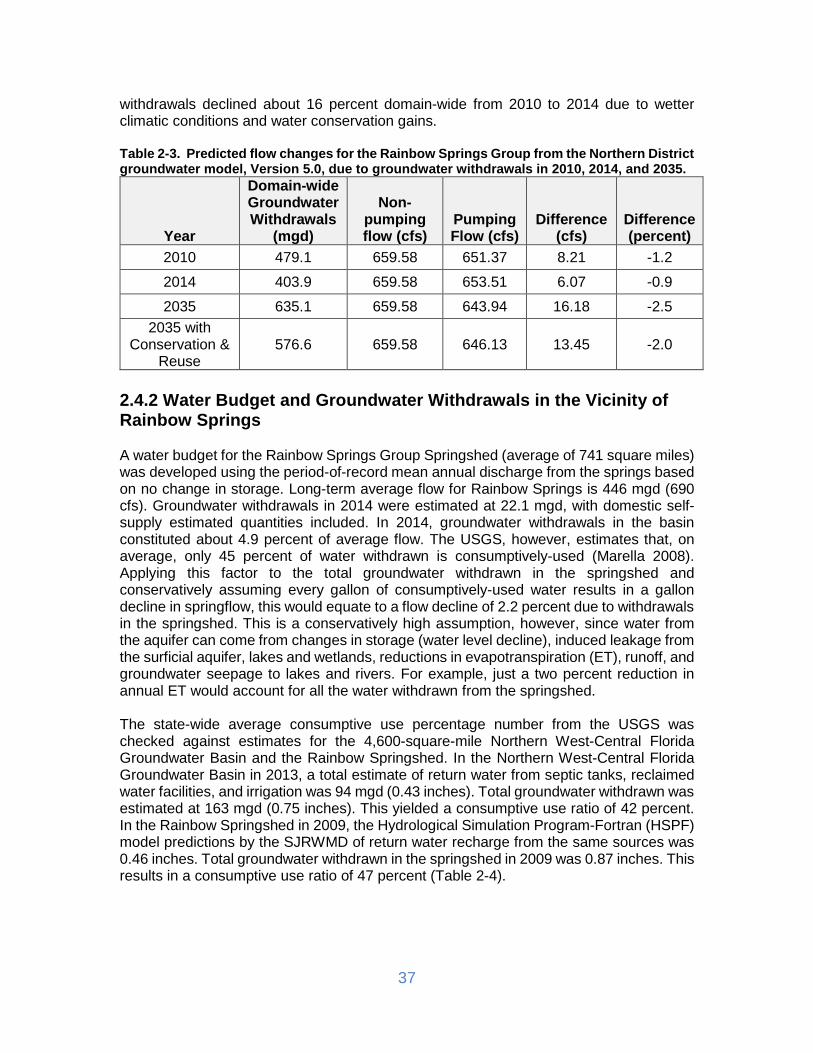
withdrawals declined about 16 percent domain-wide from 2010 to 2014 due to wetter climatic conditions and water conservation gains. Table 2-3. Predicted flow changes for the Rainbow Springs Group from the Northern District groundwater model, Version 5.0, due to groundwater withdrawals in 2010, 2014, and 2035.
Year
Domain-wide Groundwater Withdrawals
(mgd)
Non-pumping flow (cfs)
Pumping Flow (cfs)
Difference (cfs)
Difference (percent)
2010 479.1 659.58 651.37 8.21 -1.2
2014 403.9 659.58 653.51 6.07 -0.9
2035 635.1 659.58 643.94 16.18 -2.5 2035 with
Conservation & Reuse
576.6 659.58 646.13 13.45 -2.0
2.4.2 Water Budget and Groundwater Withdrawals in the Vicinity of Rainbow Springs A water budget for the Rainbow Springs Group Springshed (average of 741 square miles) was developed using the period-of-record mean annual discharge from the springs based on no change in storage. Long-term average flow for Rainbow Springs is 446 mgd (690 cfs). Groundwater withdrawals in 2014 were estimated at 22.1 mgd, with domestic self-supply estimated quantities included. In 2014, groundwater withdrawals in the basin constituted about 4.9 percent of average flow. The USGS, however, estimates that, on average, only 45 percent of water withdrawn is consumptively-used (Marella 2008). Applying this factor to the total groundwater withdrawn in the springshed and conservatively assuming every gallon of consumptively-used water results in a gallon decline in springflow, this would equate to a flow decline of 2.2 percent due to withdrawals in the springshed. This is a conservatively high assumption, however, since water from the aquifer can come from changes in storage (water level decline), induced leakage from the surficial aquifer, lakes and wetlands, reductions in evapotranspiration (ET), runoff, and groundwater seepage to lakes and rivers. For example, just a two percent reduction in annual ET would account for all the water withdrawn from the springshed. The state-wide average consumptive use percentage number from the USGS was checked against estimates for the 4,600-square-mile Northern West-Central Florida Groundwater Basin and the Rainbow Springshed. In the Northern West-Central Florida Groundwater Basin in 2013, a total estimate of return water from septic tanks, reclaimed water facilities, and irrigation was 94 mgd (0.43 inches). Total groundwater withdrawn was estimated at 163 mgd (0.75 inches). This yielded a consumptive use ratio of 42 percent. In the Rainbow Springshed in 2009, the Hydrological Simulation Program-Fortran (HSPF) model predictions by the SJRWMD of return water recharge from the same sources was 0.46 inches. Total groundwater withdrawn in the springshed in 2009 was 0.87 inches. This results in a consumptive use ratio of 47 percent (Table 2-4).
37

Table 2-4. Consumptive use estimates for the Rainbow Springshed, Northern West-Central Florida Groundwater Basin, and Florida.
Area Year Return Water
(inches) Pumping (inches)
Consumptive Use Ratio (percent)
Rainbow Springshed 2009 0.46 0.87 47 Northern West-Central
Florida Groundwater Basin 2013 0.43 0.75 42
Florida1 2005 NA NA 45 1Marella 2008 The District maintains a metered and estimated water use database from 1992 through 2014. Water use permitted groundwater withdrawals in the vicinity of the Rainbow Springs Group for 2014 are shown in Figure 2-20, while the groundwater withdrawal history from 1992 through 2014 is shown in Figure 2-21. Groundwater withdrawals have declined since reaching their peak of 37 mgd in 2006.
Figure 2-20. Water use permitted groundwater use in the Rainbow Springshed in 2014.
38

Figure 2-21. Estimated and metered water use history within the Rainbow Springshed from 1992 through 2014. Estimates for domestic-self supply are included.
In 2014, water use permitted groundwater withdrawals based on estimated and metered use were 17.6 mgd with another 4.5 mgd estimated for domestic self-supply. Since 2000, water use permitted groundwater use has essentially remained flat with a slightly negative change rate of only -0.11 mgd per year (Figure 2-22). Groundwater withdrawn within a five-mile radius of the springs is relatively small and was 1.7 mgd in 2014. The trend in springshed groundwater use is similar to the overall trend within the District Northern Planning region, which includes Citrus, Hernando, Lake, Levy, Marion, and Sumter Counties. Groundwater use in the planning region in 2015 was 114.2 mgd, down from its peak in 2006 of 161.4 mgd (Figure 2-23).
2.4.3 Rainbow Springshed Water Budgets for 1995 and 2010 Water budgets were prepared using the May 2005 Rainbow Springshed (735 square miles) for calendar years 1995 and 2010 based on the boundary depicted in Figure 2-20. The equation for a water budget is below: Recharge = Rainfall – Evapotranspiration (ET) – Runoff – Pumping – Storage This equation can be further simplified for internally-drained areas like the Rainbow Springshed by eliminating runoff as follows: Recharge = Rainfall – Evapotranspiration (ET) – Pumping – Storage Rainfall was averaged over the springshed based on radar-estimated precipitation. Recharge was averaged over the Rainbow Springshed from the NDM, Version 5.0. In
39

Figure 2-22. Trend in water use permitted groundwater use in the Rainbow Springshed from 2000 through 2014.
Figure 2-23. Estimated and metered water use history within the SWFWMD Northern Planning Area from 1990 through 2015, includes domestic self-supply estimates.
40

both 1995 and 2010, ET was calculated as the residual in the equation. Pumping was totaled within the springshed based on District water use and estimated water use from the SJRWMD. Storage changes were determined based on the change in monthly water level at the Rainbow Springs near Dunnellon Well from December of the previous year and January of the following year. These water level changes were converted to flow changes at Rainbow Springs and averaged over the springshed. A comparison was made to a USGS-calculated water budget for a longer term period (1965-1994 average) for the Rainbow Springshed from Knowles (1996). Table 2-5 summarizes the results of the springshed water budget analysis. The 1995 and 2010 water budgets compare favorably with the USGS long-term budget; this provides good verification of NDM recharge for the springshed for two different periods. Table 2-5. Water budget for 1995 and 2010 for the Rainbow Springshed compared to a long-term water budget by the USGS.
Period Rainfall (inches) ET (inches) Pumping
(inches) Storage (inches)
Recharge (inches)
1965-19941 53.2 38.5 0.3 -0.8 15.2
1995 53.1 35.6 0.6 0 16.9
2010 49.7 33.9 0.8 0.1 14.9 1Knowles 1996
2.4.4 Rainbow Springshed Boundary Changes Through Time The boundaries of the Rainbow Springshed were plotted using the USGS potentiometric surface maps based on predevelopment conditions, May 1975, May 1987, May 1995, and May 2005 periods to see if any significant changes have occurred through time (Figure 2-24). Springshed boundaries, like regional groundwater basin boundaries, are flow divides in the UFA that are largely controlled by the geology and hydraulics of the flow field and, thus, they are described as semi-permanent. From this analysis, the size of the Rainbow Springshed varied from 678 to 824 square miles, with an average of 741 square miles (Table 2-6). The springshed boundary maps through time show the most variation along the northwest boundary due to the areal extent of a small potentiometric high in Levy County that has been mapped slightly differently by the USGS through time. There is very little groundwater withdrawn in this area, even under current conditions and only a few monitor wells exist near the potentiometric high. The 1975 map showed the greatest variation, most likely due to poor well control during that period. Over the last 20 years with the best well data, the springshed area has changed little (within 10 percent). More recent comparisons over the last 20 years, with more monitor well data, show a fairly consistent springshed area (an average 740 square miles).
41

Figure 2-24. Rainbow Springshed boundaries from predevelopment, May 1975, May 1987, May 1995, and May 2005.
Table 2-6. Size of the Rainbow Springshed through time.
Period Springshed Area (square miles)
Predevelopment 678
May 1975 824
May 1987 766
May 1995 702
May 2005 735
Average Area 741
42

An important factor to consider when evaluating springshed boundaries is well control or the number of monitor wells used to map the surface. The relatively small changes in boundary geometry are largely due to slight variations in the potentiometric surface due to the availability of measured water levels for that particular period or slight perturbations in the flow field due to interpolation methods by individual map authors. Both the District and the SJRWMD are proposing to install additional water level monitor wells within the Rainbow and Silver Springsheds over the next five years to continually refine springshed boundary delineation in the future.
43
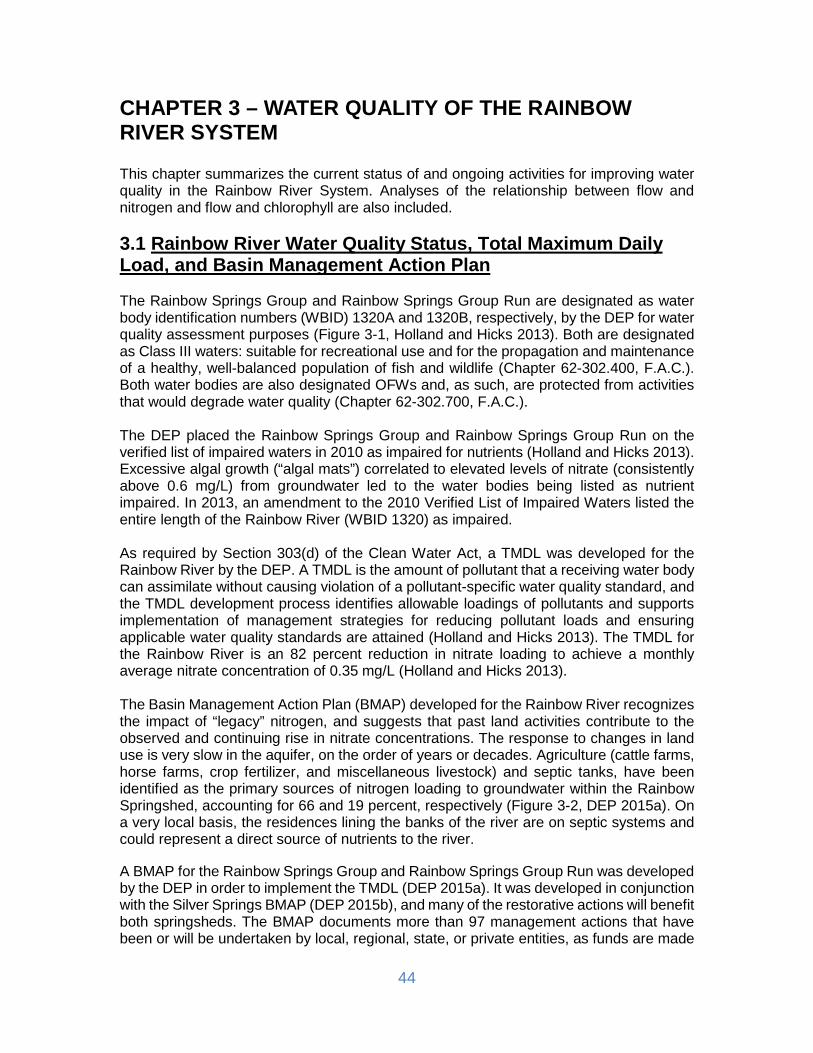
CHAPTER 3 – WATER QUALITY OF THE RAINBOW RIVER SYSTEM This chapter summarizes the current status of and ongoing activities for improving water quality in the Rainbow River System. Analyses of the relationship between flow and nitrogen and flow and chlorophyll are also included. 3.1 Rainbow River Water Quality Status, Total Maximum Daily Load, and Basin Management Action Plan The Rainbow Springs Group and Rainbow Springs Group Run are designated as water body identification numbers (WBID) 1320A and 1320B, respectively, by the DEP for water quality assessment purposes (Figure 3-1, Holland and Hicks 2013). Both are designated as Class III waters: suitable for recreational use and for the propagation and maintenance of a healthy, well-balanced population of fish and wildlife (Chapter 62-302.400, F.A.C.). Both water bodies are also designated OFWs and, as such, are protected from activities that would degrade water quality (Chapter 62-302.700, F.A.C.). The DEP placed the Rainbow Springs Group and Rainbow Springs Group Run on the verified list of impaired waters in 2010 as impaired for nutrients (Holland and Hicks 2013). Excessive algal growth (“algal mats”) correlated to elevated levels of nitrate (consistently above 0.6 mg/L) from groundwater led to the water bodies being listed as nutrient impaired. In 2013, an amendment to the 2010 Verified List of Impaired Waters listed the entire length of the Rainbow River (WBID 1320) as impaired. As required by Section 303(d) of the Clean Water Act, a TMDL was developed for the Rainbow River by the DEP. A TMDL is the amount of pollutant that a receiving water body can assimilate without causing violation of a pollutant-specific water quality standard, and the TMDL development process identifies allowable loadings of pollutants and supports implementation of management strategies for reducing pollutant loads and ensuring applicable water quality standards are attained (Holland and Hicks 2013). The TMDL for the Rainbow River is an 82 percent reduction in nitrate loading to achieve a monthly average nitrate concentration of 0.35 mg/L (Holland and Hicks 2013). The Basin Management Action Plan (BMAP) developed for the Rainbow River recognizes the impact of “legacy” nitrogen, and suggests that past land activities contribute to the observed and continuing rise in nitrate concentrations. The response to changes in land use is very slow in the aquifer, on the order of years or decades. Agriculture (cattle farms, horse farms, crop fertilizer, and miscellaneous livestock) and septic tanks, have been identified as the primary sources of nitrogen loading to groundwater within the Rainbow Springshed, accounting for 66 and 19 percent, respectively (Figure 3-2, DEP 2015a). On a very local basis, the residences lining the banks of the river are on septic systems and could represent a direct source of nutrients to the river. A BMAP for the Rainbow Springs Group and Rainbow Springs Group Run was developed by the DEP in order to implement the TMDL (DEP 2015a). It was developed in conjunction with the Silver Springs BMAP (DEP 2015b), and many of the restorative actions will benefit both springsheds. The BMAP documents more than 97 management actions that have been or will be undertaken by local, regional, state, or private entities, as funds are made
44

available, to reduce the amount of nitrogen released into the UFA, the source of flow in Rainbow Springs and the Rainbow River (DEP 2015a). The projects include stormwater structural BMPs, agricultural BMPs, restoration and water quality improvement projects, regulations/ordinances/guidelines, special studies/planning efforts, education and outreach, stormwater management program implementation, conservation land acquisition, onsite sewage treatment and disposal system or septic tank conversions, and wastewater system upgrades, management, maintenance, and repair (DEP 2015a). The BMAP will be implemented using a phased approach and adaptive management. Progress will be assessed every five years, and adjustments will be made if necessary.
Figure 3-1. Rainbow River System water quality monitoring sites. Sites located above the red line in the inset indicate sites within DEP WBID 1320A, while sites below the red line are part of DEP WBID 1320B.
45

Figure 3-2. Relative nitrogen inputs to groundwater in the Rainbow Springshed by source (Figure 9 from DEP 2015a).
3.2 Rainbow River System Water Quality Water quality data have been collected for the Rainbow Springs Group and the Rainbow River by numerous entities over the years. Information regarding monitoring that was used to determine impairment in the DEP analyses is listed in Table 3-1, along with information on monitoring at an additional site that provides useful historical context for water quality in the system. Locations of the monitoring sites listed in Table 3-1 are shown in Figure 3-1. The frequency of water quality data collection has varied, although sampling has most commonly been conducted on a quarterly basis. Available USGS data includes approximately quarterly water quality records from 1963 through 1999. The District has collected water quality data quarterly at several spring vents from 1994 to the present. Collection of these samples involves pumping water from the spring vent up through a tube attached to a peristaltic pump. The District has also collected samples at river sites (“RR”) by taking a grab sample 0.5 meters below the water surface; these data have been collected from 2002 to the present. Nitrate (NO3) is the form of nitrogen that occurs in the highest concentrations in groundwater and springs. Nitrite-nitrogen (NO2), an intermediate form of nitrogen, is almost entirely converted to nitrate in the nitrogen cycle. Nitrate and nitrite are frequently analyzed and reported together as one concentration (nitrate + nitrite as nitrogen), but the
46

nitrite contribution is insignificant, so the value approximates nitrate. Data reported as “total nitrogen,” “nitrate + nitrite,” and “nitrate” give approximately the same values since nitrate is the primary constituent of the sample, so if more than one of these values was reported for a given site on a given day, the data were averaged per day per site for the analyses in this report, and the value is denoted “NOx-N.” Phosphorus is a nutrient of concern and is typically analyzed as orthophosphate (OP) and as total phosphorus (TP), which includes OP in addition to organic phosphorus compounds. In general, only the inorganic form of phosphorus, OP, is found in groundwater in Florida and, thus, comprises most of the TP reported value. Phosphorus contributions to surface water bodies are typically the result of surface runoff, which transports OP and organic phosphorus compounds. The Rainbow River System includes at least 87 spring vents, 12 of which are named. Groundwater discharge accounts for 97 to 99 percent of the river flow, with very little surface runoff from the watershed (WAR 1991). Nitrate levels have been increasing in many Florida springs systems over the past several decades (Harrington et al. 2010, SWFWMD 2015a), including the Rainbow River System; however, other Rainbow River water chemistry parameters have remained relatively stable over time. An analysis of historical data from the Rainbow River at Dunnellon, FL Gage from the 1960s through 1999 illustrates this increase in nitrate concentrations over time (Figure 3-3). Nitrate levels in the springs within the Rainbow River System sampled by the District have also continued to increase since the 1990s, averaging around 1.0 mg/L in the mid- to late 1990s and greater than 2.0 mg/L in recent years (Figure 3-4). This increase in nitrogen is hypothesized to be the primary source of the imbalance of algae that has been noted in the Rainbow River System and is implicated as a cause of impairment (Holland and Hicks 2013). A similar trend is evident in the data collected at the river sites sampled by the District, with nitrate concentrations increasing over time at all sites (Figure 3-5). For the river sites, there are higher average nitrate concentrations upstream, near the headsprings, relative to downstream (Figure 3-6), which illustrates that the primary source of nitrate is groundwater rather than runoff from the landscape or point-source discharges. The decreasing nitrate concentrations downriver could be due to uptake by plants and algae and to denitrification as the water moves downstream (Cohen et al. 2013). Neither OP nor TP has shown an increasing temporal trend in the system, and levels remain close to concentrations levels found in the 1950s (Holland and Hicks 2013). Figure 3-7 illustrates the TP concentrations through time at the springs sites monitored by the District.
47

Table 3-1. Rainbow River water quality monitoring sites and data collection information.
Agency Site ID Site Name Years Collected Data Collection Frequency
SWFWMD 23319 Rainbow 1 Spring 1994-Present Quarterly
SWFWMD 23325 Rainbow 4 Spring 1994-Present Quarterly
SWFWMD 23321 Rainbow Bridge Seep North 1994-Present Quarterly: 1994-1998; Annually: 1999-
2006; Quarterly: 2007-2015
SWFWMD 23300 Rainbow Bubbling Spring 1994-Present Quarterly
SWFWMD 23290 Rainbow 6 Spring 1994-Present Quarterly
SWFWMD 23294 RR1 1994-Present Approx. bimonthly: 2002-2010; Quarterly: 2011-present
SWFWMD 23289 RR2 1994-Present Monthly: 2002-2003; Bimonthly: 2004-2010; Quarterly: 2011-present
SWFWMD 23285 RR3 1994-Present Approx. bimonthly: 2002-2010; Quarterly: 2011-present
SWFWMD 23277 RR4 1994-Present Monthly: 2002-2003; Bimonthly: 2004-2010; Quarterly: 2011-present
SWFWMD 23268 RR5 1994-Present Monthly: 2002-2003; Bimonthly: 2004-2010; Quarterly: 2011-present
SWFWMD 23262 RR7 1994-Present Monthly: 2002-2003; Bimonthly: 2004-2010; Quarterly: 2011-present
SWFWMD 23263 RR8 1994-Present Monthly: 2002-2003; Bimonthly: 2004-2010; Quarterly: 2011-present
SWFWMD 23269 RR9 1994-Present Monthly: 2002-2003; Bimonthly: 2004-2010; Quarterly: 2011-present
DEP 9700 DEP Rainbow 1 2001-2010 Quarterly
DEP 9701 DEP Rainbow 4 2001-2010 Quarterly
DEP 9702 DEP Rainbow 6 2001-2010 Quarterly
DEP 23010441 DEPSW Rainbow Spring 2004; 2009 Monthly
Lakewatch MAR-RA-RIVER-2 RA-River-2 2002-2006 Monthly
Lakewatch MAR-RA-RIVER-3 RA-River-3 2002-2006 Monthly
USGS1 02313100 Rainbow River at Dunnellon 1963-1999 Annually, Biannually, Quarterly
1USGS data were not used for the DEP assessment of water quality impairment because they were not available for the post-2000 assessment period.
48
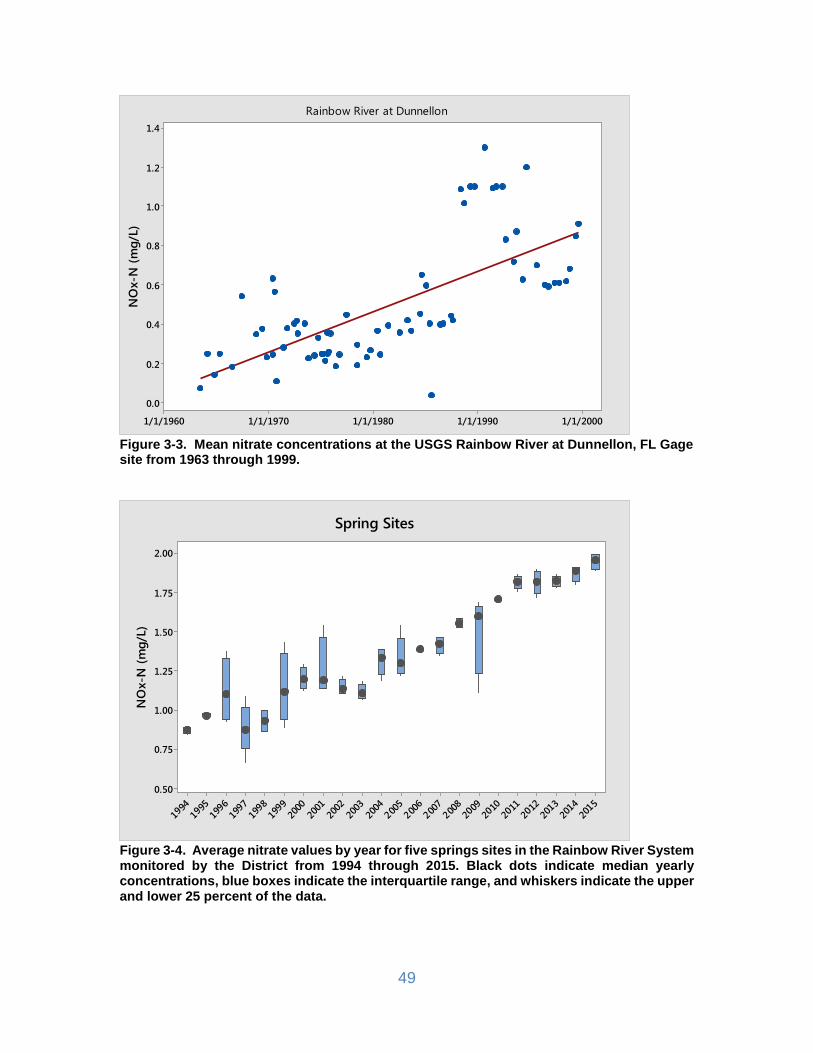
Figure 3-3. Mean nitrate concentrations at the USGS Rainbow River at Dunnellon, FL Gage site from 1963 through 1999.
Figure 3-4. Average nitrate values by year for five springs sites in the Rainbow River System monitored by the District from 1994 through 2015. Black dots indicate median yearly concentrations, blue boxes indicate the interquartile range, and whiskers indicate the upper and lower 25 percent of the data.
1/1/20001/1/19901/1/19801/1/19701/1/1960
1.4
1.2
1.0
0.8
0.6
0.4
0.2
0.0
NO
x-N
(mg/
L)
Rainbow River at Dunnellon
2015
2014
2013
2012
2011
2010
2009
2008
2007
2006
2005
2004
2003
2002
2001
2000
1999
1998
1997
1996
1995
1994
2.00
1.75
1.50
1.25
1.00
0.75
0.50
NO
x-N
(mg/
L)
Spring Sites
49

Figure 3-5. Average nitrate values by year for eight Rainbow River sites monitored by the District from 2002 through 2015. Black dots indicate median yearly concentrations, blue boxes indicate the interquartile range, and whiskers indicate the upper and lower 25 percent of the data.
Figure 3-6. Nitrate values at each Rainbow River site monitored by the District over time. Sites are in order from upstream to downstream, except for RR9 (see Figure 3-2).
20152014201320122011201020092008200720062005200420032002
2.0
1.8
1.6
1.4
1.2
1.0
0.8
NO
x-N
(mg/
L)
River (RR) Sites
1/1/20161/1/20141/1/20121/1/20101/1/20081/1/20061/1/20041/1/2002
2.5
2.0
1.5
1.0
0.5
NO
_X (m
g/L)
RAINBOW RIVER RR1RAINBOW RIVER RR2RAINBOW RIVER RR3RAINBOW RIVER RR4RAINBOW RIVER RR5RAINBOW RIVER RR7RAINBOW RIVER RR8RAINBOW RIVER RR9
50

Figure 3-7. Average total phosphorus values by year for five springs sites in the Rainbow River System monitored by the District from 1993 through 2015. Blue boxes indicate the interquartile range, the line within each box shows the median, and whiskers indicate the upper and lower 25 percent of the data. Asterisks show outlying data points; seven individual outlier points, greater than 0.6 mg/L, are not visible here due to scale. Table 3-2 provides the median values of NOx-N, TP, dissolved oxygen (DO), specific conductance, and turbidity for the sites used in the DEP assessment of water quality criteria. The DEP assessment of assigned water quality criteria which led to the impairment determination and total maximum daily load (TMDL) development was based on data collected starting in 2001; therefore, no data older than 2001 is included in this summary table. Monitoring data show that the median TP concentrations are low, as is turbidity, although it does increase at the lowest three river sites. The DO water quality standards for Class III water bodies are based on percent DO saturation. The criterion states that no more than 10 percent of the daily average percent DO saturation values shall be below 38 percent for waters in this area of Florida (Rule 62-302.533, F.A.C.). The DO is lowest at the Rainbow Bubbling Spring site, which is the only site with a median below 5.0 mg/L, but none of the data collected at any of the sites had DO percent saturation values below the criterion. Like most spring systems in Florida, the Rainbow River System is known for its exceptional water clarity. High water clarity allows light penetration that is a primary driver of the productive aquatic vegetation and algal communities that support spring ecosystems. Water clarity decreases in the lower portions of the Rainbow River System due to the accumulation of algae and other particles in the water from the upper river and remnant phosphate-mining coves connected to the river. Despite increasing nitrate levels, there is no evidence that water clarity has decreased in the river over time. Water clarity is most often measured based on the horizontal distance at which a small black and white Secchi disk disappears. Based on horizontal Secchi disk data collected by the District at the eight river sites from 2002 to 2016, there was actually a significant increase in water clarity at
2015
2014
2013
2012
2011
2010
2009
2008
2007
2006
2005
2004
2003
2002
2001
2000
1999
1998
1997
1996
1995
1994
1993
0.6
0.5
0.4
0.3
0.2
0.1
0.0
Tota
l Pho
spho
rus
(mg/
L)
Springs Sites
51

five river sites (RR1, RR2, RR3, RR4, RR7) and no significant trends at the other three river sites (RR5, RR8, RR9). Chlorophyll has been identified as the primary factor affecting water clarity in the Rainbow River System (Anastasiou 2006) (Figure 3-8). Chlorophyll concentrations are a measure of the amount of photosynthetic pigments from algae in the water column. Chlorophyll is primarily used as an indicator of phytoplankton (free-floating algae) but can also include periphyton (attached algae) fragments that have detached from the river bottom. Chlorophyll data were collected by the District at the eight river sites from 2002 to 2016. [Note: from 2002 through 2005, sampling methods were modified to estimate chlorophyll below the laboratory detection limit of 1 µg/L (see Anastasiou 2006)]. Chlorophyll was generally below the laboratory detection limit of 1 µg/L at the upper river sites (RR1 to RR5), which limits the utility of these data for statistical analyses. Chlorophyll was higher at the lower river sites (RR7 and RR8) and in the outlet of Blue Cove (RR9) (Figure 3-9). Historical chlorophyll data are sparse; however, current levels are similar to measurements taken on August 16, 1954, which suggests that chlorophyll and water clarity levels may not have changed substantially through time (Anastasiou 2006). From 2002 to 2016, there was a decrease in chlorophyll at RR8 and no change in RR7 and RR9 chlorophyll levels.
52

Table 3-2. Median values for water quality parameters collected at Rainbow River System sites. Sites are arranged from upstream to downstream. Only data for collected within the DEP assessment time period are summarized here. Sample size is denoted by “n.”
Site Name Agency Date
Range Collected
Statistic NOx-N (mg/L)
TP (mg/L)
DO (mg/L)
Specific Conductance
(uS/cm)
Turbidity (NTU)
RAINBOW 1 SPRING SWFWMD 2001-2015 median 1.81 0.027 6.88 162 0.13 n 58 59 59 60 55
RAINBOW 1 SPR DEP 2001-2010 median 1.75 0.029 6.50 157 0.10 n 34 33 34 34 32
RAINBOW 4 SPRING SWFWMD 2001-2015 median 1.79 0.032 5.34 268 0.13 n 58 58 59 60 55
RAINBOW 4 SPR DEP 2001-2010 median 1.70 0.034 5.11 258 0.10 n 34 33 34 34 31
RAINBOW BRIDGE SEEP NORTH SWFWMD 2001-2015 median 1.46 0.030 6.97 145 0.13
n 43 43 43 44 41
RAINBOW SPRING DEPSW 2001-2010 median 1.55 0.027 7.73 143 0.15 n 24 24 26 35 24
RAINBOW RIVER RR1 SWFWMD 2002-2015 median 1.70 0.028 7.34 187 0.13 n 71 76 49 49 76
RAINBOW BUBBLING SPRING SWFWMD 2001-2015 median 1.46 0.035 4.66 351 0.13
n 59 59 58 60 55
RAINBOW RIVER RR2 SWFWMD 2002-2015 median 1.48 0.030 7.43 270 0.13 n 75 77 49 49 78
RAINBOW RIVER RR3 SWFWMD 2002-2015 median 1.41 0.030 8.10 276 0.13 n 73 78 49 49 79
RAINBOW 6 SPRING SWFWMD 2001-2015 median 1.21 0.028 6.08 352 0.13 n 59 59 60 60 55
RAINBOW 6 SPR DEP 2001-2010 median 1.20 0.029 5.72 343 0.10 n 33 32 34 34 32
RA-RIVER-2 Lakewatch 2002-2006 median 1.12 0.030 no data no data no data n 43 43
RAINBOW RIVER RR4 SWFWMD 2002-2015 median 1.30 0.030 9.33 285 0.13 n 79 79 49 49 77
RAINBOW RIVER RR5 SWFWMD 2002-2015 median 1.31 0.034 6.93 285 0.18 n 76 76 49 49 76
RAINBOW RIVER RR9 SWFWMD 2002-2015 median 1.15 0.032 9.71 282 0.42 n 72 77 49 49 77
RAINBOW RIVER RR7 SWFWMD 2002-2015 median 1.27 0.036 7.66 284 0.29 n 74 76 49 49 77
RA-RIVER-3 Lakewatch 2002-2006 median 1.15 0.038 no data no data no data n 40 40
RAINBOW RIVER RR8 SWFWMD 2002-2015 median 1.26 0.037 7.94 284 0.32 n 76 76 49 49 75
53

Figure 3-8. Relationship between chlorophyll and water clarity (horizontal Secchi disk) at seven river sites in the Rainbow River System (Anastasiou 2006). Since RR9 is located in Blue Cove, it was excluded from this analysis.
Figure 3-9. Chlorophyll concentrations at eight river sites in the Rainbow River System from 2002 to 2016. Blue boxes indicate the interquartile range, and whiskers indicate the upper and lower 25 percent of the data.
54

3.3 Rainbow River System Nitrate Concentrations vs. Flow The discharge of many springs within the District has been declining since the 1960s, and over this same time period, there have been increases in NOx-N concentrations (Heyl 2012). Because the potential relationship between these two occurrences has received considerable attention, the relationship between NOx-N levels and flow in the Rainbow River System was investigated. Water quality data collected by the District from five springs sites (Rainbow 1 Spring, Rainbow 4 Spring, Rainbow 6 Spring, Bubbling Spring, and Rainbow Bridge Seep North) and from eight river sites (RR1, RR2, RR3, RR4, RR5, RR7, RR8, RR9) were paired with discharge data from the Rainbow River at Dunnellon, FL Gage. Analyses were performed on each site separately, as well as for all sites combined, and only NOx-N data collected after 2000 were included in the analyses. To evaluate the relationships and changes in flow and NOx-N concentrations for the Rainbow River System, each trend was evaluated in the context of the other. For this analysis, the influence of one predictor variable was systematically removed before testing the other predictor variable. First, NOx-N was specified as the response variable, discharge was selected as the predictor variable, and a Locally Weighted Scatterplot Smoothing (LOWESS) (Helsel and Hirsch 2002) was calculated. The output included observed NOX-N values, the LOWESS-predicted NOX-N values, and the differences, termed “residuals.” The residuals represent the concentration of NOX-N that cannot be explained by flow; in other words, the effect of flow was removed from the time series of NOX-N values. The residuals were then plotted against time, and the relationships were tested using a Kendall’s tau analysis and a Spearman’s rho analysis to determine if the trends were statistically significant. The residuals were determined to be significantly related to time for all sites (Table 3-3), indicating that the NOX-N concentration that cannot be explained by flow increased with time. Time was then selected as the predictor variable, and the evaluation was repeated. In this case, the variation in NOX-N that can be explained by time was removed and the residuals tested for a significant relationship with flow using both a Kendall’s test and Spearman’s test. Once the time effect was removed, the relationship between NOX-N concentration and flow was not significant at any of the spring vent sites and was only significant at one (RR2) of the eight river sites, although two other sites (RR1 and RR3) approached significance (Table 3-3; Appendix E). Figure 3-10 indicates that, based on all samples combined, there is a strong influence of time on nitrate concentration in the Rainbow River System and no significant effect of flow on nitrate. These findings are consistent with District evaluations of six other springs, including Silver Springs, which demonstrated that increases in nitrate concentration are independent of flow but strongly dependent on time (Heyl 2012). Similarly, no relationships between flow rates and notable water quality trends in the Silver River were found in a recent investigation (ATM 2016).
55

Table 3-3. Kendall’s tau and Spearman’s rho p values for analyses of the effects of flow and date on NOx-N concentrations at spring and river sites in the Rainbow River System. Values highlighted in bold are statistically significant (p<0.05).
Site Name Number
of Samples
Begin End p Value Associated with Kendall’s Tau
(Discharge Residual vs. Date)
p Value Associated with Spearman’s rho (Discharge Residual
vs. Date)
p Value Associated with Kendall’s Tau (Date
Residual vs. Discharge)
p Value Associated with Spearman’s rho (Date
Residual vs. Discharge)
RAINBOW 1 SPRING 43 7/25/2000 1/20/2016 0.000 0.000 0.713 0.656
RAINBOW 4 SPRING 42 10/17/2000 1/20/2016 0.000 0.000 0.407 0.427
RAINBOW BUBBLING SPRING 43 10/17/2000 1/20/2016 0.000 0.000 0.546 0.579
RAINBOW BRIDGE SEEP N 25 1/23/2002 1/20/2016 0.009 0.010 0.885 0.992
RAINBOW 6 SPRING 41 3/22/2001 1/20/2016 0.000 0.000 0.77 0.668
RR1 74 6/26/2002 1/19/2016 0.000 0.000 0.068 0.063
RR2 77 6/26/2002 1/19/2016 0.000 0.000 0.023 0.034
RR3 75 6/26/2002 1/19/2016 0.000 0.000 0.087 0.078
RR4 80 6/26/2002 1/19/2016 0.000 0.000 0.11 0.104
RR5 77 6/27/2002 1/21/2016 0.000 0.000 0.413 0.392
RR7 75 6/27/2002 1/21/2016 0.000 0.000 0.983 0.912
RR8 77 6/27/2002 1/21/2016 0.000 0.000 0.574 0.598
RR9 73 8/27/2002 1/21/2016 0.000 0.000 0.331 0.328
56

Figure 3-10. Residual plots for all District Rainbow River System sites combined. NOx-N concentration unaccounted for by flow is significantly related to date (top panel) while concentration unaccounted for by date is not significantly related to flow (bottom panel). In other words, flow does not significantly affect NOx-N concentration, but NOx-N has increased significantly since 2000.
1/1/20151/1/20101/1/20051/1/2000
1.0
0.5
0.0
-0.5
-1.0
Resi
dual
800700600500400
0.8
0.6
0.4
0.2
0.0
-0.2
-0.4
-0.6
-0.8
Flow (Q)
Resi
dual
57

3.4 Rainbow River System Chlorophyll Concentrations vs. Flow In many water bodies, phytoplankton abundance is inversely correlated with water residence time, although in the upper reaches of riverine systems residence times can be too short for substantial phytoplankton populations to develop (Hilton et al. 2006). In order to investigate the influence of flow on residence time and phytoplankton abundance in the Rainbow River System, the relationships between chlorophyll and flow were assessed. The hypothesis was that chlorophyll would be positively correlated with residence time and, therefore, negatively correlated with flow in the river. Blue Cove is known to be a source of chlorophyll to the lower river, so chlorophyll data from the cove outlet (RR9) were also evaluated to see if flow and river stage affected chlorophyll export from the cove. Chlorophyll concentrations from only two sites in the lower river (RR7 and RR8) and the site in the outlet of Blue Cove (RR9) were consistently above laboratory detection limits for chlorophyll (1 µg/L) (Figure 3-9), so the statistical analyses were limited to these three sites. In most cases, data were not normally distributed (despite log-transformation), so the relationships between chlorophyll concentrations and flow at the Rainbow River at Dunnellon, FL Gage were assessed using non-parametric statistical tests (Kendall’s tau and Spearman’s rho) at a 0.05 level of significance. Only site RR8 exhibited a significant relationship between chlorophyll and flow (Figure 3-11). Chlorophyll was weakly positively related to flow indicating that longer residence times do not lead to increased phytoplankton abundance in the lower river. The positive relationship between chlorophyll and flow is likely due to increased sloughing of attached periphyton from upstream or export of phytoplankton from backwater areas at higher flows.
Figure 3-11. Relationship between chlorophyll and flow at site RR8 from 2002 to 2016.
58

Seasonal fluctuations were apparent in the chlorophyll data. Highest values typically occurred from July to October, with peaks in July. During some years, there was also a chlorophyll peak from March to April. To examine potential seasonal effects on flow and chlorophyll relationships, data were analyzed separately from March to April, July to October, and for July only. For the two lower river sites, no significant relationships were found between chlorophyll and flow for any season, except for site RR8 based on the July data. For Blue Cove, peak chlorophyll export was negatively correlated with river flow and stage based on the July to October data. Overall, this data analysis indicates that there is not a strong relationship between chlorophyll and residence time in the river, likely due to relatively short residence times that limit phytoplankton abundance. Residence times appear to be much longer within Blue Cove, where phytoplankton export to the river has been observed (Cohen et al. 2015). An investigation of residence time within Blue Cove and hydrologic exchange between the cove and the river is ongoing (Cohen et al. 2015). In addition, the District intends to comprehensively evaluate relationships between hydrology and periphytic and planktonic algae in the Rainbow River System during the reevaluation period.
59

CHAPTER 4 – ECOLOGICAL RESOURCES OF THE RAINBOW RIVER SYSTEM Numerous studies have characterized the diverse flora and fauna of the Rainbow River System. In addition, lists of species found in Rainbow Springs State Park and Rainbow Springs Aquatic Preserve are included in the latest versions of their management plans (DEP 2002, 2015c). This chapter provides a brief summary of some of this information. 4.1 Floodplain Wetlands Vegetation The incised nature of the Rainbow River channel and the associated narrow floodplain are a result of the karst terrain of the watershed and the permanent (although seasonally variable) flows (PBS&J 2008). In addition, narrowing of the floodplain most likely occurred as a result of elevated Rainbow River water levels associated with the construction of Inglis Dam (Downing et al. 1989). Using the Cooperative Land Cover (CLC) Classification System, more than 500 acres of wetlands occur in the Rainbow River floodplain, and they consist of seven wetland community types (Figure 4-1). Wetland vegetation along the Rainbow River is generally characterized by hardwood hammocks that include species such as laurel oak (Quercus laurifolia), red maple (Acer rubrum), ironwood (Carpinus caroliniana), swamp bay (Persea palustris), cabbage palm (Sabal palmetto), and tupelo (Nyssa sylvatica); more than half of the floodplain wetlands are mixed hardwood hammocks, followed by hydric hammocks. Cypress (Taxodium distichum) swamps are limited to narrow bands along the river’s edge where soils are permanently or semi-permanently flooded as a result of permanent groundwater flows from the numerous springs. Tree species that are less flood tolerant and occur in hammock communities, such as cabbage palm and red maple, occur landward of the cypress, but may reach the banks of the river where the transition to open water is steep. The mid-reaches of the river have fewer wetlands within a narrower corridor as compared with the upstream and downstream reaches and are dominated by laurel oak and cabbage palm. The results of an investigation characterizing the soils and vegetation communities along the Rainbow River System floodplain, which is included in Appendix F, demonstrated a small elevation change across wetlands and illustrated the large change in the extent of wetland inundation or soil saturation that can occur as a result of a relatively small changes in river water levels (Figure 4-2, PBS&J 2008). A steep increase in cumulative inundated floodplain wetlands habitat coinciding with a particular shift in vegetation classes was apparent along the study transects (Figure 4-3). Because almost all of the flow in the Rainbow River is due to groundwater inflows that vary seasonally with aquifer levels, the variation in water levels is small compared to rivers with large surface water runoff influence. In addition, a majority of the floodplain wetlands seldom, if ever, receive inundation from the river and are most likely maintained by soil saturation regimes associated with groundwater flows/levels (HSW 2009).
60

Figure 4-1. Distribution of wetland community types along the Rainbow River System floodplain.
61

Figure 4-2. Elevation and vegetation profile plot for Rainbow River Floodplain Study Site Veg 3 as an example (Appendix A from PBS&J 2008). See Figures 6-1 and 6-6 for the location of Site Veg 3.
Figure 4-3. Cumulative inundated floodplain wetlands habitat/wetted perimeter versus median elevation plot for Rainbow River Floodplain Study Site Veg 3 as an example (Figure 4-10 from PBS&J 2008). See Figures 6-1 and 6-6 for the location of Site Veg 3.
62

4.2 Aquatic Vegetation The diverse and abundant emergent and submergent vegetation communities of the Rainbow River System help to maintain water quality, support fish and wildlife, stabilize banks and sediments, and contribute to the river’s scenic qualities (WAR 2016). Since 1996, regular monitoring of submerged aquatic vegetation (SAV) and emergent vegetation within the system has occurred approximately every 5 years to document plant diversity, abundance, and change in assemblages through time (DEP 1996, PBS&J 2000, PBS&J and Debra Childs Woithe, Inc. 2007, Atkins North America, Inc. and Debra Childs Woithe, Inc. 2012, WAR 2016). Details of the 2015 aquatic vegetation survey are contained in Appendix G. The total area of emergent vegetation in the river increased 12.2 acres from 2011 to 2015 (WAR 2016). The highest percent of emergent vegetation occurred near the headsprings. Twenty-five species were observed in 2015, which included four additional taxa as compared to 2011. The most dominant species of emergent vegetation by area in 2015 were: paspalum grasses (Paspalum sp.), climbing hempvine (Mikania scandens), Egyptian panicgrass (Paspalidium geminatum), torpedograss (Panicum repens), cattails (Typha sp.), and pennyworts (Hydrocotyle sp.). The relative cover of SAV increased by more than 20 percent between 2011 and 2015, from 52.8 percent in 2011 to 73.3 percent in 2015 (WAR 2016). Sixteen SAV taxa were recorded in 2015, with the highest diversity found near the headspring. Similar to 2011, the six most abundant SAV species river-wide in 2015 were strap-leaf sagittaria (Sagittaria kurziana), hydrilla (Hydrilla verticillata), eelgrass (Vallisneria americana), southern naiad (Najas guadalupensis), coontail (Ceratophyllum demersum), and Illinois pondweed (Potamogeton illinoensis). River-wide in 2015, hydrilla increased the most in relative cover (10.5 percent, from 7.4 to 17.8 percent), followed by southern naiad (7.3 percent), eelgrass (6.2 percent), and coontail (4.3 percent) compared to 2011. Strap-leaf sagittaria, a key native species, decreased in relative cover for the whole river by 5.3 percent between 2011 and 2015. The SAV species composition and dominance in the system changed with distance from the headsprings (WAR 2016). Strap-leaf sagittaria dominated the top half of the river, was replaced by eelgrass in the middle, and by hydrilla, an invasive introduced species, in the lower river near the confluence with the Withlacoochee River. The relative cover of hydrilla increased river-wide compared to 2011, but it was especially significant in the lower river (Figure 4-4). For example, due to this increase, the total SAV species cover in 2015 more than doubled in the lower 2.5 km of the Rainbow River as compared to 2011. The combined cover of filamentous epiphytic and benthic macroalgae in 2015 generally increased with distance from the headsprings (Figure 4-4); however, comparisons could not be made to 2011 because of methodology differences.
63

Figure 4-4. The relative coverage of hydrilla (Hydrilla verticillata) (left panel) and algae (right panel) by zone in the Rainbow River (reproduced from Figures 3-10 and 3-15 from WAR 2016). The effects of increased nitrate concentrations on SAV in the Rainbow River are not completely understood, although nitrate has been shown to be one of the primary stimulants for the growth of filamentous algae in spring run river systems (Stevenson et al. 2007); elevated nitrate levels may also support the increased growth of hydrilla. Some studies suggest that other attributes, such as dissolved oxygen, flow, specific conductance, and salinity, which are less studied in spring systems than nitrogen, may also contribute to increased algal coverage (Cowell and Botts 1994, Stevenson et al. 2004, Heffernan et al. 2010). Ongoing research in the Rainbow River is examining the effect of other minerals (specifically potassium, iron, manganese, calcium, and chloride) on SAV and algae growth (Cohen et al. 2015). Flow strongly influences algae communities in rivers and streams (Biggs 1996, Stevenson 1996). Filamentous algae may be particularly responsive to higher flows because larger algae experience increased drag (Biggs et al. 1998). In several Florida spring systems, filamentous algal abundance increased with lower flow velocities and spring discharge (Hoyer et al. 2004, King 2014). Preliminary work by Cohen et al. (2015) found that flow velocity was inversely related to algal cover in the Rainbow River. The District will continue to evaluate the relationship between hydrology and filamentous algae for the Rainbow River System during the reevaluation period. Another factor contributing to the loss and damage of SAV is recreational use. Use of the river, especially during summer months, has caused damage to and loss of SAV principally from motor boat propeller damage; however, tubers and non-motorized boats also contribute to the loss of SAV (Mumma et al. 1996, Cichra and Holland 2012). The
64

impact of recreation on SAV could be related to the river stage, since higher stage would potentially reduce the frequency that boats and tubers come in contact with SAV. The District will investigate the relationship between hydrology and recreational impacts to SAV during the Rainbow River System reevaluation period.
4.3 Benthic Macroinvertebrates Benthic macroinvertebrates are an important part of the food chain and are an excellent indicator of ecosystem health (WSI and FSI 2013). Numerous Stream Condition Index (SCI) assessments, which involve the collection of benthic macroinvertebrates, were conducted by the DEP at a 100-meter reach starting about 100 meters downstream from the headsprings. From 2000 through 2007, the number of taxa collected during an SCI assessment ranged from 16 to 34, with the number of sensitive taxa ranging from one to five (DEP 2008). While there was a slight decrease in total taxa and the number of sensitive taxa over time, the results of these collections indicated optimal instream habitat and a healthy stream condition (DEP 2008, WSI and FSI 2013). Two species of native mussels have been documented in the Upper Rainbow River (Walsh and Williams 2003). They included unidentified spike mussels (Elliptio sp.) and Florida pondhorns (Uniomerus carolinianus); non-native Asian clams (Corbicula fluminea) were not observed during this survey. During a sediment survey of the Rainbow River in 2007 (GARI 2007), five native and two non-native mollusk species were collected and included, from most to least common, quilted melania (Tarebia granifera), banded mystery snail (Viviparus georgianus), unidentified spike mussel, Asian clam, Mesa rams horn (Planorbella scalaris), rams horn snail (Planorbidae), and apple snail (Pomacea sp.). In a synoptic study of the headsprings and upper portions of the Rainbow River conducted in 2008 and 2009, 21 different families of aquatic insects were documented; non-biting midges (Chironomidae) were the group most often observed (WSI 2010). A more recent benthic macroinvertebrate survey was conducted in the entire Rainbow River in 2010; 1,610 individuals were found in 20 samples collected from sand, aquatic vegetation, and woody habitats (Banning 2010). The four most common taxa collected included: amphipods (Hyalella azteca), midges (Pseudochironomus sp.), mayflies (Tricorythodes albilineatus), and snails (Elimia floridana). The survey also included collection of a midge (Manoa sp.), which was previously thought to be limited exclusively to southern Florida in North America. 4.4 Fish Intensive fish surveys are currently ongoing through a partnership between the Florida Fish and Wildlife Conservation Commission (FWC) and the District. Summer and winter surveys are conducted each year by electrofishing and seining to document relative abundance, diversity, richness, and fish species composition, as well as to quantify species associations with habitats and flows. Seven surveys have been conducted to date, and 34 species have been collected (Table 4-1). Spotted sunfish (Lepomis punctatus) have been the most common fish species collected, followed by coastal shiner (Notropis petersoni), mosquitofish (Gambusia holbrooki), largemouth bass (Micropterus salmoides) (Figure 4-5), and bluegill sunfish (Lepomis macrochirus). With the exception of one American eel (Anguilla rostrata) and two Atlantic needle fish (Strongylura marina),
65
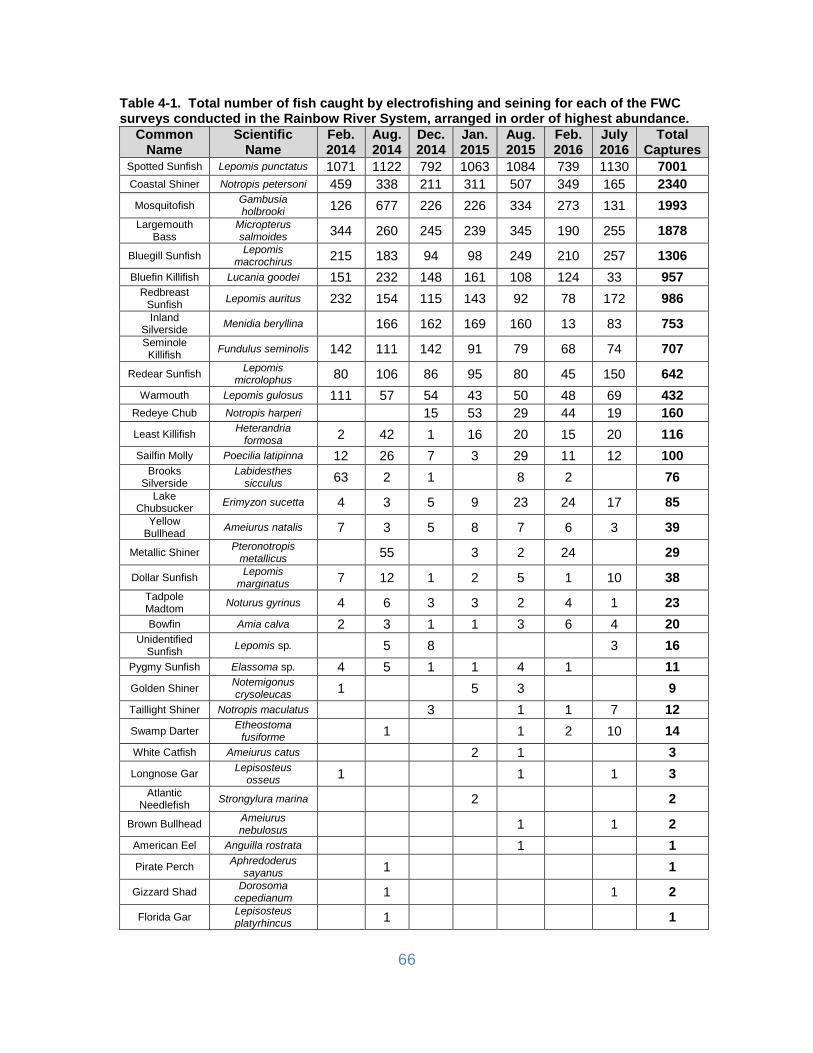
Table 4-1. Total number of fish caught by electrofishing and seining for each of the FWC surveys conducted in the Rainbow River System, arranged in order of highest abundance.
Common Name
Scientific Name
Feb. 2014
Aug. 2014
Dec. 2014
Jan. 2015
Aug. 2015
Feb. 2016
July 2016
Total Captures
Spotted Sunfish Lepomis punctatus 1071 1122 792 1063 1084 739 1130 7001 Coastal Shiner Notropis petersoni 459 338 211 311 507 349 165 2340 Mosquitofish Gambusia
holbrooki 126 677 226 226 334 273 131 1993 Largemouth
Bass Micropterus salmoides 344 260 245 239 345 190 255 1878
Bluegill Sunfish Lepomis macrochirus 215 183 94 98 249 210 257 1306
Bluefin Killifish Lucania goodei 151 232 148 161 108 124 33 957 Redbreast
Sunfish Lepomis auritus 232 154 115 143 92 78 172 986 Inland
Silverside Menidia beryllina 166 162 169 160 13 83 753 Seminole Killifish Fundulus seminolis 142 111 142 91 79 68 74 707
Redear Sunfish Lepomis microlophus 80 106 86 95 80 45 150 642
Warmouth Lepomis gulosus 111 57 54 43 50 48 69 432 Redeye Chub Notropis harperi 15 53 29 44 19 160 Least Killifish Heterandria
formosa 2 42 1 16 20 15 20 116 Sailfin Molly Poecilia latipinna 12 26 7 3 29 11 12 100
Brooks Silverside
Labidesthes sicculus 63 2 1 8 2 76
Lake Chubsucker Erimyzon sucetta 4 3 5 9 23 24 17 85
Yellow Bullhead Ameiurus natalis 7 3 5 8 7 6 3 39
Metallic Shiner Pteronotropis metallicus 55 3 2 24 29
Dollar Sunfish Lepomis marginatus 7 12 1 2 5 1 10 38
Tadpole Madtom Noturus gyrinus 4 6 3 3 2 4 1 23 Bowfin Amia calva 2 3 1 1 3 6 4 20
Unidentified Sunfish Lepomis sp. 5 8 3 16
Pygmy Sunfish Elassoma sp. 4 5 1 1 4 1 11 Golden Shiner Notemigonus
crysoleucas 1 5 3 9 Taillight Shiner Notropis maculatus 3 1 1 7 12 Swamp Darter Etheostoma
fusiforme 1 1 2 10 14 White Catfish Ameiurus catus 2 1 3 Longnose Gar Lepisosteus
osseus 1 1 1 3 Atlantic
Needlefish Strongylura marina 2 2
Brown Bullhead Ameiurus nebulosus 1 1 2
American Eel Anguilla rostrata 1 1 Pirate Perch Aphredoderus
sayanus 1 1
Gizzard Shad Dorosoma cepedianum 1 1 2
Florida Gar Lepisosteus platyrhincus 1 1
66
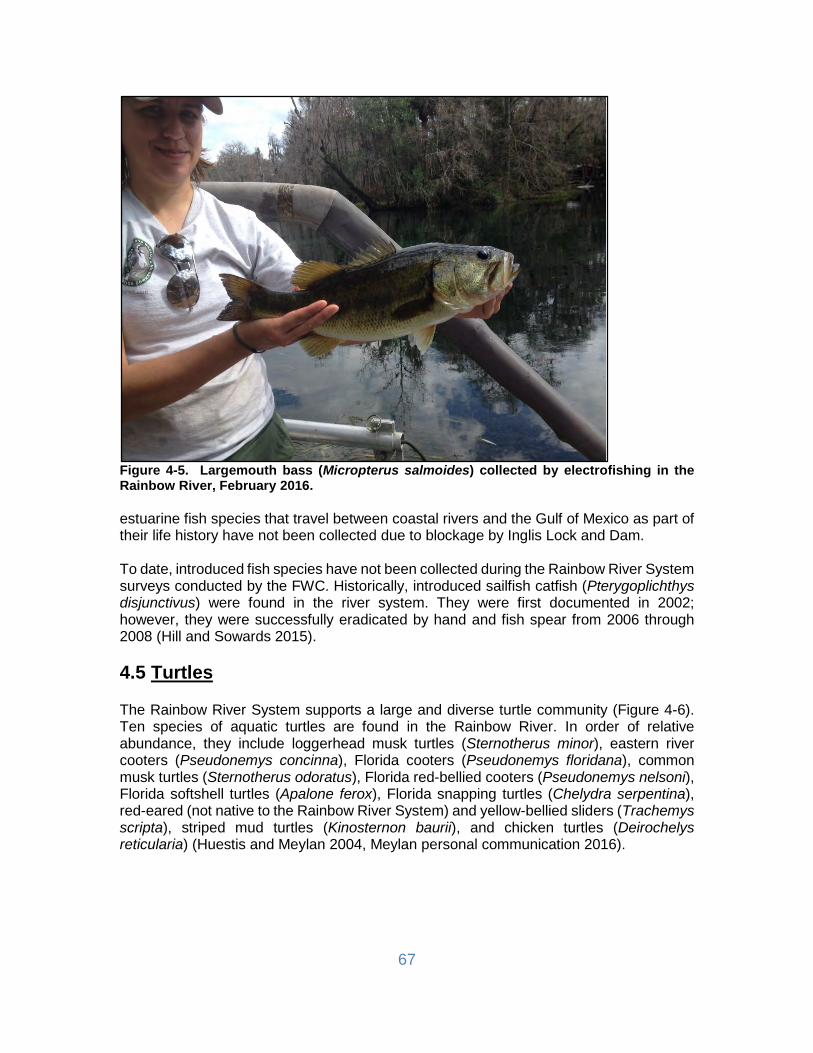
Figure 4-5. Largemouth bass (Micropterus salmoides) collected by electrofishing in the Rainbow River, February 2016. estuarine fish species that travel between coastal rivers and the Gulf of Mexico as part of their life history have not been collected due to blockage by Inglis Lock and Dam. To date, introduced fish species have not been collected during the Rainbow River System surveys conducted by the FWC. Historically, introduced sailfish catfish (Pterygoplichthys disjunctivus) were found in the river system. They were first documented in 2002; however, they were successfully eradicated by hand and fish spear from 2006 through 2008 (Hill and Sowards 2015). 4.5 Turtles The Rainbow River System supports a large and diverse turtle community (Figure 4-6). Ten species of aquatic turtles are found in the Rainbow River. In order of relative abundance, they include loggerhead musk turtles (Sternotherus minor), eastern river cooters (Pseudonemys concinna), Florida cooters (Pseudonemys floridana), common musk turtles (Sternotherus odoratus), Florida red-bellied cooters (Pseudonemys nelsoni), Florida softshell turtles (Apalone ferox), Florida snapping turtles (Chelydra serpentina), red-eared (not native to the Rainbow River System) and yellow-bellied sliders (Trachemys scripta), striped mud turtles (Kinosternon baurii), and chicken turtles (Deirochelys reticularia) (Huestis and Meylan 2004, Meylan personal communication 2016).
67

Figure 4-6. Cooters basking on the Rainbow River. A significant amount of research has been conducted on the Rainbow River System turtle community since the 1940s (Marchand 1942, Huestis and Meylan 2004). Eckerd College’s Rainbow River turtle project, led by Dr. Peter Meylan, has been active since 1990. Between 1990 and 2016, more than 8,000 captures of Rainbow River turtles by hundreds of volunteers and students from Eckerd College and many other institutions have occurred. During most years, from three to five surveys are conducted in a 1.7-km reach of the river by between seven and 30 snorkelers (Huestis and Meylan 2004, Meylan personal communication 2016). The relative abundance of turtles in the community has changed significantly over time. In the 1940s, cooters dominated the community, making up 70 percent of captures (Marchand 1942), and loggerhead musk turtles were absent (Meylan et al. 1992). Loggerhead musk turtles are common and native to spring runs in northern Florida (Zappalorti and Iverson 2006); however, they are not native to the Rainbow River System and were introduced during the 1960s (Huestis and Meylan 2004). Since 1990, the loggerhead musk turtle has been the most common turtle captured (Figure 4-7). Captures of eastern river cooters have been increasing, while common musk turtles are decreasing.
68
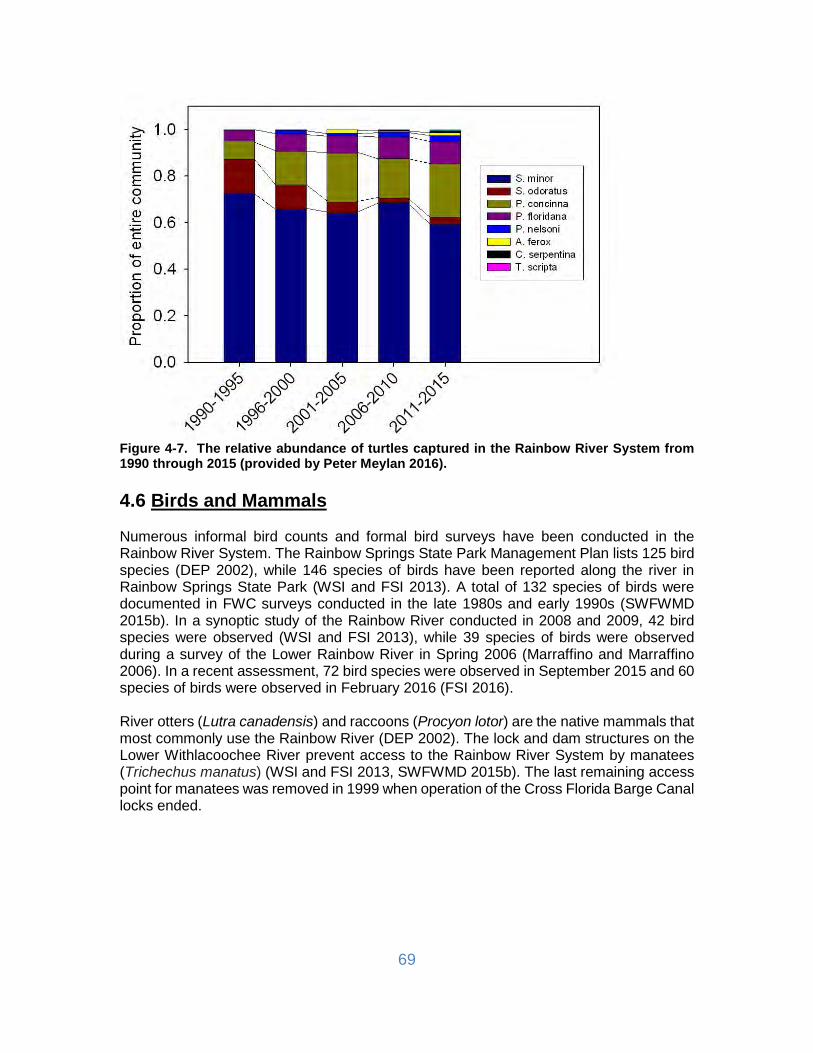
Figure 4-7. The relative abundance of turtles captured in the Rainbow River System from 1990 through 2015 (provided by Peter Meylan 2016). 4.6 Birds and Mammals Numerous informal bird counts and formal bird surveys have been conducted in the Rainbow River System. The Rainbow Springs State Park Management Plan lists 125 bird species (DEP 2002), while 146 species of birds have been reported along the river in Rainbow Springs State Park (WSI and FSI 2013). A total of 132 species of birds were documented in FWC surveys conducted in the late 1980s and early 1990s (SWFWMD 2015b). In a synoptic study of the Rainbow River conducted in 2008 and 2009, 42 bird species were observed (WSI and FSI 2013), while 39 species of birds were observed during a survey of the Lower Rainbow River in Spring 2006 (Marraffino and Marraffino 2006). In a recent assessment, 72 bird species were observed in September 2015 and 60 species of birds were observed in February 2016 (FSI 2016). River otters (Lutra canadensis) and raccoons (Procyon lotor) are the native mammals that most commonly use the Rainbow River (DEP 2002). The lock and dam structures on the Lower Withlacoochee River prevent access to the Rainbow River System by manatees (Trichechus manatus) (WSI and FSI 2013, SWFWMD 2015b). The last remaining access point for manatees was removed in 1999 when operation of the Cross Florida Barge Canal locks ended.
69

CHAPTER 5 – ENVIROMENTAL VALUES THAT MUST BE CONSIDERED WHEN DEVELOPING THE MINIMUM FLOW FOR THE RAINBOW RIVER SYSTEM When establishing MFLs, consideration must be given to the protection of ten environmental values identified in the State Water Resource Implementation Rule:
• Recreation in and on the water • Fish and wildlife habitats and the passage of fish • Estuarine resources • Transfer of detrital material • Maintenance of freshwater storage and supply • Aesthetic and scenic attributes • Filtration and absorption of nutrients and other pollutants • Sediment loads • Water quality • Navigation
Details regarding the environmental values that were considered in the development of the minimum flow for the Rainbow River System are summarized in this chapter, while specific minimum flows development methodologies used to evaluate relevant environmental values are described in Chapter 6. An environmental values evaluation, which is included in Appendix H, was conducted in 2009. Because an early long-term flow record (1965 through June 2008) and an early version of the HEC-RAS model was used for the 2009 evaluation, the results of the earlier evaluation are not comparable to those included in this report. However, the earlier environmental values evaluation contains useful information, some of which is included in this chapter. 5.1 Recreation in and on the Water The Rainbow River System has recreational significance, and this environmental value is considered relevant to development of the minimum flow. The primary recreational activities in the Rainbow River System include motor boating, tubing, swimming, canoeing, kayaking, snorkeling, fishing, and scuba diving (Cichra and Holland 2012). From May 2011 through May 2012, the estimated annual total use was as follows: about 5,500 canoes, about 11,000 kayaks, about 6,600 motorboats, about 9,000 swimmers/divers, about 1,000 scuba boats, and about 84,000 tubers (Cichra and Holland 2012); comparing these estimates with annual estimates calculated in 1994 indicated a significant increase in 17 years: a 400 percent increase in the number of tuber trips, an approximate 230 percent increase in the number of motorboat trips, and about a 1,500 percent increase in the number of canoe/kayak trips. Recreational use does have a seasonal component, with higher levels of use during warm weather. For example, in a recent assessment, in-water activities in September 2015 averaged 1.2 people/acre during the weekday and 17 people/acre during the weekend, with tubing, canoeing/kayaking, and motor boating being the most common activities (FSI 2016). In February 2016, in-water activities averaged less than 1 person/acres during the weekdays and 2.4 people/acre during the weekend; the most common activities were
70

motor boating and canoeing/kayaking (FSI 2016). Current recreational use in the Rainbow River System will most likely continue to increase.
5.2 Fish and Wildlife Habitats and the Passage of Fish Fish and wildlife habitats include the aquatic and wetland environments required by fish and wildlife, including common, rare, listed, endemic, recreationally or commercially important, or keystone species to reproduce, live, grow, and migrate (HSW 2009). This environmental value is relevant to the development of the minimum flow for the Rainbow River System since it supports a wide variety of flora and fauna. The methods used by the District to develop minimum flows, which are described in the following chapter, are habitat based, since flowing systems include a wide variety of aquatic and wetland habitats that support a diversity of biological communities and provide numerous ecosystem services. These habitat-based methods consider the fish and wildlife habitats and the passage of fish environmental value and ensure that minimum water depths are maintained in the river channel for fish passage; water depths are maintained above inflection points in the wetted perimeter of the river channel to maximize aquatic habitat for fish and wildlife with the least amount of flow; in-channel habitat for selected fish and macroinvertebrate assemblages and taxonomic groups is protected; woody habitats in the river channel, including snags and exposed roots, for fish, invertebrates, and wildlife are inundated; and seasonal hydrologic connections between the river channel and floodplain wetlands are maintained to ensure availability of inundated wetlands habitat and persistence of the floodplain structure and function.
5.3 Estuarine Resources The Rainbow River flows into the Withlacoochee River. While the Withlacoochee River flows into the Gulf of Mexico, the Rainbow River is located upstream of the impounded section of the river known as Lake Rousseau, which was created by the construction of Inglis Dam in 1909 (Downing et al. 1989). Inglis Lock, located adjacent to the dam, was constructed in 1969 as part of the former CFBC by the USACOE. The dam provides a physical barrier to upstream movement by the West Indian manatee, as well as a significant barrier isolating the Rainbow River System from estuarine resources. Therefore, this environmental value was not considered relevant for development of the minimum flow for the Rainbow River System.
5.4 Transfer of Detrital Material Detritus refers to organic particles consisting of microbially altered vegetation, including leaves and wood, and decomposing organisms (HSW 2009). These organic particles provide high-quality food for instream biota. The source of the detritus found in clear quartz sand mixed with woody detritus, one of the most common types of sediment in the Rainbow River System, is the adjacent floodplain swamps, seasonal floodplain inundation, and overhanging vegetation (Ellis et al. 2007).
71

The transfer of detrital material is an environmental value considered relevant to the minimum flows analysis. The habitat-based methods used by the District to develop the minimum flow for the Rainbow River System ensure that the seasonal hydrologic connections between the river channel and floodplain are maintained to ensure persistence of this important floodplain wetlands function. 5.5 Maintenance of Freshwater Storage and Supply Consideration of this environmental value for the development of minimum flow recommendation was based on the evaluation of the effects of existing and permitted water use that affect flows in the Rainbow River System. The protection of an adequate amount of freshwater for non-consumptive uses and environmental values associated with coastal, estuarine, riverine, spring, aquatic, and wetlands ecology is also considered. In addition, this environmental value is protected through implementation of the District’s Water Use Permitting Program based on the inclusion of permit conditions that stipulate permitted withdrawals will not lead to violation of adopted MFLs, as well as the cumulative impact analysis that occurs for new permits or increased allocations for existing permits. The maintenance of freshwater storage and supply is addressed by the minimum flow recommended in this report, which is protective of all relevant environmental values.
5.6 Aesthetic and Scenic Attributes Optimal scenic viewing, a pleasing visual setting, and wildlife viewing can be defined as aesthetic and scenic attributes of the Rainbow River System (HSW 2009). The Rainbow River is a designated OFW due to its exceptional aesthetic and scenic beauty, as well as other factors; therefore, this environmental value is relevant to Rainbow River System minimum flows development. The habitat-based methods described in the next chapter that directly consider other environmental values, such as recreation in and on the water and fish and wildlife habitats and the passage of fish, also indirectly ensure that the aesthetic and scenic attributes of the Rainbow River System are maintained by the minimum flow recommended in this report.
5.7 Filtration and Absorption of Nutrients and Other Pollutants Filtration consists of physical, chemical, and biological processes that occur as water flows through media, such as soil and sediment, and absorption is a chemical process that occurs through filtration (HSW 2009). These processes occur within the water column through contact with SAV and in riparian zones where vegetation, sediments, and soils exist. The filtration and absorption of nutrients and other pollutants is an environmental value that is relevant and is addressed because the District’s methods for developing the minimum flow for the Rainbow River System are habitat based. For example, if connectivity between the river and floodplain wetlands and instream and floodplain habitats are protected, it can be inferred that the processes of filtration and absorption in wetland soils, sediments, vegetative communities,
72

littoral vegetation, bottom sediments, and water column organisms are protected as well.
5.8 Sediment Loads The Rainbow River is dominated by well to moderately well sorted medium to fine sand (Ellis et al. 2007). The movement, or transport, of sediment is a function of flow condition, sediment material composition, and supply (HSW 2009). Because the flows of the Rainbow River are consistently swift, the sediment bed is mobilized, and sand is transported. Sediment loads or the amount of sediment transported are protected under the minimum flow proposed in this report.
5.9 Water Quality Water quality criteria are designed to protect a water body’s designated use. The Rainbow River’s OFW designation is part of Florida’s anti-degradation policy. This policy is designed to prevent worsening of water quality from specified activities unless it is found to be in the public interest and does not apply to water quantity decisions, such as minimum flows establishment. The minimum flow for the Rainbow River System recommended in this report is not expected to negatively affect water quality in the Rainbow River or impair the water body’s designated use. As noted in Chapter 3, nitrate levels in the Rainbow River System have risen significantly since the 1960s due to urban and agricultural land uses in its springshed. Because of this, the Rainbow River was placed on the verified list of impaired waters by the DEP in 2010, a TMDL was developed, and a BMAP was developed and is being implemented (Holland and Hicks 2013). The increase in nitrogen is hypothesized to be the primary source of the imbalance of algae that has been noted in the Rainbow River System and is implicated as a cause of impairment (Holland and Hicks 2013). However, as mentioned in Section 4.2, other water quality constituents may also contribute to increased algal coverage, and research in the Rainbow River System is ongoing to determine their effect on the growth of algae. Despite the increasing nitrate levels, water clarity has not decreased in the river over time. In addition, the analyses of available data presented in Section 3.4 demonstrate the lack of a strong relationship between chlorophyll and residence time in the Rainbow River System, likely due to short residence times that limit phytoplankton abundance. Based on the analyses of available data presented in Section 3.3, overall, springflow has not affected the increasing nitrate levels in the Rainbow River System. In addition, decreased spring flow associated with additional water withdrawals was shown not to affect nitrogen levels and water clarity in the earlier evaluation of environmental values associated with the system (HSW 2009). The District will continue to study how flow and water quality are related, as well as the effects of flow on the components, processes, and functions of the Rainbow River System; some of the projects related to these issues are listed in Section 8.1.
73

5.10 Navigation Commercial boats that use the Rainbow River System typically include tour boats and boats carrying scuba divers and snorkelers. These pontoon boats and other commercial vessels were included in the consideration of the recreation in and on the water environmental value discussed in Section 5.1 when developing the minimum flow recommended in this report.
74

CHAPTER 6 – RAINBOW RIVER SYSTEM MINIMUM FLOW DEVELOPMENT METHODOLOGIES The District uses multiple methods to develop minimum flows for flowing systems. The methods used are habitat-based, are system specific, and evaluate the environmental values considered relevant for the particular system under study. For the Rainbow River System, the District considered the following criteria that are associated with the protection of several of the environmental values described in the previous chapter.
• Establishment of a low-flow threshold based on flows for fish passage and maintenance of water depths above lowest wetted perimeter inflection point (e.g., maintaining the maximum amount of instream habitat quantity with the lowest rate of flow). This criterion is associated with recreation in and on the water, the maintenance of fish passage, fish and wildlife habitats, and navigation.
• Protection of instream habitat for selected functional and taxonomic groups of fish and benthic macroinvertebrates. This criterion is associated with fish and wildlife habitats, transfer of detrital material, aesthetic and scenic attributes, filtration and absorption of nutrients and other pollutants, and sediment loads.
• Inundation of instream woody habitats, including snags and exposed roots, in the stream channel. This criterion is associated with recreation in and on the water, fish and wildlife habitats, transfer of detrital material, aesthetic and scenic attributes, filtration and absorption of nutrients and other pollutants, and sediment loads.
• Maintenance of seasonal hydrologic connections between the river channel and floodplain wetlands to ensure availability of inundated wetlands habitat and persistence of floodplain structure and function. This criterion is associated with recreation in and on the water, fish and wildlife habitats and the passage of fish, transfer of detrital material, aesthetic and scenic attributes, filtration and absorption of nutrients and other pollutants, sediment loads, and water quality.
A variety of modeling approaches and field studies were used to quantify these criteria and develop minimum flow recommendations for the Rainbow River System. The methods used to quantify the criteria listed above are described in the following sections. 6.1 Rainbow River System Long-Term Flow Record The flow record for the Rainbow River at Dunnellon, FL Gage from 1965 through 2015 was used to develop the recommended minimum flow. The gaged flow record was adjusted for groundwater withdrawal impacts from 1965-2015 by accounting for withdrawal-associated flow reductions to the gaged record. Withdrawal-associated flow corrections that were applied to the gaged record on a daily basis were derived using 1.1 percent and 1.7 percent flow reduction estimates for 1995 and 2010 pumping conditions, respectively, using Version 4.0 of the NDM (Version 5.0 of the NDM was not available when the analyses were conducted). Daily gaged flows were adjusted using a linearly-interpolated percentage increases from 0 to 1.1 percent for the period from 1965 through
75
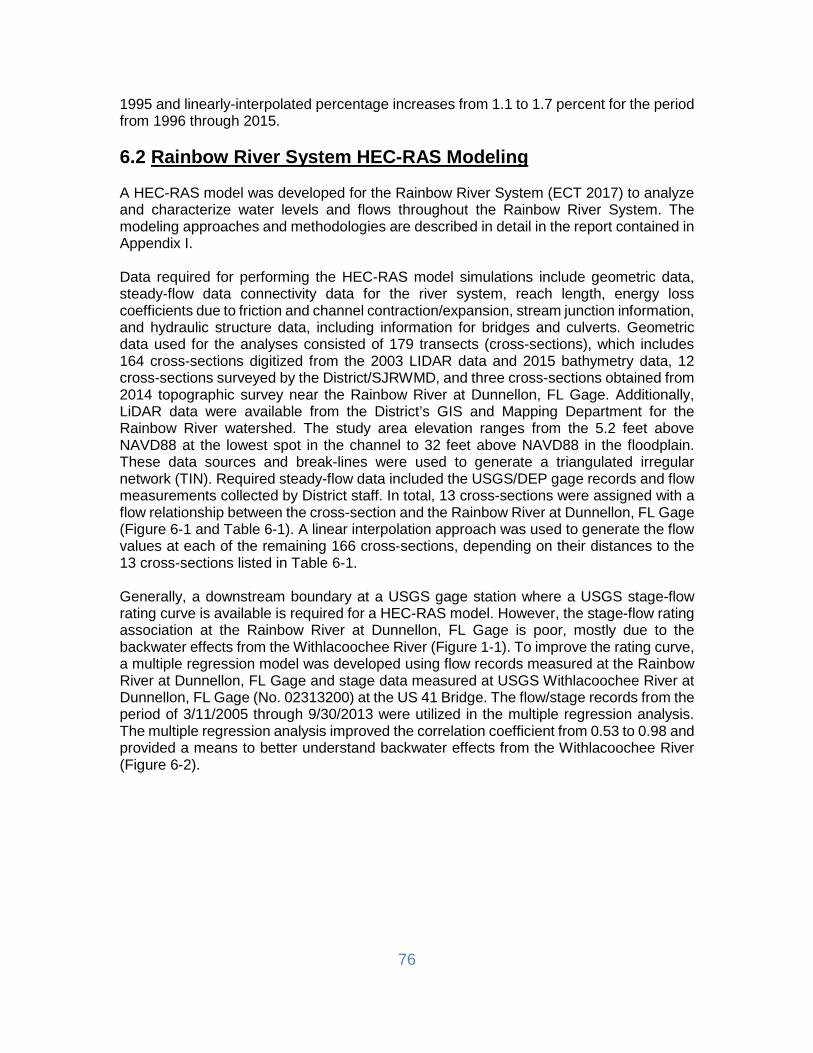
1995 and linearly-interpolated percentage increases from 1.1 to 1.7 percent for the period from 1996 through 2015. 6.2 Rainbow River System HEC-RAS Modeling A HEC-RAS model was developed for the Rainbow River System (ECT 2017) to analyze and characterize water levels and flows throughout the Rainbow River System. The modeling approaches and methodologies are described in detail in the report contained in Appendix I. Data required for performing the HEC-RAS model simulations include geometric data, steady-flow data connectivity data for the river system, reach length, energy loss coefficients due to friction and channel contraction/expansion, stream junction information, and hydraulic structure data, including information for bridges and culverts. Geometric data used for the analyses consisted of 179 transects (cross-sections), which includes 164 cross-sections digitized from the 2003 LIDAR data and 2015 bathymetry data, 12 cross-sections surveyed by the District/SJRWMD, and three cross-sections obtained from 2014 topographic survey near the Rainbow River at Dunnellon, FL Gage. Additionally, LiDAR data were available from the District’s GIS and Mapping Department for the Rainbow River watershed. The study area elevation ranges from the 5.2 feet above NAVD88 at the lowest spot in the channel to 32 feet above NAVD88 in the floodplain. These data sources and break-lines were used to generate a triangulated irregular network (TIN). Required steady-flow data included the USGS/DEP gage records and flow measurements collected by District staff. In total, 13 cross-sections were assigned with a flow relationship between the cross-section and the Rainbow River at Dunnellon, FL Gage (Figure 6-1 and Table 6-1). A linear interpolation approach was used to generate the flow values at each of the remaining 166 cross-sections, depending on their distances to the 13 cross-sections listed in Table 6-1. Generally, a downstream boundary at a USGS gage station where a USGS stage-flow rating curve is available is required for a HEC-RAS model. However, the stage-flow rating association at the Rainbow River at Dunnellon, FL Gage is poor, mostly due to the backwater effects from the Withlacoochee River (Figure 1-1). To improve the rating curve, a multiple regression model was developed using flow records measured at the Rainbow River at Dunnellon, FL Gage and stage data measured at USGS Withlacoochee River at Dunnellon, FL Gage (No. 02313200) at the US 41 Bridge. The flow/stage records from the period of 3/11/2005 through 9/30/2013 were utilized in the multiple regression analysis. The multiple regression analysis improved the correlation coefficient from 0.53 to 0.98 and provided a means to better understand backwater effects from the Withlacoochee River (Figure 6-2).
76

Figure 6-1. Map of the USGS gages, river centerline, and cross-section cutlines of the Rainbow River used for the HEC-RAS model (Figure 2-1 from ECT 2017).
77
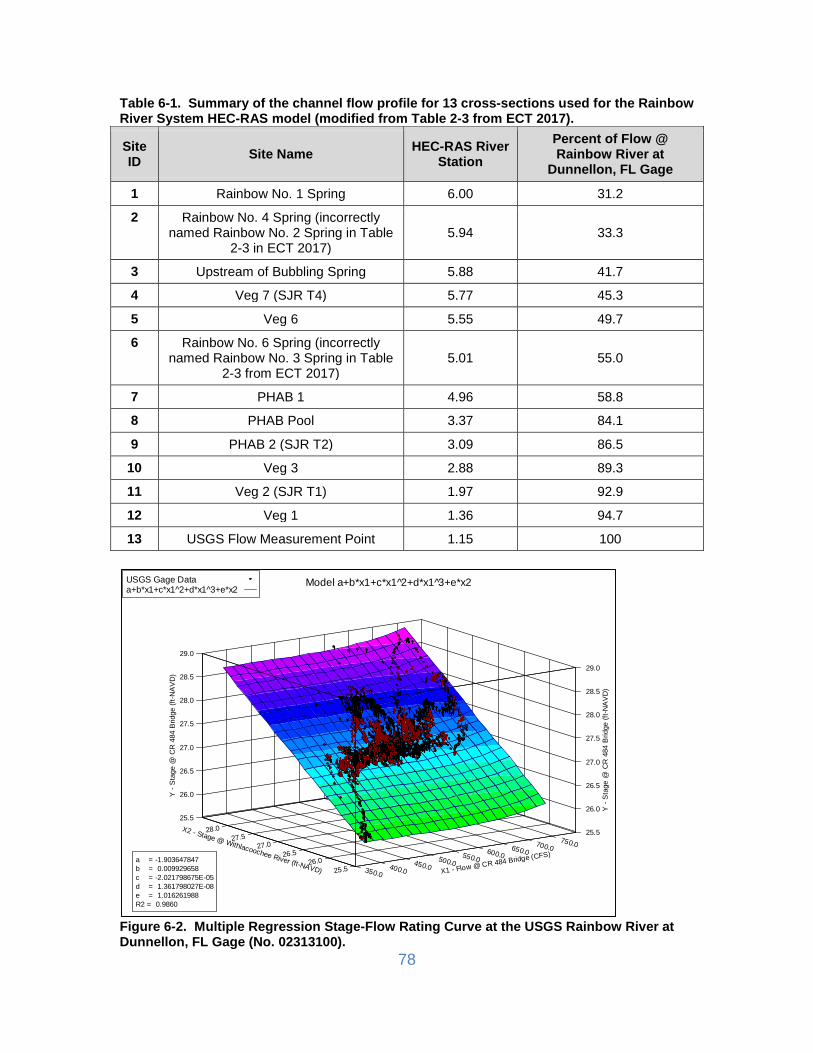
Table 6-1. Summary of the channel flow profile for 13 cross-sections used for the Rainbow River System HEC-RAS model (modified from Table 2-3 from ECT 2017).
Site ID Site Name HEC-RAS River
Station Percent of Flow @ Rainbow River at
Dunnellon, FL Gage
1 Rainbow No. 1 Spring 6.00 31.2
2 Rainbow No. 4 Spring (incorrectly named Rainbow No. 2 Spring in Table
2-3 in ECT 2017) 5.94 33.3
3 Upstream of Bubbling Spring 5.88 41.7
4 Veg 7 (SJR T4) 5.77 45.3
5 Veg 6 5.55 49.7
6 Rainbow No. 6 Spring (incorrectly named Rainbow No. 3 Spring in Table
2-3 from ECT 2017) 5.01 55.0
7 PHAB 1 4.96 58.8
8 PHAB Pool 3.37 84.1
9 PHAB 2 (SJR T2) 3.09 86.5
10 Veg 3 2.88 89.3
11 Veg 2 (SJR T1) 1.97 92.9
12 Veg 1 1.36 94.7
13 USGS Flow Measurement Point 1.15 100
Figure 6-2. Multiple Regression Stage-Flow Rating Curve at the USGS Rainbow River at Dunnellon, FL Gage (No. 02313100).
Model a+b*x1+c*x1 2̂+d*x1 3̂+e*x2
Y -
Sta
ge @
CR
484
Brid
ge (f
t-NA
VD
)
Y -
Sta
ge @
CR
484
Brid
ge (f
t-NA
VD
)
X2 - Stage @ Withlacoochee River (ft-NAVD) X1 - Flow @ CR 484 Bridge (CFS)
25.526.0
26.527.0
27.528.0
750.0700.0650.0600.0550.0500.0450.0400.0350.0
25.5
26.0
26.5
27.0
27.5
28.0
28.5
29.0
25.5
26.0
26.5
27.0
27.5
28.0
28.5
29.0
USGS Gage Dataa+b*x1+c*x1^2+d*x1^3+e*x2
a = -1.903647847b = 0.009929658c = -2.021798675E-05d = 1.361798027E-08e = 1.016261988R2 = 0.9860
78

A flow hydrograph boundary condition was also required at the upstream end of the river. Since no long-term flow data are available at the head springs, a flow hydrograph boundary condition was developed using the channel flow profile analysis results presented in Table 6-1. Since stage records at Withlacoochee River at Dunnellon, FL Gage were missing for Water Year (WY) 2014, this data gap was filled using the multiple regression stage-flow rating curve. To improve model accuracy, the HEC-RAS model was run for unsteady flow analysis using ten years of data from March 2005 to March 2015. Data collected at various gage stations and vegetation transect sites along the river (Figure 6-1) were used for model calibration or validation purposes. One DEP staff gage, four SJRWMD vegetation transect sites, and three District vegetation transect sites were used to calibrate the dynamic HEC-RAS model. The model calibration results are provided in Table 6-2. The HEC-RAS model was considered well calibrated when calculated water surface elevations were within plus or minus 0.5 foot, in keeping with standard USGS practices where this range of error is based on the potential error associated with using data collected to a one-foot contour interval aerial mapping standard for model development (Lewelling 2004). The model was able to capture the hydrologic response to all flow conditions with stage residuals being less than 0.5 foot. Over 97 percent of the stage residuals fell within a range of plus or minus 0.25 foot; the majority of the stage residuals fell within plus or minus 0.1 foot at seven of the eight river sites. Model validation was conducted using stage data collected by the USGS at the head springs and by the District at eleven vegetation transects (Figure 6-1). Review of the model verification results indicated that most of the stage residuals fell within a range of plus or minus 0.5 foot.
6.2.1 Withlacoochee River Backwater Effect Figures 6-3 illustrates the influence of the backwater effect at Sites Veg 1 and PHAB 1, respectively, 1.36 and 4.96 miles upstream of the Rainbow River’s confluence with the Withlacoochee River. The stage-flow rating curves at Site Veg 1 suggest that the stage in the Withlacoochee River is the major factor controlling the water surface elevations at the site. The stage-flow rating curves for upstream Site PHAB 1, however, indicate a much smaller backwater effect compared to the downstream river Site Veg 1. Flow in the Rainbow River appears to be the predominant factor controlling the surface water elevations at Site PHAB1. Similar stage-flow rating curves were developed for all HEC-RAS cross-sections to assess the influence of backwater on water surface elevations. The stage versus flow and wetted perimeter versus flow relationships for each cross-section were used to determine low-flow thresholds, inundation characteristics of woody instream habitats, and floodplain vegetation cross-sections. These relationships were also used as input into the PHABSIM and HEC-GeoRAS models to determine the weighted usable areas (WUAs) or available habitat for various groups of fish and benthic macroinvertebrates and inundation areas, respectively.
79

Table 6-2. Summary of Rainbow River System HEC-RAS model calibration results (Table 3-5 from ECT 2017).
Station ID Site Name
River Station in HEC-RAS
Stage Difference
Range (feet)
Percent of Stage
Residuals within 0.1 feet
Percent of Stage
Residuals within 0.15 feet
Percent of Stage
Residuals within 0.2 feet
Percent of Stage
Residuals within 0.25 feet
Percent of Stage
Residuals within 0.5 feet
1 Rainbow River at Spring Head
6.00 0.2 to -0.3 44.7 76.5 95.9 98.1 100
2 Veg 7/SJR T4 (2010-2011)
5.77 0.1 to -0.2 62.7 92.3 99.8 100 100
3 SJR T3 4.31 0.1 to -0.2 86.4 99.8 100 100 100 4 PHAB 2/SJR
T2 (2010-2011)
3.09 0.1 to -0.2 99.7 99.7 100 100 100
5 Veg 2/SJR T1 1.97 0.1 to -0.1 98.7 100 100 100 100
6 Veg 7/SJR T4 (2014-2015)
5.77 0.1 to -0.1 75.7 100 100 100 100
7 PHAB 2/SJR T2 (2014-
2015)
3.09 0.3 to -0.3 64.3 80.1 94.9 97.6 100
8 Veg 1 1.36 0.1 to -0.2 98.6 99.3 99.3 100 100
80

Figure 6-3. Stage-flow rating curves at Site Veg 1 (River Station 1.36) and Site PHAB 1 (River Station 4.96) using the HEC-RAS model steady state flow scenarios for the Rainbow River (Figures 4-9 and 4-10 from ECT 2017). See Figure 6-1 for site locations.
6.2.2 HEC-RAS Model Scenarios The calibrated and validated HEC-RAS model was then run for 15 steady flow-stage scenarios to determine stage versus flow and wetted perimeter versus flow relationships for each surveyed cross-section. These scenarios range from the one percent to 99 percent exceedances and were formulated through flow-duration analysis of the flow data at the Rainbow River at Dunnellon, FL Gage and stage data at the Withlacoochee River at Dunnellon, FL Gage from 1/1/1965 to 12/31/2010. A total of 225 stage versus flow values were estimated at each surveyed cross-section, and Table 6-3 shows the values at the Rainbow River at Dunnellon, FL Gage.
81

Table 6-3. Stage values estimated at the Rainbow River at Dunnellon, FL Gage (No. 02313100) for 15 Rainbow River System HEC-RAS model steady flow-stage scenarios. Flow scenarios (F1 through F15) correspond with flow at the Rainbow River at Dunnellon, FL Gage; stage scenarios (S1 through S15) are associated with stage at the Withlacoochee River at Dunnellon, FL Gage (No. 023213200) (Table 4-4 from ECT 2017).
ID
Flow Percent
Flow @ USGS Gage (cfs)
Stage Values (feet NAVD 88) for 15 Flow-Stage Scenarios (percent exceedance) S1 S2 S3 S4 S5 S6 S7 S8 S9 S10 S11 S12 S13 S14 S15 1 1.25 1.5 1.75 2 3 5 10 25 50 75 85 90 95 99
25.09 25.98 26.18 26.31 26.37 26.6 26.72 26.8 26.92 27.07 27.3 27.49 27.6 27.82 28.36
F1 1 507.41 25.20 26.11 26.31 26.44 26.51 26.74 26.86 26.94 27.07 27.22 27.45 27.64 27.76 27.98 28.53
F2 2 522.81 25.20 26.11 26.31 26.44 26.51 26.74 26.86 26.94 27.07 27.22 27.45 27.64 27.76 27.98 28.53
F3 5 547.79 25.20 26.11 26.31 26.44 26.51 26.74 26.86 26.94 27.07 27.22 27.45 27.64 27.76 27.98 28.53
F4 10 567.61 25.20 26.11 26.31 26.45 26.51 26.74 26.86 26.94 27.07 27.22 27.45 27.65 27.76 27.98 28.53
F5 15 581.18 25.21 26.11 26.32 26.45 26.51 26.74 26.87 26.95 27.07 27.22 27.46 27.65 27.76 27.98 28.54
F6 20 594.54 25.21 26.12 26.32 26.45 26.51 26.75 26.87 26.95 27.07 27.23 27.46 27.65 27.76 27.99 28.54
F7 30 622.84 25.22 26.13 26.33 26.46 26.53 26.76 26.88 26.96 27.09 27.24 27.47 27.67 27.78 28.00 28.55
F8 40 646.74 25.24 26.15 26.35 26.48 26.54 26.78 26.90 26.98 27.10 27.26 27.49 27.68 27.79 28.02 28.57
F9 50 674.90 25.27 26.18 26.38 26.51 26.57 26.81 26.93 27.01 27.13 27.29 27.52 27.71 27.82 28.05 28.60
F10 60 700.71 25.31 26.21 26.42 26.55 26.61 26.85 26.97 27.05 27.17 27.32 27.56 27.75 27.86 28.08 28.64
F11 70 735.18 25.38 26.28 26.49 26.62 26.68 26.91 27.03 27.12 27.24 27.39 27.62 27.82 27.93 28.15 28.70
F12 80 785.85 25.53 26.43 26.63 26.76 26.82 27.06 27.18 27.26 27.38 27.53 27.77 27.96 28.07 28.30 28.85
F13 90 853.04 25.81 26.71 26.91 27.04 27.11 27.34 27.46 27.54 27.67 27.82 28.05 28.24 28.36 28.58 29.13
F14 95 896.94 26.07 26.97 27.17 27.30 27.36 27.60 27.72 27.80 27.92 28.07 28.31 28.50 28.61 28.84 29.39
F15 99 993.00 26.85 27.76 27.96 28.09 28.15 28.39 28.51 28.59 28.71 28.86 29.10 29.29 29.40 29.63 30.18
82

6.2.3 HEC-RAS Modeling Sources of Uncertainty The Rainbow River System HEC-RAS model was well calibrated and validated using long-term, dynamic flow analyses and further verified using a steady-state flow analysis and represents the best information available. The model calibration results indicated that over 97 percent of the stage residuals between the simulated water elevations and the calibration targets fall within plus or minus 0.25 foot. Nevertheless, like any model, the HEC-RAS model is subject to uncertainties associated with model inputs, assumptions, parametrizations, and interpolations. Some of the sources of uncertainty associated with the Rainbow River System HEC-RAS modeling are summarized below (ECT 2017).
• Limited flow measurements at various springs and transects were used to develop the channel flow profiles;
• Short-term stage measurements at various river sites were not well verified by a professional surveyor;
• Limited bathymetric survey data in the vicinity of the rocky shoal near RS 3.10 were available;
• Dense vegetation conditions were observed in the river bed, most likely due to prolonged low-flows conditions (e.g., during WYs 2011 and 2012). Manning’s n values were not, however, adjusted to reflect vegetation due to limited availability of vegetative survey data;
• Potential groundwater inflow reduction associated with vegetative damming resulting from dense vegetation was possible;
• In the dynamic flow analysis, gravity wave propagation along the river reach was not considered (e.g., time-variant percentage values were not used in the development of the flow boundary conditions in the HEC-RAS model); and
• Simple linear regression curves developed by the USGS were used to estimate the flow in the Rainbow River at the Rainbow River at Dunnellon, FL Gage, based on the well levels measured at a nearby groundwater site. The uncertainty of flow measurements and regression curve development may have led to less certain model calibration results for some time periods.
6.3 Minimum Low-Flow Threshold Evaluation Protection of aquatic resources associated with low flows is an important component of the establishment and implementation of minimum flows. To accomplish this goal, a minimum low-flow threshold is developed for river systems that exhibit sensitivity to impacts at very low rates of flow. The threshold identifies flows that are to be protected in their entirety (e.g., flows that are not available for consumptive use). Two criteria are used by the District to develop the low-flow threshold. One is based on maintaining fish passage along the river corridor; the other is evaluating the relation between the quantity of stream habitat and the rate of flow or maximizing wetted perimeter for the least amount of flow. The minimum low-flow threshold is established at the higher of the two low-flow criteria, provided that comparison of that criterion with flow records indicates that the criterion is reasonable.
83

6.3.1 Evaluation of Fish Passage Ensuring sufficient flows for the passage or movement of fish is an important component of the development of minimum flows. Maintenance of these flows is expected to promote continuous flow within the channel or river segment, allow for recreational navigation (e.g., canoeing), improve aesthetics, and avoid or lessen potential negative effects associated with pool isolation (e.g., high water temperatures, low dissolved oxygen concentrations, localized phytoplankton blooms, and increased predatory pressure resulting from loss of habitat/cover) (Tharme and King 1998). For development of minimum flows, maintaining longitudinal connectivity along a river corridor is the goal, to the extent that this connectivity has historically occurred. To ensure the benefits associated with connectivity and sustained low flows, a 0.6-foot fish-passage criterion was used for consideration of a minimum low-flow threshold for the Rainbow River System. This fish-passage criterion has been used by the District for the development of minimum flows for many river and spring run systems and has been accepted by numerous peer review panels. Flowing systems for which minimum flows have been adopted that include a low-flow threshold based on maintaining fish passage include the Upper Alafia, Upper Anclote, Upper Braden, Upper Hillsborough, Upper Myakka, Upper and Middle Peace, and Gum Slough Spring Run. Flows necessary for fish passage at each HEC-RAS cross-section were identified using output from multiple runs of the HEC-RAS model. The flows were determined by adding the 0.6-foot depth fish-passage criterion to the elevation of the lowest spot in the channel cross-section and determining the flow necessary to achieve the resulting elevations. Linear interpolation between modeled flows was used to determine the flows required to meet fish-passage criteria at the cross-sections. 6.3.2 Evaluation of Wetted Perimeter/Instream Habitat Quantity A useful technique for evaluating the relation between the quantity of stream habitat and the rate of flow is an evaluation of the “wetted perimeter.” Wetted perimeter is defined as the distance along the stream bed and banks at a cross-section where there is contact with water. According to Annear and Conder (1984), wetted perimeter methods for evaluating streamflow requirements assume that there is a direct relationship between wetted perimeter and fish habitat. Studies on streams in the Southeast United States have demonstrated that the greatest amount of macroinvertebrate biomass per unit reach of stream occurs on the stream bottom (Benke et al. 1985). Although production on a unit area basis may be greater on snag and root habitats, the greater area of stream bottom along a reach makes it the most productive habitat under low-flows conditions. By plotting the response of wetted perimeter to incremental changes in flow, an inflection can be identified in the resulting curve where small decreases in flow result in increasingly greater decreases in wetted perimeter. This point on the curve, known as the wetted perimeter inflection point, represents a flow at which the water surface recedes from stream banks and fish habitat is lost at an accelerated rate. The wetted perimeter approach is a technique for using “the break” or inflection point in the stream’s wetted perimeter versus discharge relation as a surrogate for minimally acceptable habitat (Stalnaker et al. 1995). When this approach is applied to riffle or shoal areas, the assumption is that the minimum flow satisfies the needs for food production, fish passage, and spawning.
84

The wetted perimeter approach is an important technique for evaluating minimum flows near the low end of the flow regime. The wetted perimeter inflection point in the channel provides for large increases in bottom habitat for relatively small increases of flow. This point is defined as the lowest wetted perimeter inflection point or LWPIP. It is not assumed that flows associated with the LWPIP meet fish passage needs or address environmental functions associated with other wetted perimeter inflection points outside the river channel. However, identification of the LWPIP permits evaluation of flows that provide the greatest amount of inundated bottom habitat in the river channel on a per-unit flow basis. Output from multiple runs of the HEC-RAS model was used to generate a wetted perimeter versus flow plot for each HEC-RAS cross-section of the Rainbow River (Figure 6-4). Plots were visually examined to identify a LWPIP for each cross-section. Higher inflection points were disregarded since the goal was to identify the LWPIP for flows contained within the stream channel. Most cross-section plots displayed no apparent inflection points that occurred relatively low in the channel. For cross-sections that displayed no distinct break (e.g., Figure 6-4) or where the majority of the wetted perimeter was inundated below the lowest modeled flow, the LWPIP was established at the lowest modeled flow.
Figure 6-4. Example of wetted perimeter versus flow plot calculated using the HEC-RAS model.
6.4 Evaluation of Instream Habitat for Fish and Macroinvertebrates Using the Physical Habitat Simulation Model Maintenance of flows greater than those required for fish passage and maximization of wetted perimeter are needed to provide aquatic biota with sufficient resources for persistence within a river segment. Feeding, reproductive, and cover requirements of instream, aquatic species have evolved in response to natural flow regimes, and these life
200
250
300
350
400
450
500
550
600
300 400 500 600 700 800
Wet
ted
Perim
eter
(fee
t)
Flow (cfs)
Wetted Perimeter vs. Flow HEC-RAS River Station 4.31
85

history requirements were used as one approach for developing a minimum flow for the Rainbow River System. PHABSIM modeling, a widely used and accepted methodology for establishing minimum or environmental flows for rivers (Postel and Richter 2003), was used to quantify changes in habitat with changes in spring run flow for various functional and taxonomic groups of aquatic fauna. PHABSIM modeling has been used for the development of minimum flows for numerous rivers and springs runs within the District. They include the Weeki Wachee, Upper Alafia, Upper and Lower Anclote, Braden, Upper Hillsborough, Upper Myakka, and Middle Peace Rivers, as well as Gum Slough Spring Run. The PHABSIM model was used to evaluate potential changes in available habitat associated with reductions in instream flows for 18 functional and taxonomic groups. The groups assessed included the shallow-slow habitat guild, shallow-fast habitat guild, deep-slow habitat guild, deep-fast habitat guild, adult largemouth bass, juvenile largemouth bass, spawning largemouth bass, largemouth bass fry, adult bluegill sunfish, juvenile bluegill sunfish, spawning bluegill sunfish, bluegill sunfish fry, adult spotted sunfish, juvenile spotted sunfish, spawning spotted sunfish, spotted sunfish fry, benthic macroinvertebrates, and minnows. For the analyses, the flow record adjusted for groundwater withdrawals and flow records corresponding to 5, 10, 15, and 20 percent reductions to the record adjusted for withdrawals were used to model flow-related changes in habitat at three representative sites. 6.4.1 PHABSIM Sites PHABSIM cross-section sites, designed to quantify specific habitats for fish and macroinvertebrates at differing flow conditions, were established at three representative sites on the Rainbow River (Figures 6-5 and 6-6). The uppermost site was named PHABSIM 1 or PHAB 1. The middle site was designated as PHABSIM Pool, and the lowest site was named PHABSIM 2 or PHAB 2. At least one bank at all PHABSIM sites consisted of residential property. Bottom substrate at these sites consisted mainly of shifting sand, bedrock, and very dense SAV, distributed among shoal, run, and pool areas.
East Bank West Bank Figure 6-5. Photographs of the PHABSIM 1 site in the Rainbow River System as an example.
86

Figure 6-6. Location of PHABSIM and vegetation transect sites in the Rainbow River System.
87

Identification of shoal locations in the study reach is important for PHABSIM model analyses because these features represent hydraulic controls. The shoals restrict flow and may be sites where hydraulic connection may be lost or may present barriers to fish migration. Field reconnaissance of shoals in the entire study reach was conducted for selection of the three PHABSIM data collection sites. The PHABSIM model analyses required acquisition of field data concerning channel habitat composition and hydraulics. At each PHABSIM site, tag lines were used to establish up to three cross-sections corresponding to shoal, run, and pool habitats, as applicable, across the channel to the top of bank on either side of the river. At each cross-section, stream depth, substrate type, and habitat/cover were recorded, and water velocity was measured with a StreamPro Acoustic Doppler Current Profiler and/or a Sontek Flow Tracker Handheld Acoustic Doppler Velocimeter at intervals determined based on cross-section width. Interval selection was based on collecting a minimum of 20 sets of measurements per cross-section. Other hydraulic descriptors measured included channel geometry (river bottom-ground elevations), water surface elevations across the channel, and water surface slope determined from points upstream and downstream of the cross-sections. Elevation data were collected relative to temporary benchmarks that were subsequently surveyed by District surveyors to establish absolute elevations, relative to the NAVD88. Data were collected under a range of flow conditions (low, medium, and high flows) to provide information needed to run the PHABSIM models for each site.
6.4.2 Development of PHABSIM Model Habitat Suitability Curves Habitat suitability criteria for the 18 functional and taxonomic groups assessed using PHABSIM modeling included continuous variable or univariate curves designed to encompass the expected range of suitable conditions for water depth, water velocity, and substrate/cover type and proximity. Habitat suitability curves are generally classified into three categories based on the types of data and data summarization approaches used for their development (Waddle 2012). An example of a habitat suitability curve is shown in Figure 6-7, and all of the habitat suitability curves used in the PHABSIM modeling for the Rainbow River System are included in Appendix J. Type I curves are not dependent upon acquisition of additional field data but are, instead, based on personal experience and professional judgment. Informal development of Type I curves typically involves a roundtable discussion (Scheele 1975); stakeholders and experts meet to discuss habitat suitability information to be used for prediction of habitat availability for specific target organisms. A more formal process, known as the Delphi technique (Zuboy 1981), involves submission of a questionnaire to a large respondent group of experts. Results from this survey process are summarized by presenting a median and interquartile range for each variable. Several iterations of this process must be used in order to stabilize the responses, with each expert being asked to justify why his/her answer may be outside the median or interquartile range when presented the results of the survey. The Delphi system lacks the rapid feedback of a roundtable discussion, but does remove the potential biases of a roundtable discussion by creating anonymity of expert opinion. The Delphi system does assume that experts are familiar with the creation of habitat suitability criteria and can respond with sufficient detail to allow development of appropriate mathematical models of habitat use.
88

Figure 6-7. Example habitat suitability curve for velocity preferences for adult largemouth bass (Micropterus salmoides).
Type II curves are based upon frequency distributions for use of certain variables (e.g., flow), which are measured at locations utilized by the target species. Curves for numerous species have been published by the United States Fish and Wildlife Service (USFWS) or the USGS and are commonly referred to as “blue book” criteria. Type III curves are derived from direct observation of the utilization and/or preference of target organisms for a range of environmental variables (Manly et al. 1993). These curves are weighted by actual distribution of available environmental conditions in the stream (Bovee et al. 1998). Type III curves assume that the optimal conditions will be “preferred” over all others if individuals are presented equal proportions of less favorable conditions (Johnson 1980). Based on the abundance and distribution of the spotted sunfish (Lepomis punctatus) in rivers within the District, including the Rainbow River System (Table 4-1), modified Type III habitat suitability curves were created for adult, juvenile, spawning, and fry life stages of this species and used for evaluating habitat availability at the Rainbow River PHABSIM sites. Development of these curves involved the initial creation of Type I curves that were subsequently modified based on field sampling efforts. Initially, since most of the regional experts in fish ecology that were consulted were unfamiliar with development of habitat suitability criteria, a hybrid of the roundtable and Delphi techniques was used to develop Type I curves for the species. For this effort, a proposed working model of habitat suitability criteria was provided to 14 experts for evaluation. The proposed suitability curves were based on flow criteria reported by Aho and Terrell (1986) for another member of the Family Centrachidae, the redbreast sunfish (Lepomis auritus), that were modified according to published literature on the biology of spotted sunfish. Respondents were given approximately 30 days to review the proposed habitat suitability criteria and to suggest modifications. Six of the 14 experts provided comments. In accordance with Delphi techniques, the suggested modifications were incorporated into the proposed Type I curves. Suggested modifications that fell outside of the median and 25 percent interquartile range of responses were not considered unless suitable justification could be
0
0.2
0.4
0.6
0.8
1
1.2
0 0.1 0.2 0.3 0.4 0.5 0.6 0.7
Pref
eren
ce/S
uita
blity
Velocity (feet/s)
LMB Adult Velocity HSC
89

provided. The resulting Type I curves were later modified following fish sampling conducted on the Peace River. Data obtained from these field collections were considered sufficient to classify the modified curves as Type II to Type III curves. Modified Type II habitat suitability criteria for adult, juvenile, spawning, and fry life stages of largemouth bass (Micropterus salmoides) and bluegill (Lepomis macrochirus), two other common fish species in the Rainbow River (Table 4-1), were established using USFWS/USGS “blue book” criteria (Stuber et al. 1982). Curves for these species have been widely used in PHABSIM model applications and were used for the Rainbow River PHABSIM analyses.
Type III habitat suitability criteria for macroinvertebrate community diversity were established based on suitability curves published by Gore et al. (2001). Modified substrate and cover codes used for criteria development were established through consultation with District and FWC staff. For this effort, emphasis was placed on invertebrate preference for macrophytes, inundated woody snags, and exposed root habitats common in the Rainbow River System and other Florida streams. A Type II habitat suitability curve for combined adult life stages of minnows (Family Cyprinidae) was developed based on electrofishing conducted at several Florida rivers. The sampling involved quantification of all cyprinid minnows, without segregation by species, in association with observed flow velocities, water depth, and substrate types. The curve is, therefore, based on total occurrence of cyprinids in the sampled Florida systems. It may be considered a generalized curve applicable for all Cyprinidae and could certainly be refined for individual taxa or for specific water bodies based on data availability. This generalized curve was considered suitable for use in the PHABSIM analyses for the Rainbow River. Type III curves developed for a suite of habitat guilds representative of fish habitat diversity were also used for the PHABSIM analyses for the Rainbow River System. The habitat guild curves include shallow-slow, shallow-fast, deep-slow, and deep-fast guilds and serve as generalized indicators of habitat diversity associated with ranges of flow velocity, water depth, and substrate type. They are used to improve understanding of results based on taxon-specific curves and to address potential habitat changes for taxa currently lacking specific life-history stage curves. The habitat guild criteria are based on information developed by Leonard and Orth (1988) for a suite of fish and habitat types occurring in a number of streams in Virginia. Their use for the Rainbow River and other Florida systems is considered appropriate as they specify habitat characteristics that are expected to be populated by local fish fauna.
6.4.3 PHABSIM Modeling Methodology The PHABSIM model system includes a hydraulic modeling component for predicting changes in velocity in individual cells of the surveyed cross-sections as water elevations changes. However, to include the backwater effect of the Withlacoochee River in the PHABSIM-based simulations of the Rainbow River System, the hydraulic modeling component of the PHABSIM model system was not used. Rather, output from the HEC-RAS model for the 15 flow-profile simulations discussed previously was used as input for the PHABSIM model runs. The substrate composition and cover characteristics obtained during the field study and predicted velocities and depth values by the HEC-RAS model
90

for three backwater conditions, representing low (25 percent), medium (50 percent), and high (75 percent) backwater effects, were used in the PHABSIM model component program (HABTAT) to determine available habitat or WUA for various organisms at specific life history stages. The PHABSIM model develops WUA/discharge relationships that can then be used to evaluate modeled habitat gains and losses with changes in discharge (e.g., Figure 6-8). Once the relationships between hydraulic conditions and WUA are established, they are examined in the context of historic and reduced flow regimes. Plots of this relationship for all of the functional and taxonomic groups that were included in the PHABSIM modeling effort for the Rainbow River System are included in Appendix J.
Figure 6-8. Example of weighted usable area (WUA)/discharge relationship calculated using the PHABSIM model. The flow record adjusted to exclude groundwater withdrawals from 1965 through 2014 (records for 2015 were incomplete at the time of simulations) was used for the PHABSIM modeling. Using a time series analysis routine (TSLIB, Milhous et al. 1990), monthly discharge files were created for historic conditions in the absence of withdrawals, 5 percent monthly flow reductions, 10 percent monthly flow reductions, 15 percent monthly flow reductions, and 20 percent monthly flow reductions. For each set of discharge conditions, a time-series was created as the amount of habitat or WUA available for each month. Habitat availability or HAQ files were created for the high discharge events using linear (first-order) or curvilinear (second-order-polynomial) regression models. Duration analysis was then accomplished through assessment of the percentage of time that the average and median habitat values were met or exceeded for each month over the period
0
5000
10000
15000
20000
25000
30000
35000
40000
298.
35
307.
41
322.
1
333.
75
341.
73
349.
59
366.
23
380.
28
396.
84
412.
02
432.
29
462.
08
501.
59
527.
7
583.
88
WU
A / H
abita
t Ava
ilabi
lity
(sq
ft /
1000
line
ar ft
)
Discharge (cfs)
Rainbow River - PHABSIM1Medium Backwater (50%)
Bluegill Sunfish
Adults
Juveniles
Spawning
Fry
91
of record. Comparisons to historic conditions excluding withdrawals were made to evaluate the amount of habitat gain or loss under the various flow reduction scenarios. The PHABSIM model system does not specifically identify acceptable amounts of habitat loss or gain for any given species, taxonomic group, or other criterion. Rather, given hydrologic data and habitat preferences, the model system can be used for minimum flow purposes to establish relationships between hydrology and WUA for target species or other criteria, and allows examination of habitat availability in terms of the historic (e.g., non-withdrawal impacted) and altered flow regimes. The amount of potential habitat loss, or deviation from the optimum, that a water body is capable of withstanding that is determined from these data is based on professional judgment. Gore et al. (2002) provided guidance regarding this issue, suggesting that “[i]n general, instream flow analysts consider a loss of more than 15 percent habitat, as compared to undisturbed or current conditions, to be a significant impact on that population or assemblage.” For purposes of minimum flows development, the District has defined withdrawal related percent-of-flow reductions that result in greater than a 15 percent reduction in available habitat from non-withdrawal impacted conditions as limiting factors that can be used for developing minimum flows. 6.4.4 Sources of Uncertainty in PHABSIM Model Results As with any modeling effort, various sources of error, including using HEC-RAS model output as input to the PHABSIM model runs instead of using the internal hydraulic modeling component, contribute uncertainty to the PHABSIM modeling results. Nevertheless, this approach incorporates the best information available at this time. These sources are briefly described below.
• Spatial and temporal discrepancies in substrate/cover information for some model cells. WUA estimates are cell-by-cell estimates of the habitat value of that cell as a product of velocity, water depth, and substrate/cover preferences. Use of HEC-RAS model output in the PHABSIM simulations required estimation of substrate/cover classifications for some model cross-section cells based on field observations for nearby cross-section cells. In addition, it was assumed that no substrate changed location in the intervening period between field observations and HEC-RAS model development.
• Use of some habitat suitability curves that were not based on locally-collected data or observations. This source of error can result in order of magnitude differences in WUA estimates for some species.
6.5 Evaluation of Instream Woody Habitat Inundation In low-gradient streams of the southeastern coastal plain, wood is recognized as important habitat (Cudney and Wallace 1980, Benke et al. 1984, Wallace and Benke 1984, Thorp et al. 1990, Benke and Wallace 1990). Wood habitats harbor the most biologically diverse instream fauna and are the most productive habitat on a per unit area basis (Benke et al. 1985). Comparisons of different instream habitats in a southeastern stream indicates that production on snags is at least twice as high as that found in any other habitat (Smock et al. 1985).
92

Wood provides advantages as habitat, as it is relatively stable and long lived compared to sand, which constantly shifts (Edwards and Meyer 1987). Even bedrock substrates, though the most stable of all, are susceptible to smothering by shifting sand and silt. Wood is a complex structural habitat with microhabitats that provide cover for a variety of invertebrates. As an organic substrate, wood is also a food resource for utilization by microbial food chains, which in turn supports colonization and production of macroinvertebrates. As physical impediments to flow, woody structures enhance the formation of leaf packs and larger debris dams. These resulting habitats provide the same functions as woody substrate, in addition to enhancing habitat diversity instream. Organisms in higher trophic levels, such as fish, have been shown to also depend on woody structures either for cover, as feeding grounds, or as nesting areas. Because woody habitats are potentially the most important instream habitat for macroinvertebrate production, inundation of these habitats for sufficient periods is considered critical to secondary production (including fish and other wildlife) and the maintenance of aquatic food webs. Not only is inundation considered important, but sustained inundation prior to colonization by invertebrates is necessary to allow for microbial conditioning and periphyton development. Without this preconditioning, the habitat offered by snags and wood is essentially a substrate for attachment without associated food resources. The development of food resources (microbes) on the substrate is needed by the assemblage of macroinvertebrates that typically inhabit these surfaces. After the proper conditioning period, continuous inundation is required for many species to complete development. The inundated woody substrate (both snags and exposed roots) within the stream channel is viewed as an important riverine habitat and it is assumed that withdrawals or diversions of river flow could significantly decrease the availability of this habitat under medium to high flow conditions. 6.5.1 Instream Woody Habitat Sites Live (exposed roots) and dead (snags) instream woody habitats were assessed at 11 sites on the Rainbow River (Figure 6-6). At each site, duplicate cross-sections, from the top of bank on one side of the channel through the river and up to the top of bank on the opposite channel, were established. One of two cross-sections at each site was situated along the floodplain vegetation transect line and the other was located 50 feet upstream. A total of 22 instream cross-sections were delineated (11 sites x 2 cross-sections at each site). Minimum and maximum (e.g., top and bottom elevations relative to NAVD88) of up to 15 samples of exposed root and snag habitats located between the cross-sections were measured along each bank and averaged for each sample. If the water surface elevation between the two cross-sections differed by more than 0.5 foot, woody habitat sampling was extended upstream along each bank an additional 50 feet. Mean exposed root and snag habitat elevations were determined for each site based on the sample averages. Flows at the 11 sites and corresponding flows at the Rainbow River near Dunnellon, FL Gage that would result in inundation of the mean exposed root and snag habitat elevations at each cross-section were determined using the HEC-RAS model. This information was then used along with the long-term average withdrawal-adjusted flow and sequentially reduced flow records in a spreadsheet-based, long-term inundation analysis to identify the number of days during the long-term average withdrawal-adjusted flow that the specified level (e.g., the mean exposed root and snag elevation) was equaled or exceeded at each
93
site. For the purpose of developing minimum flow recommendations, the maximum percent-of-flow reductions that would result in less than a 15 percent reduction in the number of days of inundation of the mean elevations associated with the two woody habitat types relative to the long-term average withdrawal-adjusted flow condition were determined. 6.6 Rainbow River Floodplain Wetlands Inundation Analyses The District’s approach to protecting flows associated with maintaining floodplain wetlands habitat, functions, and processes for the Rainbow River System involved long-term inundation analysis to identify the number of days during a defined period of record that a specific flow or level (elevation) was equaled or exceeded at individual river cross-sections, including streamflow gaging sites. This information was linked with topographic and wetland distribution data to characterize floodplain habitat inundation on a spatial-temporal basis. Available floodplain habitat could then be characterized for the long-term average withdrawal-adjusted flow condition and reduced flow scenarios to identify a maximum percent-of-flow reduction that would result in a 15 percent reduction in habitat availability. The framework for simulating inundated floodplain areas for the Rainbow River System included two coupled models, the HEC-RAS model for simulating water-surface profile at each of the surveyed cross-sections and the HEC-GeoRAS model, Version 10 for ArcGIS 10.2, for processing the water surface profiles and generating floodplain inundation profiles. The simulation framework also required a high-quality Digital Elevation Model (DEM) representing the ground surface and a CLC map reflecting the location and extent of wetland features along the Rainbow River upstream of the Rainbow River at Dunnellon, FL Gage (Figure 6-9). The framework application steps are as follows.
1. The HEC-RAS model was run for combinations of 15 steady flow and 15 backwater regimes to determine stage vs. flow relationships at each surveyed cross-sections. These combined 225 scenarios ranged from one percent to 99 percent exceedance time and were obtained through flow-duration analysis of the long-term flow data at the Rainbow River at Dunnellon, FL Gage adjusted for withdrawals and stage data at the Withlacoochee River at Dunnellon, FL Gage for the time period from 1/1/1965 to 12/31/2010 (see Table 6-3).
2. The 225 water elevations were converted to TINs in HEC-GeoRAS for the representation of water surfaces. Because some of the HEC-RAS cross-sections do not extend to the outer edge of the wetland areas, the ArcGIS TIN Editor Tool was used to extend the water elevation TINs to the outer edge of the adjacent wetland areas (Figure 6-9).
3. The extended water elevation TINs were rasterized in GIS at a spatial resolution of the DEM (e.g., 5 feet by 5 feet).
4. The rasterized water surface profiles and DEM data were overlain to determine the extent and depths of inundation. Inundation was defined as a difference in water surface and land surface elevation that was greater than 0.05 feet.
5. The total inundated floodplain wetland area for each of the 225 flow-stage scenarios was determined by converting the rasterized inundation areas to shapefiles and overlaying with the CLC shapefile to generate a flow-stage-inundated area rating table (Table 6-4).
94

Figure 6-9. Study area (floodplain wetlands upstream of the Rainbow River at Dunnellon, FL Gage), wetland community types, and HEC-RAS model cross-sections for the Rainbow River spatial floodplain wetlands inundation analyses using the HEC-GeoRAS model.
95

Table 6-4. Acres of inundated floodplain wetlands habitat in the Rainbow River System for the 15 steady flow-stage scenarios. Flow scenarios (F1 through F15) correspond with flow at the Rainbow River at Dunnellon, FL Gage. Stage scenarios (S1 through S15) are associated with stage at the Withlacoochee River at Dunnellon, FL Gage and address backwater effects on flow in the Rainbow River.
ID
Flow Percent
Flow @ USGS Gage (cfs)
Acres of Inundated Floodplain Wetlands Habitat for 15 Flow-Stage Scenarios (Percent Exceedance) S1 S2 S3 S4 S5 S6 S7 S8 S9 S10 S11 S12 S13 S14 S15 1 1.25 1.5 1.75 2 3 5 10 25 50 75 85 90 95 99 25.09 25.98 26.18 26.31 26.37 26.6 26.72 26.8 26.92 27.07 27.3 27.49 27.6 27.82 28.36
F1 1 507.41 1.10 2.50 3.18 3.65 3.97 6.78 8.42 9.26 11.39 14.48 20.20 26.18 29.95 38.07 61.07 F2 2 522.81 1.37 3.08 3.70 4.22 4.63 7.61 9.18 10.05 12.50 15.34 21.13 26.96 31.01 39.25 62.40 F3 5 547.79 2.34 4.09 4.78 5.44 5.93 9.21 10.90 11.72 14.05 16.96 22.80 28.72 32.90 41.13 64.70 F4 10 567.61 3.20 5.02 5.83 6.75 7.61 10.66 12.21 13.03 15.48 18.45 24.33 30.54 34.48 42.86 66.72 F5 15 581.18 3.83 5.90 6.98 7.95 8.86 11.75 12.21 14.19 16.50 19.47 25.67 31.71 35.59 44.12 68.64 F6 20 594.54 4.52 7.05 8.04 9.12 10.07 12.83 14.35 15.10 17.51 20.81 26.81 32.82 36.82 45.85 70.09 F7 30 622.84 6.64 9.12 10.23 11.82 12.56 15.23 16.86 17.49 20.31 23.59 29.60 36.21 40.35 49.17 73.90 F8 40 646.74 8.34 11.04 12.63 14.14 14.69 17.54 19.26 19.88 22.81 26.86 32.63 39.10 43.31 52.60 78.11 F9 50 674.90 10.64 13.85 15.82 17.09 17.82 20.72 22.58 23.08 26.45 31.16 36.61 43.43 47.68 57.27 83.77 F10 60 700.71 13.02 16.76 18.84 20.28 20.92 24.07 26.13 26.53 30.30 34.83 41.04 48.16 52.65 62.16 90.06 F11 70 735.18 16.49 21.40 23.53 24.96 25.75 29.14 31.46 31.83 36.79 40.04 47.89 56.01 60.64 70.66 99.42 F12 80 785.85 22.81 29.56 32.04 33.95 25.75 39.67 42.64 42.49 47.42 52.59 62.19 70.50 75.62 86.84 118.71 F13 90 853.04 34.67 44.50 48.22 51.16 52.93 58.08 62.24 59.38 70.74 77.22 88.00 97.60 103.98 116.58 153.07 F14 95 896.94 45.15 58.51 63.52 66.55 68.03 77.24 82.47 76.68 91.70 99.06 111.62 122.22 128.91 143.70 181.97 F15 99 993.00 79.18 108.82 118.22 124.72 127.78 140.57 147.34 129.60 159.58 169.02 184.67 196.82 200.04 213.55 247.88
96
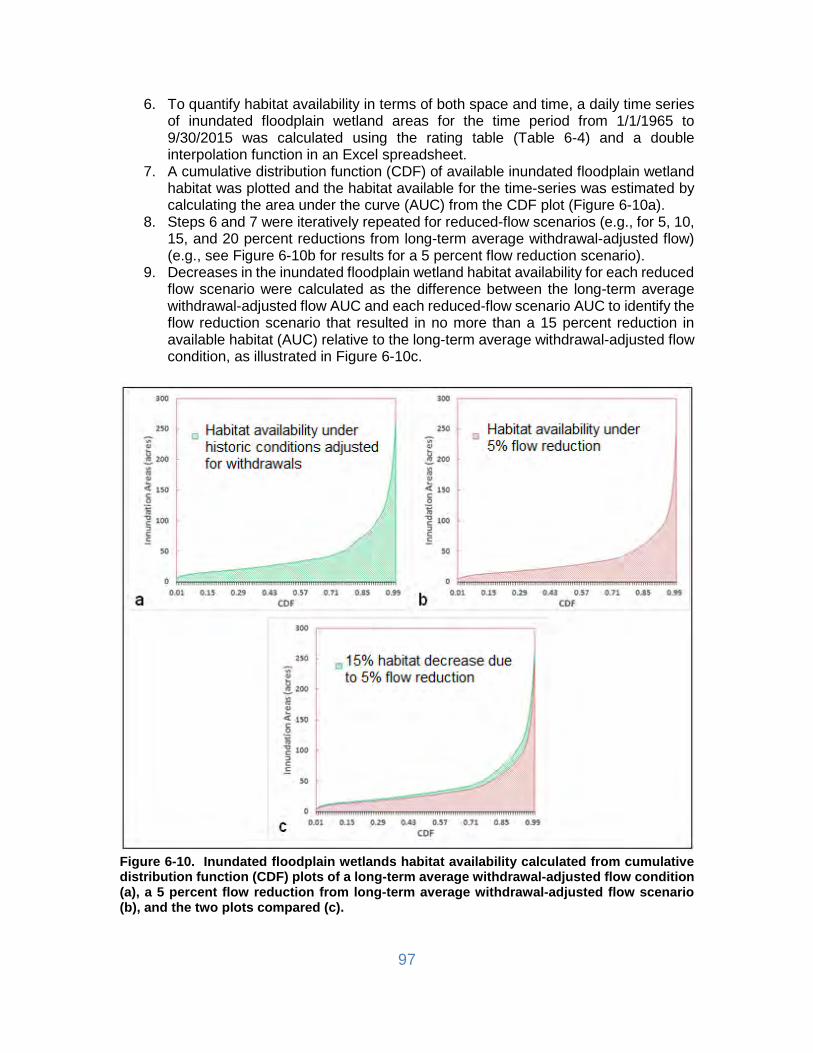
6. To quantify habitat availability in terms of both space and time, a daily time series of inundated floodplain wetland areas for the time period from 1/1/1965 to 9/30/2015 was calculated using the rating table (Table 6-4) and a double interpolation function in an Excel spreadsheet.
7. A cumulative distribution function (CDF) of available inundated floodplain wetland habitat was plotted and the habitat available for the time-series was estimated by calculating the area under the curve (AUC) from the CDF plot (Figure 6-10a).
8. Steps 6 and 7 were iteratively repeated for reduced-flow scenarios (e.g., for 5, 10, 15, and 20 percent reductions from long-term average withdrawal-adjusted flow) (e.g., see Figure 6-10b for results for a 5 percent flow reduction scenario).
9. Decreases in the inundated floodplain wetland habitat availability for each reduced flow scenario were calculated as the difference between the long-term average withdrawal-adjusted flow AUC and each reduced-flow scenario AUC to identify the flow reduction scenario that resulted in no more than a 15 percent reduction in available habitat (AUC) relative to the long-term average withdrawal-adjusted flow condition, as illustrated in Figure 6-10c.
Figure 6-10. Inundated floodplain wetlands habitat availability calculated from cumulative distribution function (CDF) plots of a long-term average withdrawal-adjusted flow condition (a), a 5 percent flow reduction from long-term average withdrawal-adjusted flow scenario (b), and the two plots compared (c).
97

CHAPTER 7 – RAINBOW RIVER SYSTEM MINIMUM FLOW DEVELOPMENT RESULTS A number of habitat-based methods were used to evaluate relevant environmental values and develop the recommended minimum flow for the Rainbow River System. This chapter presents the results of the modeling and field investigations that were conducted to develop minimum flow criteria for the Rainbow River System.
7.1 Minimum Low-Flow Threshold Evaluation Results The minimum low-flow threshold defines flows that are to be protected throughout the year and must be historically appropriate. It limits surface water withdrawals and identifies the maximum expected extent of impact on low flows from groundwater withdrawals. The minimum low-flow threshold is established at the higher of two flow criteria, which are based on maintaining fish passage and maximizing habitat quantity/wetted perimeter for the least amount of flow in the river channel.
7.1.1 Fish Passage Evaluation At all surveyed cross-sections, the water elevation associated with the lowest flow modeled with the HEC-RAS model was higher than the fish passage requirement (e.g., the minimum channel elevation plus 0.6 feet). Therefore, the lowest modeled flow (507 cfs) at the Rainbow River at Dunnellon, FL Gage was sufficient to accommodate fish passage and allow for recreational use and other relevant environmental values. 7.1.2 Instream Habitat Quantity Evaluation Wetted perimeter plots (wetted perimeter versus flow at the Rainbow River at Dunnellon, FL Gage) and the LWPIP were developed for each HEC-RAS cross-section of the Rainbow River System. The lowest modeled flow (507 cfs) was sufficient to inundate the LWPIP at all but one of the 17 cross-sections (Figure 7-1). At River Mile 4.96, a flow of 622 cfs was required to inundate the LWPIP within the range of historic flows.
98

Figure 7-1. Flow at the USGS Rainbow River at Dunnellon, FL Gage (02313100) required to inundate the lowest wetted perimeter inflection point (LWPIP) at HEC-RAS cross-sections. 7.1.3 Summary of Minimum Low-Flow Threshold Evaluation At all cross-sections evaluated, the elevation associated with the fish passage criterion was exceeded at all modeled flows. This is likely due to both the relatively large discharge of the river and the effect of backwater from the Withlacoochee River. When establishing a fish passage criterion, results for each evaluated cross-section in the set of assessed cross-sections are considered relevant because the criterion is, in part, intended to protect the longitudinal connectivity of the river. Therefore, the most restrictive cross-section is often used to set the fish passage criterion for the river. When evaluating wetted perimeter results, however, the complete set of cross-sections, rather than the most limiting single cross-section, is relevant for criterion development because the assessed cross-sections are considered to be a sample of wetted perimeter values for the entire river segment. Of the 179 cross-sections, 17 were examined, and only one cross-section had a wetted perimeter inflection point above the lowest flow. Setting the LWPIP criterion at 622 cfs, which has exceedance probability of 70 percent, is not appropriate to establish a minimum low-flow threshold, which is typically set at a higher low exceedance percentile. Because both the fish passage criterion and LWPIP occur below the historic range of flows and cannot be identified, it is not appropriate to establish a minimum low-flow threshold for the Rainbow River System. Flow reductions which would result in significant harm to either the passage or movement of fish along the river corridor or the quantity of instream habitat have not occurred historically in the Rainbow River and are not anticipated.
99

7.2 PHABSIM Model Results PHABSIM modeling analyses were conducted for the following:
• The flow record from 1965 through 2014 at the Rainbow River at Dunnellon, FL Gage, which was adjusted to compensate for a 1.1 percent flow reduction before and through 1995 and a 1.7 percent flow reduction post-1995 due to groundwater withdrawal impacts;
• The long-term average withdrawal-adjusted flow record reduced by 5, 10, 15, and 20 percent;
• Three backwater conditions: 25 percent (low), 50 percent (medium), and 75 percent (high) based on stage at the Withlacoochee River at Dunnellon Gage;
• Three sites: PHABSIM 1, PHABSIM 2, and Pool; and • Eighteen functional and taxonomic groups: shallow-slow habitat guild, shallow-fast
habitat guild, deep-slow habitat guild, deep-fast habitat guild, adult largemouth bass, juvenile largemouth bass, spawning largemouth bass, largemouth bass fry, adult bluegill sunfish, juvenile bluegill sunfish, spawning bluegill sunfish, bluegill sunfish fry, adult spotted sunfish, juvenile spotted sunfish, spawning spotted sunfish, spotted sunfish fry, benthic macroinvertebrates, and minnows.
Table 7-1 summarizes the results of PHABSIM model analyses. The table does not include results for groups for which reductions in flow up to 20 percent either resulted in gains in available habitat or reductions in available habitat of less than 15 percent at all sites for all backwater conditions. Graphs of PHABSIM model results for the three sites, 18 functional/taxonomic groups, three backwater conditions, and four flow reduction scenarios are provided in Appendix J. For a particular group, the maximum allowable flow reductions included in Table 7-1 are based on the most sensitive or restrictive month. For some of the analyses, because a small amount of habitat was available under long-term average withdrawal-adjusted flow conditions (less than 1,000 square feet/1,000 linear feet), small reductions in monthly flows resulted in large reductions in available habitat (Table 7-1). This occurred for the shallow-fast habitat guild at the Pool site for all backwater conditions, for spawning largemouth bass at Site PHABSIM 2 for high backwater conditions, for largemouth bass fry at Site PHABSIM 2 for medium and high backwater conditions, and for bluegill fry at Site PHABSIM 2 for medium and high backwater conditions. These results should not be considered reliable and were not considered for the establishment of the minimum flow. In general, largemouth bass fry was the most sensitive group to reductions in flow (Table 7-1). Of the three sites, the Pool site was the least restrictive displaying, no loss of available habitat of more than 15 percent for flow reductions up to 20 percent.
100

Table 7-1. Maximum allowable flow reductions associated with a 15 percent reduction in available habitat resulting from PHABSIM modeling using the 1965-2014 long-term average withdrawal-adjusted flow conditions and reduced flow records. Functional/taxonomic groups for which reductions in flow up to 20 percent either resulted in gains in available habitat or reductions in available habitat of less than 15 percent at all sites and for all backwater conditions are not shown.
Functional/ Taxonomic
Group
PHABSIM 1 Site Maximum Allowable Flow Reduction (Percent)
PHABSIM 2 Site Maximum Allowable Flow Reduction (Percent)
PHABSIM Pool Site Maximum Allowable Flow Reduction (Percent)
Low Backwater
(25 Percent)
Medium Backwater
(50 Percent)
High Backwater
(75 Percent)
Site Weighted Average
Low Backwater
(25 Percent)
Medium Backwater
(50 Percent)
High Backwater
(75 Percent)
Site Weighted Average
Low Backwater
(25 Percent )
Medium Backwater
(50 Percent)
High Backwater
(75 Percent)
Site Weighted Average
Shallow-Fast Habitat Guild NA NA NA NA >202 >202 >202 >20 13 13 13 1.0
Spawning Largemouth Bass
>201 >201 >201 >20 >201 >202 103 NA >201 >201 >201 >20
Largemouth Bass Fry 13 8 8 9.3 4 73 43 5.5 >201 >201 >201 >20
Juvenile Bluegill 15 14 13 14.0 >201 >201 >201 >20 >201 >201 >201 >20
Bluegill Fry >201 >201 10 NA >201 43 33 NA >201 >201 >201 >20
1Reductions in flow up to 20 percent generally results in available habitat gain 2Reductions in flow up to 20 percent results in less than a 15 percent reduction of available habitat 3Available habitat <1,000 square feet/1,000 linear feet under long-term average withdrawal-adjusted flow conditions
101

In order to account for the range of backwater conditions, where possible, weighted averages of maximum allowable flow reductions were calculated for each functional/taxonomic group for each site (Table 7-1). A weighting value of 0.5 was used for results associated with the medium backwater condition, and a value of 0.25 was used to weight results associated with the low and high backwater simulations. Because reductions in flow of up to only 20 percent were evaluated, changes in habitat availability could not be calculated in many situations (reductions in flow of up to 20 percent either resulted in gains in available habitat or less than a 15 percent reduction of available habitat for all months). Site weighted averages could be calculated for largemouth bass fry and juvenile bluegill at Site PHABSIM 1 (Table 7-1). At this site, largemouth bass fry was the most sensitive group. An allowable flow reduction of nine percent would not reduce available largemouth bass fry habitat by more than 15 percent. Based on the PHABSIM model results, a nine percent flow reduction is considered protective of instream habitat. 7.3 Results of Woody Habitat Inundation Analyses Inundation patterns of exposed root and snag habitats were examined at 11 instream habitat cross-sections in the Rainbow River System. The mean elevation for exposed roots at the instream habitat cross-sections ranged from 27.1 to 30.3 feet above NAVD88 and averaged 28.1 feet, while mean elevations for snag habitats ranged from 23.7 to 28.3 feet above NAVD88, with an average of 26.6 feet (Table 7-2). The number of days that the river water elevations were sufficient to inundate these mean elevations associated with exposed roots and snag habitats at each instream cross-section were determined using the long-term average withdrawal-adjusted flow record. Then, percent of flow reductions that resulted in greater than a 15 percent reduction in the number of days of inundation from long-term average withdrawal-adjusted conditions were calculated. Exposed roots at three sites: Veg 6, PHABSIM 1, and Veg BBP were sensitive to reductions in flow up to 20 percent (Table 7-2). Averaging the allowable flow reduction for each of these three sites resulted in a nine percent maximum allowable flow reduction that would reduce the inundation of exposed root habitat by more than 15 percent. Snag habitat was not sensitive to reductions in flow up to 20 percent (Table 7-2). Based on these woody habitat inundation results, a nine percent flow reduction is considered protective of instream habitat.
102

Table 7-2. Elevations of instream woody habitats (exposed roots and snags) at 11 sites and allowable flow reductions associated with a 15 percent reduction in the number of days of flow sufficient to inundate the woody habitat.
Site
Exposed Roots Snags
Mean Elevation
(feet above NAVD88)
Maximum Allowable Flow
Reduction (Percent)
Mean Elevation
(feet above NAVD88)
Maximum Allowable Flow
Reduction (Percent)
Veg 7 29.9 24 28.3 84 Veg 6 30.3 101 27.2 100
PHABSIM 1 30.0 61 27.6 100 PHABSIM Pool 28.4 39 27.3 100
Veg 4 28.0 62 27.2 100 PHABSIM 2 27.1 100 26.8 100
Veg 3 27.3 77 26.5 100 Veg 2.5 27.3 100 27.1 100 Veg 2 25.4 100 23.7 100 Veg 1 27.7 100 26.0 100
Veg Below Pit 28.1 101 25.2 100 Average2 Maximum
Allowable Flow Reduction (Percent)
9 NA
1Sensitive to flow reductions of up to 20 percent 2Average based on three sites exhibiting sensitivity to flow reductions of up to 20 percent 7.4 Results of Floodplain Wetlands Habitat Inundation Analyses The floodplain wetlands habitat criterion for the Rainbow River System was developed by analyzing time-series of inundated areas produced using HEC-RAS and HEC-GeoRAS models. Iterative analyses of daily inundated floodplain wetlands area for the 1965 through 2015 long-term average withdrawal-adjusted flow period and inundated floodplain wetlands area for reduced long-term average withdrawal-adjusted flow conditions indicated that a maximum five percent flow reduction could occur without exceeding a 15 percent decrease in the inundated area associated with the long-term average withdrawal-adjusted flows. This flow decrease is associated with an average seven-acre decrease in available inundated floodplain wetlands habitat. Plots of the normalized area under the curve (NAUC) for the five, ten, 15 and 20 percent flow reduction scenarios relative to long-term average withdrawal-adjusted flow conditions are presented in Figure 7-2. To further investigate the sensitivity of the amount of inundated floodplain wetland habitat to flows, the percent-of-flow reductions that would result in a 15 percent decrease in the amount of inundated wetlands was assessed for low, medium, and high ranges of long-term average withdrawal-adjusted flows. The low end of the range was defined as flows that were less than the 90 percent exceedance flow (e.g., flows less than 567 cfs) and the high end of the range was defined as flows greater than the ten percent exceedance flow (e.g., flows greater than 853 cfs). Flows between the 90 percent and ten percent exceedance flows were considered within the medium range. Considering only the high range of flows, a four percent reduction in long-term average withdrawal-adjusted flows would be associated with a 15 percent decrease in inundated floodplain wetland habitat. This result is more restrictive than those based on the low and
103

medium flow ranges, which indicated that six and five percent flow reductions, respectively, would be associated with a 15 percent change in inundated floodplain wetlands habitat. These minor differences in allowable percent-of-flow reductions observed for differing ranges or flow are not surprising, given the relative stability and dominance of springflow in the system.
Figure 7-2. Plot of normalized area under the curve (NAUC) from the cumulative distribution function (CDF) for the 1965-2015 long-term average withdrawal-adjusted flow periods and flow reductions ranging from 0 to 20 percent. The dashed line indicates the 15 percent reduction in available/inundated floodplain wetlands habitat. The vertical water elevation changes between the long-term average withdrawal-adjusted flow condition and the five percent flow reduction scenario ranged from 0.05 to 0.40 feet depending on flow, backwater conditions, and location in the river system. When flow at the Rainbow River at Dunnellon Gage is at 10 percent exceedance (approximately 853 cfs) and the backwater condition (stage at the Withlacoochee River at Dunnellon gage) is at 10 percent exceedance (27.6 feet above NAVD88), the average water elevation change between the long-term average withdrawal-adjusted flow condition and the 5 percent flow reduction at the Rainbow River at Spring Head, Rainbow River near Dunnellon, and Rainbow River at Dunnellon Gages are 0.30, 0.35, and 0.40 feet, respectively (Figure 7-3a). However, when the flow and the backwater are at medium conditions (50 percent exceedance probability), the average water elevation change between the long-term average withdrawal-adjusted flow condition and five percent flow reduction at the Spring Head, Rainbow River near Dunnellon and Rainbow River at Dunnellon gages are 0.20, 0.10 and 0.06 feet, respectively (Figure 7-3b).
20%15%10%5%Baseline
1.0
0.8
0.6
0.4
0.2
0.0
Flow Reduction (%)
NAU
C
NAUC from CDF of Inundation Areas
104
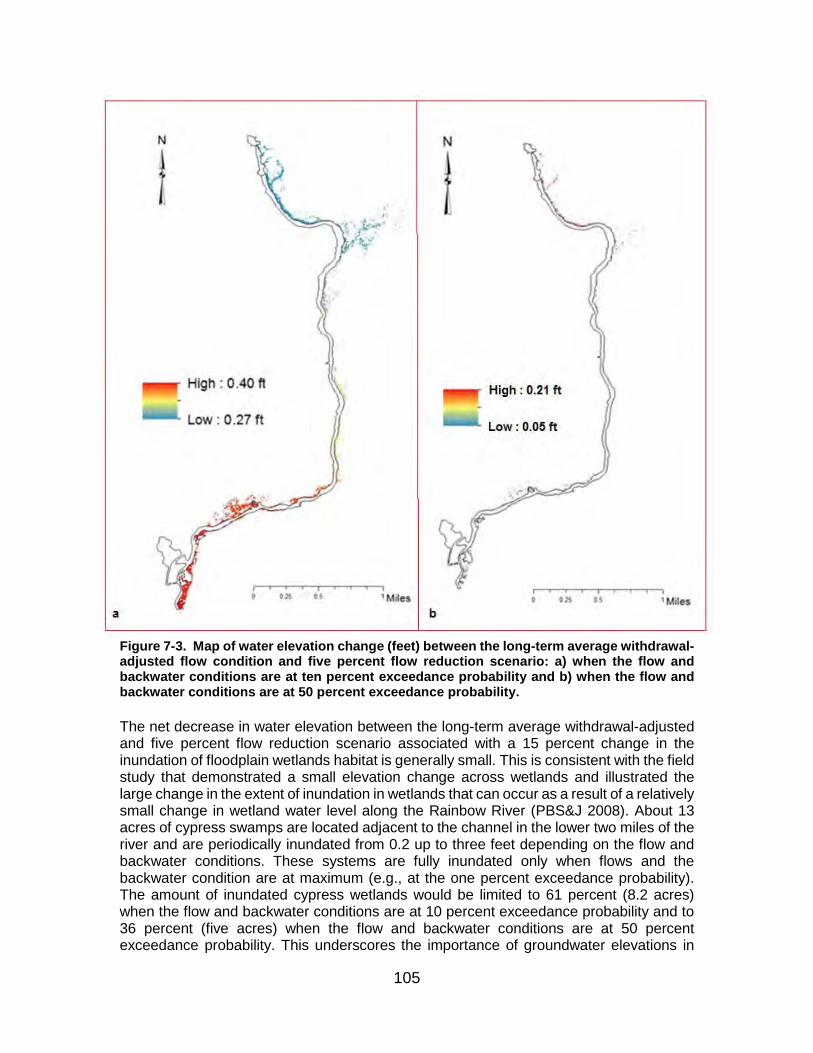
Figure 7-3. Map of water elevation change (feet) between the long-term average withdrawal-adjusted flow condition and five percent flow reduction scenario: a) when the flow and backwater conditions are at ten percent exceedance probability and b) when the flow and backwater conditions are at 50 percent exceedance probability. The net decrease in water elevation between the long-term average withdrawal-adjusted and five percent flow reduction scenario associated with a 15 percent change in the inundation of floodplain wetlands habitat is generally small. This is consistent with the field study that demonstrated a small elevation change across wetlands and illustrated the large change in the extent of inundation in wetlands that can occur as a result of a relatively small change in wetland water level along the Rainbow River (PBS&J 2008). About 13 acres of cypress swamps are located adjacent to the channel in the lower two miles of the river and are periodically inundated from 0.2 up to three feet depending on the flow and backwater conditions. These systems are fully inundated only when flows and the backwater condition are at maximum (e.g., at the one percent exceedance probability). The amount of inundated cypress wetlands would be limited to 61 percent (8.2 acres) when the flow and backwater conditions are at 10 percent exceedance probability and to 36 percent (five acres) when the flow and backwater conditions are at 50 percent exceedance probability. This underscores the importance of groundwater elevations in
105

maintaining the cypress and other wetlands, especially during dry seasons and years. This is consistent with a study that indicated that the cypress swamps along the Rainbow River were inundated for less than a 30-day duration for half of the years under the long-term average withdrawal-adjusted flow conditions (HSW 2009). To further assess potential effects of a five percent reduction in long-term average withdrawal-adjusted flows on floodplain wetlands habitat in the Rainbow River System, changes in the return period of the inundated floodplain wetlands area exceeded 50 percent and ten percent of the time were modeled assuming a minimum 30-day inundation period per year for floodplain wetlands persistence (Table 7-3). For both the long-term average withdrawal-adjusted and five percent flow reduction scenarios, the long-term average withdrawal-adjusted amount of inundated floodplain swamp, hydric hammock, and mixed hardwood wetlands associated with the 50 percent exceedance conditions would be inundated every year. Under 50 percent exceedance conditions, cypress dominated wetlands would be inundated annually for the long-term average withdrawal-adjusted condition but once every two years for the five percent flow reduction scenario. For the ten percent exceedance condition, all wetland types evaluated are expected to be inundated once in four years under the long-term average withdrawal-adjusted condition. Under the five percent flow reduction scenario, the ten percent exceedance in the amount of inundated wetlands for all types except floodplain swamp are expected to occur once in five years. The return frequency for inundation of floodplain swamp under ten percent exceedance conditions may be expected to shift from once every four years to once every seven years with a five percent flow reduction. Collectively, these estimated changes in return frequencies associated with the five percent flow reduction scenario are not expected to result in substantial changes in the availability of inundated floodplain wetlands habitat in the Rainbow River System. Table 7-3. Return periods for the amount of inundated floodplain wetlands exceeding 50 percent and ten percent under long-term average withdrawal-adjusted and five percent reduced flow conditions.
Wetland Community
Type
Total Area
(Acres)
Exceedance Probability (Percent)
Amount of Inundated Wetlands (Acres)
Return Period Long-Term
Average Withdrawal-
Adjusted
5 Percent Flow Reduction
Cypress 13.32 50 5.0 Every year 1 in 2 years 10 8.2 1 in 4 years 1 in 5 years
Floodplain Swamp 5.01 50 2.1 Every year Every year
10 4.0 1 in 4 years 1 in 7 years Hydric
Hammock 160.54 50 6.1 Every year Every year 10 28.3 1 in 4 years 1 in 5 years
Mixed Wetland
Hardwoods 201.52
50 18.5 Every year Every year
10 63.0 1 in 4 years 1 in 5 years
106

CHAPTER 8 – RECOMMENDED MINIMUM FLOW FOR THE RAINBOW RIVER SYSTEM This chapter summarizes the recommended minimum flow for the Rainbow River System. It also includes information regarding how the District will determine that the minimum flow is being met and a description of data that will be collected during the reevaluation period. In addition, the last section of the chapter includes the recommended rule language.
8.1 Recommended Minimum Flow and Status Assessment Multiple, habitat-based methods were used to evaluate relevant environmental values and develop the recommended flow for the Rainbow River System. The maximum allowable flow reduction recommendations resulting from each of the methodologies are included in Table 8-1. Establishing a minimum low-flow threshold was determined to be inappropriate. The minimum water surface elevation that would allow for fish passage was lower than the elevation associated with the lowest modeled flow, and the LWPIP was below the elevation associated with the lowest modeled flow for all but one site (Table 8-1). Flow reductions that would result in significant harm to the passage of fish along the river corridor or the quantity of instream habitat have not occurred historically in the Rainbow River System and are not anticipated to occur. Of the various habitat-based methods used to develop the minimum flow for the Rainbow River System, the availability of inundated floodplain wetlands habitat was the most sensitive or restrictive to reductions in flow (Table 8-1). A five percent flow reduction was associated with a 15 percent reduction in inundated or available floodplain wetlands habitat. Based on this most sensitive criterion, the recommended minimum flow for the Rainbow River System is a long-term average flow of 649 cfs, which is a five percent reduction from the long-term average flow of 683 cfs adjusted for groundwater withdrawals for the period of record from 1965 through 2015 at the USGS Rainbow River at Dunnellon, FL Gage. The gaged flow record was adjusted for groundwater withdrawal impacts from 1965 through 2015 by accounting for flow reductions of 1.1 percent in 1995 that increased to 1.7 percent in 2010 based on simulation of 1995 and 2010 pumping conditions using Version 4.0 of the NDM. The NDM, Version 5.0 was not available during the time of minimum flow development. Flow adjustments due to groundwater withdrawals were applied as percentage changes rather than actual model predicted flow rates in cfs to better represent groundwater impacts through time. It was assumed that flow impacts were zero in 1965 and then linearly interpolated for flow impact through 1995 (1.1 percent). From 1995 to 2010, flow impacts were linearly-interpolated from 1.1 to 1.7 percent. This resulted in a long-term average flow adjusted for groundwater withdrawals from 1965 through 2015 at the USGS Rainbow River at Dunnellon, FL Gage of 683 cfs. The minimum flow recommendation for the Rainbow River System is protective of all relevant environmental values identified for consideration in the Water Resource Implementation Rule when establishing minimum flows and levels (see Rule 62-40.473, F.A.C.). Because updated groundwater modeling (NDM, Version 5.0) indicates that the predicted spring flow decline for the Rainbow Springs Group under 2014 pumping conditions is approximately one percent (refer to Table 2-3 and associated text in Chapter 2), the
107

proposed minimum flow is being met, and a recovery strategy is currently not required. Similarly, given a flow impact of 2.5 percent associated with withdrawals based on projected demand for 2035 (see Table 2-3), implementation of a specific prevention strategy is also not warranted at this time. The District will continue to implement its general, three-pronged prevention strategy that includes monitoring, protective water use permitting, and regional water supply planning to ensure that the adopted minimum flow for the Rainbow River System continues to be met. Minimum flow status assessments for the system will be completed on an annual basis by the District, on a five-year basis as part of the regional water supply planning process, and on an as-needed basis in association with permit and project activities. Table 8-1. Maximum allowable flow reduction recommendations for minimum flow criteria evaluated using various habitat-based methodologies.
Minimum Flow Criteria Measure/Goal
Maximum Allowable Flow Reduction
(Percent) Fish Passage Maintain depth of 0.6 feet across
shoals NA-Below historic flows
Instream Habitat Quantity
Maximize inundated area in the river channel NA-Below historic flows
Fish and Benthic Macroinvertebrate Instream Habitat
Avoid reductions >15 percent of available habitat for 18 functional and
taxonomic groups 9
Instream Exposed Roots Habitat
Avoid reductions >15 percent in exposed root habitat availability 9
Instream Snag Habitat
Avoid reductions >15 percent in snag habitat availability
Not sensitive to reductions in flow
Floodplain Wetlands Habitat
Avoid reductions >15 percent in amount of floodplain wetlands habitat
inundated/available 5
8.2 Minimum Flow Reevaluation and Future Data Needs The best information available was used to develop the minimum flow for the Rainbow River System, which is required by law to be adopted by July 1, 2017. Because climate change, structural alterations, and other changes in the springshed and groundwater basin contributing flows to the Rainbow River System may occur, and because additional information relevant to minimum flows development may become available, the District is committed to periodic reevaluation and if necessary, revision of minimum flows for this priority water body that will presumably be incorporated into Chapter 40D-8, F.A.C. The District recommends reevaluation of the recommended minimum flow within ten years of its adoption into rule. In support of the reevaluation, the District, in cooperation with the USGS will continue to monitor flows in the Rainbow River System and will continue to work on refinement of tools such as the NDM that were used for minimum flow development. The District will also continue to collect water quality data from the water quality monitoring sites described and
108

shown in Table 3-1 and Figure 3-1, respectively. In addition, the District has initiated/will initiate projects to investigate identified data gaps and will continue to collect information to further our understanding of the effects of flow on the structure and function of the Rainbow River System. Listed below are projects, many of which are related, that were recently initiated or will begin shortly after adoption of the minimum flow.
• Investigation of factors affecting the change in relation between groundwater level in the Rainbow Springs Well near Dunnellon, FL and flow at the Rainbow River at Dunnellon, FL Gage that occurred in 2000.
• Collection of spatial flow and water depth data over multiple events to gain a better understanding of flow throughout the Rainbow River System.
• Evaluation of the backwater effects associated with the Withlacoochee River and Inglis Lock and Dam on stage and flow in the Rainbow River System.
• Evaluation of the relationships between flow and SAV in the Rainbow River System.
• Data collection for and development of a hydrodynamic model to support reevaluation of the minimum flow for the Rainbow River System.
• Evaluation of factors (e.g., flow, nitrate, other water quality parameters)
contributing to the growth of filamentous algae in the Rainbow River System.
• Investigation of the effects of flow on nitrate levels, nutrient loading, chlorophyll concentrations, residence time, and clarity in the Rainbow River System.
• Investigation of the effects of flow on residence time in Blue Cove and the effect of increased chlorophyll concentrations in water exported from the cove to the Rainbow River System.
8.3 Recommended Rule Language Based on the information included in this report, draft rule amendments for the Rainbow River System minimum flow are listed below. Note that the rule language developed for incorporation into the District’s Water Levels and Rates of Flow Rules (Chapter 40D-8, F.A.C.) may differ slightly from the language presented below.
(a) For purposes of this rule, the Rainbow River System includes the watercourse from the Rainbow Springs Group headsprings to the Withlacoochee River, including contributing tributaries, and all named and unnamed springs that discharge to the river.
(b) The Minimum Flow for the Rainbow River System is a long-term average flow of
649 cubic feet per second (“cfs”) at the United States Geological Survey Rainbow River at Dunnellon, FL Gage (“United States Geological Survey Gage No. 02313100”). The Minimum Flow is based on a 5% reduction from the long-term average flow of 683 cfs adjusted for groundwater withdrawals for the period of record from 1965–2015 at the United States Geological Survey Gage No. 02313100.
109

(c) Status assessments of the Minimum Flow for the Rainbow River System will be
completed to determine whether the long-term average flow is below or projected to fall below the criteria adopted in this section. Each status assessment is independent from and not a determination of water use permit compliance or environmental resource permit compliance. Permit compliance is a regulatory function that is not within the scope of this subsection. As part of each status assessment, the District will use the following approach:
1. The District will evaluate the Minimum Flow annually to determine the extent to which the long-term average flow of the Rainbow River System has been reduced due to withdrawals for the period of record from 1965 to the date of each status assessment at the United States Geological Survey Gage No. 02313100.
2. The District will also evaluate the Minimum Flow every five years as part of the regional water supply planning process.
3. If the Minimum Flow is being met based on long-term average flows adjusted for withdrawals, then no further actions are required beyond continued monitoring.
4. If the long-term average flow is below the Minimum Flow, or if the long-term average flow is projected to fall below the Minimum Flow within 20 years based on the evaluation performed as part of the regional water supply planning process, the District will conduct a causation analysis to evaluate the potential causes of impacts on the Rainbow River System.
5. Based on the causation analysis, the District will re-evaluate the Minimum Flow for the Rainbow River System, or adopt a recovery or prevention strategy consistent with the provisions of Section 373.0421(2), F.S.
(d) The District will re-evaluate the Minimum Flow within ten years of adoption of this
rule.
110

CHAPTER 9 – LITERATURE CITED Aho, J.M and J.W. Terrell. 1986. Habitat Suitability Index Models and Instream Flow
Suitability Curves: Redbreast Sunfish. U.S. Fish and Wildlife Service Biological Report, 82(10.119), Washington, D.C.
Anastasiou, C. 2006. An Investigation of the Spatial and Temporal Trends in Water
Clarity: Rainbow River, Florida. Florida Department of Environmental Protection, Tampa, Florida.
Annear, T.C. and A.L. Condor. 1984. Relative bias of several fisheries instream flow
methods. North American Journal of Fisheries Management 4:531–539.
Annear, T., I. Chisholm, H. Beecher, A. Locke, P. Aarestad, C. Coomer, C. Estes, J. Hunt, R. Jacobson, G. Jobsis, J. Kauffman, J. Marshall, K. Mayes, G. Smith, C. Stalnaker, and R. Wentworth. 2004. Instream Flows for Riverine Resource Stewardship, Revised Edition. Instream Flow Council, Cheyenne, Wyoming.
Atkins North America and Debra Childs Woithe, Inc. 2012. 2011 Rainbow River
Vegetation Evaluation. Prepared for the Southwest Florida Water Management District, Brooksville, Florida.
ATM (Applied Technology and Management, Inc.). 2016. Water Resource and Human
Use Value Assessment of Silver Springs and the Silver River, Marion County, Draft Special Publication. Prepared for the St. Johns River Water Management District, Palatka, Florida.
Baird, S.F., N.T. Johnson, and A. Karama. 2014. Inventory and Analysis of Hydrologic
Data for Minimum Flows and Levels Determination for Silver River and Silver Springs, Marion County, Florida, Draft. St. Johns River Water Management District, Palatka, Florida.
Banning, J.L. 2010. A Benthic Macroinvertebrate Survey of a Non-Wadeable, Spring-
Fed Stream in Florida (Rainbow River). University of Tampa, Tampa, Florida. Benke, A.C. and J.B. Wallace. 1990. Wood dynamics in coastal plain blackwater
streams. Canadian Journal of Fisheries and Aquatic Sciences 47:92–99. Benke, A.C., T.C. Van Arsdall, Jr., D.M. Gillespie, and F.K. Parrish. 1984. Invertebrate
productivity in a subtropical blackwater river: the importance of habitat and life history. Ecological Monographs 54:25–63.
Benke, A.C., R.L Henry, III, D.M. Gillespie, and R.J. Hunter. 1985. Importance of the
snag habitat for animal production in a Southeastern stream. Fisheries 10:8–13. Biggs, B.J.F. 1996. Hydraulic habitat of plants in streams. Regulated Rivers: Research &
Management 12:131–144.
111

Biggs, B.J.F., D.G. Goring, and V.I. Nikora. 1998. Subsidy and stress responses of stream periphyton to gradients in water velocity as a function of community growth form. Journal of Phycology 34:598–607.
Bovee, K.D., B.L. Lamb, J.M. Bartholow, C.B. Stalnaker, J. Taylor, and J. Hendrickson.
1998. Stream Habitat Analysis Using the Instream Flow Incremental Methodology. Information and Technology Report USGS/BRD-1998-0004. U.S. Geological Survey, Biological Resources Division, Fort Collins, Colorado.
Cichra, C.E. and S.M. Holland. 2012. Rainbow River Environmental Study, Dunnellon,
Florida, Final Report. Contract RP828. Funded by the Florida Department of Environmental Protection, Division of Recreation and Parks, Tallahassee, Florida.
Cohen, M.J., J.B. Heffernan, A. Albertin, R. Hensley, M. Fork, C. Foster, and L. Korhnak.
2013. Mechanisms of Nitrogen Removal in Spring-Fed Rivers, Special Publication 2013-SP2. Prepared for the St. Johns River Water Management District, Palatka, Florida.
Cohen, M., R. Hensley, N. Anderson, and L. Korhnak. 2015. Sediment and Algal
Dynamics in the Rainbow River, 2015 Annual Report. Prepared for the Southwest Florida Water Management District, Brooksville, Florida.
Cowell, B.C. and P.S. Botts. 1994. Factors influencing the distribution, abundance and
growth of Lyngbya wollei in Central Florida. Aquatic Botany 49:1–17. Cudney, M.D. and J.D. Wallace. 1980. Life cycles, microdistribution and production
dynamics of six net-spinning caddisflies in a large southeastern (USA) river. Holarctic Ecology 3:169–182.
DEP (Florida Department of Environmental Protection). 1996. Unpublished electronic
and hard copy data collected by DEP Rainbow Springs Aquatic Preserve Staff Circa 1996. Rainbow River Aquatic Preserve. Florida Department of Environmental Protection, Bureau of Coastal and Aquatic Managed Areas, Tallahassee, Florida.
DEP. 2002. Rainbow Springs State Park Unit Management Plan. Florida Department of
Environmental Protection, Environmental Assessment Section, Tallahassee, Florida.
DEP. 2008. Monitoring Report for Eighteen State and Federally Managed Spring
Systems in Florida-Year 2000 to 2007. Florida Department of Environmental Protection, Environmental Assessment Section, Tallahassee, Florida.
DEP. 2015a. Basin Management Action Plan for the Implementation of Total Maximum
Daily Loads Adopted by the Florida Department of Environmental Protection in the Rainbow Springs Basin Management Area for Rainbow Springs Group and the Rainbow Springs Group Run. Division of Environmental Assessment and Restoration, Florida Department of Environmental Protection, Tallahassee, Florida.
DEP. 2015b. Basin Management Action Plan for the Implementation of Total Maximum
Daily Loads Adopted by the Florida Department of Environmental Protection in the Silver Springs Basin Management Area for Silver Springs, Silver Springs Group,
112

and Upper Silver River. Division of Environmental Assessment and Restoration, Florida Department of Environmental Protection, Tallahassee, Florida.
DEP. 2015c. Rainbow Springs Aquatic Preserve Management Plan, October 2015 Draft.
Florida Department of Environmental Protection, Florida Coastal Office, Tallahassee, Florida. 96 pp.
Downing, H.C., Jr., M.S. Flannery, M.J. Buikerood, J.A. Mann, and W.M. Matheison. 1989.
Lake Rousseau Operations and Management Study. Southwest Florida Water Management District, Brooksville, Florida.
Dunbar, M.J., A. Gustard, M.C. Acreman, and C.R. Elliott. 1998. Overseas Approaches
to Setting River Flow Objectives. Institute of Hydrology, R&D Technical Report W6-161, Oxon, England.
ECT (Environmental Consulting and Technology, Inc.). 2017. HEC-RAS Modeling of
Rainbow River MFL Technical Support – Freshwater Stream. Prepared for the Southwest Florida Water Management District, Brooksville, Florida.
Edwards, R.T. and J. L. Meyer. 1987. Metabolism of a sub-tropical low gradient
blackwater river. Freshwater Biology 17:251–263. Ellis, G.D., K. Nash, J. Dean, and R. Martin. 2007. Rainbow River Sediment Study.
Prepared for the Southwest Florida Water Management District, Brooksville, Florida. Enfield, D.B., A.M. Mestas-Nuñez, and P.J. Trimble. 2001. The Atlantic Multidecadal
Oscillation and its relation to rainfall and river flows in the Continental U.S. Geophysical Research Letters 28:2077–2080.
FGS (Florida Geological Survey). 2004. Springs of Florida. Florida Geological Survey
Bulletin No. 66, Tallahassee, Florida. FGS. 2009. Hydrogeological Units of Florida, Florida Geological Survey Special
Publication No. 28, Revised, Tallahassee, Florida. Flannery, M.S., E.B. Peebles, and R.T. Montgomery. 2002. A percent-of-flow approach
to managing reductions in freshwater inflows from unimpounded rivers to Southwest Florida estuaries. Estuaries 25:1318–1332.
FSI (Howard T. Odum Florida Springs Institute). 2016. Rainbow Springs Baseline
Ecosystem Assessment. Prepared by the Howard T. Odum Florida Springs Institute, High Springs, Florida.
GARI (Gulf Archaeology Research Institute). 2007. Rainbow River Sediment Study.
Crystal River, Florida. Gore, J.A., J.B. Layzer, and J. Mead. 2001. Macroinvertebrate instream flow studies
after 20 years: a role in stream and river restoration. Regulated Rivers 17:527–542.
113

Gore, J.A., C. Dahm, and C. Klimas. 2002. A Review of “Upper Peace River: An Analysis of Minimum Flows and Levels.” Prepared for the Southwest Florida Water Management District, Brooksville, Florida.
Hancock, M.C., D.A. Leeper, M.D. Barcelo, M.H. Kelly. 2010. Minimum Flows and
Levels Development, Compliance, and Reporting in the Southwest Florida Water Management District. Southwest Florida Water Management District. Brooksville, Florida.
Harrington, D., G. Maddox, and R. Hicks. 2010. Florida Springs Initiative Monitoring
Network Report and Recognized Sources of Nitrate. Division of Environmental Assessment and Restoration, Florida Department of Environmental Protection, Tallahassee, Florida.
Heffernan, J., D. Liebowitz, T. Frazer, J. Evans, and M. Cohen. 2010. Algal blooms and
the nitrogen-enrichment hypothesis in Florida springs: evidence, alternatives, and adaptive management. Ecological Applications 20:816–829.
Helsel, D.R. and R.M. Hirsh. 2002. Statistical Methods in Water Resources, Techniques
of Water Resources Investigations Book 4, Chapter A3. U.S. Geological Survey, Fort Collins, Colorado.
Heyl, M.G. 2012. Impact of Flow on NO3+NO2-N Concentration in Six Florida Spring
Discharges, Updated April 6, 2012. Southwest Florida Water Management District Memo to File, Brooksville, Florida.
HGL (HydroGeoLogic, Inc.). 2008. Computer Flow and Saltwater Intrusion Model for the
Northern District Water Resources Assessment Project. HGL. 2011. MODHMS Software (Version 3.0) Documentation, Volume I: Groundwater
Flow Modules. HGL. 2013. Northern District Groundwater Flow Model, Version 4.0. HGL and Dynamic Solutions, Inc. 2016. Northern District Groundwater Flow Model,
Version 5.0. Prepared for the St. Johns River Water Management District, Palatka, Florida and the Southwest Florida Water Management District, Brooksville, Florida.
Hill, J.E. and J. Sowards. 2015. Successful eradication of the non-native loricariid catfish
Pterygoplichthys disjunctivus from the Rainbow River, Florida. Management of Biological Invasions 6:311–317.
Hill, M.T., W.S. Platts, and R.L. Beschta. 1991. Ecological and geological concepts for
instream and out-of-channel flow requirements. Rivers 2:198–210. Hilton, J., M. O’Hare, M.J. Bowes, and J.I. Jones. 2006. How green is my river? A new
paradigm of eutrophication in rivers. Science of the Total Environment 365:66–83. Holland, K. and R. Hicks. 2013. Nutrient TMDL for Rainbow Springs Group and Rainbow
Springs Group Run (WBIDs 1320A and 1320B). Prepared by Ground Water
114
Management Section, Florida Department of Environmental Protection, Tallahassee, Florida.
Holzwart, K.R., Y. Ghile, R. Basso, S. Day, and D. Leeper. 2016. Recommended
Minimum Flow for the Rainbow River System, Peer Review Draft. Southwest Florida Water Management District. Brooksville, Florida.
Hoyer, M.V., T.K. Frazer, S.K. Notestein, and D.E. Canfield, Jr. 2004. Vegetative
characteristics of three low-lying Florida coastal rivers in relation to flow, light, salinity and nutrients. Hydrobiologia 528:31–43.
HSW (HSW Engineering, Inc.). 2009. Water Resource and Human Use Assessment of
the Rainbow River in Marion County, Florida, Draft. Prepared for the Southwest Florida Water Management District, Brooksville, Florida.
Huestis, D.L. and P.A. Meylan. 2004. The turtles of Rainbow Run (Marion County,
Florida): observation on the genus Pseudemys. Southeastern Naturalist 3:595–612. Johnson, D.H. 1980. The comparison of usage and availability measurements for
evaluating resource preference. Ecology 69:125–134. Jones, G.W., S.B. Upchurch, and K.M. Champion. 1996. Origin of Nitrate in Ground Water
Discharging from Rainbow Springs, Marion County, Florida. Ambient Ground-Water Quality Monitoring Program, Southwest Florida Water Management District, Brooksville, Florida.
Jowett, I.G. 1993. Minimum Flow Requirements for Instream Habitat in Wellington
Rivers. New Zealand Freshwater Miscellaneous Report No. 63. National Institute of Water and Atmospheric Research, Christchurch, New Zealand.
Kelly, M. and J. Gore. 2008. Florida river flow patterns and the Atlantic Multidecadal
Oscillation, River Research and Applications 24:598–616. King, S.A. 2014. Hydrodynamic control of filamentous macroalgae in a sub-tropical
spring-fed river in Florida, USA. Hydrobiologia 734:27–37. Knowles, L. 1996. Estimation of Evapotranspiration in the Rainbow Springs and Silver
Springs Basins in North-Central Florida. U.S. Geological Survey Water-Resources Investigations Report 96–4024. Prepared in cooperation with the Southwest Florida Water Management District and St. Johns River Water Management District, U.S. Geological Survey, Tallahassee, Florida.
Knowles, L., Jr., A.M. O’Reilly, and J.C. Adamski. 2002. Hydrogeology and Simulated
Effects of Ground-Water Withdrawals From the Floridan Aquifer System in Lake County and in the Ocala National Forest and Vicinity, North-Central Florida. U.S. Geological Survey Water-Resources Investigations Report 02–4207. Prepared in cooperation with the Lake County Water Authority, St. Johns River Water Management District, and Southwest Florida Water Management District, U.S. Geological Survey, Tallahassee, Florida.
115

Leeper, D.A. 2016. IOP/MFLs Datum – 1.00. Subject: Incorporating Elevation Data Referenced to the North American Vertical Datum of 1988 (NAVD88) into Minimum Flows and Levels Data Collection, Summarization, Reporting and Rule Development. Natural Systems and Restoration Bureau and Water Resource Bureau, Internal Operating Procedures, Southwest Florida Water Management District. Brooksville, Florida.
Leonard, P.M. and D.J. Orth. 1988. Use of guilds of fishes to determine instream flow
requirements. North American Journal of Fisheries Management 8:399–409. Lewelling, B.R. 2004. Extent of Areal Inundation of Riverine Wetlands Along Five River
Systems in the Upper Hillsborough River Watershed, West-Central Florida. U.S. Geological Survey Water Resources Investigations Report 2004–5133. Prepared in cooperation with the Southwest Florida Water Management District, U.S. Geological Survey, Tampa, Florida.
Mace, J. 2006. Minimum Flows and Levels Determination: St. Johns River at SR 44
near DeLand, Volusia County, FL. Technical Publication SJ2006-5, St. Johns River Water Management District, Palatka, Florida.
Manly, B.F.J., L.L. McDonald, and D.L. Thomas. 1993. Resource Selection by Animals:
Statistical Design and Analysis for Field Studies. Chapman and Hall, London, England.
Marchand, L.J. 1942. A Contribution to a Knowledge of the Natural History of Certain
Freshwater Turtles. Master’s Thesis, University of Florida, Gainesville, Florida. Marella, R. 2008. Water Use in Florida 2005, and Trends 1950–2005, U.S. Geological
Survey Fact Sheet 2008-3080. U.S. Geological Survey, Tallahassee, Florida.
Marraffino, S. and P. Marraffino. 2006. Survey of Birds Along the Lower Rainbow River in Dunnellon Florida. Prepared for Rainbow River Conservation, Inc., Dunnellon, Florida.
McDonald, M.G. and A.W. Harbaugh. 1988. A Modular Three-Dimensional Finite-
Difference Groundwater Flow Model. U.S. Geological Survey Techniques of Water Resources Investigations Book 6, Chapter A1. U.S. Geological Survey, Fort Collins, Colorado.
Meylan, P.A., C.A. Stevens, M.E. Barnwell, and E.D. Dohm. 1992. Observation on the
turtle community of Rainbow Run, Marion Co., Florida. Florida Scientist 55:219–228.
Milhous, R.T., J.M. Bartholow, M.A. Updike, and A.R. Moos. 1990. Reference Manual for
Generation and Analysis of Habitat Time Series – Version II. U.S. Fish and Wildlife Service, Biol. Rpt. 90(16), Fort Collins, Colorado.
Miller, J.A. 1986. Hydrogeologic Framework of the Floridan Aquifer System in Florida
and in Parts of Georgia, Alabama, and South Carolina. U.S. Geological Survey Professional Paper 1403-B, Washington, D.C.
116

Motz, L. and A. Dogan. 2004. North-Central Florida Active Water-Table Regional Groundwater Flow Model, St. Johns River Water Management District, Palatka, Florida.
Mumma, M.T., C.E. Cichra, and J.T. Sowards. 1996. Effects of recreation on the
submersed aquatic plant community of Rainbow River, Florida. Journal of Aquatic Plant Management 34:53–56.
Neubauer, C.P., G.B. Hall, E.F. Lowe, C.P. Robison, R.B. Hupalo, and L.W. Keenan.
2008. Minimum Flows and Levels Method of the St. Johns River Water Management District. Environmental Management 42:1101–1114.
Olsen, S.B. and B.D. Richter. 2006. Managing Freshwater Inflows to Estuaries – A
Methods Guide. U.S. Agency for International Development. Washington, D.C. PBS&J. 2000. Rainbow Springs Preserve 2000 Vegetation Mapping and Change
Analysis Report. Prepared for the Florida Department of Environmental Protection, Bureau of Coastal and Aquatic Managed Areas, Tallahassee, Florida.
PBS&J. 2008. Characterization of Woody Wetland Vegetation Communities Along the
Rainbow River, Draft. Prepared for the Southwest Florida Water Management District, Brooksville, Florida.
PBS&J and Debra Childs Woithe, Inc. 2007. Rainbow River 2005 Vegetation Mapping
and Evaluation Report. Prepared for the Southwest Florida Water Management District, Tampa, Florida. SWFWMD SWIM Project #W419.
Poff, N.L., J.D. Allan, M.B. Bain, J.R. Karr, K.L. Prestegaard, B.D. Richter, R.E. Sparks,
and J.C. Stromberg. 1997. The natural flow regime. Bioscience 47:769–784. Postel, S. and B. Richter. 2003. Rivers for Life: Managing Water for People and Nature.
Island Press, Washington, D.C. Powell, G.L., J. Matsumoto, and D.A. Brock. 2002. Methods for determining minimum
freshwater inflow needs of Texas Bays and estuaries. Estuaries and Coasts 25: 1262–1274.
Richter, B.D., J.V. Baumgartner, J. Powell, and D.P. Braun. 1996. A method for
assessing hydrologic alteration within ecosystems. Conservation Biology 10:1163–1174.
Richter, B.D., M.M. Davis, C. Apse, and C. Konrad. 2011. A presumptive standard for
environmental flow protection. River Research and Applications. Published online. DOI 10.1002/rra.1511
Ryder, P. 1982. Digital Model of Predevelopment Flow in the Tertiary Limestone
(Floridan) Aquifer System in West-Central Florida, U.S. Geological Survey Water-Resources Investigations Report 81–54, Tallahassee, Florida.
Ryder, P. 1985. Hydrology of the Floridan Aquifer System in West-Central Florida: U.S.
Geological Survey Professional Paper 1403–F, Washington, D.C.
117

Sacks, L.A. and A.B. Tihansky. 1996. Geochemical and Isotopic Composition of
Ground Water with Emphasis on Sources of Sulfate in the Upper Floridan Aquifer and Intermediate Aquifer System in Southwest Florida, U.S. Geological Survey WRI Report 96–4146. Prepared in cooperation with the Southwest Florida Water Management District, U.S. Geological Survey, Tallahassee, Florida.
Scheele, D.S. 1975. Reality Construction as a Product of Delphi Interaction. Pp. 37–41
in H.A. Linstone and M. Turoff (eds.), The Delphi Method: Techniques and Applications. Addison-Wesley, Reading, Massachusetts.
Seerley, D.W., J.E. Kundell, and M. Myszewski. 2006. Balancing Instream and
Offstream Uses: Instream Flows, Surface Storage and Aquifer Management, a Report to the Georgia Environmental Protection Division. Carl Vinson Institute of Government, University of Georgia, Athens, Georgia.
Sepulveda, N. 2002. Simulation of Ground-Water Flow in the Intermediate and Floridan
Aquifer Systems in Peninsular Florida. U.S. Geological Survey WRI Report 02-4009, U.S. Geological Survey, Tallahassee, Florida. 130 pp.
SFWMD (South Florida Water Management District). 2002. Final Draft – Technical
Documentation to Support Development of Minimum Flows and Levels for the Northwest Fork of the Loxahatchee River. West Palm Beach, Florida
Smock, L.A., E. Gilinsky, and D.L. Stoneburner. 1985. Macroinvertebrate production in a
southeastern U.S. blackwater stream. Ecology 66:1491–1503. Stalnaker, C., B.L. Lamb, J. Henriksen, K. Bovee, and J. Bartholow. 1995. The Instream
Flow Incremental Methodology: A Primer for IFIM. Biological Report 29. U.S. Department of the Interior, National Biological Service, Washington, D.C.
Stevenson, R.J. 1996. The Stimulation and Drag of Current. Pp. 321–340 in R.J.
Stevenson, M.L. Bothwell and R.L. Lowe (eds.), Algal Ecology: Freshwater Benthic Ecosystems. Academic Press, Inc., San Diego, California.
Stevenson, R., A. Pinowska, and Y.-K. Wang. 2004. Ecological Condition of Algae and
Nutrients in Florida Springs. WM858, Florida Department of Environmental Protection. Tallahassee, Florida.
Stevenson, R., A. Pinowska, A. Albertin, and J.O. Sickman. 2007. Ecological Condition
of Algae and Nutrients in Florida Springs: The Synthesis Report. WM 858, Florida Department of Environmental Protection. Tallahassee, Florida.
Stuber, R.J., G. Gebhardt, and O.E. Maughan. 1982. Habitat Suitability Index Models:
Largemouth Bass. U.S. Fish and Wildlife Service, FWS/OBS-82/10.16, Washington, D.C.
SWFWMD (Southwest Florida Water Management District). 1987. Ground-Water
Resource Availability Inventory: Marion County, Florida. Brooksville, Florida.
118

SWFWMD. 1999. Aquifer Characteristics within the Southwest Florida Water
Management District. Brooksville, Florida. SWFWMD. 2015a. Springs Management Plan, 2015–2019. Southwest Florida Water
Management District, Springs and Environmental Flows Section, Brooksville, Florida.
SWFWMD. 2015b. Rainbow River Surface Water Surface Water Improvement and
Management (SWIM) Plan, A Comprehensive Conservation and Management Plan. Springs Coast Steering Committee, Brooksville, Florida.
Tharme R.E. and J.M. King. 1998. Development of the Building Block Methodology for
Instream Flow Assessments, and Supporting Research on the Effects of Different Magnitude Flows on Riverine Ecosystems. Water Research Commission Report No. 576/1/98, Pretoria, South Africa.
Thorp, J.H., E.M. McEwan, M.F. Flynn, and F.R. Hauer. 1990. Invertebrate colonization
of submerged wood in a cypress-tupelo swamp and blackwater stream. American Midland Naturalist 113:56–68.
Waddle, T.E. 2012. PHABSIM for Windows User’s Manual and Exercises: U.S.
Geological Survey Open-File Report 2001-340. Fort Collins, Colorado. Wallace, J.B. and A.C. Benke. 1984. Quantification of wood habitat in subtropical
Coastal Plain streams. Canadian Journal of Fisheries and Aquatic Sciences 41:1643–1652.
Walsh, S.J. and J.D. Williams. 2003. Inventory of Fishes and Mussels in Springs and
Spring Effluents of North-Central Florida State Parks. Final report submitted to the Florida Park Service. Prepared by the U.S. Geological Survey, Gainesville, Florida.
WAR (Water & Air Research, Inc.). 1991. Diagnostic Studies of the Rainbow River.
Prepared for the Southwest Florida Water Management District. Brooksville, Florida. WAR. 2016. Final Report for Rainbow River 2015 Aquatic Vegetation Coverage.
Prepared for the Southwest Florida Water Management District. Brooksville, Florida. WRA (Water Resources Associates, Inc.) 2005. Marion County Spring Protection
Program Strategies and Recommendations for Protecting Silver and Rainbow Springs. Marion County, Florida.
WSI (Wetland Solutions, Inc.). 2010. An Ecosystem-Level Study of Florida’s Springs.
FWC Project Agreement No. 08010. Prepared for the Florida Fish and Wildlife Conservation Commission, St. Johns River Water Management District, Southwest Florida Water Management District, Florida Park Service, Florida Springs Initiative, and Three Rivers Trust, Inc.
WSI and FSI. 2013. Rainbow Springs Restoration Action Plan. Prepared for Rainbow
River Conservation, Inc., Dunnellon, Florida.
119

Williams, L.J., A.D. Dausman, and J.C. Bellino. 2011. Relation of aquifer confinement and long-term groundwater-level decline in the Floridan aquifer system: Proceedings of the 2011 Georgia Water Resources Conference, April 11-13, 2011, Athens, Georgia.
Zappalorti, R.T. and J.E. Iverson. 2006. Sternotherus minor — Loggerhead Musk
Turtle. Chelonian Research Monographs 3:197–206. Zuboy, J.R. 1981. A new tool for fisheries managers: the Delphi technique. North
American Journal of Fisheries Management 1:55-59.
120

Appendices Appendix A: Peer Review of the Recommended Minimum Flow for the Rainbow River System. Prepared by M.J. Cohen, L. Wilson, and D. Yobbi for the Southwest Florida Water Management District, Brooksville, Florida. 2016. Appendix B: Meeting Summary, Southwest Florida Water Management District, Proposed Minimum Flow for the Rainbow River System Public Workshop, Dunnellon City Hall, Dunnellon, Florida. 2017. Appendix C: District Response to the Peer Review of the Recommended Minimum Flow for the Rainbow River System. Prepared by K.R. Holzwart, R. Basso, D. Leeper, Y. Ghile, S. Day, S. King, Southwest Florida Water Management District, Brooksville, Florida. 2017. Appendix D: Stakeholder Comments Regarding the Recommended Minimum Flow for the Rainbow River System. Appendix E: Graphs of Flow vs. Nitrate Concentration (After the Effect of Time is Removed) for Rainbow River System District Water Quality Monitoring Sites. Appendix F: Characterization of Woody Wetland Vegetation Communities Along the Rainbow River, Draft. Prepared by PBS&J for the Southwest Florida Water Management District, Brooksville, Florida. 2008. Appendix G: Final Report for Rainbow River 2015 Aquatic Vegetation Coverage. Prepared by Water and Air Research, Inc. for the Southwest Florida Water Management District, Brooksville, Florida. 2015. Appendix H: Water Resource and Human Use Assessment of the Rainbow River in Marion County, Florida, Draft. Prepared by HSW Engineering, Inc. for the Southwest Florida Water Management District, Brooksville, Florida. 2009. Appendix I: HEC-RAS Modeling of Rainbow River, MFL Technical Support—Freshwater Stream Final Report. Prepared by Environmental Consulting & Technology, Inc. for the Southwest Florida Water Management District, Brooksville, Florida. 2015. Appendix J: Rainbow River System PHABSIM Modeling Methods and Results.
121