recommendations for tier i energy star computer specification
TRANSCRIPT

Recommendations for Tier I ENERGY STAR® Computer
SpecificationAustin, TX
June 21, 2005
Noah Horowitz
Sr. Scientist
Natural Resources Defense [email protected]
(415) 875-6100

Agenda
1. Idle state definition
2. Idle state test method
3. Results of field measurements
4. Significance of idle to overall savings potential
5. Policy recommendations
6. Strategies for reducing idle power use
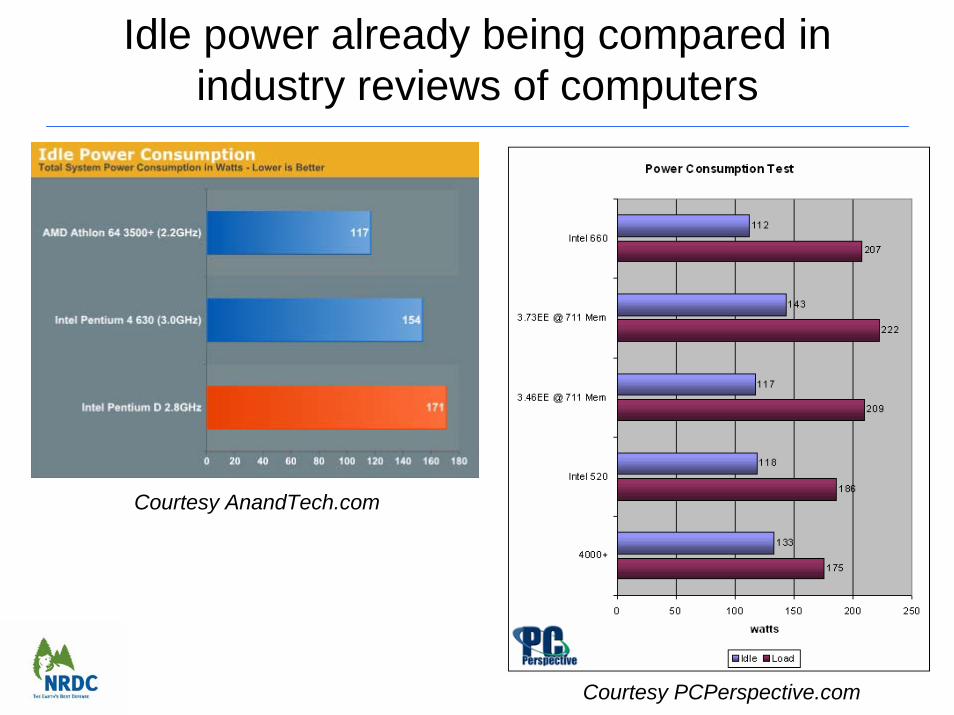
Idle power already being compared in industry reviews of computers
Courtesy AnandTech.com
Courtesy PCPerspective.com

Idle State is part of Active Mode
• Active mode -- a wide range of operating conditions including all high performance states and idle state
• High performance state and power use (everything in active mode other than idle state):
– heavy CPU utilization, ongoing changes to information being displayed on the screen, hard drive and optical drive activity, network activity, etc.
– Examples: Downloading/sending email or retrieving files from server; saving file to hard drive, manipulating images in visual editing program, ongoing changes to information being displayed on screen, playing music or a DVD, playing a game
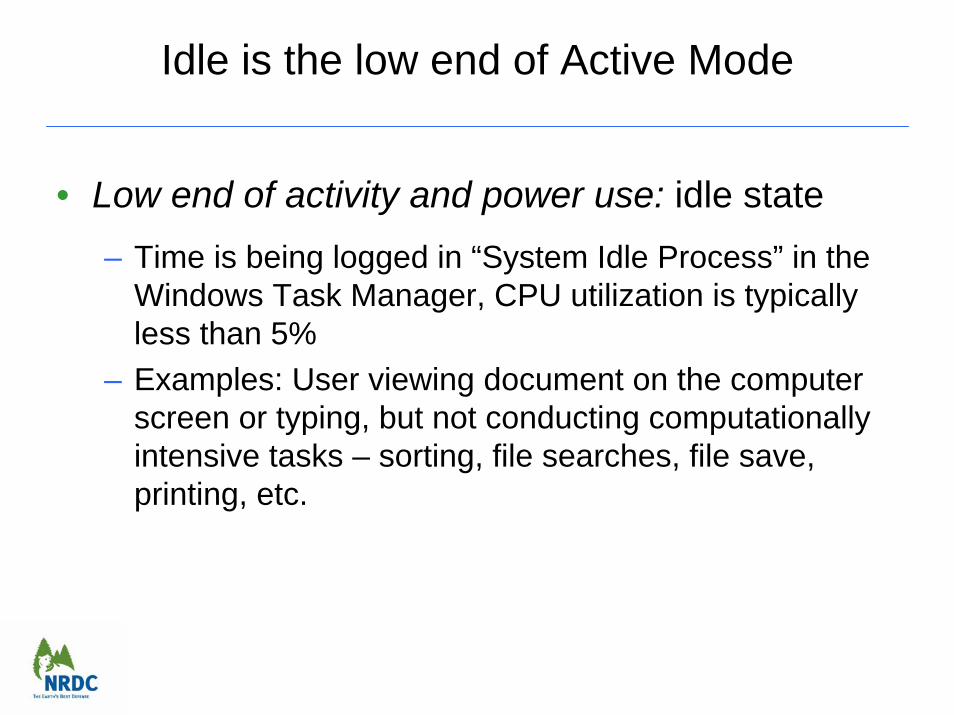
Idle is the low end of Active Mode
• Low end of activity and power use: idle state– Time is being logged in “System Idle Process” in the
Windows Task Manager, CPU utilization is typically less than 5%
– Examples: User viewing document on the computer screen or typing, but not conducting computationally intensive tasks – sorting, file searches, file save, printing, etc.
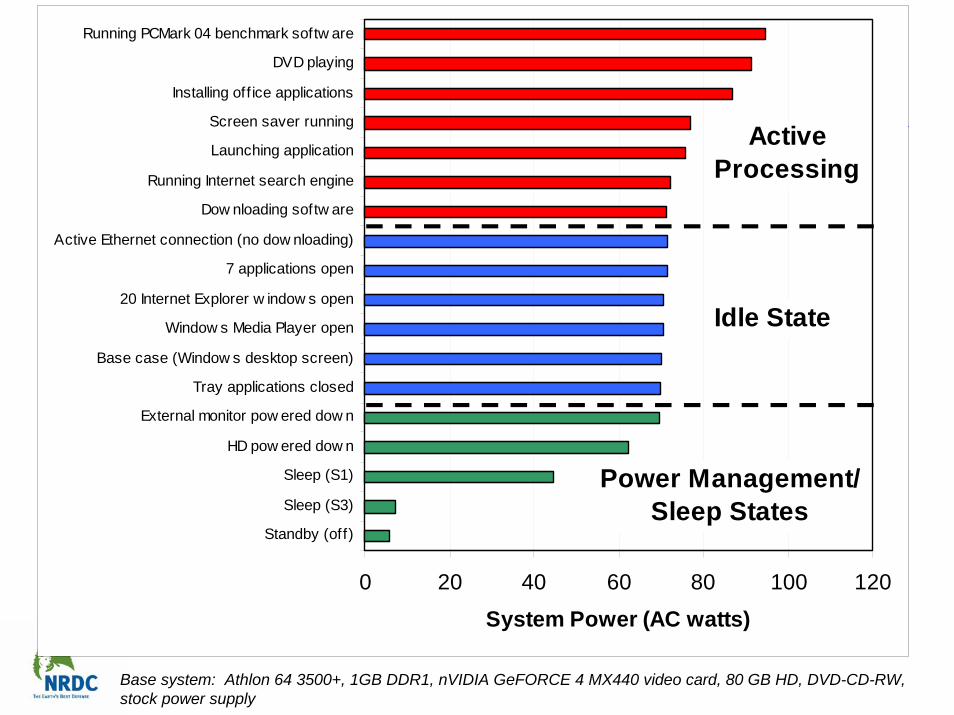
0 20 40 60 80 100 120
Standby (off)
Sleep (S3)
Sleep (S1)
HD pow ered dow n
External monitor pow ered dow n
Tray applications closed
Base case (Window s desktop screen)
Window s Media Player open
20 Internet Explorer w indow s open
7 applications open
Active Ethernet connection (no dow nloading)
Dow nloading softw are
Running Internet search engine
Launching application
Screen saver running
Installing off ice applications
DVD playing
Running PCMark 04 benchmark softw are
System Power (AC watts)
Idle State
ActiveProcessing
Power Management/Sleep States
Base system: Athlon 64 3500+, 1GB DDR1, nVIDIA GeFORCE 4 MX440 video card, 80 GB HD, DVD-CD-RW,stock power supply

Proposed Definition of Idle State
A computer is in idle state when
• it is fully operational (not asleep) with all internal hardware and monitor connected
• operating system is fully loaded
• no hard drive or optical drive activity is occurring
• no Ethernet, modem, or wireless network connection is established
• no keyboard or mouse activity is occurring
• no additional USB or Firewire devices are connected
• no user input is occurring from the keyboard or mouse
• information displayed on screen is not changing
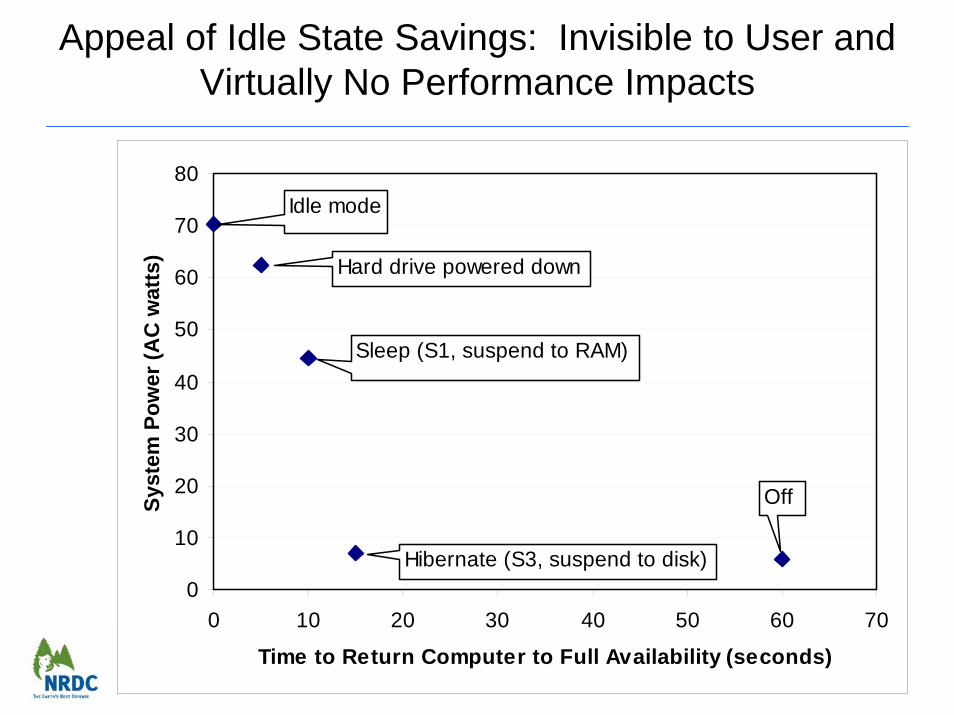
Appeal of Idle State Savings: Invisible to User and Virtually No Performance Impacts
0
10
20
30
40
50
60
70
80
0 10 20 30 40 50 60 70
Time to Return Computer to Full Availability (seconds)
Syst
em P
ower
(AC
wat
ts)
Idle mode
Hard drive powered down
Sleep (S1, suspend to RAM)
Hibernate (S3, suspend to disk)
Off
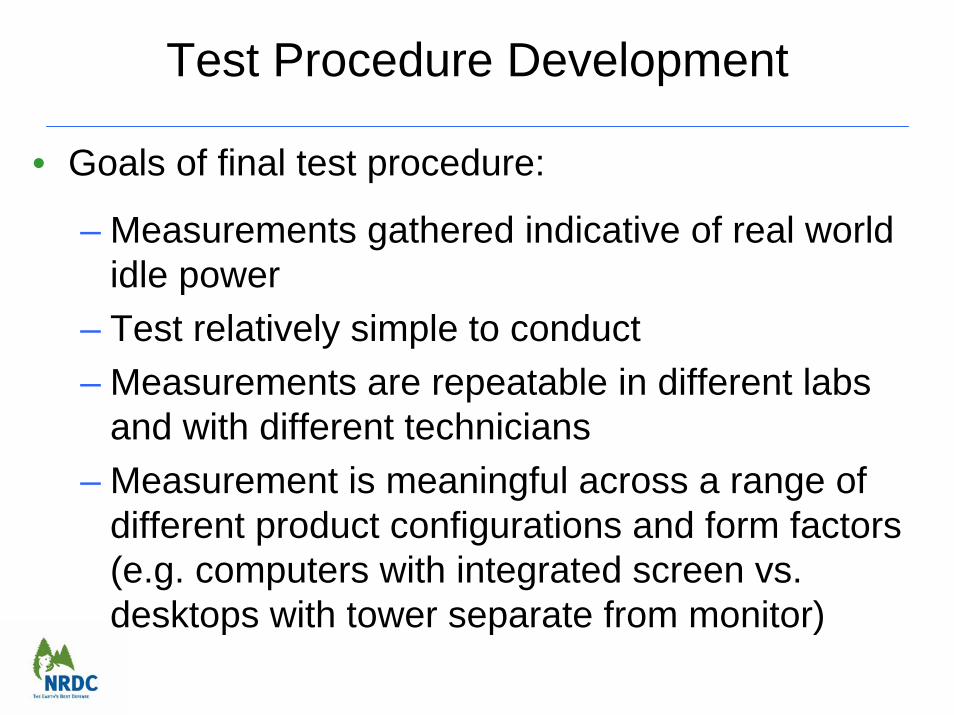
Test Procedure Development
• Goals of final test procedure:
– Measurements gathered indicative of real world idle power
– Test relatively simple to conduct– Measurements are repeatable in different labs
and with different technicians– Measurement is meaningful across a range of
different product configurations and form factors (e.g. computers with integrated screen vs. desktops with tower separate from monitor)
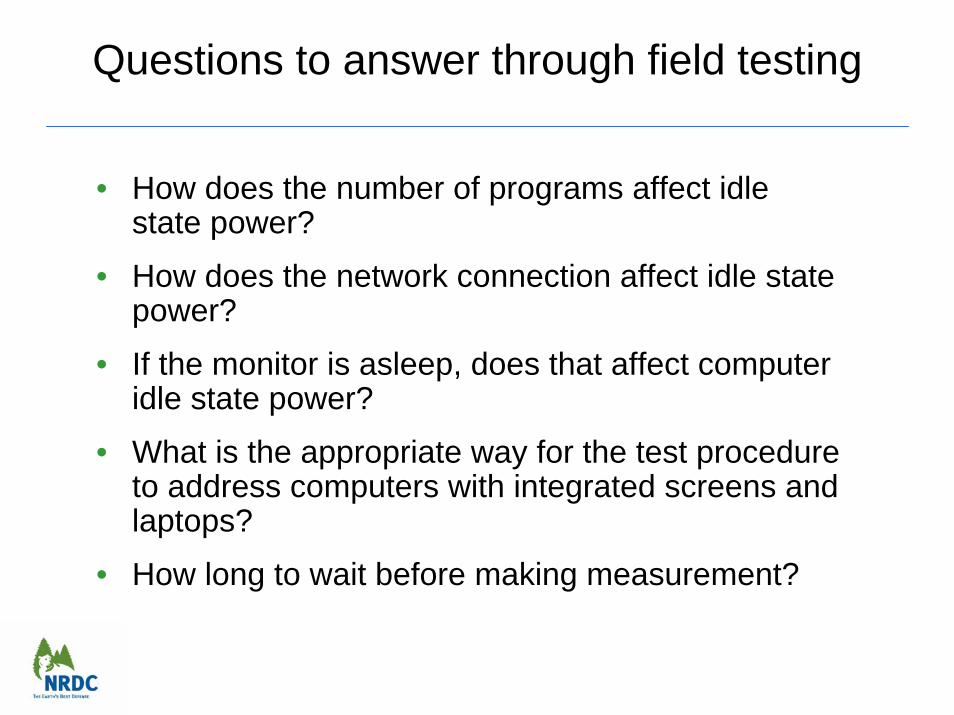
Questions to answer through field testing
• How does the number of programs affect idle state power?
• How does the network connection affect idle state power?
• If the monitor is asleep, does that affect computer idle state power?
• What is the appropriate way for the test procedure to address computers with integrated screens and laptops?
• How long to wait before making measurement?
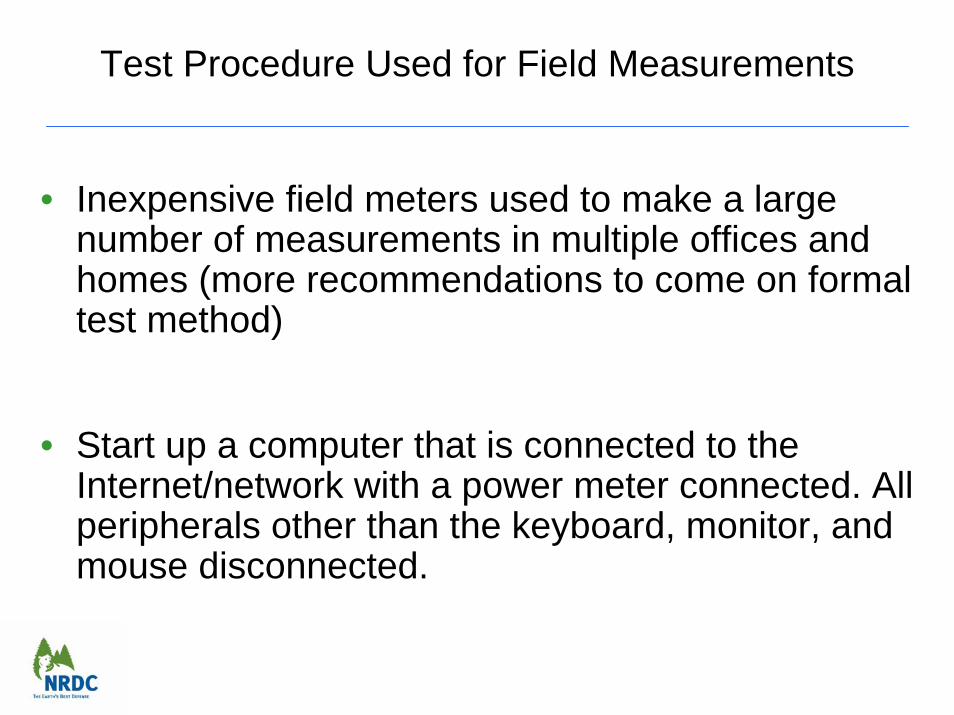
Test Procedure Used for Field Measurements
• Inexpensive field meters used to make a large number of measurements in multiple offices and homes (more recommendations to come on formal test method)
• Start up a computer that is connected to the Internet/network with a power meter connected. All peripherals other than the keyboard, monitor, and mouse disconnected.

Making the Measurement
• Record the max, min, and mode of the idle state power over a 5 minute period in the following configurations:– Desktop screen at the beginning of the start up process (with
programs that have automatically loaded open and operating) and network/Internet connected
– All programs (including those loaded during the startup process)closed, desktop screen displayed, network/Internet connected
– Desktop screen displayed, all programs closed and network/internet disconnected
Shorter version of test procedure was used in retail setting to capture idle model data for new computers
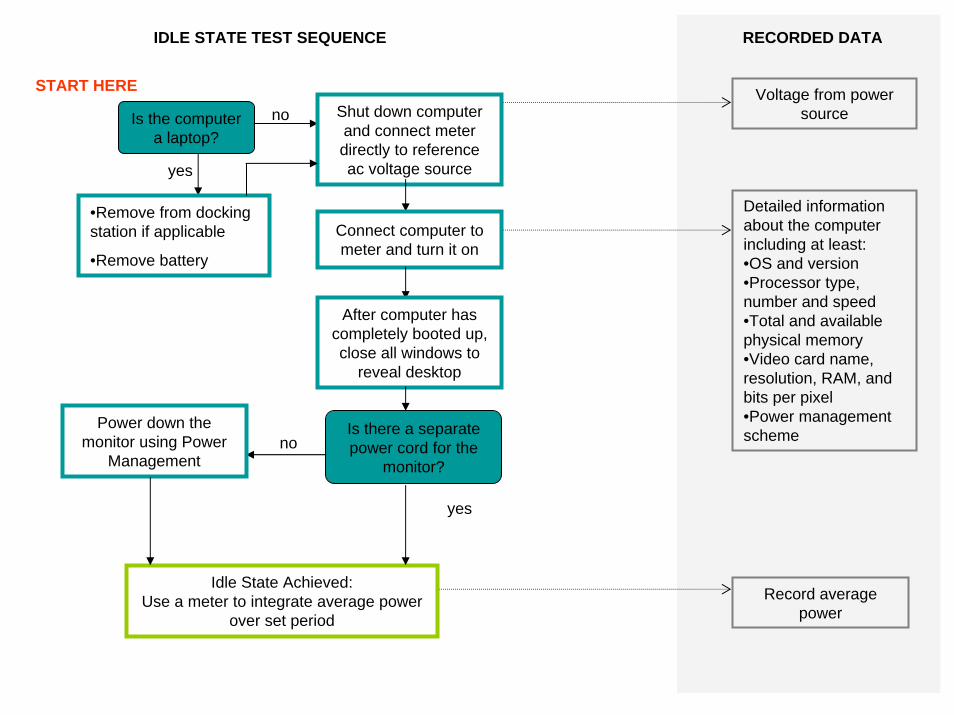
Idle State Achieved: Use a meter to integrate average power
over set period
START HERE
RECORDED DATA
•Remove from docking station if applicable
•Remove battery
Is the computer a laptop?
yes
no Shut down computerand connect meter directly to reference ac voltage source
Connect computer to meter and turn it on
After computer has completely booted up, close all windows to
reveal desktop
yes
Is there a separate power cord for the
monitor?no
Power down the monitor using Power
Management
Voltage from power source
Detailed information about the computer including at least:•OS and version•Processor type, number and speed•Total and available physical memory•Video card name, resolution, RAM, and bits per pixel•Power management scheme
Record average power
IDLE STATE TEST SEQUENCE
Characteristics of Desktops Tested
•Sample data included 7 manufacturers (Apple, Dell, Compaq, E-Machine, Gateway, HP, and Sony) and 3 Ecos-assembled units
•A total of 33 desktops were measured; 17 were measured in offices, 11 desktops were measured in retail stores, and several were measured in the Ecos lab
•Desktop processors ranged from basic to high performance•AMD: Athlon 64 3200+
•Intel: Celeron, Pentium 3, 4, and 4 HT
• Apple:G4 and G5
•Processor speeds ranged from 450 MHz to 3.4 GHz
•Video cards ranged from basic motherboard video cards to high performance video cards
•Data included 4 different operating systems (Mac OS X, Windows 2000 Pro, XP Pro, and XP Home)

Wide range of desktop power use in Idle State
0
4
8
14
5
2
0
2
4
6
8
10
12
14
16
0 to 20 20 to 40 40 to 60 60 to 80 80 to 100 100 to 120
AC Power in Idle State (W)
Des
ktop
Cou
nt
0
20
40
60
80
100
120
140
AC
Pow
er
in Id
le S
tate
(W)
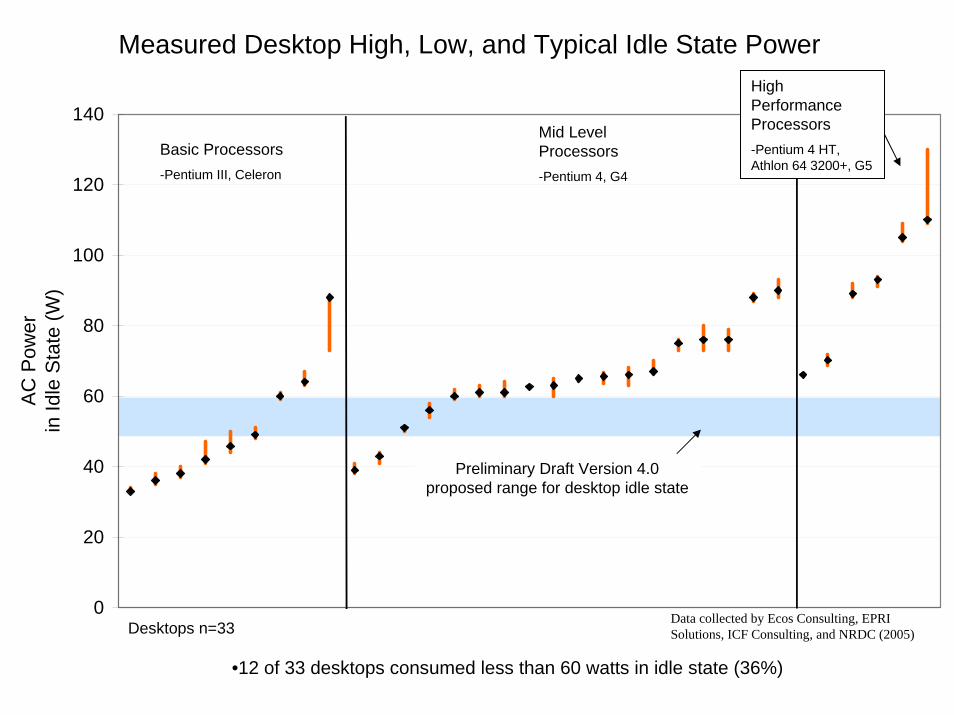
Measured Desktop High, Low, and Typical Idle State Power
Desktops n=33Data collected by Ecos Consulting, EPRI Solutions, ICF Consulting, and NRDC (2005)
Basic Processors-Pentium III, Celeron
Mid Level Processors-Pentium 4, G4
High Performance Processors-Pentium 4 HT, Athlon 64 3200+, G5
Preliminary Draft Version 4.0 proposed range for desktop idle state
•12 of 33 desktops consumed less than 60 watts in idle state (36%)

Key Field Measurement Findings
• 16 out of 33 desktops were tested in more detail– Disconnection from a network resulted in:
• No change in power consumption in 50% (8) of desktops tested• < 5% change in power consumption in 38% (6) of desktops tested
– Closing programs from the system tray had no effect on idle mode power consumption
– Number of windows/applications open had minimal (less than 2%) effect on power consumption
• Follow-up testing conducted on systems incorporating innovative design features to save energy
Characteristics of Laptops Tested
•Sample data included 13 manufacturers (Acer, Apple, Compaq, Dell, Fujitsu, Gateway, HP, IBM, MicronPC, MiTAC, Sharp PC, Sony, and Toshiba)
•A total of 71 laptops were measured; 42 were measured in offices, 21 laptops were measured in retail stores, and 8 were measured at LBNL
•Desktop processors ranged from basic to high performance•AMD: Athlon 4 to Athlon 64 2800+
•Intel: Pentium 2 to Pentium 4 HT
• Apple:G3 to G4
•Processor speeds ranged from 133 MHz to 3.3 GHz
•Video cards ranged from basic motherboard video cards to mid level video cards
•Data included 7 different operating systems (Mac OS 8.6, X, X 10.2.2, Windows 98, 2000 Pro, XP Pro, and XP Home)
0
10
20
30
40
50
60
AC
Pow
er in
Id
le S
tate
(W)
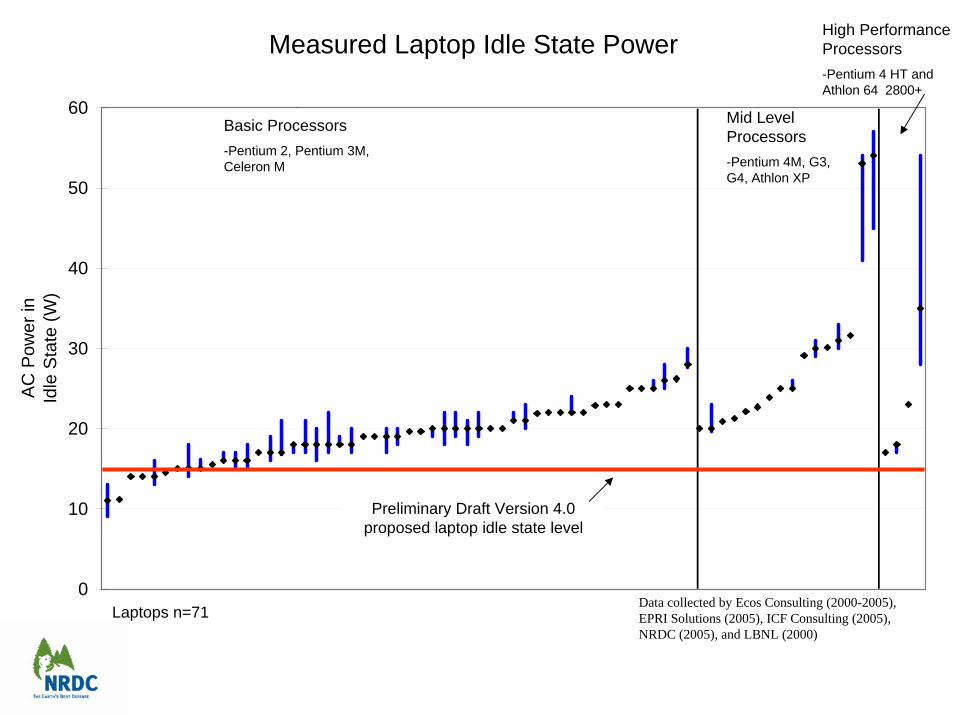
B i P * Mid Level Processors-Pentium 4M, G3, G4, Athlon XP
Basic Processors-Pentium 2, Pentium 3M, Celeron M
High Performance Processors-Pentium 4 HT and Athlon 64 2800+
Measured Laptop Idle State Power
Preliminary Draft Version 4.0 proposed laptop idle state level
Data collected by Ecos Consulting (2000-2005), EPRI Solutions (2005), ICF Consulting (2005), NRDC (2005), and LBNL (2000)
Laptops n=71

Questions about laptop measurements
• Current Idle State level too low for today’s models to meet?
• What screen settings used?
• What type of PM scenario used?
• Could “battery mode” settings become default factory setting? (processor power scaling even when plugged in)
Field Measurements Show Improved Opportunity for Energy Savings with Idle
• Current idle levels are higher than previously assumed. Leads to even greater saving potential.
• Computers, including high end models, are still capable of meeting proposed idle levels with hardware changes
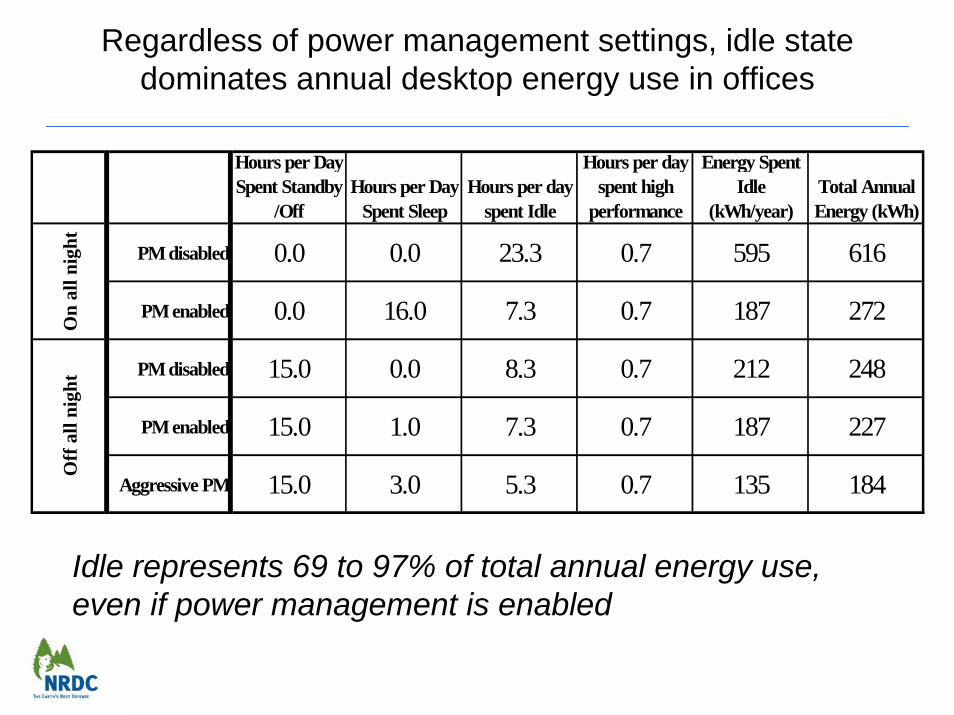
Regardless of power management settings, idle state dominates annual desktop energy use in offices
Hours per Day Spent Standby
/OffHours per Day
Spent SleepHours per day
spent Idle
Hours per day spent high
performance
Energy Spent Idle
(kWh/year)Total Annual Energy (kWh)
PM disabled 0.0 0.0 23.3 0.7 595 616
PM enabled 0.0 16.0 7.3 0.7 187 272
PM disabled 15.0 0.0 8.3 0.7 212 248
PM enabled 15.0 1.0 7.3 0.7 187 227
Aggressive PM 15.0 3.0 5.3 0.7 135 184
On
all n
ight
Off
all
nigh
t
Idle represents 69 to 97% of total annual energy use, even if power management is enabled
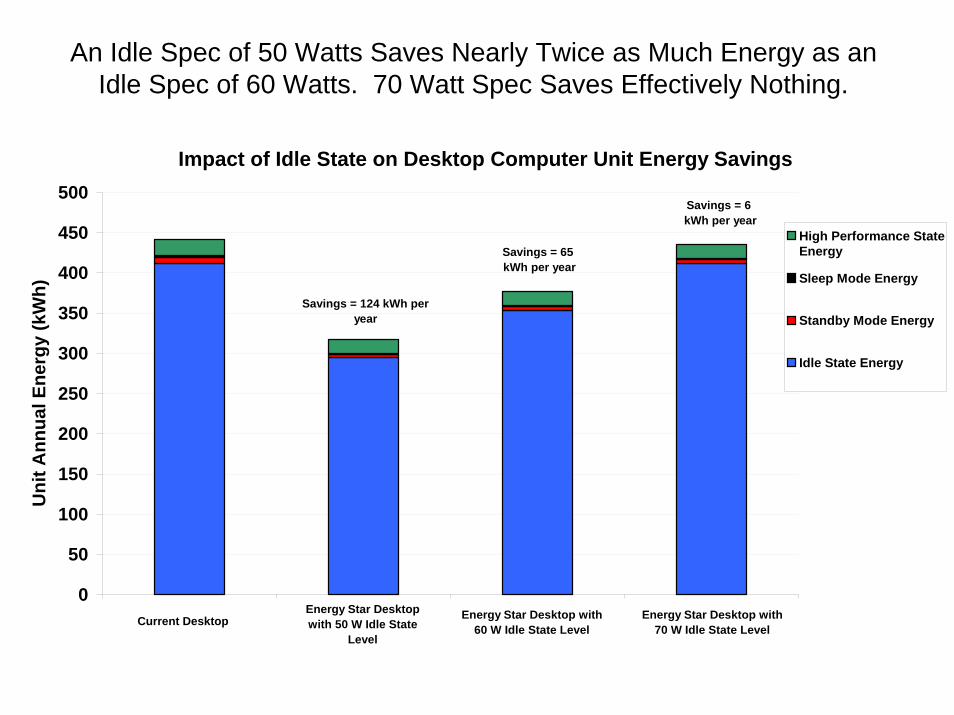
An Idle Spec of 50 Watts Saves Nearly Twice as Much Energy as anIdle Spec of 60 Watts. 70 Watt Spec Saves Effectively Nothing.
Impact of Idle State on Desktop Computer Unit Energy Savings
0
50
100
150
200
250
300
350
400
450
500
1 2 3 4
Uni
t Ann
ual E
nerg
y (k
Wh)
High Performance StateEnergy
Sleep Mode Energy
Standby Mode Energy
Idle State Energy
Savings = 124 kWh per year
Savings = 65 kWh per year
Savings = 6 kWh per year
Energy Star Desktop with 60 W Idle State Level
Energy Star Desktop with 50 W Idle State
LevelCurrent Desktop Energy Star Desktop with
70 W Idle State Level

National Level Energy Savings If All Existing U.S. Desktop Computers Met Proposed Levels
• An Idle State cap of 50 Watts has the potential to save 118 kwh/yr per machine, or in total:
– 18.6 billion kWh per year– Equivalent to 1.8% of residential electricity use– Equivalent of shutting down approximately 4 large
power plants
Above figures do not include laptops or servers. To obtain savings for 25% sales penetration of ENERGY STAR models, divide savings estimates by 4.

Key Findings Recap
Should be relatively easy to finalize idle mode test method. Range of potentially complicating factors do not impact overall idle level.
Less than 2% variation in power use regardless of:
• Number of Office applications or other windows open
• Network connection established or not
• System tray applications open or closed

NRDC’s Recommendations
• Idle State should be kept in specification in the range of 50 to 60 watts for desktops
• Encourage sub-group to meet to resolve remaining test procedure issues:– Resolve test voltages, precision of lab equipment needed, etc. to
conform with international standards like IEC 62301– Encourage manufacturers to gather and report additional data on
their own products– 5-minute average measurement of idle power– Wait 5 minutes prior to making measurement