reclamation subsidence
TRANSCRIPT
Eastside Bypass
Chowchilla Bypass
San Joaquin River
San Joaquin River
SanJoa
quin
Rive
r
Arroyo Canal
Sources: Esri, DeLorme, NAVTEQ, TomTom, Intermap, increment P Corp.,GEBCO, USGS, FAO, NPS, NRCAN, GeoBase, IGN, Kadaster NL, OrdnanceSurvey, Esri Japan, METI, Esri China (Hong Kong), swisstopo, and the GISUser Community
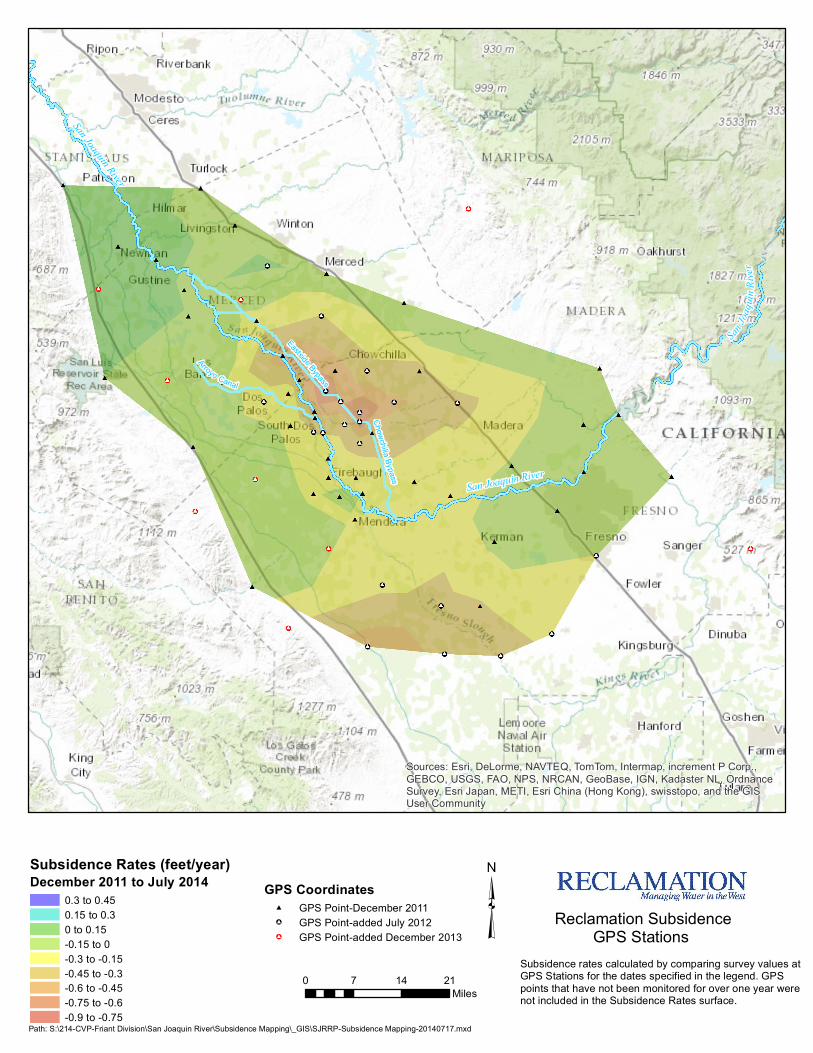
Reclamation SubsidenceGPS Stations
Subsidence Rates (feet/year)December 2011 to July 2014
0.3 to 0.450.15 to 0.30 to 0.15-0.15 to 0-0.3 to -0.15-0.45 to -0.3-0.6 to -0.45-0.75 to -0.6-0.9 to -0.75
³0 7 14 21
Miles
Subsidence rates calculated by comparing survey values at GPS Stations for the dates specified in the legend. GPS points that have not been monitored for over one year were not included in the Subsidence Rates surface.
Path: S:\214-CVP-Friant Division\San Joaquin River\Subsidence Mapping\_GIS\SJRRP-Subsidence Mapping-20140717.mxd
GPS Coordinates# GPS Point-December 2011!# GPS Point-added July 2012!# GPS Point-added December 2013
Eastside Bypass
Chowchilla Bypass
San Joaquin River
San Joaquin River
SanJoa
quin
Rive
r
Arroyo Canal
Sources: Esri, DeLorme, NAVTEQ, TomTom, Intermap, increment P Corp.,GEBCO, USGS, FAO, NPS, NRCAN, GeoBase, IGN, Kadaster NL, OrdnanceSurvey, Esri Japan, METI, Esri China (Hong Kong), swisstopo, and the GISUser Community
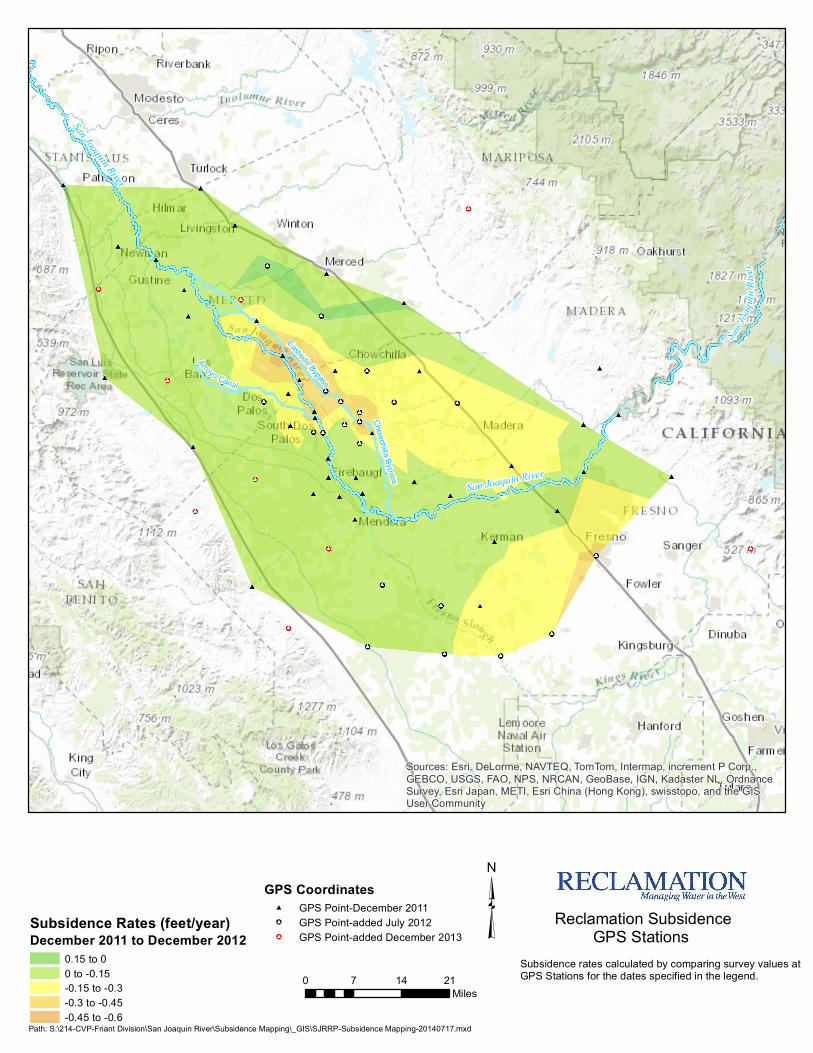
Reclamation SubsidenceGPS Stations Subsidence Rates (feet/year)
December 2011 to December 20120.15 to 00 to -0.15-0.15 to -0.3-0.3 to -0.45-0.45 to -0.6
³0 7 14 21
Miles
Subsidence rates calculated by comparing survey values at GPS Stations for the dates specified in the legend.
Path: S:\214-CVP-Friant Division\San Joaquin River\Subsidence Mapping\_GIS\SJRRP-Subsidence Mapping-20140717.mxd
GPS Coordinates# GPS Point-December 2011!# GPS Point-added July 2012!# GPS Point-added December 2013
Eastside Bypass
Chowchilla Bypass
San Joaquin River
San Joaquin River
SanJoa
quin
Rive
r
Arroyo Canal
Sources: Esri, DeLorme, NAVTEQ, TomTom, Intermap, increment P Corp.,GEBCO, USGS, FAO, NPS, NRCAN, GeoBase, IGN, Kadaster NL, OrdnanceSurvey, Esri Japan, METI, Esri China (Hong Kong), swisstopo, and the GISUser Community
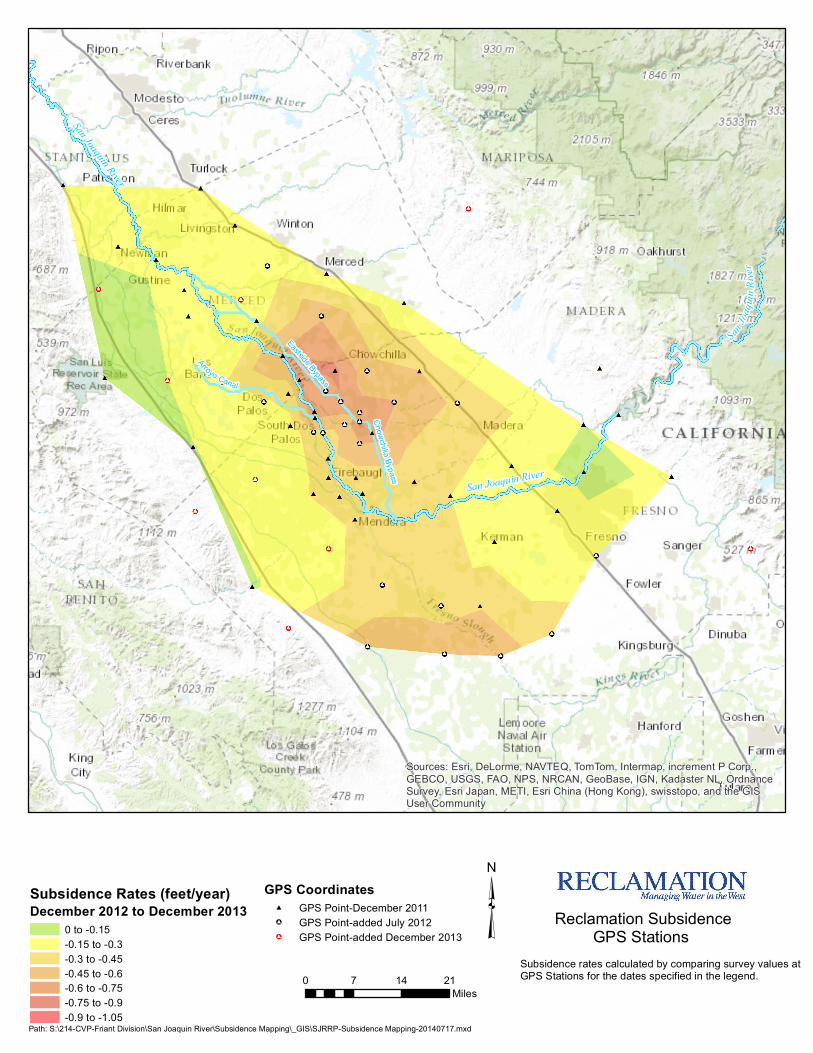
Reclamation SubsidenceGPS Stations
Subsidence Rates (feet/year)December 2012 to December 2013
0 to -0.15-0.15 to -0.3-0.3 to -0.45-0.45 to -0.6-0.6 to -0.75-0.75 to -0.9-0.9 to -1.05
³0 7 14 21
Miles
Subsidence rates calculated by comparing survey values at GPS Stations for the dates specified in the legend.
Path: S:\214-CVP-Friant Division\San Joaquin River\Subsidence Mapping\_GIS\SJRRP-Subsidence Mapping-20140717.mxd
GPS Coordinates# GPS Point-December 2011!# GPS Point-added July 2012!# GPS Point-added December 2013

Eastside Bypass
Chowchilla Bypass
San Joaquin River
San Joaquin River
SanJoa
quin
Rive
r
Arroyo Canal
Sources: Esri, DeLorme, NAVTEQ, TomTom, Intermap, increment P Corp.,GEBCO, USGS, FAO, NPS, NRCAN, GeoBase, IGN, Kadaster NL, OrdnanceSurvey, Esri Japan, METI, Esri China (Hong Kong), swisstopo, and the GISUser Community
Reclamation SubsidenceGPS Stations
Subsidence Rates (feet/year)December 2013 to July 2014
0.75 to 0.90.6 to 0.750.45 to 0.60.3 to 0.450.15 to 0.30 to 0.15-0.15 to 0-0.3 to -0.15-0.45 to -0.3-0.6 to -0.45-0.75 to -0.6-0.9 to -0.75
³0 7 14 21
Miles
Subsidence rates calculated by comparing survey values at GPS Stations for the dates specified in the legend.
Path: S:\214-CVP-Friant Division\San Joaquin River\Subsidence Mapping\_GIS\SJRRP-Subsidence Mapping-20140717.mxd
GPS Coordinates# GPS Point-December 2011!# GPS Point-added July 2012!# GPS Point-added December 2013
Eastside Bypass
Chowchilla Bypass
San Joaquin River
San Joaquin River
SanJoa
quin
Rive
r
Arroyo Canal
Sources: Esri, DeLorme, NAVTEQ, TomTom, Intermap, increment P Corp.,GEBCO, USGS, FAO, NPS, NRCAN, GeoBase, IGN, Kadaster NL, OrdnanceSurvey, Esri Japan, METI, Esri China (Hong Kong), swisstopo, and the GISUser Community
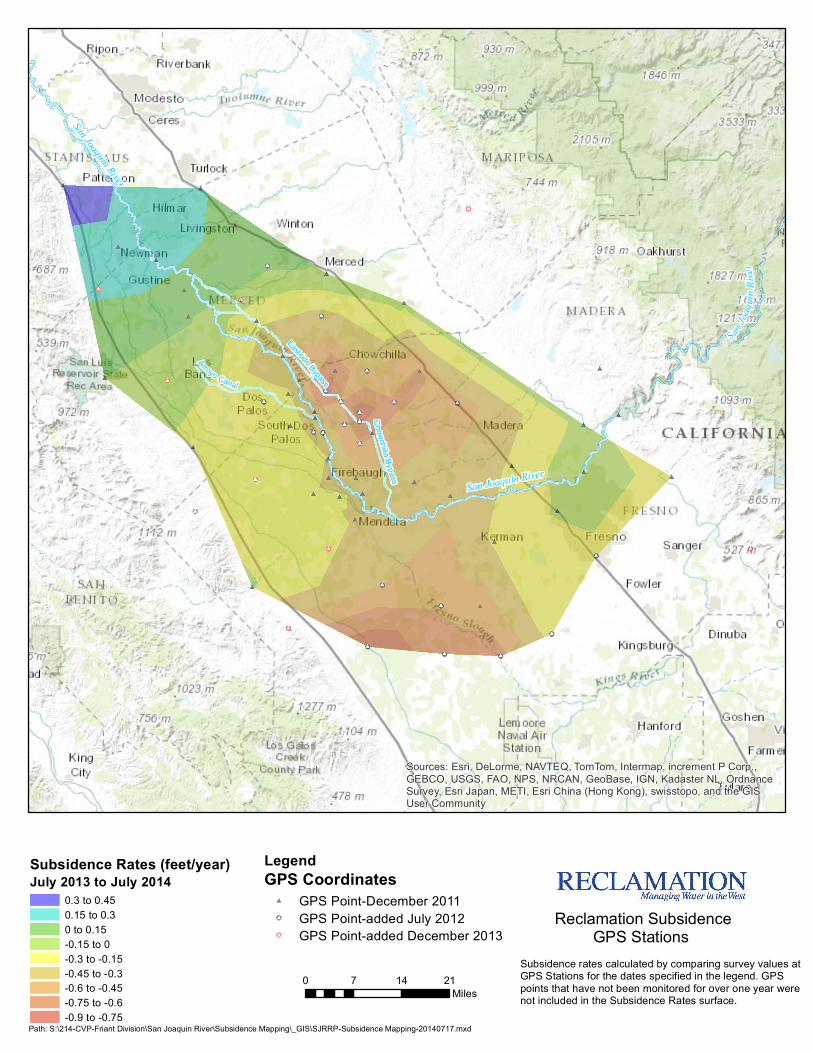
Reclamation SubsidenceGPS Stations
Subsidence Rates (feet/year)July 2013 to July 2014
0.3 to 0.450.15 to 0.30 to 0.15-0.15 to 0-0.3 to -0.15-0.45 to -0.3-0.6 to -0.45-0.75 to -0.6-0.9 to -0.75
³0 7 14 21
Miles
Subsidence rates calculated by comparing survey values at GPS Stations for the dates specified in the legend. GPS points that have not been monitored for over one year were not included in the Subsidence Rates surface.
Path: S:\214-CVP-Friant Division\San Joaquin River\Subsidence Mapping\_GIS\SJRRP-Subsidence Mapping-20140717.mxd
LegendGPS Coordinates
# GPS Point-December 2011!# GPS Point-added July 2012!# GPS Point-added December 2013