environmental impacts of land subsidence in urban … · environmental impacts of land subsidence...
TRANSCRIPT
6/1/2015
FIG Working Week 2015 1
Hasanuddin Z. Abidin , H. Andreas, I. Gumilar, T.P. Sidiq, M.Gamal
GEODESY RESEARCH GROUPFACULTY OF EARTH SCIENCE AND TECHNOLOGY
INSTITUTE OF TECHNOLOGY BANDUNG (ITB)JL. GANESHA 10, BANDUNG, INDONESIA
E-mail : [email protected]
Environmental Impacts ofLand Subsidence in Urban Areas of Indonesia
Outline of Presentation
1. Introduction
2. Observed Land Subsidence
3. Impacts of Land Subsidence
4. Environmental Impacts of
Land Subsidence
5. Closing Remarks
Hasanuddin Z. Abidin, 2015
6/1/2015
FIG Working Week 2015 2
Hasanuddin Z. Abidin, 2012
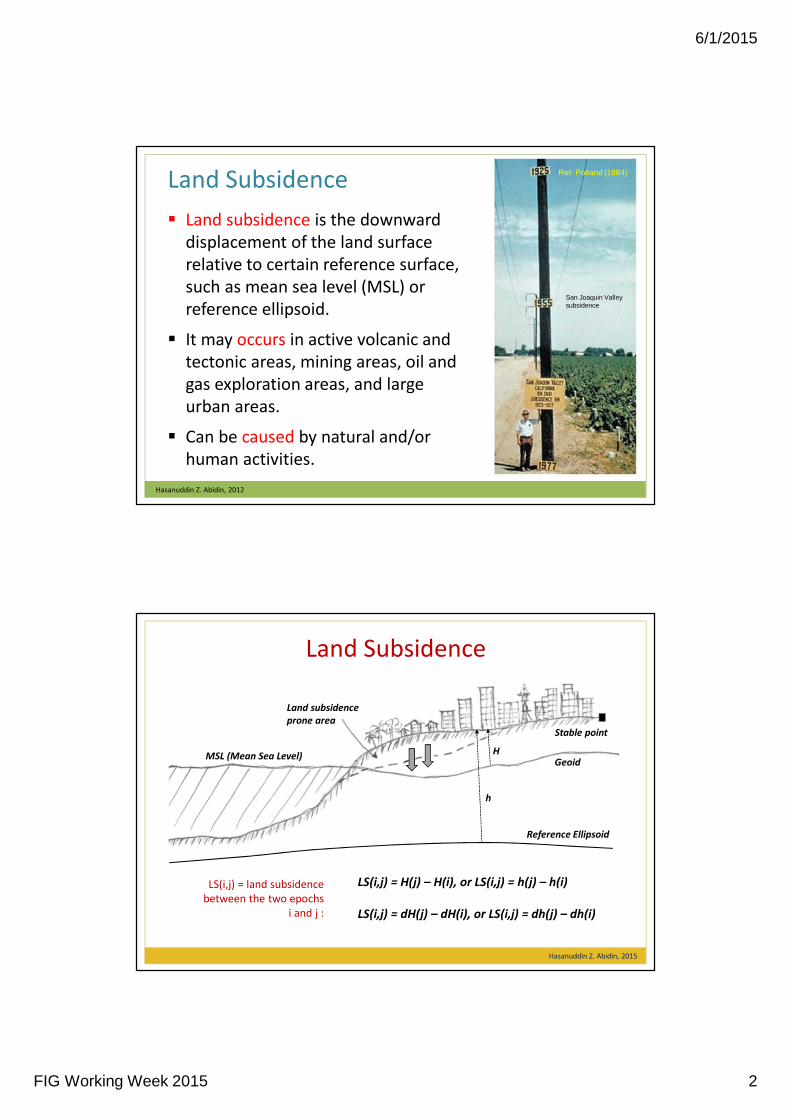
Land Subsidence
San Joaquin Valley subsidence
� Land subsidence is the downward
displacement of the land surface
relative to certain reference surface,
such as mean sea level (MSL) or
reference ellipsoid.
� It may occurs in active volcanic and
tectonic areas, mining areas, oil and
gas exploration areas, and large
urban areas.
� Can be caused by natural and/or
human activities.
Ref: Polland (1984)
Land Subsidence
Hasanuddin Z. Abidin, 2015
MSL (Mean Sea Level)
Land subsidence
prone area
Stable point
Geoid
Reference Ellipsoid
h
H
LS(i,j) = H(j) – H(i), or LS(i,j) = h(j) – h(i)
LS(i,j) = dH(j) – dH(i), or LS(i,j) = dh(j) – dh(i)
LS(i,j) = land subsidence
between the two epochs
i and j :
6/1/2015
FIG Working Week 2015 3
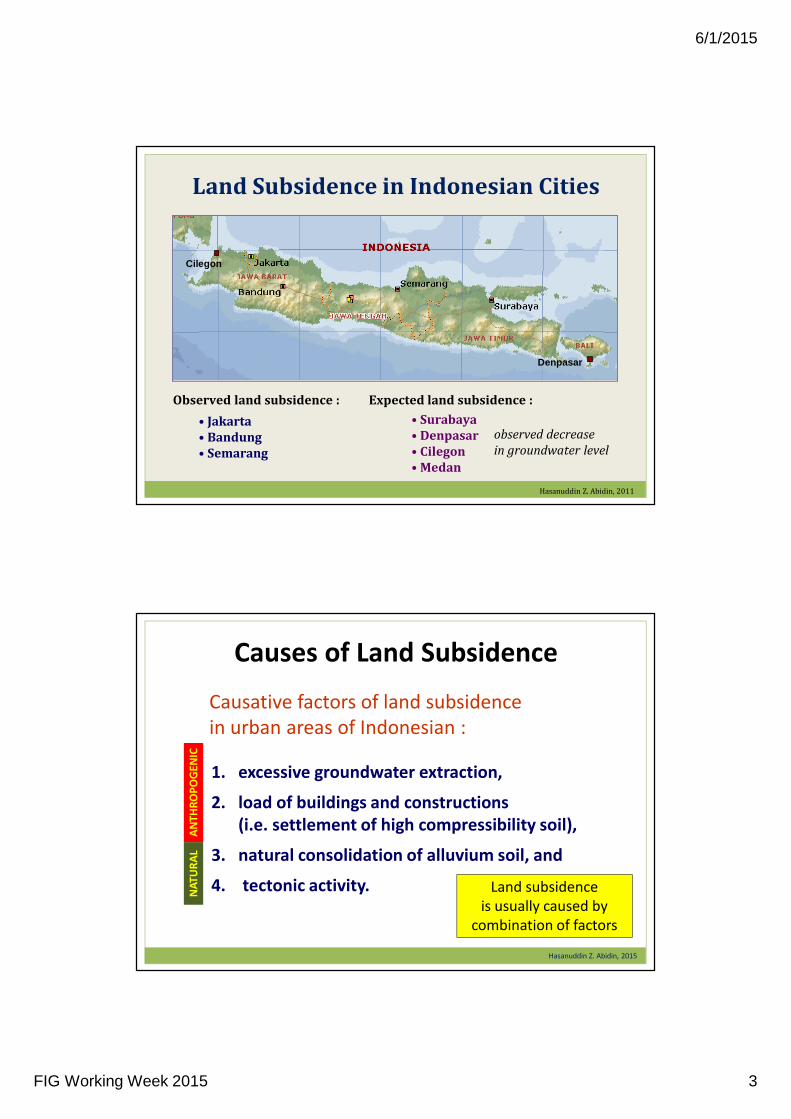
Land Subsidence in Indonesian Cities
Denpasar
Cilegon
Denpasar
Cilegon
• Jakarta
• Bandung
• Semarang
• Surabaya
• Denpasar
• Cilegon
• Medan
Observed land subsidence : Expected land subsidence :
observed decrease
in groundwater level
Hasanuddin Z. Abidin, 2011
1. excessive groundwater extraction,
2. load of buildings and constructions
(i.e. settlement of high compressibility soil),
3. natural consolidation of alluvium soil, and
4. tectonic activity.
Causative factors of land subsidence
in urban areas of Indonesian :
Causes of Land Subsidence
Hasanuddin Z. Abidin, 2015
NA
TU
RA
L A
NT
HR
OP
OG
EN
IC
Land subsidence
is usually caused by
combination of factors
6/1/2015
FIG Working Week 2015 4
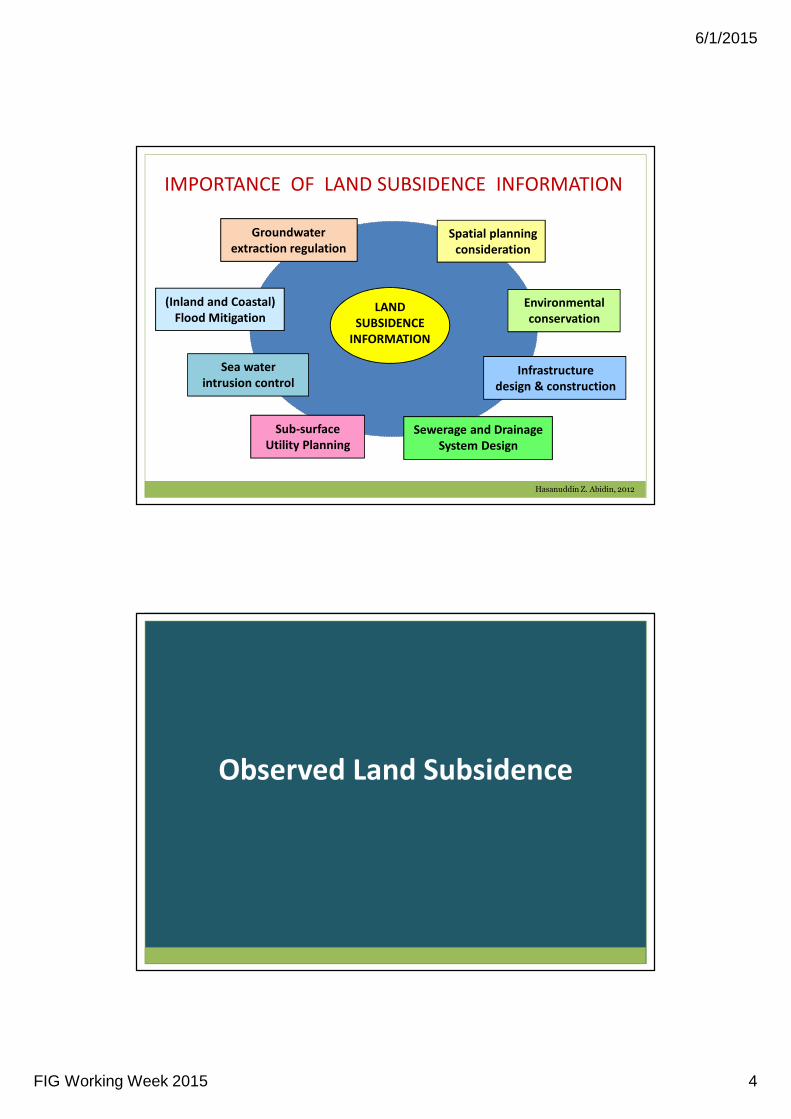
Spatial planning
consideration
Infrastructure
design & construction
(Inland and Coastal)
Flood Mitigation
Sea water
intrusion control
Groundwater
extraction regulation
Environmental
conservationLAND
SUBSIDENCE
INFORMATION
IMPORTANCE OF LAND SUBSIDENCE INFORMATION
Hasanuddin Z. Abidin, 2012
Sewerage and Drainage
System Design
Sub-surface
Utility Planning
Observed Land Subsidence
6/1/2015
FIG Working Week 2015 5
Hasanuddin Z. Abidin, 2015
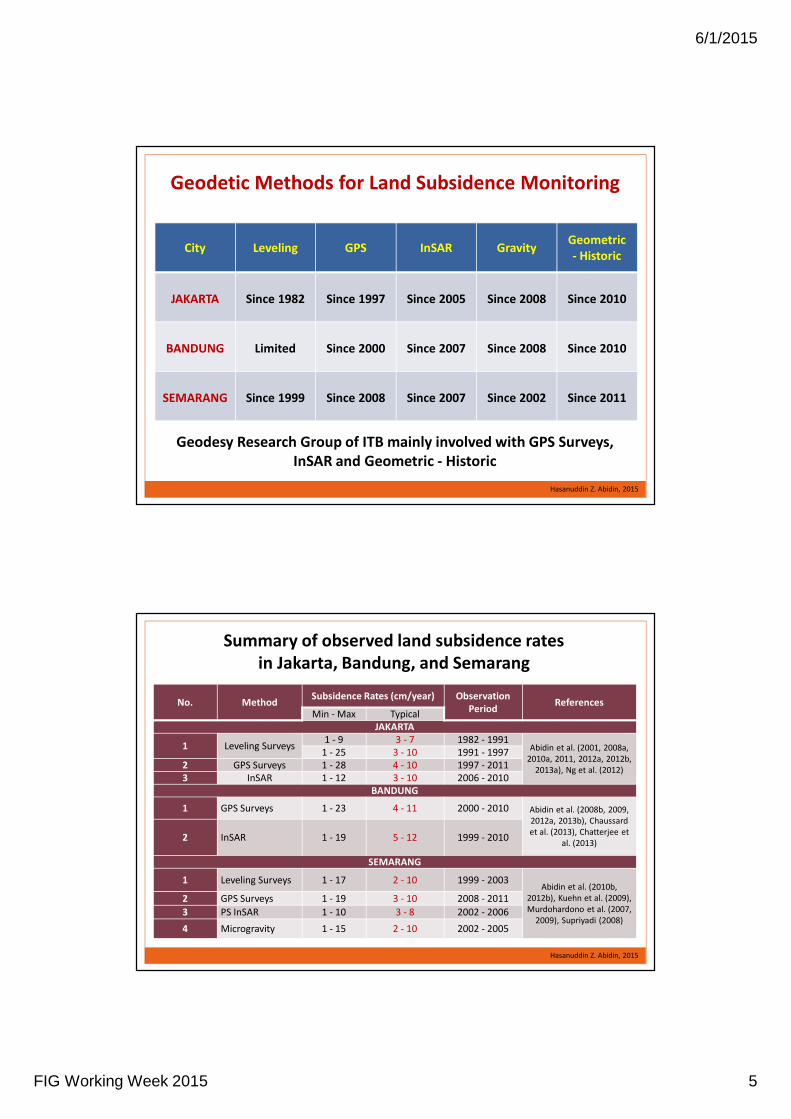
City Leveling GPS InSAR GravityGeometric
- Historic
JAKARTA Since 1982 Since 1997 Since 2005 Since 2008 Since 2010
BANDUNG Limited Since 2000 Since 2007 Since 2008 Since 2010
SEMARANG Since 1999 Since 2008 Since 2007 Since 2002 Since 2011
Geodetic Methods for Land Subsidence Monitoring
Geodesy Research Group of ITB mainly involved with GPS Surveys,
InSAR and Geometric - Historic
Hasanuddin Z. Abidin, 2015
Summary of observed land subsidence rates
in Jakarta, Bandung, and Semarang
No. MethodSubsidence Rates (cm/year) Observation
PeriodReferences
Min - Max Typical
JAKARTA
1 Leveling Surveys1 - 9 3 - 7 1982 - 1991
Abidin et al. (2001, 2008a,
2010a, 2011, 2012a, 2012b,
2013a), Ng et al. (2012)
1 - 25 3 - 10 1991 - 1997
2 GPS Surveys 1 - 28 4 - 10 1997 - 2011
3 InSAR 1 - 12 3 - 10 2006 - 2010
BANDUNG
1 GPS Surveys 1 - 23 4 - 11 2000 - 2010 Abidin et al. (2008b, 2009,
2012a, 2013b), Chaussard
et al. (2013), Chatterjee et
al. (2013) 2 InSAR 1 - 19 5 - 12 1999 - 2010
SEMARANG
1 Leveling Surveys 1 - 17 2 - 10 1999 - 2003Abidin et al. (2010b,
2012b), Kuehn et al. (2009),
Murdohardono et al. (2007,
2009), Supriyadi (2008)
2 GPS Surveys 1 - 19 3 - 10 2008 - 2011
3 PS InSAR 1 - 10 3 - 8 2002 - 2006
4 Microgravity 1 - 15 2 - 10 2002 - 2005
6/1/2015
FIG Working Week 2015 6
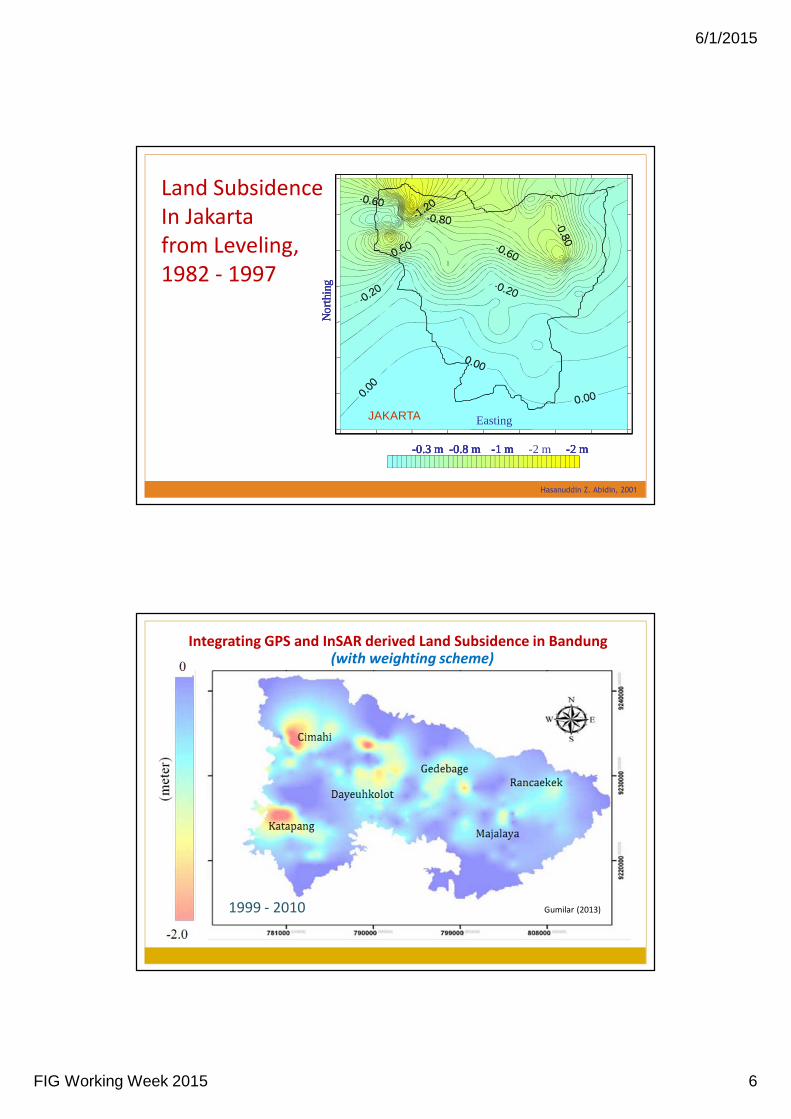
Land Subsidence
In Jakarta
from Leveling,
1982 - 1997
Hasanuddin Z. Abidin, 2001
JAKARTA Easting
Nor
t hi n
g
-2 m-2 m-1 m-0.8 m-0.3 m
JAKARTA Easting
Nor
t hi n
g
-2 m-2 m-1 m-0.8 m-0.3 m
JAKARTA Easting
Nor
t hi n
g
-2 m-2 m-1 m-0.8 m-0.3 m -2 m-2 m-1 m-0.8 m-0.3 m
Gumilar (2013)1999 - 2010
(with weighting scheme)Integrating GPS and InSAR derived Land Subsidence in Bandung
6/1/2015
FIG Working Week 2015 7
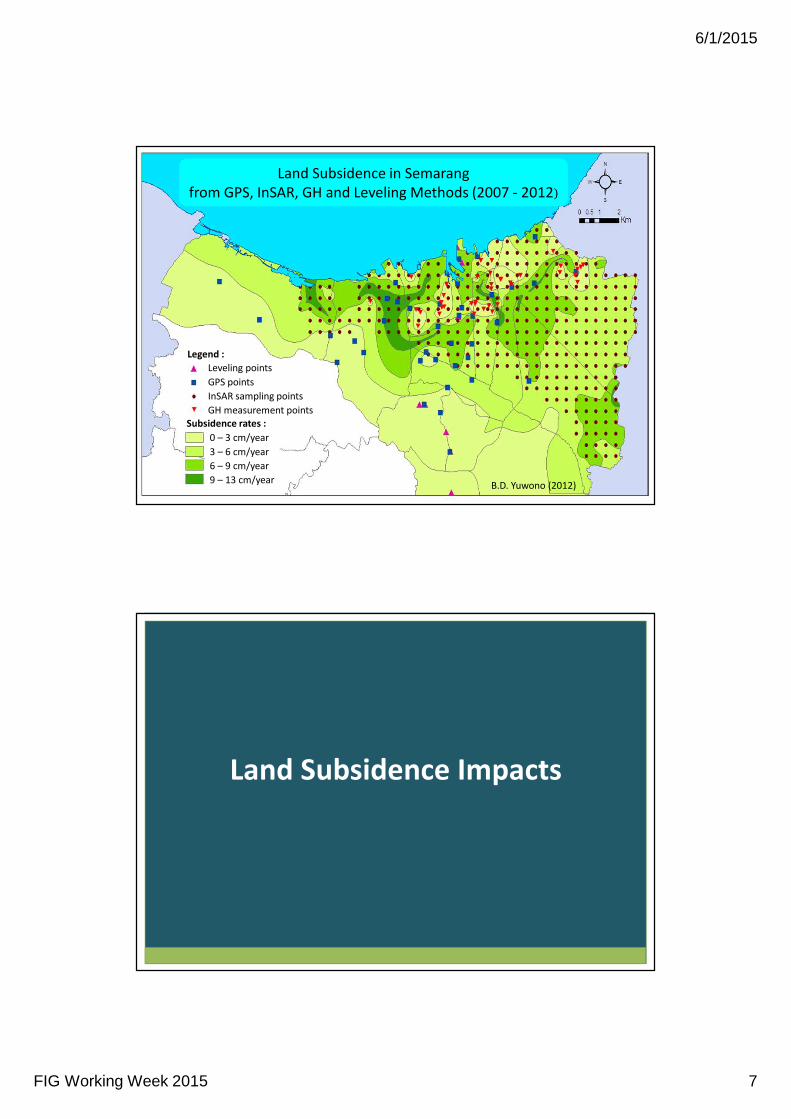
Legend :
Subsidence rates :
0 – 3 cm/year
3 – 6 cm/year
6 – 9 cm/year
9 – 13 cm/year
Leveling points
GPS points
InSAR sampling points
GH measurement points
Land Subsidence in Semarang
from GPS, InSAR, GH and Leveling Methods (2007 - 2012)
B.D. Yuwono (2012)
Land Subsidence Impacts
6/1/2015
FIG Working Week 2015 8
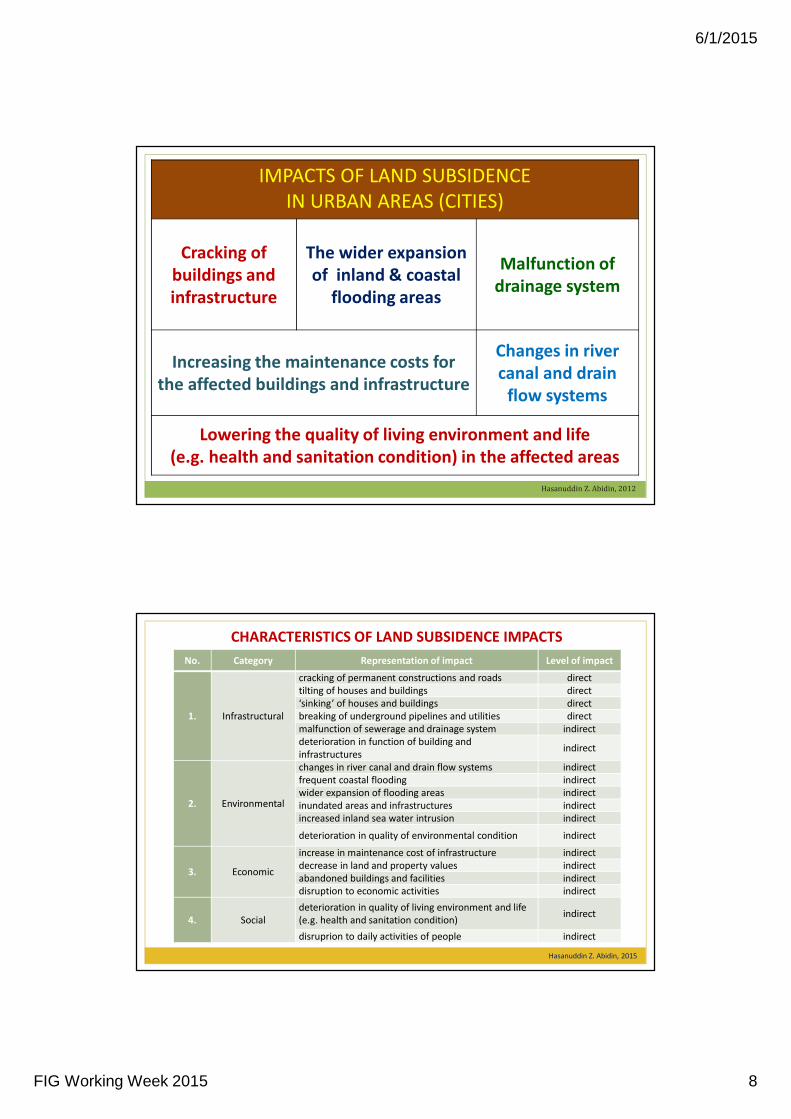
IMPACTS OF LAND SUBSIDENCE
IN URBAN AREAS (CITIES)
Cracking of
buildings and
infrastructure
The wider expansion
of inland & coastal
flooding areas
Malfunction of
drainage system
Increasing the maintenance costs for
the affected buildings and infrastructure
Changes in river
canal and drain
flow systems
Lowering the quality of living environment and life
(e.g. health and sanitation condition) in the affected areas
Hasanuddin Z. Abidin, 2012
Hasanuddin Z. Abidin, 2015
No. Category Representation of impact Level of impact
1. Infrastructural
cracking of permanent constructions and roads direct
tilting of houses and buildings direct
‘sinking’ of houses and buildings direct
breaking of underground pipelines and utilities direct
malfunction of sewerage and drainage system indirect
deterioration in function of building and
infrastructuresindirect
2. Environmental
changes in river canal and drain flow systems indirect
frequent coastal flooding indirect
wider expansion of flooding areas indirect
inundated areas and infrastructures indirect
increased inland sea water intrusion indirect
deterioration in quality of environmental condition indirect
3. Economic
increase in maintenance cost of infrastructure indirect
decrease in land and property values indirect
abandoned buildings and facilities indirect
disruption to economic activities indirect
4. Social
deterioration in quality of living environment and life
(e.g. health and sanitation condition)indirect
disruprion to daily activities of people indirect
CHARACTERISTICS OF LAND SUBSIDENCE IMPACTS
6/1/2015
FIG Working Week 2015 9
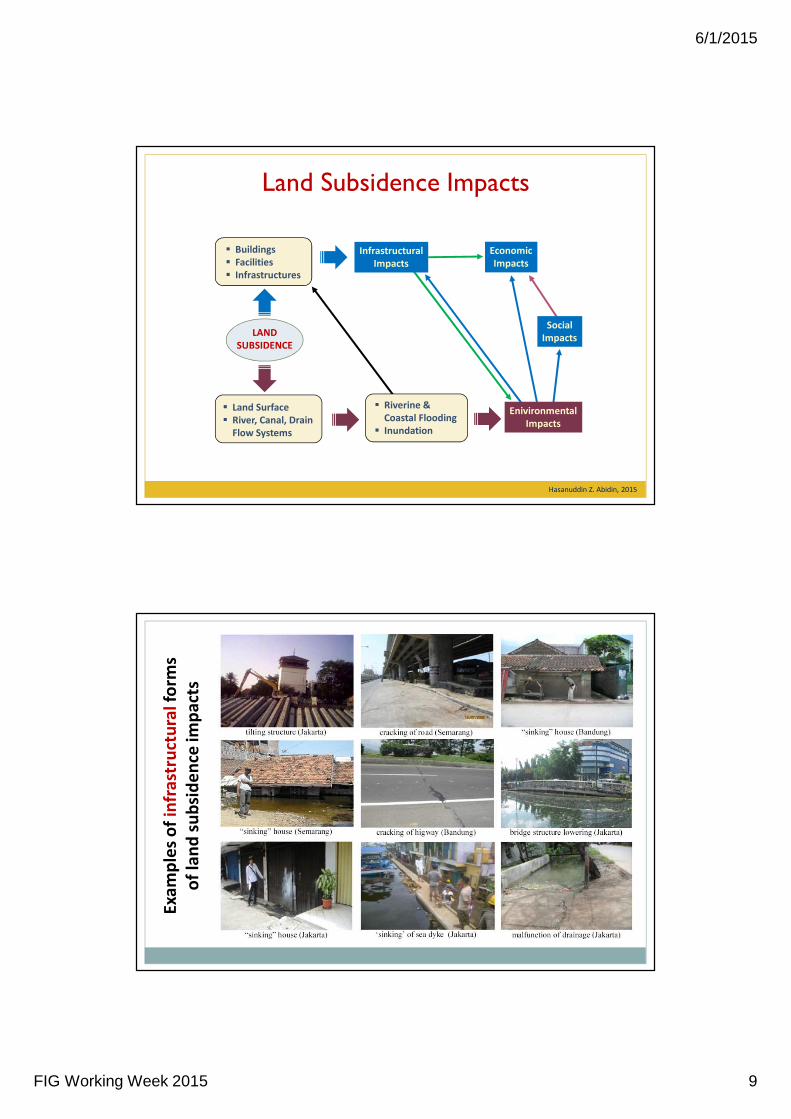
Land Subsidence Impacts
Infrastructural
Impacts
LAND
SUBSIDENCE
� Land Surface
� River, Canal, Drain
Flow Systems
� Riverine &
Coastal Flooding
� Inundation
� Buildings
� Facilities
� Infrastructures
Economic
Impacts
Social
Impacts
Enivironmental
Impacts
Hasanuddin Z. Abidin, 2015
Exa
mp
les
of
infr
ast
ruct
ura
lfo
rms
of
lan
d s
ub
sid
en
ce im
pa
cts
6/1/2015
FIG Working Week 2015 10
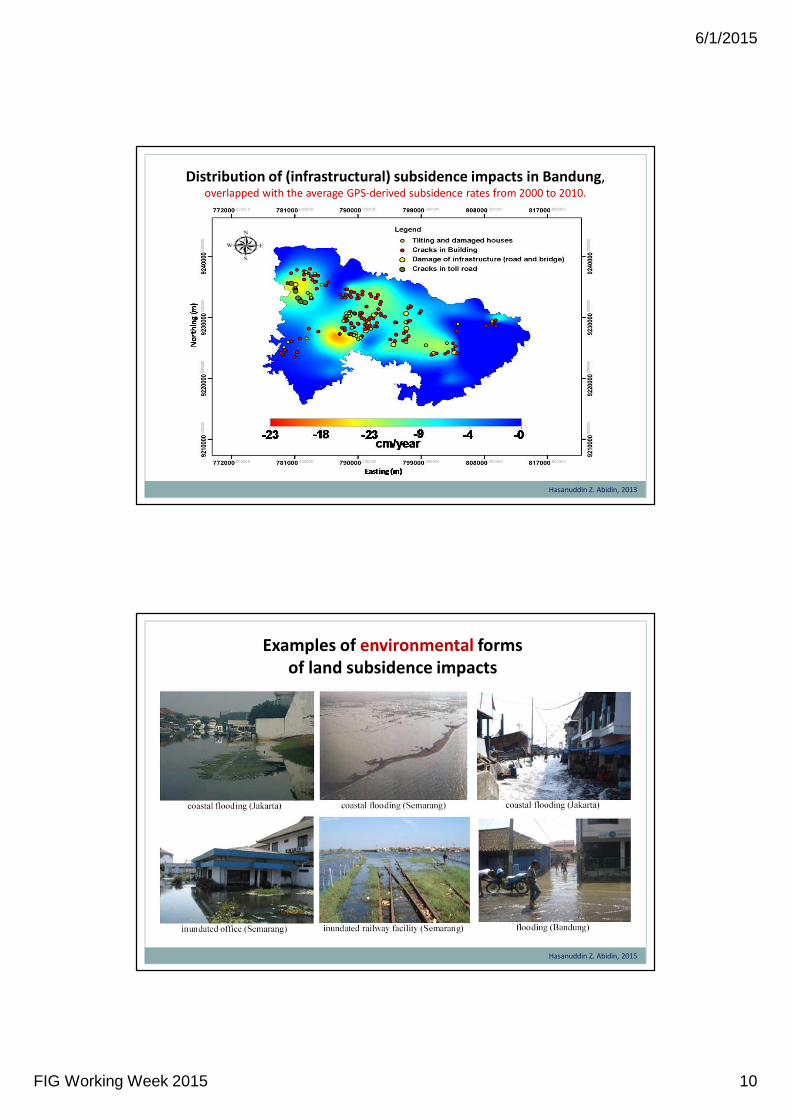
Distribution of (infrastructural) subsidence impacts in Bandung,overlapped with the average GPS-derived subsidence rates from 2000 to 2010.
Hasanuddin Z. Abidin, 2013
Hasanuddin Z. Abidin, 2015
Examples of environmental forms
of land subsidence impacts
6/1/2015
FIG Working Week 2015 11
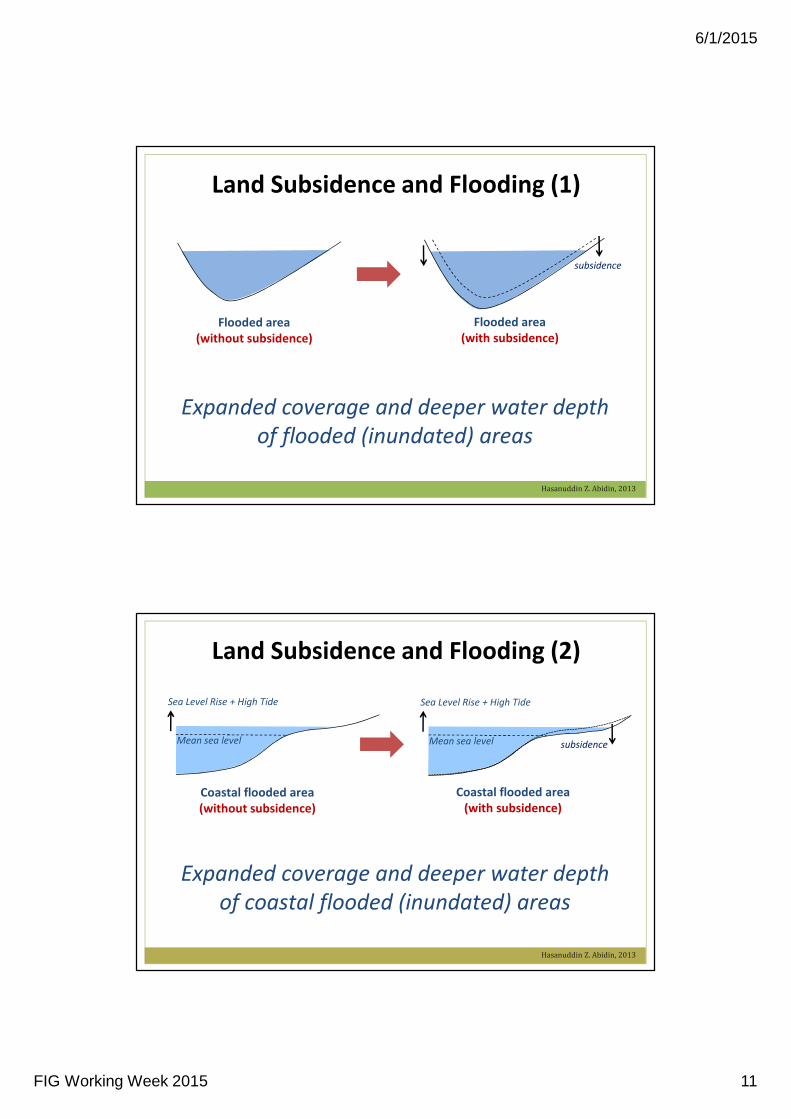
Land Subsidence and Flooding (1)
Expanded coverage and deeper water depth
of flooded (inundated) areas
Hasanuddin Z. Abidin, 2013
Flooded area
(without subsidence)
Flooded area
(with subsidence)
subsidence
Land Subsidence and Flooding (2)
Hasanuddin Z. Abidin, 2013
Expanded coverage and deeper water depth
of coastal flooded (inundated) areas
Coastal flooded area
(without subsidence)
Mean sea level
Sea Level Rise + High Tide
Coastal flooded area
(with subsidence)
subsidenceMean sea level
Sea Level Rise + High Tide
6/1/2015
FIG Working Week 2015 12
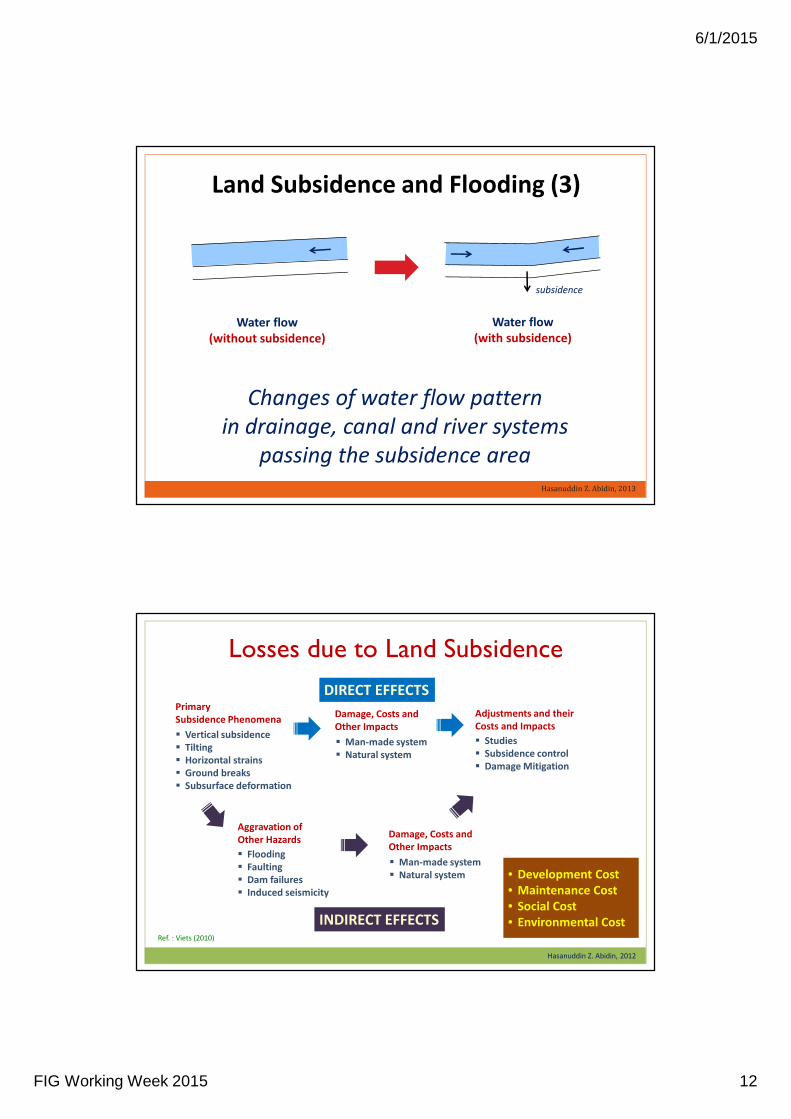
Land Subsidence and Flooding (3)
Changes of water flow pattern
in drainage, canal and river systems
passing the subsidence area
Hasanuddin Z. Abidin, 2013
Water flow
(without subsidence)
Water flow
(with subsidence)
subsidence
Losses due to Land Subsidence
Hasanuddin Z. Abidin, 2012
• Development Cost
• Maintenance Cost
• Social Cost
• Environmental CostRef. : Viets (2010)
DIRECT EFFECTS
INDIRECT EFFECTS
Primary
Subsidence Phenomena
� Vertical subsidence
� Tilting
� Horizontal strains
� Ground breaks
� Subsurface deformation
Aggravation of
Other Hazards
� Flooding
� Faulting
� Dam failures
� Induced seismicity
Damage, Costs and
Other Impacts
� Man-made system
� Natural system
Adjustments and their
Costs and Impacts
� Studies
� Subsidence control
� Damage Mitigation
Damage, Costs and
Other Impacts
� Man-made system
� Natural system
6/1/2015
FIG Working Week 2015 13
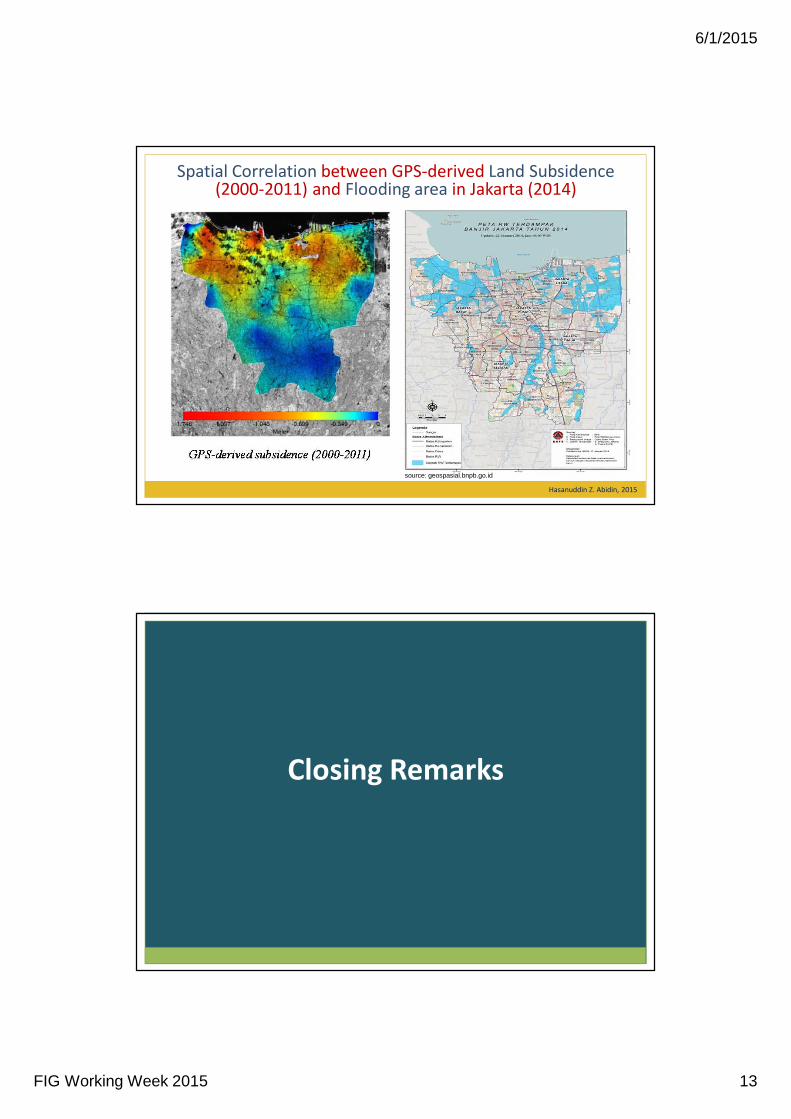
Spatial Correlation between GPS-derived Land Subsidence(2000-2011) and Flooding area in Jakarta (2014)
Hasanuddin Z. Abidin, 2015
source: geospasial.bnpb.go.id
Closing Remarks
6/1/2015
FIG Working Week 2015 14
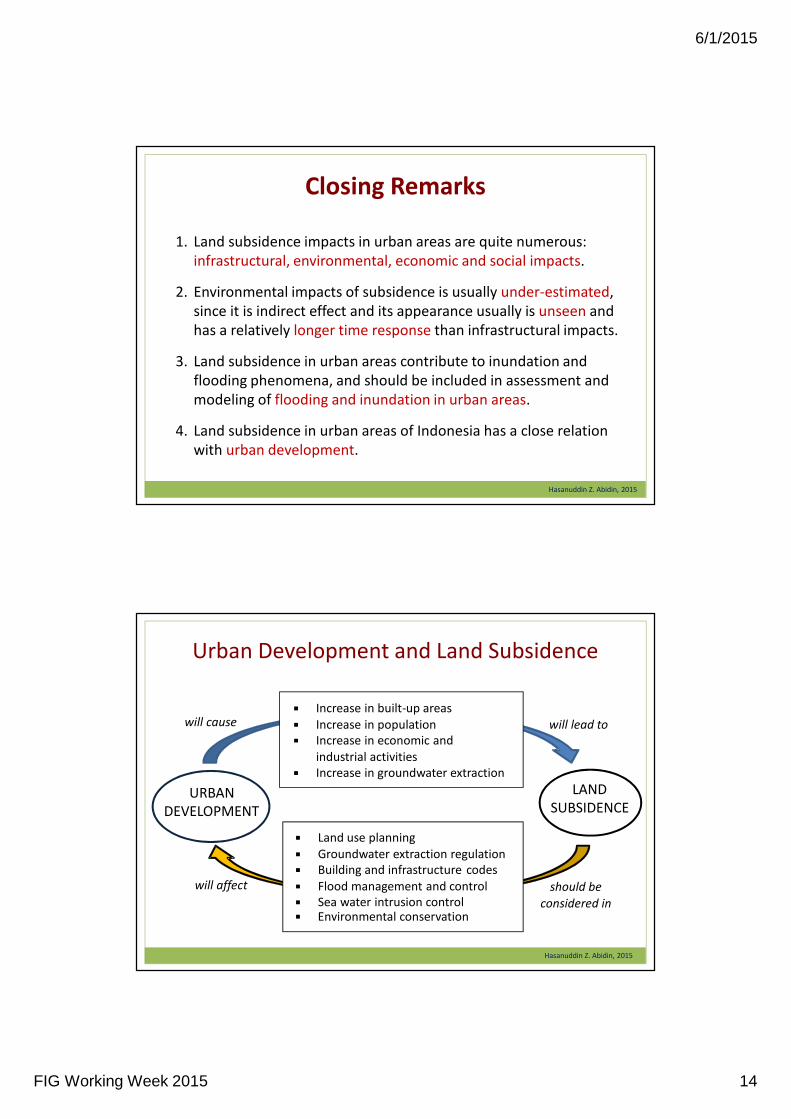
1. Land subsidence impacts in urban areas are quite numerous:
infrastructural, environmental, economic and social impacts.
2. Environmental impacts of subsidence is usually under-estimated,
since it is indirect effect and its appearance usually is unseen and
has a relatively longer time response than infrastructural impacts.
3. Land subsidence in urban areas contribute to inundation and
flooding phenomena, and should be included in assessment and
modeling of flooding and inundation in urban areas.
4. Land subsidence in urban areas of Indonesia has a close relation
with urban development.
Closing Remarks
Hasanuddin Z. Abidin, 2015
Urban Development and Land Subsidence
Hasanuddin Z. Abidin, 2015
URBAN
DEVELOPMENT
LAND
SUBSIDENCE
� Land use planning
� Groundwater extraction regulation
� Building and infrastructure codes
� Flood management and control
� Sea water intrusion control
� Increase in built-up areas
� Increase in population
� Increase in economic and
industrial activities
� Increase in groundwater extraction
will cause will lead to
will affect should be
considered in� Environmental conservation
6/1/2015
FIG Working Week 2015 15
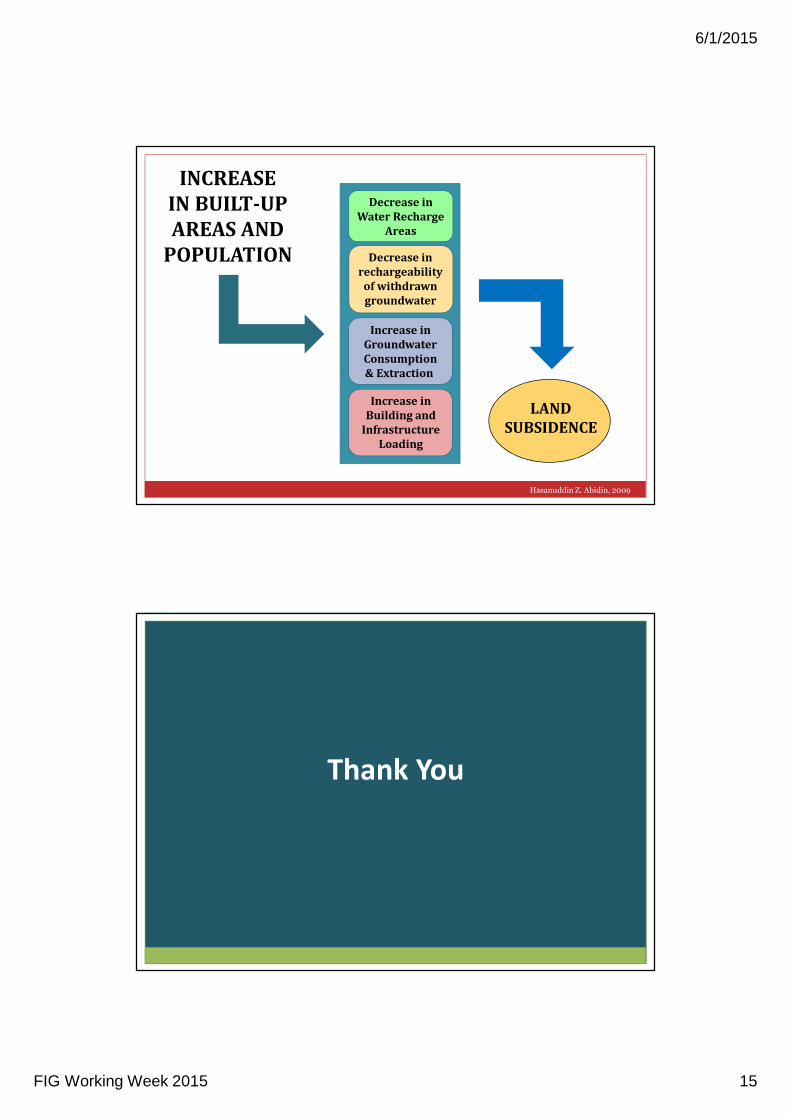
INCREASE
IN BUILT-UP
AREAS AND
POPULATION
Increase in
Groundwater
Consumption
& Extraction
Decrease in
Water Recharge
Areas
Increase in
Building and
Infrastructure
Loading
Decrease in
rechargeability
of withdrawn
groundwater
LAND
SUBSIDENCE
Hasanuddin Z. Abidin, 2009
Thank You
6/1/2015
FIG Working Week 2015 16
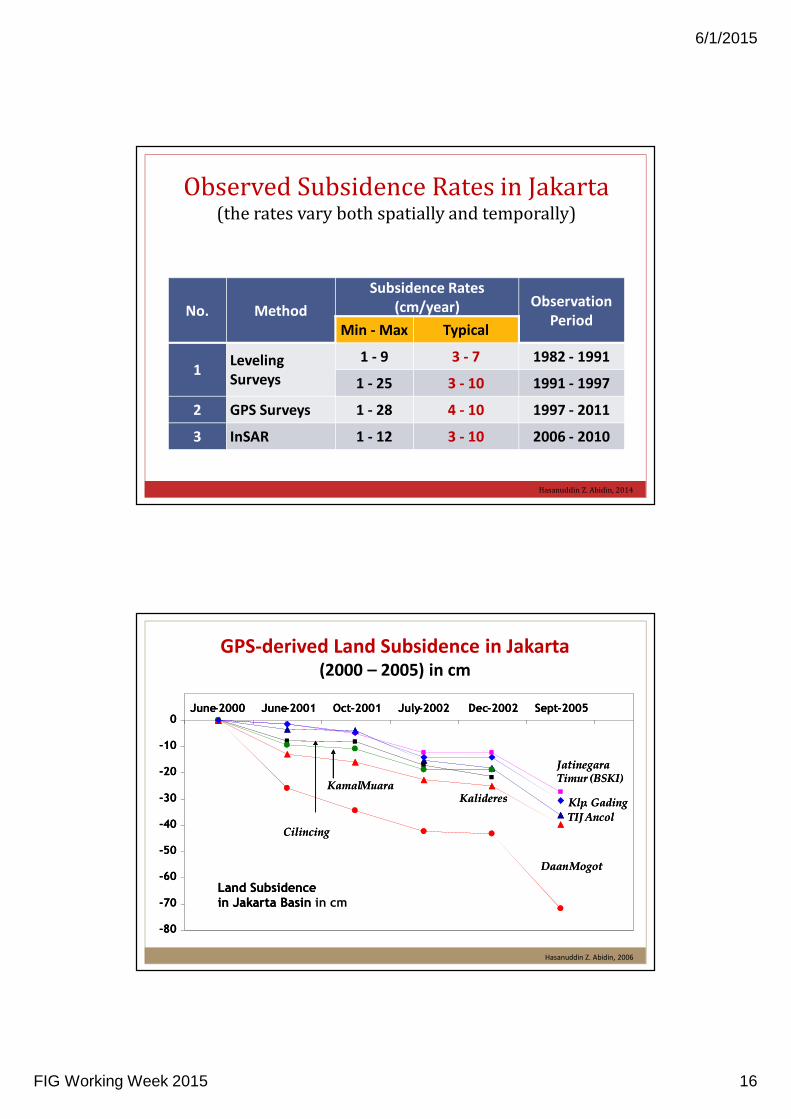
Observed Subsidence Rates in Jakarta (the rates vary both spatially and temporally)
Hasanuddin Z. Abidin, 2014
No. Method
Subsidence Rates
(cm/year) Observation
PeriodMin - Max Typical
1Leveling
Surveys
1 - 9 3 - 7 1982 - 1991
1 - 25 3 - 10 1991 - 1997
2 GPS Surveys 1 - 28 4 - 10 1997 - 2011
3 InSAR 1 - 12 3 - 10 2006 - 2010
GPS-derived Land Subsidence in Jakarta(2000 – 2005) in cm
Hasanuddin Z. Abidin, 2006
-80
-70
-60
-50
-40
-30
-20
-10
0June-2000 June-2001 Oct-2001 July-2002 Dec-2002 Sept-2005
JatinegaraTimur (BSKI)
TIJ Ancol
Klp. Gading
KamalMuara
Cilincing
DaanMogot
Kalideres
Land Subsidencein Jakarta Basin
-80
-70
-60
-50
-40
-30
-20
-10
0June-2000 June-2001 Oct-2001 July-2002 Dec-2002 Sept-2005
JatinegaraTimur (BSKI)
TIJ Ancol
Klp. Gading
KamalMuara
Cilincing
DaanMogot
Kalideres
Land Subsidencein Jakarta Basin in cm
6/1/2015
FIG Working Week 2015 17
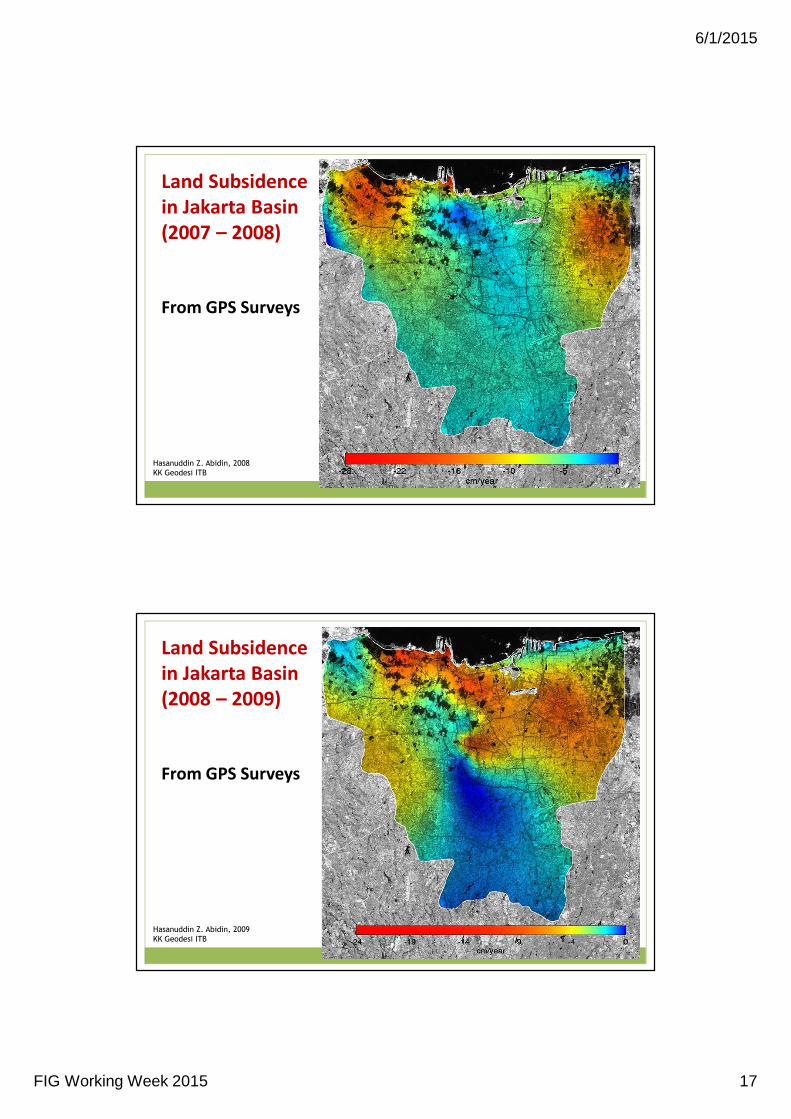
Land Subsidence
in Jakarta Basin
(2007 – 2008)
From GPS Surveys
Hasanuddin Z. Abidin, 2008
KK Geodesi ITB
Land Subsidence
in Jakarta Basin
(2008 – 2009)
From GPS Surveys
Hasanuddin Z. Abidin, 2009
KK Geodesi ITB
6/1/2015
FIG Working Week 2015 18
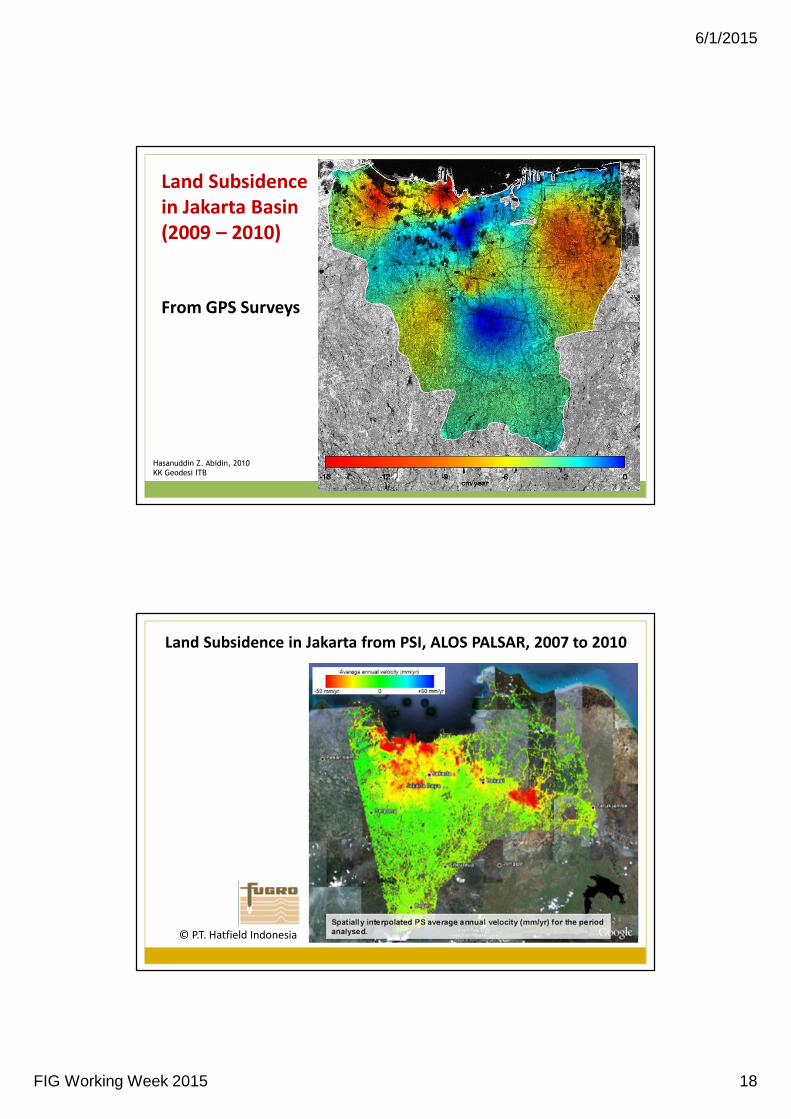
Land Subsidence
in Jakarta Basin
(2009 – 2010)
From GPS Surveys
Hasanuddin Z. Abidin, 2010
KK Geodesi ITB
© P.T. Hatfield Indonesia
Land Subsidence in Jakarta from PSI, ALOS PALSAR, 2007 to 2010
6/1/2015
FIG Working Week 2015 19
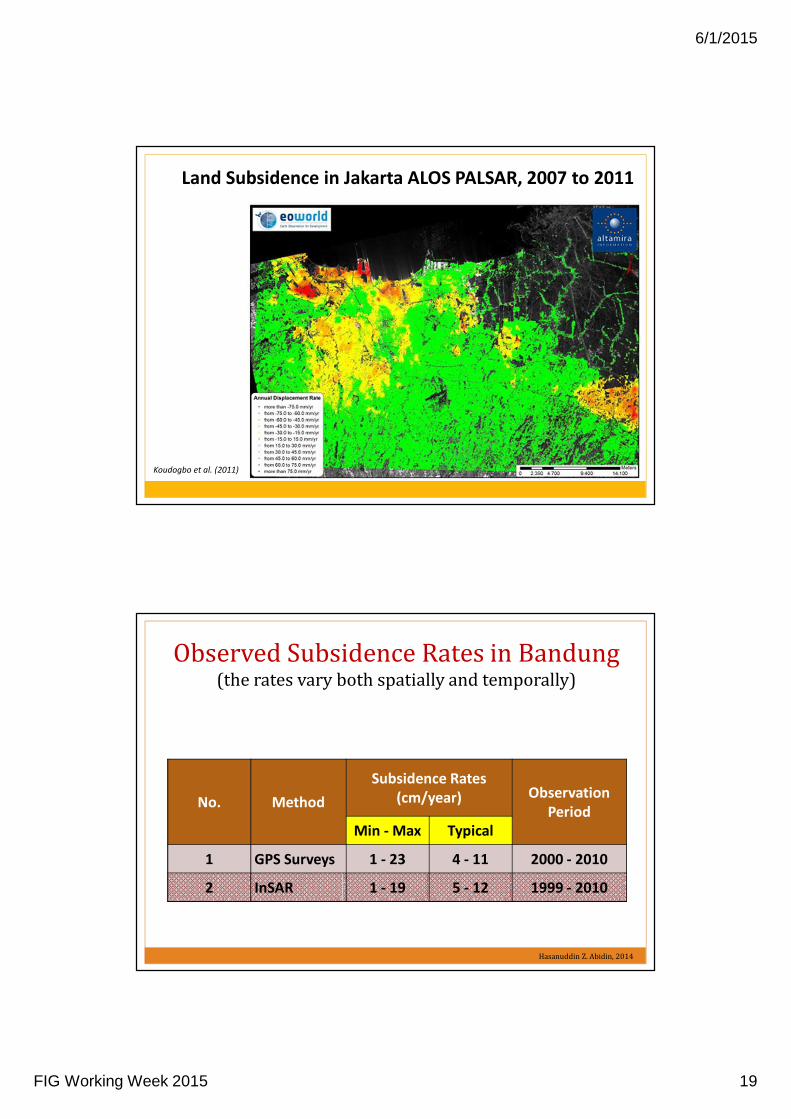
Land Subsidence in Jakarta ALOS PALSAR, 2007 to 2011
Koudogbo et al. (2011)
Observed Subsidence Rates in Bandung (the rates vary both spatially and temporally)
Hasanuddin Z. Abidin, 2014
No. Method
Subsidence Rates
(cm/year) Observation
Period
Min - Max Typical
1 GPS Surveys 1 - 23 4 - 11 2000 - 2010
2 InSAR 1 - 19 5 - 12 1999 - 2010
6/1/2015
FIG Working Week 2015 20
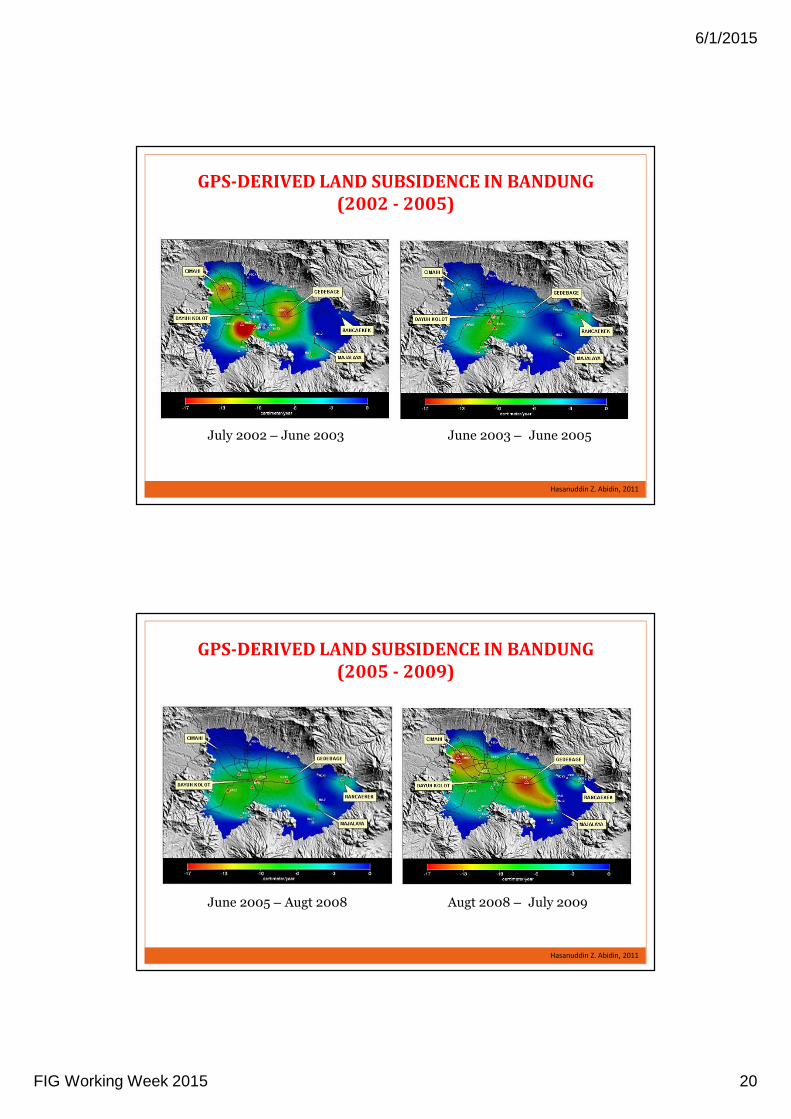
GPS-DERIVED LAND SUBSIDENCE IN BANDUNG
(2002 - 2005)
Hasanuddin Z. Abidin, 2011
July 2002 – June 2003 June 2003 – June 2005
GPS-DERIVED LAND SUBSIDENCE IN BANDUNG
(2005 - 2009)
Hasanuddin Z. Abidin, 2011
June 2005 – Augt 2008 Augt 2008 – July 2009
6/1/2015
FIG Working Week 2015 21
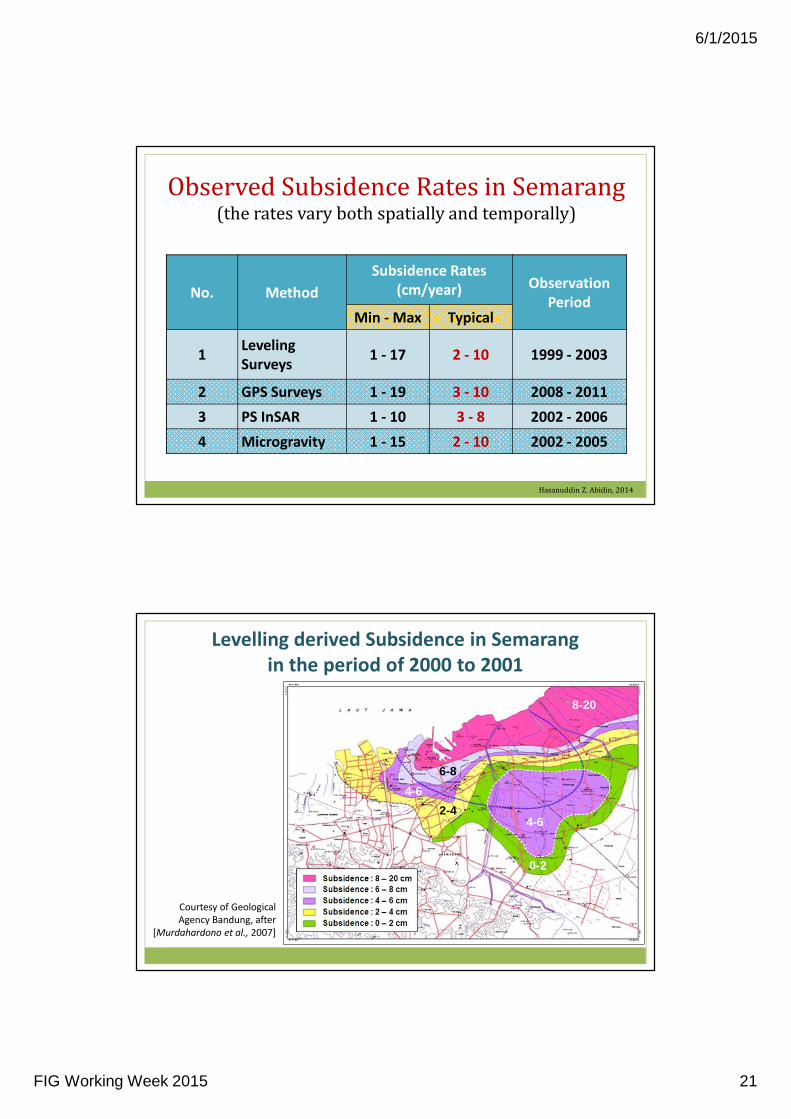
Observed Subsidence Rates in Semarang(the rates vary both spatially and temporally)
Hasanuddin Z. Abidin, 2014
No. Method
Subsidence Rates
(cm/year) Observation
PeriodMin - Max Typical
1Leveling
Surveys1 - 17 2 - 10 1999 - 2003
2 GPS Surveys 1 - 19 3 - 10 2008 - 2011
3 PS InSAR 1 - 10 3 - 8 2002 - 2006
4 Microgravity 1 - 15 2 - 10 2002 - 2005
Levelling derived Subsidence in Semarang
in the period of 2000 to 2001
Courtesy of Geological
Agency Bandung, after
[Murdahardono et al., 2007]
4-6
8-20
0-2
2-4
4-6
6-8
6/1/2015
FIG Working Week 2015 22
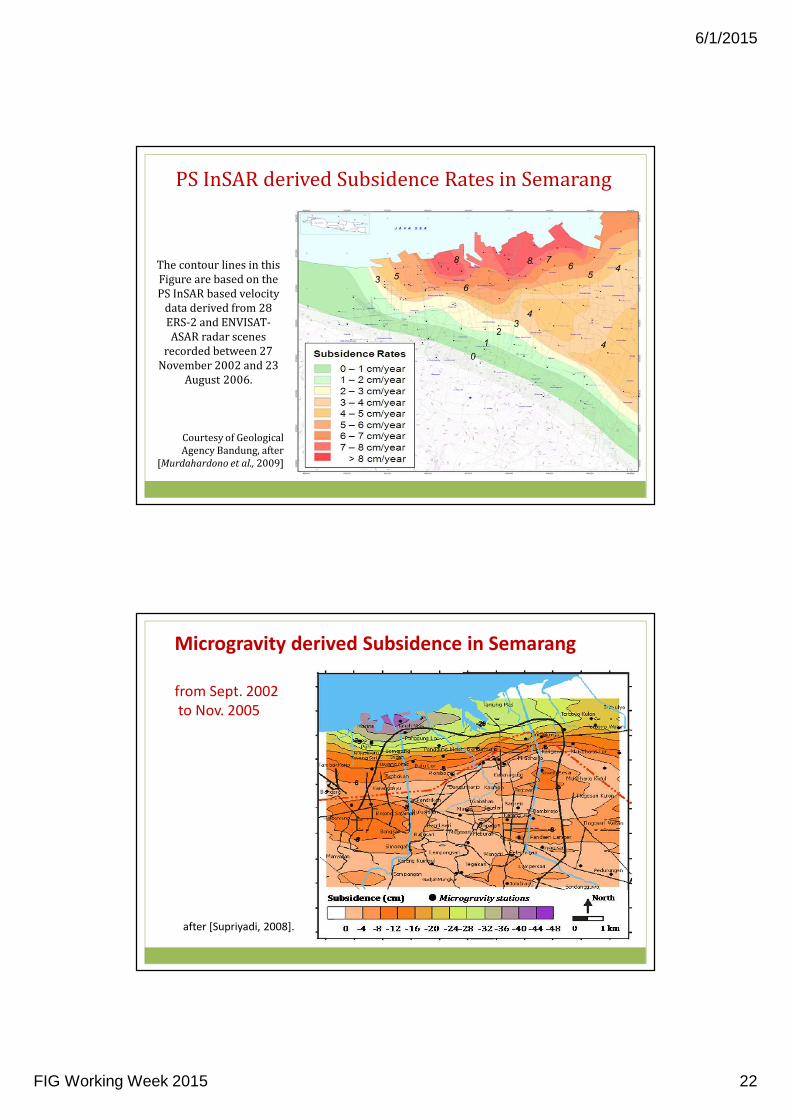
PS InSAR derived Subsidence Rates in Semarang
Courtesy of Geological
Agency Bandung, after
[Murdahardono et al., 2009]
The contour lines in this
Figure are based on the
PS InSAR based velocity
data derived from 28
ERS-2 and ENVISAT-
ASAR radar scenes
recorded between 27
November 2002 and 23
August 2006.
Microgravity derived Subsidence in Semarang
from Sept. 2002
to Nov. 2005
after [Supriyadi, 2008].