rechargeable vehicles infrastructure deployment policy ... vehicles infrastructure... ·...
TRANSCRIPT

RECHARGEABLE VEHICLES INFRASTRUCTURE DEPLOYMENT POLICY:
FRENCH CASE
by
Paul Lucchese, CEA
Scientific Directorate of CEA-TECH
Technological Division of
Commissariat à l’Energie Atomique et aux Energies Alternatives
Background paper for the IFP/IEA/ITF Workshop on
“Developing infrastructure for alternative transport fuels and power-trains to 2020/2030/2050:
A cross country assessment of early stages of implementation”
OECD, 30th November 2012

2
OUTLINE
1- Background:
a. French Energy landscape
b. Main characteristics of individual transport system and mobility in France
c. Main policy drivers and measures for a decarbonized transport system in France
2- Deployment of electric cars and infrastructure: State of the art and
perspectives
a. main principles
b. electric cars figures
c. charge point figures
d. Synthetic Analysis of the French model/lessons learned

3
1- Background
a. French Energy landscape
In 2011, the total primary energy consumption reaches the amount of 275 M toe (“tons of
oil equivalent”) and the final energy consumption 168 M toe. In relationship with the
existing and future transport energy demand, it will be reminded the main characteristics of
French energy mix (figures from 2011 statistics) :
- Electricity production: 569 TWh, mainly from domestic and CO2-free sources at 92 %:
nuclear for 79%, Renewables for 13 %, the remaining 8% is from imported Fossil fuels.
According to 2009/28/CE, part of renewable in electricity production is 16, 2 %.
- ratio of energetic independency: 53,5 %: an ratio between domestic primary energy
on total primary energy production, including nuclear, renewable and very small part
of domestic fossil
- exportations of electricity are pretty large: around 56 TWh in 2011, corresponding to 12 % of French production and earning a 2,5 B€ income.
- Importations of fossils fuel (oil, gas and coal) for a near 64 B€ bill, accounted for 88%
of the country’s trade deficit and it represents 3.1% of GDP. The share of Renewables in final consumption is around 13 % for a target of 23 % in 2020.
According to figure 1, the main renewable sources are Hydraulic and Wind for 33 % (mainly
for electricity production) and Biomass/Waste for 66 % (Heat, biofuels and electricity).
Figure 1: Repartition of renewable in France in %

4
Zooming on electric production, a typical consumption profile (Day 23rd November 2012) is
described on figure 2 and figure 3 presents the CO2 emission profile during the same day.
This situation is typically from a normal and frequent working day, without large peak
consumption due to very cold temperature for example.
Figure 2
Figure 3
What is noticeable is that the spread between minimum and maximum of power is about 20
GW (50 GW to 70 GW) far below maximum power capacity, secondly the CO2 emissions are
rather low even during peak period. That could indicate that for a large majority of days in
the year, increasing for a few percents the maximum power (let’ say between 3 to 6 GW,
0
10000
20000
30000
40000
50000
60000
70000
80000
00
:00
01
:30
03
:00
04
:30
06
:00
07
:30
09
:00
10
:30
12
:00
13
:30
15
:00
16
:30
18
:00
19
:30
21
:00
22
:30
Po
we
r (M
W)
France Total electric production during 23 rd november 2012
Consommation
0
10
20
30
40
50
60
70
00
:00
01
:00
02
:00
03
:00
04
:00
05
:00
06
:00
07
:00
08
:00
09
:00
10
:00
11
:00
12
:00
13
:00
14
:00
15
:00
16
:00
17
:00
18
:00
19
:00
20
:00
21
:00
22
:00
23
:00
Co2 Emissions (g/kWh) from french electricty production
23 rd november 2012

5
could corresponds to 1 to 2 Million electric cars slow recharging), there will be no dramatic
increase of CO2 emissions.
The power plants are relatively well geographically distributed along the national territory
and the Transport and distribution system in France is a high quality and reliable grid,
covering every cities, villages and remote area but there are two weak areas corresponding
to a high unbalance between production and consumption: Brittany area and Provence
region. These two regions are often called “electric peninsula” to stress out a weaker grid
and higher risk of black out during winter time for example or when a local incident
weaknesses the regional grid.
b. Main characteristics of individual transport system and mobility in
France
General considerations on Mobility in France
France is a rather large country in Europe (550 000 Km2) with some non-or low-populated
areas and a few very populated. More than 36 Millions of inhabitants are living in
concentrated area, the main 50 urban areas above 200 000 inhabitants (Purple and red area
on figure 4) but representing only 8 % of the territory. But 95 % of the French population (65
Million inhabitants) are “influenced” in their daily life by the nearest city.
Figure 4: French population density map (Inhabitants/Km2)

6
The share of road transportation both for passengers and goods is around 88% (727 billion
km-passengers or near 400 Billion km-vehicles), despite some high level urban transport
system in big cities and a high quality level of high speed train network (TGV) between main
populated areas (Paris, Lyon, Marseille, Nantes, Lille, Strasbourg). Interesting for the future
electric car systems is the share of road transportation along the nature of trip described in
figure 5:
Figure 5: repartition of road mileage according to type of road trip in France
Type Trip Mileage (km) % of total French road mileage
Very short urban journey 1 to 10 km 9 %
Intermediate journey (leisure, visits, shopping…)
10 to 100 km 48 %
Commuting journey (Home /Work) < 100 km
1 to 100 km 22 %
Long distance journey + long distance commuting
>100 km 21 %
The total number of cars in France is about 31 Millions, and near 6 millions of utility cars,
trucks, buses etc…
An important parameter for future business model for electric cars charging is also where
and how the cars are parked (figure 6)
Figure 6: repartition of car parking
Type of parking Urban area in France Paris (downtown)
Private (house, building)
53 % 60 %
Public parking lot
15 % 20 %
Street parking
32 % 20 %
Paris inhabitants have a very low motorization ratio: only 42 % of population do have a car in
Paris city, and 68 % in Paris urban area. The French mean value is 84 %.
Important figure to be noticed: there are 15 million of individual houses in France, 50 % are
equipped with a private garage.

7
Energy and CO2/polluants emissions
The energy consumption in Transport sector is highly oil-dependant, more than 90%. The
Green house gases emissions in transport sector represent 28 % of total French GHG
emissions, on which half (14%) is due to individual cars .
The mean value of CO2 emissions dropped these last years to a 127,9 g CO2 /km in 2011.
Figure 7: mean CO2 emissions for a new car (gCO2/km) in France
This dramatic decrease in new cars emissions is a combination of three factors:
- thanks to a positive/negative incentive (taxes on new cars according to their CO2
emission levels described for 2013 figure 8) promoting the lowest emissions cars
- linked with the former factor, a new tendency to down size the type of cars to
more and more “Small” and “lower medium” cars is observed very clearly for a
few years (For A, B, M1 market segments).
- the high ratio of diesel cars in France, now more than 70 % of new cars are diesel
engine powered but more than 80 % of fuel consumption( and mileage too) in
France is diesel. As specific consumption of a diesel car is 12 % less than a
gasoline one, mean CO2 emissions are lower.
8
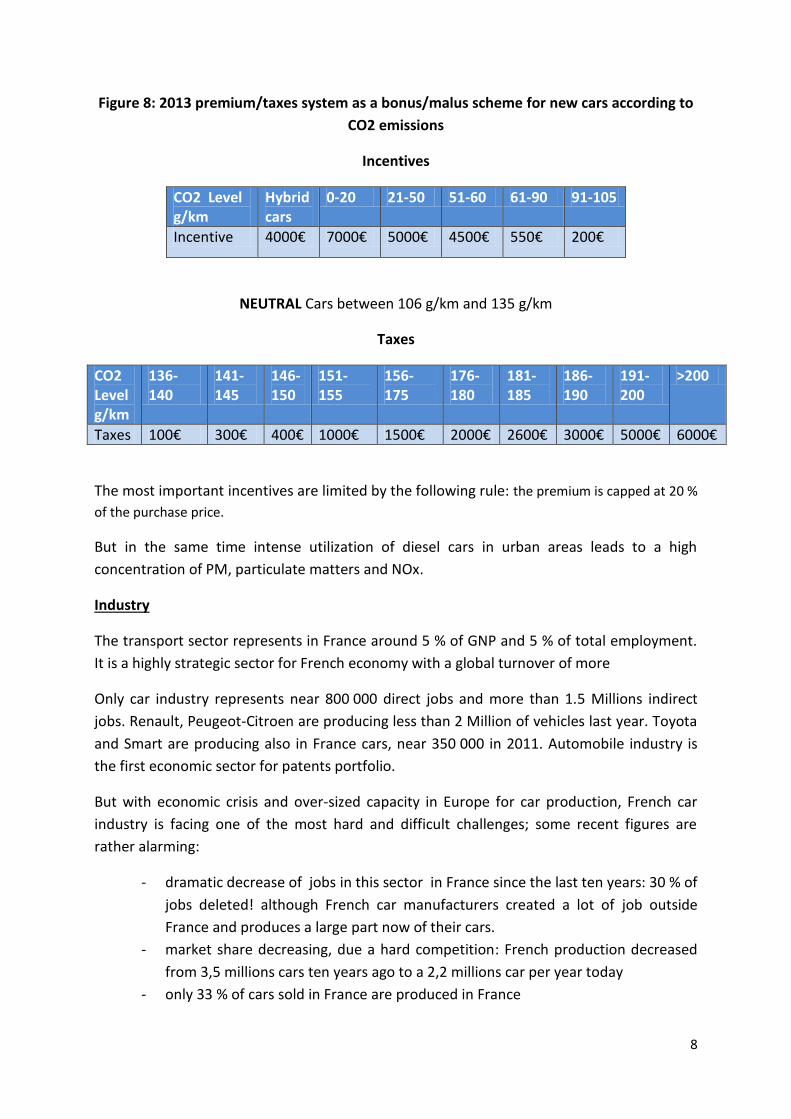
Figure 8: 2013 premium/taxes system as a bonus/malus scheme for new cars according to
CO2 emissions
Incentives
CO2 Level g/km
Hybrid cars
0-20 21-50 51-60 61-90 91-105
Incentive 4000€ 7000€ 5000€ 4500€ 550€ 200€
NEUTRAL Cars between 106 g/km and 135 g/km
Taxes
CO2 Level g/km
136-140
141-145
146-150
151-155
156-175
176-180
181-185
186-190
191-200
>200
Taxes 100€ 300€ 400€ 1000€ 1500€ 2000€ 2600€ 3000€ 5000€ 6000€
The most important incentives are limited by the following rule: the premium is capped at 20 %
of the purchase price.
But in the same time intense utilization of diesel cars in urban areas leads to a high
concentration of PM, particulate matters and NOx.
Industry
The transport sector represents in France around 5 % of GNP and 5 % of total employment.
It is a highly strategic sector for French economy with a global turnover of more
Only car industry represents near 800 000 direct jobs and more than 1.5 Millions indirect
jobs. Renault, Peugeot-Citroen are producing less than 2 Million of vehicles last year. Toyota
and Smart are producing also in France cars, near 350 000 in 2011. Automobile industry is
the first economic sector for patents portfolio.
But with economic crisis and over-sized capacity in Europe for car production, French car
industry is facing one of the most hard and difficult challenges; some recent figures are
rather alarming:
- dramatic decrease of jobs in this sector in France since the last ten years: 30 % of
jobs deleted! although French car manufacturers created a lot of job outside
France and produces a large part now of their cars.
- market share decreasing, due a hard competition: French production decreased
from 3,5 millions cars ten years ago to a 2,2 millions car per year today
- only 33 % of cars sold in France are produced in France

9
With the recent announcement (last July) of Peugeot to shut down the Aulnay production
plant, there is a big concern about car industry revitalization and it is now on the top level
priority for the French government. Jobs creation in France, innovation, sustainable
transport system are the key parameters for French policy support to Car industry.
c. Main policy drivers and measures for a decarbonized transport
system in France
France Energy policy is completely integrated in European energy policy and Climate-Energy package. Energy law in 2005, then the three laws in 2008 to 2010, following the “Grenelle de l’environnement” (national debate in 2007 to 2009) determined the following mandatory objectives:
- 23 % of renewable in energy mix in 2020 - 20 % CO2 reduction in 2020 - 20 % increase in energy efficiency
For 2050 an ambitious target of 80 % Greenhouse gases reduction was fixed, with a 95 % reduction in transportation sector. In automotive industry France succeed with Portugal to reach the target of 130 gCO2/km in 2010 (cf paragraph above) as it was foreseen by European legislation in 2015!
2- Deployment of electric cars and infrastructure: state of the art and
perspective
a. General characteristics of French policy and main guidelines on
electric cars and charging infrastructure:
Deployment of electric cars and infrastructure could bring a partial but significant answer to
the main issues:
o decarbonizing transport system by substituting a fossil fuel by low carbon
french electricity with a double benefit: GHG reduction and reduction of
oil bill (reducing commercial balance deficit)
o creating jobs and economic added value in France
o impulse a strong innovation effort in this old industry
o reducing pollution in cities, especially PM pollutants but it could be only
achieved with a significant share of Zero emission vehicles. It will take two
decades to reach this level.
The French governmental support is strongly linked to a production of car localized mainly in
France and creating job and economic added value.
Specifically for electric cars (BEV and PHEV), the main measures are:

10
- incentives are the main policy measure to accelerate market deployment o national level (described in paragraph above) a premium up to 7000€ for
a electric car and 4000€ for an hybrid vehicle. The premium is capped at 20 % of the purchase price.
o A similar tax exemption for company vehicles is in place (ACEA 2012). Getting fleet owners to switch to EVs is important as it gives the opportunity for large scale tests of the technology and economies of scale for the producers. As such the company car tax exemption is important.
o sometimes with an additional incentive at regional or municipal level like in Strasbourg city up to end 2011.
- public procurements with relatively high volume: at least 25 % of public procurements for car in french administration must be electric or hybrids vehicles (only electric for an urban usage), and recommendation measures will be taken for local administration and public companies. In total french government has commited to buying 50000 EV (BEV, PHEV). As an example a public procurement for 15 637 plus an additional 3074 electric cars (Kangoo ZE) was achieved last year by french postal, La Poste, for delivery and deployment from 2015.
- Infrastructure:
o french law confirm the possibility for local authorities (municipalities, association of different cities) to deploy public electric infrastructures.
o mandatory obligation for new building and houses and new working place: pre-cabling installation for a future charge point installation
o mandatory measure to facilitate charging point installation in existing building
Coming soon in 2013 and 2014, additional measures should be taken and help EV:
- “ZAPA” area creation in pilot cities: priority area for a clean air, could mean interdiction of oldest vehicles in city center, and promote zero emission vehicles
The main targets for electric vehicles and charge infrastructure are listed in figure 9&10:
Figure 9: national targets for electric cars sales in France
11
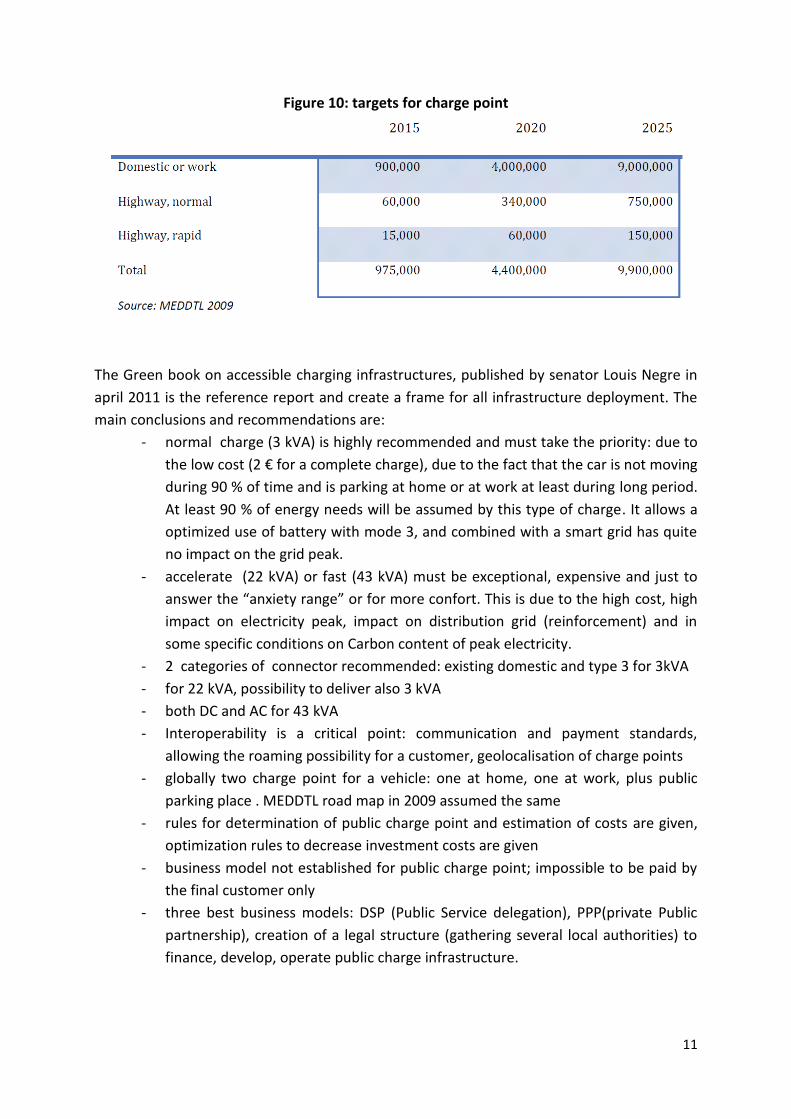
Figure 10: targets for charge point
The Green book on accessible charging infrastructures, published by senator Louis Negre in
april 2011 is the reference report and create a frame for all infrastructure deployment. The
main conclusions and recommendations are:
- normal charge (3 kVA) is highly recommended and must take the priority: due to
the low cost (2 € for a complete charge), due to the fact that the car is not moving
during 90 % of time and is parking at home or at work at least during long period.
At least 90 % of energy needs will be assumed by this type of charge. It allows a
optimized use of battery with mode 3, and combined with a smart grid has quite
no impact on the grid peak.
- accelerate (22 kVA) or fast (43 kVA) must be exceptional, expensive and just to
answer the “anxiety range” or for more confort. This is due to the high cost, high
impact on electricity peak, impact on distribution grid (reinforcement) and in
some specific conditions on Carbon content of peak electricity.
- 2 categories of connector recommended: existing domestic and type 3 for 3kVA
- for 22 kVA, possibility to deliver also 3 kVA
- both DC and AC for 43 kVA
- Interoperability is a critical point: communication and payment standards,
allowing the roaming possibility for a customer, geolocalisation of charge points
- globally two charge point for a vehicle: one at home, one at work, plus public
parking place . MEDDTL road map in 2009 assumed the same
- rules for determination of public charge point and estimation of costs are given,
optimization rules to decrease investment costs are given
- business model not established for public charge point; impossible to be paid by
the final customer only
- three best business models: DSP (Public Service delegation), PPP(private Public
partnership), creation of a legal structure (gathering several local authorities) to
finance, develop, operate public charge infrastructure.

12
- A global mobility service (like Autolib in Paris) has at least two advantages: scale
factor, fusion between charge point parking place and mobility servive itself
(electric cars rent).
b. Electric cars
The total number of electric cars in France in November 2012 are around 13 000 to 15 000,
including a 3000-4000 small vehicles or specific vehicles plus scooters or motorbike with
sales of 184 in 2010, 2630 in 2011 and 5102 up to October 2012 (Figure 11 12, 13). (Source
Ademe www.ademe.fr , plus Yoann Nussbaumer, website www.automobile-propre.fr ).
CCFA gives 7858 cars sold up to 31/10/2012.
Figure 11: Electric cars sales 2010-2012
Figure 12: Type of cars sold (2012)

13
Figure 13: Special electric vehicles sold
c. Figures and deployment of infrastructure
The existing charge points are described in figure 14.
Figure 14: Estimation of public charge points
Type Installed CP 2012 2015 2020
Mode 1Non specific 8000 8000 50 000
Mode 2 50 000 100 000
Mode 3/Type 3 30 000 70 000 400 000
Mode 4/CHAdeMO 100 7500 10 000
Mode 4/Combo 2 10 000
MULTI STANDARTS 8000 15000 20000
Figure 14 bis: Estimated private charging Point
Type Installed CP 2012 2015 2020
Mode 3 domestic 0 150 000 1 000 000
Mode 3/Type 3 30 000 70 000 400 000
Mode 4/CHAdeMO 100 7500 20 000
Source: Governmental working group, MEDDTL and MRP, France 2012
Another source EURELECTRIC 2011 gives for existing connector Type 3 28 000 installed or
commissioned,50 % private 50 % publicly accessible.

14
Two programmes are devoted to support deployment, under the frame of “Investissement for the future”, funded by government:
- € 50 million is available for infrastructure development through the “Ville de demain” project run by the French environmental and energy agency (ADEME 2011). 50% of costs for normal and fast charge points and 30% of costs for rapid charge points are covered given that the points are made publicly available. In accordance with the governmental strategy, 13 pilot projects in towns across France have been done to test the deployment and use of charge points. Experience from the demonstration project in Strasbourg with EDF, Toyota and Strasbourg City indicates that charging happens during peak hours. The cars are plugged in when they arrive at work at 08:00 and when they get back home around 19:00, To get the full environmental benefit from EVs, charging patterns must change, smart meters must be installed or differential pricing must be implemented to incentivize charging during low load hours
- € 50 million under the same frame, and run also by French ADEME is available also through deployment experimentation to test technical, financial and societal conditions of such systems.
COSTS ISSUES
The cost of installing charge points has come down lately. In 2011 the costs were € 500 to €
3,700 for home, parking or work charging, € 7,800 for fast charge on highways and € 55,000
for rapid charging (MEDDTL 2011, p. 16).4 With the new cost per charging station, the break
even price in €/kWh would be 3 times higher than the electricity cost.
For a 3 kVA connections, depending on whether 2 or 12 charging spots are served from one
charging station, costs can range from €4,000 to €9,000 per charging station (all costs taken
into account) in 2011.There is additional costs for DSO (Distribution operator, which in
France has to pay 40 % of the electricity installation). The economies of scale observed are
significant and depend on the rate of proliferation of the charging spots (number of charging
spots or parking places served by a given point of connection to the power grid).
Who will be pay for that?
For example, Green Book estimates if were the charging infrastructure costs to be borne totally
by the end users, they would have to pay – for each “top-up” of 25 kWh – between €13 for a 3-kVA
charging station at normal charge and €36 for a 43-kVA fast charging station, to which €2, being the
cost of electricity, should be added.
In total, the TCO, total cost of ownership for a medium ICE car is estimated to 22 000€ today. For the
same type for vehicle but BEV, the TCO could be:
- 29 000 €, if charging is at home, including battery costs, 500€ for a home connector, plus
some public charging sometimes
- 39 000€ if the main charge point is public (parking, street, fast charging)
The incentive could help to make profitable the first case (home) but never the second one.

15
When all these infrastructure costs are transferred to the end user, it becomes clear, at least during the initial years of the starting up of the market, that infrastructure costs partially hamper the competitiveness of rechargeable vehicles compared to ICE vehicles, and that it would be difficult to put the burden of financing the public infrastructure on the end user. These costs can be very significant (approximately €9,000 over 8 years) for users who park mainly in public areas (second case). This factor must be taken into consideration by the local authorities/municipalities in assessing the charging infrastructure and in prioritising the customer segments. In this respect, shared charging could prove to be a higher priority and economically more efficient to allow the market to reach critical mass than main charging in the public area, which would be developed in the second phase. In conclusion there is not a clear business case for public charge system.
- Probably, at least for the first 10 years, investment has to be taken by public authorities or public parking operators, or supermarkets for investment.
- As an example, on the scale of the 25 largest cities in France, this implies a cost flow (investments + operations) of some € 45 m in 2011 and € 300 m in 2014 for setting up the project. For example for a city like Rouen (500 000 inhabitants), it represents 3-4 millions in 2015.
- One of the most pragmatic solution will be to deploy progressively in the cities faster choosing the location. For public parking one way to compensate the extra costs of a few charging point could be to extend the duration of private contract to run a public service by one year for example. For super or hyper-market parking, such investment could be included in investment budget progressively.
- In a more global perspective, the total investment is estimated on figure 15.
Figure 15: Total investment needed up to 2025 for electric infrastructure

16
One major bottleneck in France could be the drastic reduction and cut in public budget, both
at national level but also now at local level for the next 6 years.
Standards and regulatory issues
One issue is that Type 2 AC connector are not allowed in France according to French
standards and regulations, at the contrary of others European countries. EURELECTRIC
expressed its concerns about the absence of agreement. A standardized connector is
expected in 2017.
d. Synthetic Analysis of the French model/lessons learned/
Conclusions
The French model for electric car deployment is based on some specific aspects:
- electricity mix without CO2
- characteristic of small or medium vehicles
- priority to jobs creation and car industry revitalization
- national and global plan to help the market to start
- BUT implementation at local level
- choice of normal charge priority and not fast charging
- complementary publicly accessible infrastructure
- BUT no profitable business case
- public and local investment needed
- BUT difficulty to invest in economic crisis
Only one promising: “Autolib” model because it is not only a charge point service but a mobility
service
Dilemma:: an electric car have to run a important mileage to become profitable but an electric car
will run only on urban area
In any case the market is growing but slower than foreseen
What about taxes lost when substituting gasoline by electricity ?
Example Let’s take 1 million electric car running 13 000 km a year with an electricity consumption of
15 kWh/100 km.
In total 2 GWh are needed. These 2 GWH are decreasing the exportation balance by 5 %, loss for
commercial balance of 125 M€
In the other hand, some gasoline consumption and CO2 emissions are avoided: around 0,8 Million t,
leading to decrease the oil bill by 1 000 M€
So the net trade balance is dramatically improved, and CO2 emissions decrease also by around 3 %!
Positive externalities are net creation of jobs in the country.

17
But some taxes are lots by government:
Taxes are 0,66€ per liter on diesel; electricity is only VAT taxed (20%);
1 million electric vehicle lead to a net loss of around 500 M€.
If we add all incentives for cars and infrastructure, the total amount could be highly expensive for the
public budget (national and local)
The global interest for the nation is obvious. Nevertheless it has a big impact on budget.
It is a sensitive point and a global economic approach taken into account all externalities has to be
carry out to measures all the consequences of electric cars deployment at large scale.