recent fdi trends, policies and challenges in see ... · 1 recent fdi trends, policies and...
TRANSCRIPT

Recent FDI trends, policies and challenges in SEE countriesin comparison with other regions in transition
by Gábor Hunya
The Vienna Institute for International Economic Studies (WIIW)
Paper to be presented at the Conference on
FOREIGN DIRECT INVESTMENT IN SOUTH EAST EUROPE:
IMPLEMENTING BEST POLICY PRACTICES
Parkhotel Schönbrunn, Vienna, Austria, 8-9 November 2000
Organized within the framework of the
South East Europe Compact for Reform, Investment, Integrity and Growth
and Hosted by the Government of Austria
Contents
1. Main characteristics of FDI in South Eastern Europe as compared toCentral European transition countries...........................................................................1
1.1 Economic development and FDI ........................................................................1
1.2 FDI by investing countries and economic activities............................................5
1.3 The relationship of privatization and FDI in SEECs ...........................................9
2 Characteristics of foreign penetration in manufacturing .............................................12
3 Government policies related to FDI ............................................................................15
3.1 FDI policy frameworks and incentives..............................................................15
3.2 Privatization-related FDI policies: the role of commitments .............................17
4 Corruption and state capture.......................................................................................18
5 Conclusions .................................................................................................................22
5.1 How to explain low FDI in SEECs ? .................................................................22
5.2 Benefits and problems related to foreign penetration and takeovers:lessons from CEECs.........................................................................................24
5.3 Policy conclusions.............................................................................................25
References .........................................................................................................................27
Appendix: Policies diverting FDI: the case of Romania.....................................................28
Appendix references ..........................................................................................................33
Statistical Appendix
List of Tables and Figures
Table 1 Basic indicators of CEEC-7 and SEEC-5, 1999 ............................................................2
Table 2 FDI stock in SEEC-5, by investing countries, 1999, shares in %.................................6
Table 3 FDI stock in SEECs, by sectors, 1999, USD mn, shares in %.....................................7
Table 4 Distribution of enterprise assets among privatization methods
in selected South-East European countries, up to 1998, per cent ...............................9
Table 5 Privatization-related FDI inflows in selected Central and Eastern European
countries, 1991-1999, USD million and per cent .........................................................10
Table 6 Share of foreign investment enterprises (FIEs) in main indicators
of manufacturing companies, 1996, 1998, per cent ....................................................12
Table 7 Industries with significant above-average shares of FIEs in sales,
1994, 1996, 1998, per cent............................................................................................13
Table 8 Romania: foreign penetration (share of FIEs in sales) and export intensity
by manufacturing industries, 1998, per cent ................................................................14
Table 9 Corruption and state capture in South Eastern Europe:
overview of sources and indicators...............................................................................19
Figure 1 FDI stock per GDP, per cent 1999..................................................................................4
Figure 2 FDI and economic development in CEECs and SEECs...............................................4
Figure 3 Annual per capita FDI inflows 1995-1999, USD............................................................5
1
Recent FDI trends, policies and challenges in SEE countriesin comparison with other regions in transition
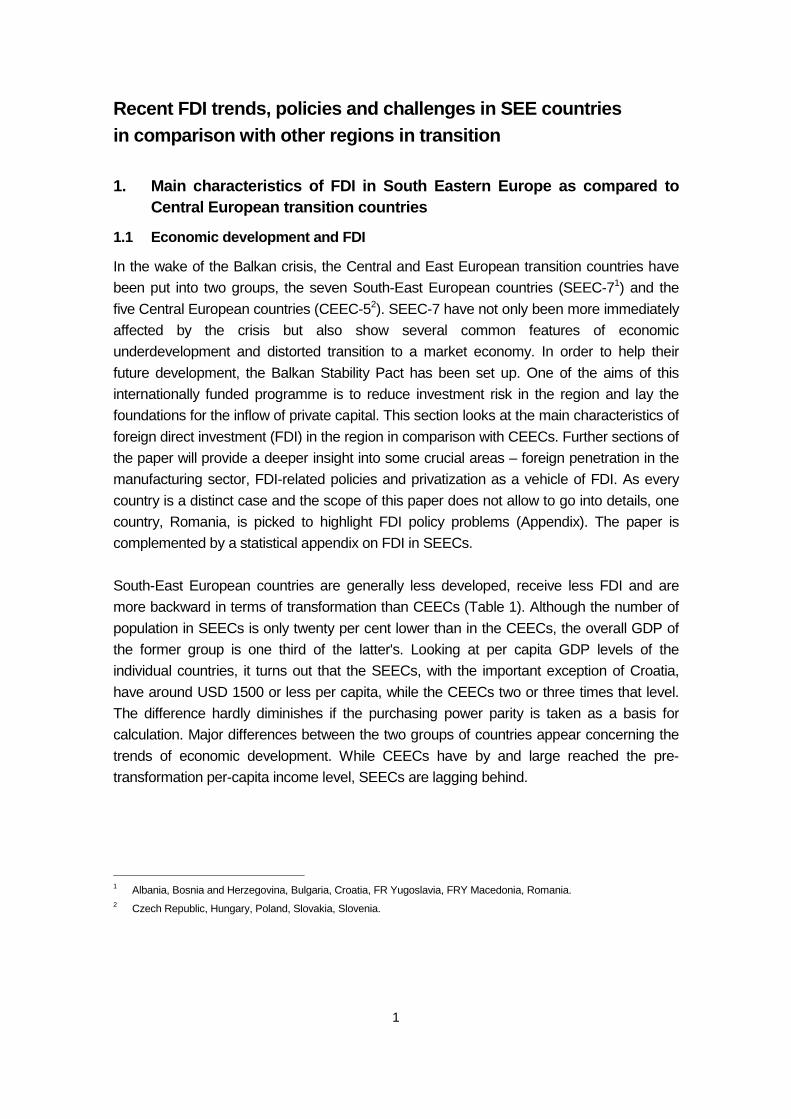
1. Main characteristics of FDI in South Eastern Europe as compared toCentral European transition countries
1.1 Economic development and FDI
In the wake of the Balkan crisis, the Central and East European transition countries have
been put into two groups, the seven South-East European countries (SEEC-71) and the
five Central European countries (CEEC-52). SEEC-7 have not only been more immediately
affected by the crisis but also show several common features of economic
underdevelopment and distorted transition to a market economy. In order to help their
future development, the Balkan Stability Pact has been set up. One of the aims of this
internationally funded programme is to reduce investment risk in the region and lay the
foundations for the inflow of private capital. This section looks at the main characteristics of
foreign direct investment (FDI) in the region in comparison with CEECs. Further sections of
the paper will provide a deeper insight into some crucial areas – foreign penetration in the
manufacturing sector, FDI-related policies and privatization as a vehicle of FDI. As every
country is a distinct case and the scope of this paper does not allow to go into details, one
country, Romania, is picked to highlight FDI policy problems (Appendix). The paper is
complemented by a statistical appendix on FDI in SEECs.
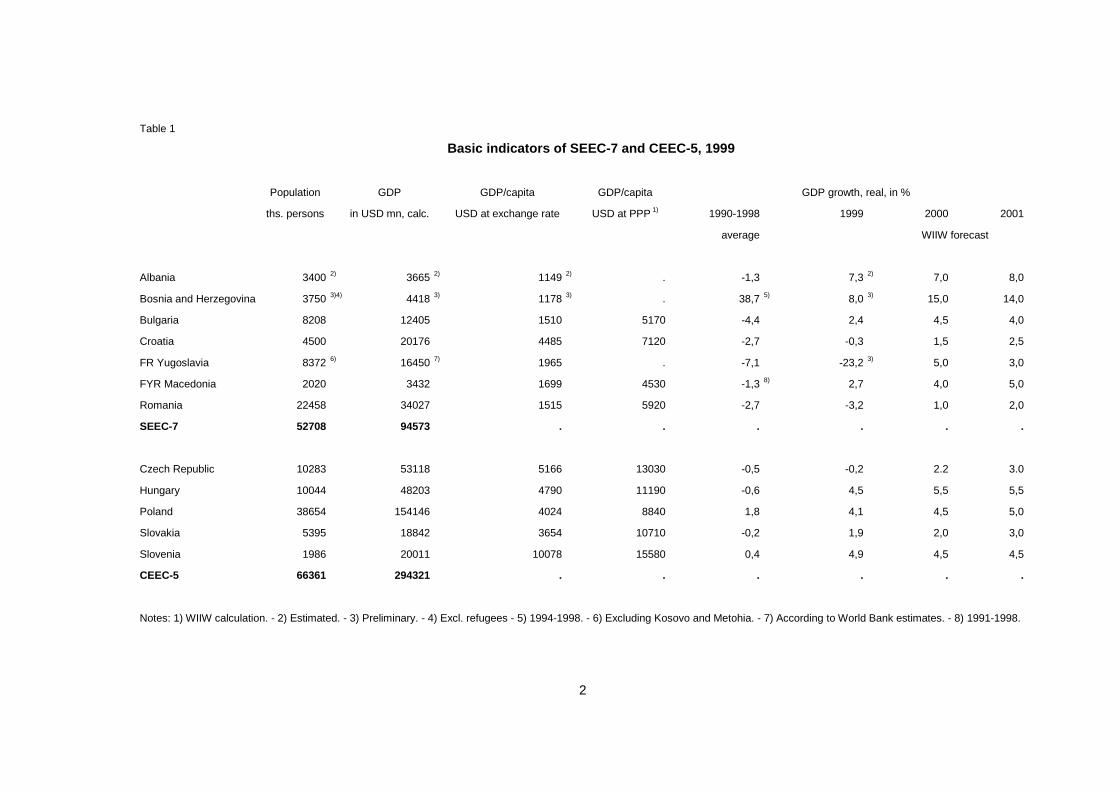
South-East European countries are generally less developed, receive less FDI and are
more backward in terms of transformation than CEECs (Table 1). Although the number of
population in SEECs is only twenty per cent lower than in the CEECs, the overall GDP of
the former group is one third of the latter's. Looking at per capita GDP levels of the
individual countries, it turns out that the SEECs, with the important exception of Croatia,
have around USD 1500 or less per capita, while the CEECs two or three times that level.
The difference hardly diminishes if the purchasing power parity is taken as a basis for
calculation. Major differences between the two groups of countries appear concerning the
trends of economic development. While CEECs have by and large reached the pre-
transformation per-capita income level, SEECs are lagging behind.
1 Albania, Bosnia and Herzegovina, Bulgaria, Croatia, FR Yugoslavia, FRY Macedonia, Romania.2 Czech Republic, Hungary, Poland, Slovakia, Slovenia.
2
Table 1
Basic indicators of SEEC-7 and CEEC-5, 1999
Population GDP GDP/capita GDP/capita GDP growth, real, in %
ths. persons in USD mn, calc. USD at exchange rate USD at PPP 1) 1990-1998 1999 2000 2001
average WIIW forecast
Albania 3400 2) 3665 2) 1149 2) . -1,3 7,3 2) 7,0 8,0
Bosnia and Herzegovina 3750 3)4) 4418 3) 1178 3) . 38,7 5) 8,0 3) 15,0 14,0
Bulgaria 8208 12405 1510 5170 -4,4 2,4 4,5 4,0
Croatia 4500 20176 4485 7120 -2,7 -0,3 1,5 2,5
FR Yugoslavia 8372 6) 16450 7) 1965 . -7,1 -23,2 3) 5,0 3,0
FYR Macedonia 2020 3432 1699 4530 -1,3 8) 2,7 4,0 5,0
Romania 22458 34027 1515 5920 -2,7 -3,2 1,0 2,0
SEEC-7 52708 94573 . . . . . .
Czech Republic 10283 53118 5166 13030 -0,5 -0,2 2.2 3.0
Hungary 10044 48203 4790 11190 -0,6 4,5 5,5 5,5
Poland 38654 154146 4024 8840 1,8 4,1 4,5 5,0
Slovakia 5395 18842 3654 10710 -0,2 1,9 2,0 3,0
Slovenia 1986 20011 10078 15580 0,4 4,9 4,5 4,5
CEEC-5 66361 294321 . . . . . .
Notes: 1) WIIW calculation. - 2) Estimated. - 3) Preliminary. - 4) Excl. refugees - 5) 1994-1998. - 6) Excluding Kosovo and Metohia. - 7) According to World Bank estimates. - 8) 1991-1998.

3
As to the current rate of economic growth, the differences are more within than between
the two groups. GDP growth in 1999-2000 has been robust only in some of the CEECs:
Hungary, Poland and Slovenia. Also most of the southern countries show relatively high
economic growth rates following the Kosovo war. Albania as well as Bosnia-Herzegovina
witness a reconstruction-type upswing fuelled by domestic consumption which is financed
from abroad. Macedonia and Bulgaria have medium-high rates of growth after years of
severe transformational recessions. The less successful countries, Romania, Croatia – in
some respects similar to the Czech Republic and Slovakia – still struggle with slow growth
due to protracted transformation. The Yugoslav economy is a special case due to
distortions inflicted by war and embargo. Per capita GDP is currently only one third of the
level ten years ago and it is not expected that the reconstruction process will be very fast.
The relationship between FDI and economic growth is twofold: FDI stimulates economic
growth, but also reacts to economic growth and progress of transformation. Growth is
generated by FDI through imported means of investment, new technologies and
capabilities transferred by foreign multinationals and international networking. On the other
hand, foreign investors react positively to the consolidation of market-economy rules and
the resumption of economic growth. Among the CEECs, Hungary has had an economic
recovery strongly supported by the inflow of FDI. Poland, on the other hand, started to
receive substantial amounts of foreign capital only after economic growth became robust.
The most advanced CEEC with stable if not very impressive rates of economic growth is
Slovenia, which has not attracted much FDI. In principle, all these three success stories
can be the basis for feasible recommendations for the Balkan region. But for more
backward SEE economies with a low rate of domestic capital accumulation, it may be
necessary to have a more intensive FDI inflow to kick-start economic growth.
FDI stock per GDP is fairly even among countries of different development levels. Most of
the countries under discussion have this indicator in the range of 10-20% (Figure 1), which
is the world average. The relationship of development and FDI is demonstrated by the
similarity of per capita GDP and per capita FDI (Figure 2). Outliers matter most in this case.
Countries above the regression line have higher FDI stocks than the level of economic
development would suggest. Among the CEECs, Hungary and, less so, the Czech
Republic have higher than average FDI stock/GDP. Especially in the case of Hungary, this
indicates a special economic development path connected with a strong presence of
foreign multinationals.
Negative outliers are found both among the CEECs (Slovenia, Slovakia) and the SEECs.
Macedonia and most probably also the two countries without an up-to-date FDI statistics,
Bosnia-Herzegovina and Yugoslavia, attracted less FDI than their development level would
allow. These countries have been exposed to war and were thus avoided by investors. It is
possible that political settlement in the region would in itself generate enough FDI to bring

4
these countries in line with the others in the region. But in fact all the other SEECs have
less FDI per GDP than successful newly industrializing countries. Thus the scope for
improving the investment environment and the policy framework is enormous.
Figure 1
FDI stock per GDP, per cent 1999
Figure 2
FDI and economic development in CEECs and SEECs
0,0
5,0
10,0
15,0
20,0
25,0
30,0
35,0
40,0
45,0
Albania
Bosnia
and H
erze
govin
a2)
Bulgar
ia
Croat
ia
FYR Mac
edonia
Romania
Czech
Rep
ublic
Hungar
y
Poland
Slovak
ia
Slovenia
in %
y = 0,176x + 82,398
R2 = 0,5224
0,0
200,0
400,0
600,0
800,0
1000,0
1200,0
1400,0
1600,0
1800,0
2000,0
0 2000 4000 6000 8000 10000 12000
GDP/capita (USD at exchange rate)
FDI stock/capita,(in USD)
SL
HU
CZ
CROPL
SR
MACALROB
5
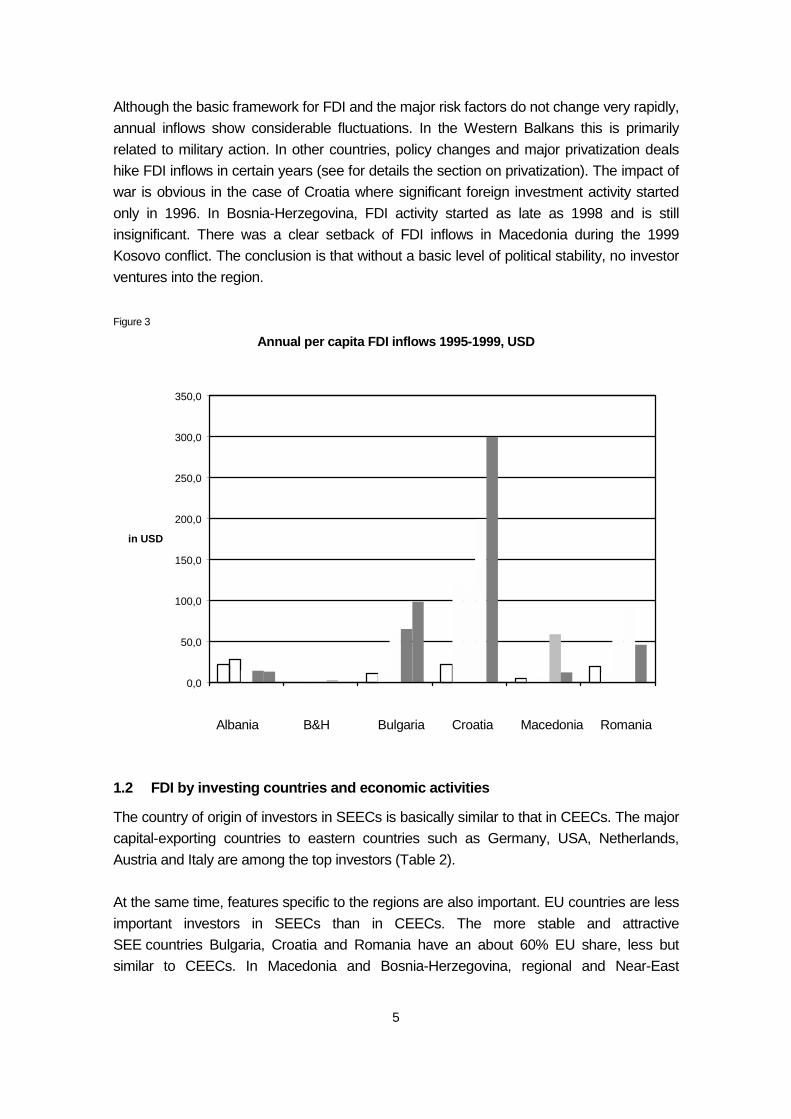
Although the basic framework for FDI and the major risk factors do not change very rapidly,
annual inflows show considerable fluctuations. In the Western Balkans this is primarily
related to military action. In other countries, policy changes and major privatization deals
hike FDI inflows in certain years (see for details the section on privatization). The impact of
war is obvious in the case of Croatia where significant foreign investment activity started
only in 1996. In Bosnia-Herzegovina, FDI activity started as late as 1998 and is still
insignificant. There was a clear setback of FDI inflows in Macedonia during the 1999
Kosovo conflict. The conclusion is that without a basic level of political stability, no investor
ventures into the region.
Figure 3
Annual per capita FDI inflows 1995-1999, USD
Albania B&H Bulgaria Croatia Macedonia Romania
1.2 FDI by investing countries and economic activities
The country of origin of investors in SEECs is basically similar to that in CEECs. The major
capital-exporting countries to eastern countries such as Germany, USA, Netherlands,
Austria and Italy are among the top investors (Table 2).
At the same time, features specific to the regions are also important. EU countries are less
important investors in SEECs than in CEECs. The more stable and attractive
SEE countries Bulgaria, Croatia and Romania have an about 60% EU share, less but
similar to CEECs. In Macedonia and Bosnia-Herzegovina, regional and Near-East
0,0
50,0
100,0
150,0
200,0
250,0
300,0
350,0
in USD

6
investors take the lead. In all SEECs a significant part of investments come from outside
the EU, especially from:
– neighbouring countries such as Greece and Turkey;
– countries within the region, such as Slovenian investments in Croatia, Croatian
investments in Bosnia and Herzegovina – but some of these investments result from the
disintegration of Yugoslavia and do not represent new investments;
– tax heaven countries such as Cyprus. It is a widely held opinion that investors coming
through Cyprus and Liechtenstein are either SEEC domestic individuals or of Russian
origin;
– more remote countries, such as Korea and Kuwait, also show up, mostly with a very
limited number of projects. Korean Daewoo is a major investor in Romania.
Table 2
FDI stock in SEEC-5, by investing countries, 1999shares in %
Bulgaria 1) Romania 2) Croatia 1) Macedonia 1) Bosnia andHerzegovina
1)
1998 July 1998
EU 60,2 56,8 61,2 42,5 30,4
Austria 4,5 5,1 19,6 7,1 4,2
Germany 15,3 10,2 27,3 10,9 16,9
France 3,0 7,1 1,8 1,3 2,5
Italy 1,2 7,6 1,5 8,1 4,2
Netherlands 6,0 11,6 3,8 2,6 .
Other 30,2 15,1 7,2 12,5 2,5
USA 7,1 7,7 27,5 3,7 .
Japan 0,2 0,1 . . .
CEECs 0,7 4,5 2,2 0,7 6,2
SEECs . 0,6 0,4 1,5 16,7
Cyprus 9,0 7,9 0,0 30,2 .
Greece 3,1 2,7 . 7,8 .
Russia 5,5 0,1 0,3 0,0 .
Turkey 3,8 4,4 . 1,5 12,1
Other countries 10,3 15,2 8,4 12,1 34,7
Total 100,0 100,0 100,0 100,0 100,0
Total, USD mn 2778,1 4364,0 3653,4 207,9 75,0
Notes: 1) Equity capital, reinvested earnings, loans. - 2) Equity capital subscribed given by National Trade Register.
7
Not only capital flows but also trade flows show some orientation towards South-East
European partners. Certain features of regionalization are thus present in SEECs. It is no
specific feature to SEECs that local knowledge, cultural similarities and short physical
distance attract investment flows from the neighbourhood. But even the wider environment
is not rich in mobile capital and experienced multinational investors. Small and less
reputable investors appear where the prominent ones do not take the risk to invest. Also
the relatively small size of many of these countries is a handicap in attracting major
multinationals. This aspect is known from experience in Slovenia and Slovakia.
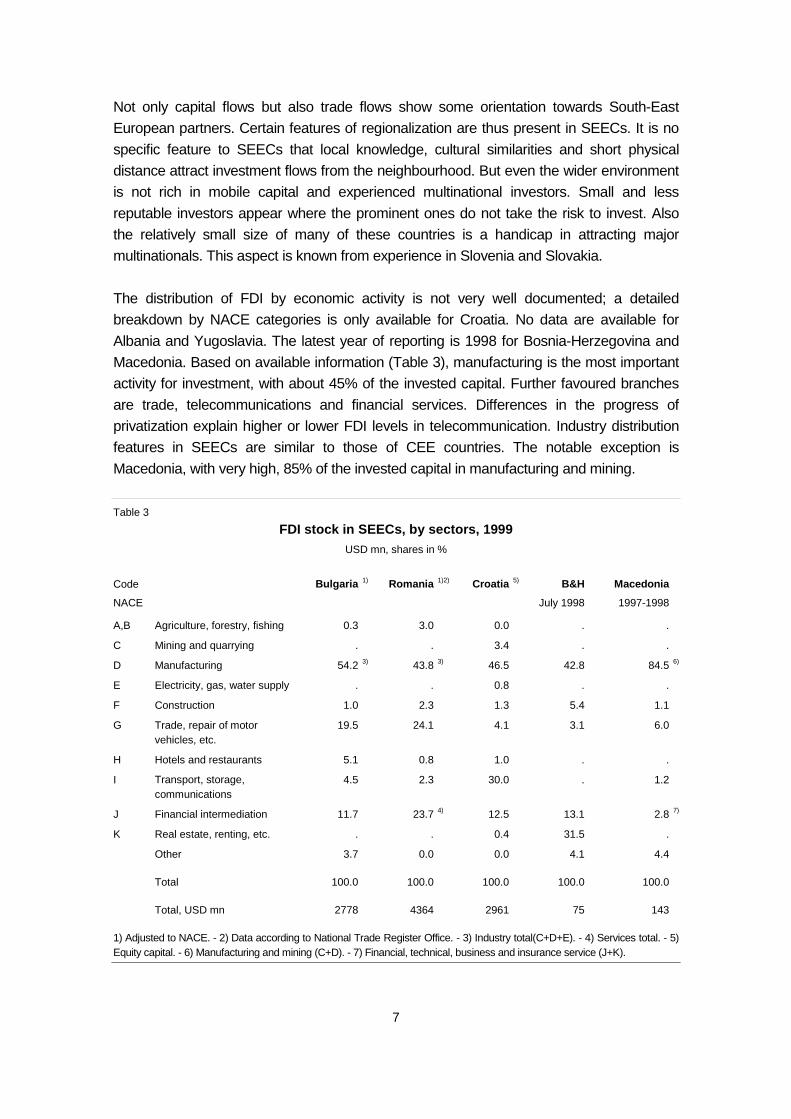
The distribution of FDI by economic activity is not very well documented; a detailed
breakdown by NACE categories is only available for Croatia. No data are available for
Albania and Yugoslavia. The latest year of reporting is 1998 for Bosnia-Herzegovina and
Macedonia. Based on available information (Table 3), manufacturing is the most important
activity for investment, with about 45% of the invested capital. Further favoured branches
are trade, telecommunications and financial services. Differences in the progress of
privatization explain higher or lower FDI levels in telecommunication. Industry distribution
features in SEECs are similar to those of CEE countries. The notable exception is
Macedonia, with very high, 85% of the invested capital in manufacturing and mining.
Table 3
FDI stock in SEECs, by sectors, 1999USD mn, shares in %
Code Bulgaria 1) Romania 1)2) Croatia 5) B&H Macedonia
NACE July 1998 1997-1998
A,B Agriculture, forestry, fishing 0.3 3.0 0.0 . .
C Mining and quarrying . . 3.4 . .
D Manufacturing 54.2 3) 43.8 3) 46.5 42.8 84.5 6)
E Electricity, gas, water supply . . 0.8 . .
F Construction 1.0 2.3 1.3 5.4 1.1
G Trade, repair of motorvehicles, etc.
19.5 24.1 4.1 3.1 6.0
H Hotels and restaurants 5.1 0.8 1.0 . .
I Transport, storage,communications
4.5 2.3 30.0 . 1.2
J Financial intermediation 11.7 23.7 4) 12.5 13.1 2.8 7)
K Real estate, renting, etc. . . 0.4 31.5 .
Other 3.7 0.0 0.0 4.1 4.4
Total 100.0 100.0 100.0 100.0 100.0
Total, USD mn 2778 4364 2961 75 143
1) Adjusted to NACE. - 2) Data according to National Trade Register Office. - 3) Industry total(C+D+E). - 4) Services total. - 5)Equity capital. - 6) Manufacturing and mining (C+D). - 7) Financial, technical, business and insurance service (J+K).
8
Manufacturing FDI in the region is concentrated in capital- and labour-intensive branches
and avoids skill-intensive industries. It seems that most of the investment projects are
local-market-oriented. Such ventures can cope with higher investment risk and higher
transaction costs than export-oriented ventures. The investors in manufacturing industries
like the food industry and household chemicals go in for the demand of local private
consumers while electrical machinery producers expect government-financed investments
in the energy sector.
Available data for Croatia and Romania suggest that some export-oriented ventures
appeared in the industries clothing, shoes, furniture and building materials (see also the
section on the manufacturing industry). This specialization is typical of less developed
countries. At a higher stage of development, e.g. in the CEECs, electronics and car
manufacturing would be the major export-oriented industries. FDI in such branches in
SEECs would require more economic and legal stability, an investor-friendly environment
and better transport connections to the rest of Europe. In Romania car manufacturing,
electronics and electrical machinery assembly plants have appeared recently.
The banking sector is to play a key role in transformation and investment financing but has
been plagued by bad debts. It collapsed in Bulgaria in 1996 and underwent painful
restructuring in Romania and Macedonia. The usual pattern was that bad loans were taken
over by a rehabilitation agency and banks with cleared balance sheets were put up for
sale. From the state’s point of view, these were lossmaking operations as the value of
recapitalization usually exceeded the sales revenues for bank shares. But the overall
economic impact should be positive as the new owners injected also fresh capital and
introduced new know-how and technology. Foreign investors took over some of the largest
banks recently: Bulbank in Bulgaria was taken over by Unicredito, Italy in October 2000;
Stopanska Banka in Macedonia was taken over by the National Bank of Greece in March
2000; the Romanian Development Bank was bought by Societe Generale in 1999, and
General Electric Capital invested in PostBank in 2000. In other cases, delays in
privatization aggravated the problems and bank failures could not be avoided (e.g.
Bancorex in Romania). In many SEECs, bank privatization was one of the main driving
forces behind FDI inflows in the last few years and the share of the banking sector in FDI
stocks increased. It can be expected that major foreign takeovers and a healthy selection
process can clear up the banking system to such an extent that it may finally play an active
role in financing investments. For the time being, investment outlays in SEE economies are
low and domestic companies finance them mostly by retained profits.
9
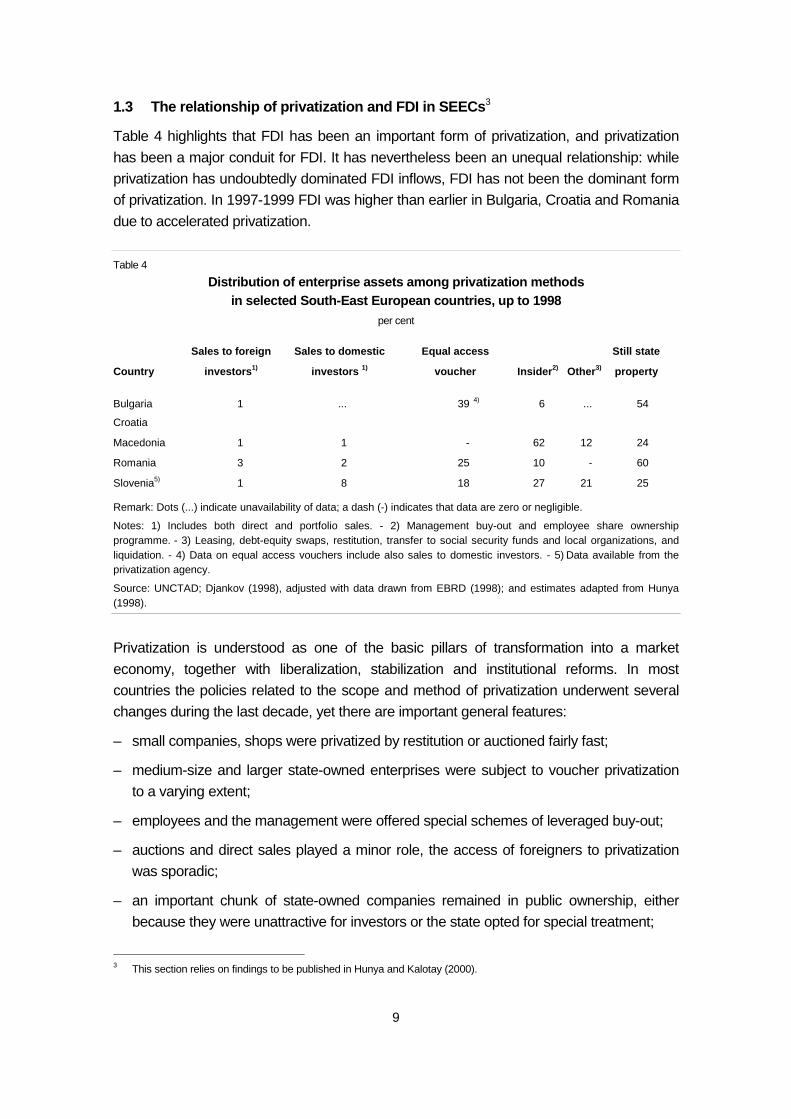
1.3 The relationship of privatization and FDI in SEECs3
Table 4 highlights that FDI has been an important form of privatization, and privatization
has been a major conduit for FDI. It has nevertheless been an unequal relationship: while
privatization has undoubtedly dominated FDI inflows, FDI has not been the dominant form
of privatization. In 1997-1999 FDI was higher than earlier in Bulgaria, Croatia and Romania
due to accelerated privatization.
Table 4
Distribution of enterprise assets among privatization methodsin selected South-East European countries, up to 1998
per cent
Sales to foreign Sales to domestic Equal access Still state
Country investors1) investors 1) voucher Insider2) Other3) property
Bulgaria 1 ... 39 4) 6 ... 54
Croatia
Macedonia 1 1 - 62 12 24
Romania 3 2 25 10 - 60
Slovenia5) 1 8 18 27 21 25
Remark: Dots (...) indicate unavailability of data; a dash (-) indicates that data are zero or negligible.
Notes: 1) Includes both direct and portfolio sales. - 2) Management buy-out and employee share ownershipprogramme. - 3) Leasing, debt-equity swaps, restitution, transfer to social security funds and local organizations, andliquidation. - 4) Data on equal access vouchers include also sales to domestic investors. - 5) Data available from theprivatization agency.
Source: UNCTAD; Djankov (1998), adjusted with data drawn from EBRD (1998); and estimates adapted from Hunya(1998).
Privatization is understood as one of the basic pillars of transformation into a market
economy, together with liberalization, stabilization and institutional reforms. In most
countries the policies related to the scope and method of privatization underwent several
changes during the last decade, yet there are important general features:
– small companies, shops were privatized by restitution or auctioned fairly fast;
– medium-size and larger state-owned enterprises were subject to voucher privatization
to a varying extent;
– employees and the management were offered special schemes of leveraged buy-out;
– auctions and direct sales played a minor role, the access of foreigners to privatization
was sporadic;
– an important chunk of state-owned companies remained in public ownership, either
because they were unattractive for investors or the state opted for special treatment;
3 This section relies on findings to be published in Hunya and Kalotay (2000).
10
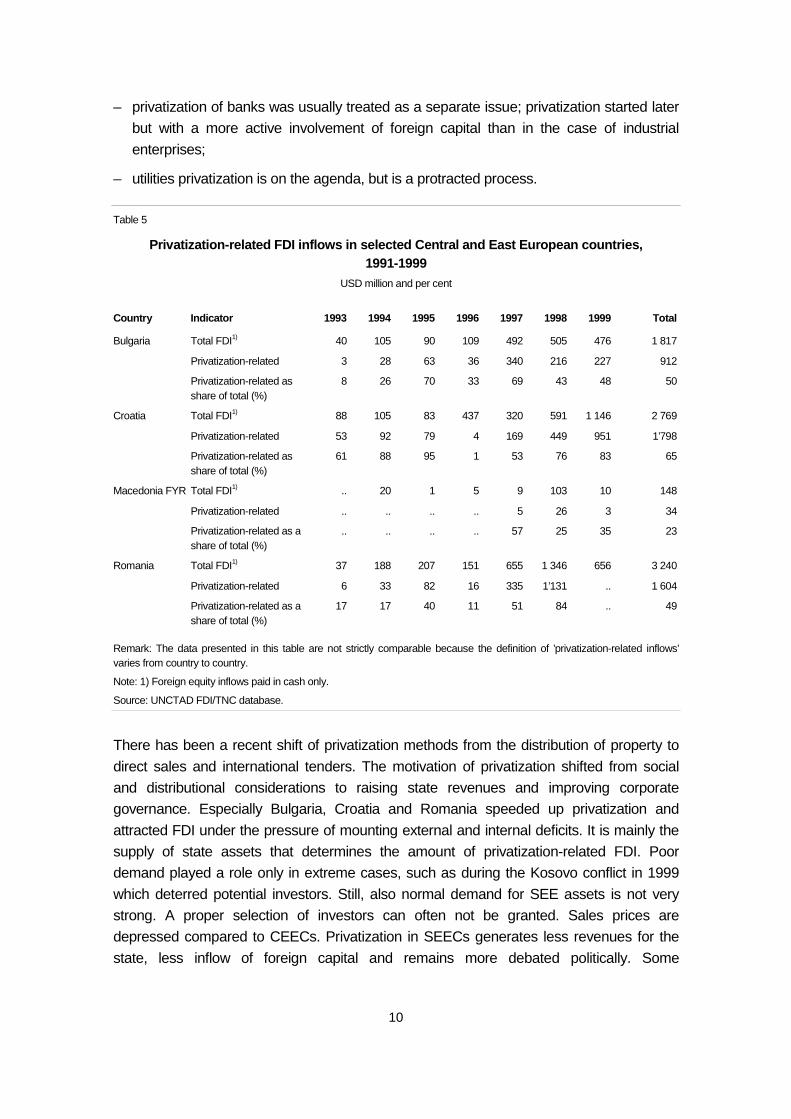
– privatization of banks was usually treated as a separate issue; privatization started later
but with a more active involvement of foreign capital than in the case of industrial
enterprises;
– utilities privatization is on the agenda, but is a protracted process.
Table 5
Privatization-related FDI inflows in selected Central and East European countries,1991-1999
USD million and per cent
Country Indicator 1993 1994 1995 1996 1997 1998 1999 Total
Total FDI1) 40 105 90 109 492 505 476 1 817
Privatization-related 3 28 63 36 340 216 227 912
Bulgaria
Privatization-related asshare of total (%)
8 26 70 33 69 43 48 50
Total FDI1) 88 105 83 437 320 591 1 146 2 769
Privatization-related 53 92 79 4 169 449 951 1’798
Croatia
Privatization-related asshare of total (%)
61 88 95 1 53 76 83 65
Total FDI1) .. 20 1 5 9 103 10 148
Privatization-related .. .. .. .. 5 26 3 34
Macedonia FYR
Privatization-related as ashare of total (%)
.. .. .. .. 57 25 35 23
Total FDI1) 37 188 207 151 655 1 346 656 3 240
Privatization-related 6 33 82 16 335 1’131 .. 1 604
Romania
Privatization-related as ashare of total (%)
17 17 40 11 51 84 .. 49
Remark: The data presented in this table are not strictly comparable because the definition of ’privatization-related inflows’varies from country to country.
Note: 1) Foreign equity inflows paid in cash only.
Source: UNCTAD FDI/TNC database.
There has been a recent shift of privatization methods from the distribution of property to
direct sales and international tenders. The motivation of privatization shifted from social
and distributional considerations to raising state revenues and improving corporate
governance. Especially Bulgaria, Croatia and Romania speeded up privatization and
attracted FDI under the pressure of mounting external and internal deficits. It is mainly the
supply of state assets that determines the amount of privatization-related FDI. Poor
demand played a role only in extreme cases, such as during the Kosovo conflict in 1999
which deterred potential investors. Still, also normal demand for SEE assets is not very
strong. A proper selection of investors can often not be granted. Sales prices are
depressed compared to CEECs. Privatization in SEECs generates less revenues for the
state, less inflow of foreign capital and remains more debated politically. Some

11
governments, such as the Albanian, have in fact not much to sell as assets available for
privatization have already been given away in various ways to insiders or the public at
large, leaving little scope for foreign investors.
Primary privatization is declared to be by and large over in most SEECs. The Macedonian
government declared privatization completed by end-1999. Bulgaria and Romania
envisage this target by the end of 2001. Full privatization is usually understood excluding
utilities. Primary privatization means that in the process of ownership divestiture, mainly
insiders and dispersed owners came in the possession of shares. Control over companies
is exerted mainly by the management. The role of the state has not disappeared in the
post-privatization era. Many of the privatization contracts involve instalment payments,
performance requirements, etc. In many cases the restructuring of the former state-owned
enterprises (SOEs) cannot be undertaken by the new owners and the problem of
lossmaking and inefficiency may fall back to the government at some point of time.
The state has been left with several problem cases. Large, lossmaking companies need
fundamental restructuring and even afterwards may not be viable. They are overstaffed,
but mass-scale release of workers is a politically sensitive issue. These companies are
usually the generators of financial arrears which disturb payment flows in the whole
economy. Programmes trying to isolate lossmakers from the healthier part of the economy
have had partial success. Governments still lack the money and courage needed to initiate
a fundamental restructuring of these companies. There are also several healthy or
prospective companies waiting for large foreign investors, such as the Bulgarian telecom
company or the Romania oil company.
On the other hand, also ’second privatization’ is under way with ownership concentration
and the involvement of foreign investors. This process is necessary to strengthen
corporate governance and inject new capital in companies privatized to insiders or by
vouchers. Concentration of ownership is generated either by negotiation with small
shareholders or through the Stock Exchange. At some later point, controlling stakes may
be brought into a joint venture with a foreign firm or sold to a foreign investor. As a recent
example, the Austrian brewery BrauUnion took over three Romanian breweries from a
domestic investment company.
Regarding the benefits of privatization through FDI, there is an agreement of specialists
that, particularly at the micro level, foreign investors, using their distributional, financial,
technological and managerial advantages, tend to induce deeper and faster transformation
than local investors. Experience in CEECs is well documented, while research results in
SEECs are very few few.
12
2 Characteristics of FDI penetration in manufacturing
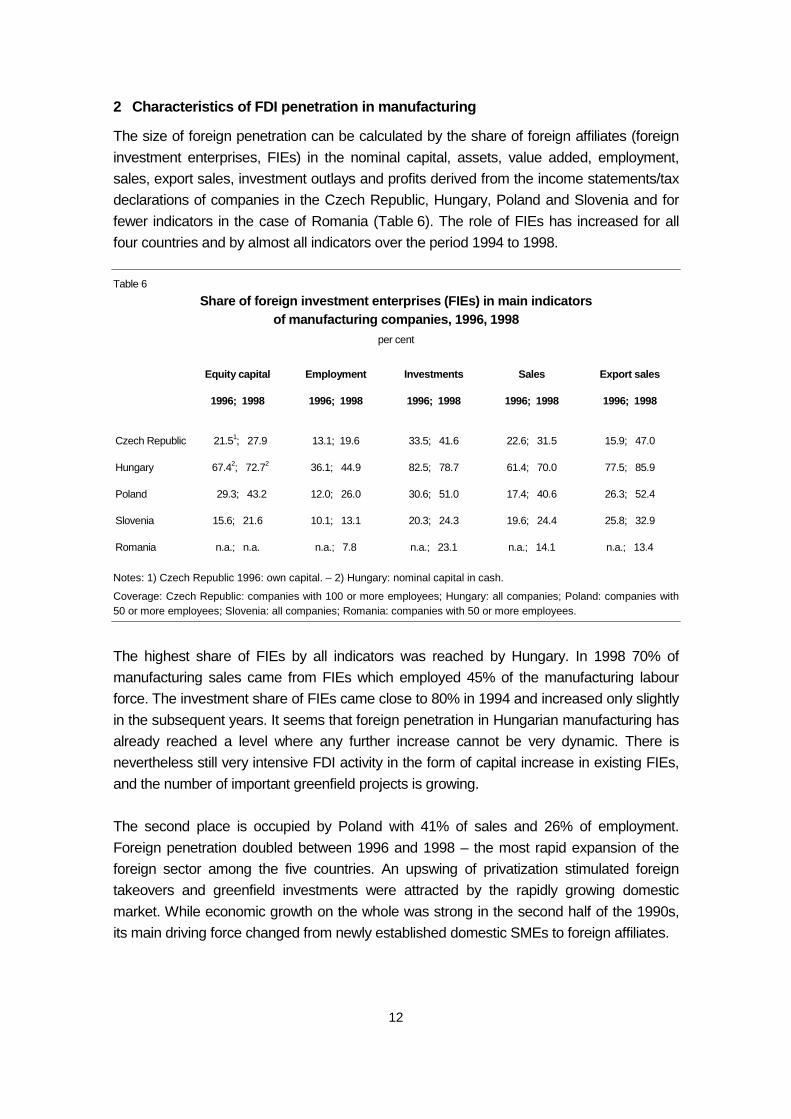
The size of foreign penetration can be calculated by the share of foreign affiliates (foreign
investment enterprises, FIEs) in the nominal capital, assets, value added, employment,
sales, export sales, investment outlays and profits derived from the income statements/tax
declarations of companies in the Czech Republic, Hungary, Poland and Slovenia and for
fewer indicators in the case of Romania (Table 6). The role of FIEs has increased for all
four countries and by almost all indicators over the period 1994 to 1998.
Table 6
Share of foreign investment enterprises (FIEs) in main indicatorsof manufacturing companies, 1996, 1998
per cent
Equity capital Employment Investments Sales Export sales
1996; 1998 1996; 1998 1996; 1998 1996; 1998 1996; 1998
Czech Republic 21.51; 27.9 13.1; 19.6 33.5; 41.6 22.6; 31.5 15.9; 47.0
Hungary 67.42; 72.72 36.1; 44.9 82.5; 78.7 61.4; 70.0 77.5; 85.9
Poland 29.3; 43.2 12.0; 26.0 30.6; 51.0 17.4; 40.6 26.3; 52.4
Slovenia 15.6; 21.6 10.1; 13.1 20.3; 24.3 19.6; 24.4 25.8; 32.9
Romania n.a.; n.a. n.a.; 7.8 n.a.; 23.1 n.a.; 14.1 n.a.; 13.4
Notes: 1) Czech Republic 1996: own capital. – 2) Hungary: nominal capital in cash.
Coverage: Czech Republic: companies with 100 or more employees; Hungary: all companies; Poland: companies with50 or more employees; Slovenia: all companies; Romania: companies with 50 or more employees.
The highest share of FIEs by all indicators was reached by Hungary. In 1998 70% of
manufacturing sales came from FIEs which employed 45% of the manufacturing labour
force. The investment share of FIEs came close to 80% in 1994 and increased only slightly
in the subsequent years. It seems that foreign penetration in Hungarian manufacturing has
already reached a level where any further increase cannot be very dynamic. There is
nevertheless still very intensive FDI activity in the form of capital increase in existing FIEs,
and the number of important greenfield projects is growing.
The second place is occupied by Poland with 41% of sales and 26% of employment.
Foreign penetration doubled between 1996 and 1998 – the most rapid expansion of the
foreign sector among the five countries. An upswing of privatization stimulated foreign
takeovers and greenfield investments were attracted by the rapidly growing domestic
market. While economic growth on the whole was strong in the second half of the 1990s,
its main driving force changed from newly established domestic SMEs to foreign affiliates.

13
In the Czech Republic the share of FIEs reached 32% in sales and 20% in employment in
1998. In the period 1996-1998 the Czech economy underwent a second transformational
recession. Despite the general output decline, the foreign sector maintained its dynamism,
relied more on foreign markets and replaced domestic enterprises on the Czech market.
The competitiveness problem that appeared due to the overvalued exchange rate affected
the domestic companies more strongly than the FIEs, which had more opportunity to
increase prices.
Romania is the only SEEC for which comparable data are available for 1998. Foreign
penetration in this country is very small compared to the CEECs. Only 14% of
manufacturing sales was produced by foreign affiliates. But similar to CEECs, the labour
productivity and investment propensity in the foreign sector is much higher than in the
domestic sector. The main difference between the foreign sector in CEECs and in
Romania appears in terms of export propensity. While in the more developed countries
foreign affiliates have a decisive role in the export performance of the country, in Romania
they are responsible only for 13% of exports.
Table 7
Industries with significant above-average shares of FIEs in sales, 1994, 1996, 1998per cent
Hungary
1994 1996 1998
Czech Republic
1994 1996 1998
99.6 99.2 100 Coke and petroleum 60.0 66.9 81.7 Motor vehicles
99.5 98.7 95.7 Tobacco 37.2 43.8 45.6 Rubber and plastic
78.4 82.7 79.9 Electrical machinery 25.9 29.0 38.3 Publishing, printing
72.0 84.8 96.9 Motor vehicles 23.7 45.6 45.5 Non-metallic minerals
70.0 71.8 48.6 Other transp equipment 13.2 32.0 48.3 Electrical machinery
61.0 79.0 82.8 Radio and TV sets (4.8) 35.9 57.7 Radio and TV sets
(53.7) 78.7 83.6 Chemicals 3.3 26.5 39.4 Manufacturing n.e.c.
55.4 61.4 70.0 Manufacturing total 12.5 22.6 32.1 Manufacturing total
Poland
1994 1996 1998
Slovenia
1994 1996 1998
86.9 94.1 96.7 Paper, paper products 100.0 100.0 100 Tobacco
8.4 90.7 95.3 Tobacco 64.5 82.3 83.1 Transport equipment
49.9 82.5 89.9 Motor vehicles 42.9 35.4 48.1 Paper
52.4 66.7 81.8 Radio, TV sets . 40.4 42.6 Radio, TV sets
46.0 55.6 60.4 Manufacturing n.e.c. . 21.3 26.1 Machinery n.e.c.
17.4 31.9 40.6 Manufacturing total 16.9 19.6 24.4 Manufacturing total
The main common branch with above-average foreign penetration in the CEEC-5 is the
manufacturing of motor vehicles (Table 7). This industry has over 80% foreign
14
penetration. The car industry was attracted both by unsatisfied domestic demand and by
favourable conditions for low-cost production. Also tobacco manufacturing is usually
foreign-owned as only big international companies can cope with the brand names and
promotion costs of this industry. Electrical machinery shows a high rate of foreign
presence in the Czech Republic and Hungary. In the other three countries, where the
paper industry is a major export industry, this has also become a foreign-controlled
branch. High foreign penetration in the chemical industry is specific to Hungary, due most
probably to the pharmaceutical industry which is one of the most internationalized
activities world-wide.
Foreign direct investment has helped CEECs to shift their product structure to become
more similar to the more developed EU countries. This may give further impulses to
economic growth and narrow the development gap between the more advanced CEECs
and the EU. The deeper the foreign penetration, the faster was the speed of structural
change: Hungary was followed by the Czech Republic and Poland. Duality between
foreign- and domestic-dominated industries appeared in all countries and is growing over
time. The dichotomy of performance between the foreign- and the domestic-owned
companies in the same industry is largest in Hungary and smallest in Slovenia.
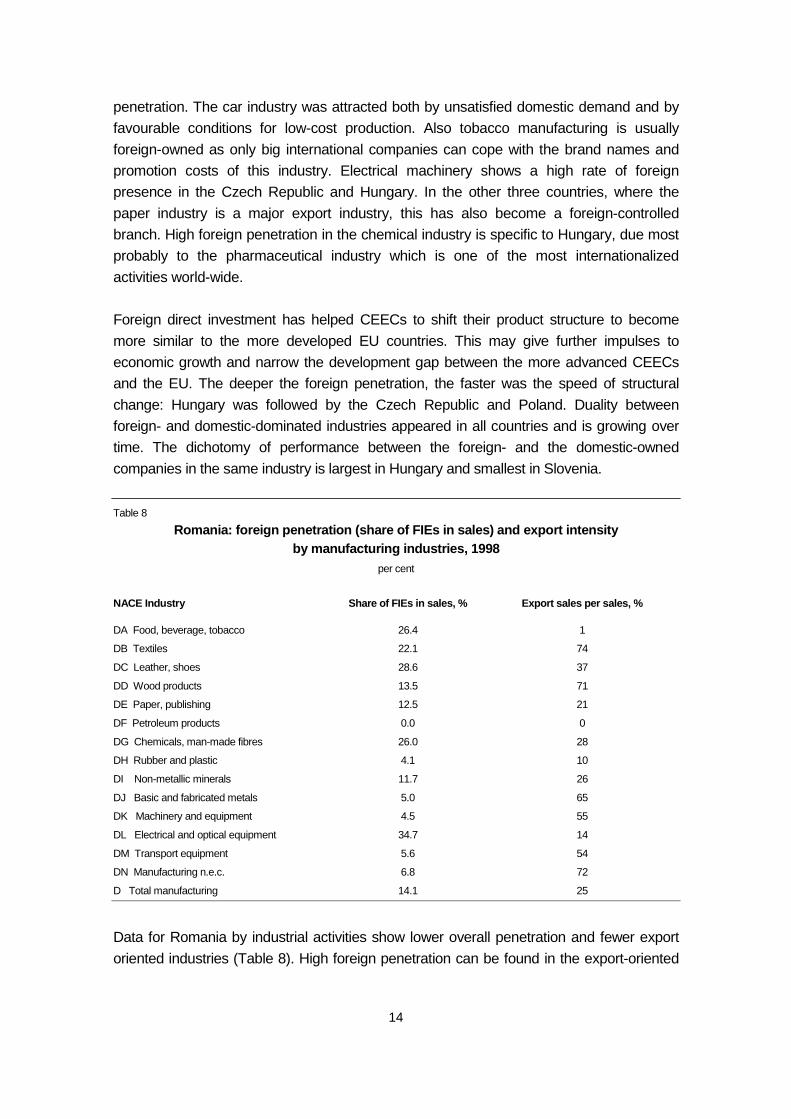
Table 8
Romania: foreign penetration (share of FIEs in sales) and export intensityby manufacturing industries, 1998
per cent
NACE Industry Share of FIEs in sales, % Export sales per sales, %
DA Food, beverage, tobacco 26.4 1
DB Textiles 22.1 74
DC Leather, shoes 28.6 37
DD Wood products 13.5 71
DE Paper, publishing 12.5 21
DF Petroleum products 0.0 0
DG Chemicals, man-made fibres 26.0 28
DH Rubber and plastic 4.1 10
DI Non-metallic minerals 11.7 26
DJ Basic and fabricated metals 5.0 65
DK Machinery and equipment 4.5 55
DL Electrical and optical equipment 34.7 14
DM Transport equipment 5.6 54
DN Manufacturing n.e.c. 6.8 72
D Total manufacturing 14.1 25
Data for Romania by industrial activities show lower overall penetration and fewer export
oriented industries (Table 8). High foreign penetration can be found in the export-oriented
15
light industries utilizing cheap labour: textiles and clothing, shoes and furniture. Domestic
market oriented industries like food and electrical machinery have much lower rates of
foreign penetration than in CEECs which may also indicate large redundant capacities in
the domestic sector.
The impact of the foreign sector on the balance of payments is not only of benefit.
Increasing export-competitiveness of FIEs went hand in hand with increasing import-
demand thus the foreign trade balance deteriorated. Hungary also started to have large
dividend outflows in recent years.
3 Government policies related to FDI
3.1 FDI policy frameworks and incentives
In Dunning’s theory (1993), FDI flows are ’shaped’ by three sets of factors. First, the
ownership advantages, second, the locational advantages, and third, the internalization
advantages of multinational companies. Locational advantages represent those
advantages that make production in the given place more profitable/advantageous from
the point of view of the investor than exporting the product from a foreign production unit to
the given market, or locating new production capacities to a third country. The economic
policy of a given FDI-recipient country can influence the relative locational advantages of a
country, region or township. We focus below on policies at the national level, but it must be
kept in mind that sub-national policies are also important, down to the characteristics of
specific investment sites. Locational characteristics appear in the form of general and FDI-
specific conditions of investments. General conditions cover the overall stability and
development pattern of the economy, the skills of the labour force as well as the regulatory
framework such as the tax system. This section looks at the regulatory framework more
directly related to FDI.
National treatment and almost no direct FDI incentive is the basic rule of law in CEECs and
SEECs alike. International treaties like OECD membership and EU association restrict
discriminatory policies and demand equal rights for domestic and foreign firms. But also
many countries not invited to join the EU take care not to introduce policies which are not in
conformity with EU practice. This commitment may sometimes be over-ambitious and lead
to losses of opportunities without bringing the date of accession any closer.
In several CEECs, policy has recently shifted from stabilization to growth promotion. This
includes more investment incentives than earlier. Corporate tax has been low in Hungary,
has been lowered lately in the Czech Republic and Poland, and completely abolished in
Estonia. Countries long suffering from low FDI levels, such as Slovenia, have introduced
some incentives. Despite the wide range of incentive schemes in the various countries, the

16
efficiency of these policy tools are not properly investigated. Although Hungary has the
most complex incentive scheme, ranging from tax and customs allowances to R&D- and
infrastructure-related subsidies, it is not really proven what the impact of these
arrangements has been. The effects of incentives can hardly be separated from other
locational factors.
Investment promoting policies can be even more necessary in SEE countries with low
rates of capital accumulation, significant barriers to entry and low interest on the part of
potential foreign investors. Corporate taxes were lowered in Romania this year and will be
lowered in Bulgaria next year. Romania has a complex incentive scheme for investors,
regions and SMEs, but no FDI promotion as such (see Appendix for details). Bulgaria and
Macedonia, on the other hand, have strong foreign investment promotion agencies.
The general framework for the establishment of foreign ventures is regulated by the foreign
investment law. Incentives and other technical regulation are subject to special legislation
or are spread about in different laws. The incentives are listed in a special investment
promotion law in Croatia (2000), a government programme in Macedonia (1999), the
annual budget in Romania, and the Foreign Investment Act in Bulgaria. While national and
equal treatment of all investors is a much quoted fundamental principle, governments have
claimed discretionary rights to provide special incentives to specific investors they consider
of great importance.
Investment incentives are given in general or subject to certain conditions related to the
size or the target of investment. Some preference is usually provided for large investors.
This is a hidden bias in favour of foreign investors, who are more often able to launch
larger ventures than domestic companies. Small and medium-size domestic firms cannot
meet the minimum investment and employment requirements to become eligible for tax
breaks or to receive direct investment incentives. It is mainly large foreign investors who
benefit. The result can be illustrated by the indicators for the Hungarian manufacturing
industry: foreign affiliates produce 86% of the pre-tax profit but pay only 59% of the
corporate tax revenues of the budget (1998 data). This is partly the result of the
preferences provided to large investors, partly the result of tax holidays provided to foreign
investors before 1996. Productivity and profitability is generally higher in foreign affiliates
than in domestic firms and the gap between the two ownership categories can widen due
to unequal access to incentives.
Corporate income tax allowances benefit the operation and not the establishment of
ventures. Special incentives may be considered necessary to foster the start-up of new
firms and greenfield investments. Start-up benefits may comprise import duty allowances
for equipment which are applied in several countries. New ventures may benefit from
subsidies for infrastructure, industrial parks, and special economic zones. Duty-free zones
17
attract mostly storage companies; off-shore processing is rare. None of the SEE countries
apply the attractive Hungarian duty-free-zone legislation which is a preferential legal status
for export-oriented producers and is not related to a particular geographical area. Other
policies have also investment promotion components: regional policy and labour market
policy.
The potential scope for an active investment policy is limited by the budgetary situation of
the countries in the region. Tight fiscal policies do not allow for spending on incentives. The
dispute of the Romanian government trying to provide benefits for (foreign) investors and
the IMF’s concern about the level of the budget deficit is enlightening in this respect. The
macroeconomic approach taken by the IMF to tackle high budget deficits suggests to apply
no incentives at all. But the government has been more concerned about attracting
potential buyers for key companies and also wanted to relaunch economic growth (see for
details the section on Romania).
3.2 Privatization-related FDI policies: the role of commitments4
Large privatization sales usually involve foreign investors. In that case the privatization
process and the privatization contract are in fact FDI policy instruments. Governments
pursue various goals with privatization. Beyond the great variety of the forms of
privatization, the conditions set for the privatization sales reflect the government’s concern
about the impact of a particular deal on the labour market, regional development and the
environment. Although the price may be the central criterion in the evaluation of bids, the
authorities try to get further commitments from the buyer concerning future investments
and employment. These commitments prove to be necessary when there is an evident
lack or weakness of proper policies in the given field (e.g. employment policy, R&D policy).
What makes the transition economies specific in this respect is that they inherited weak
policies (or sometimes none at all) from the previous economic and social system.
Further commitments are meant to ensure good future prospects of the company. In this
respect it is certainly important to select a reputable investor and evaluate its business
plan. But the actual investment and output growth will depend on many unforeseeable
business conditions. The sales price is usually indicative of the future intention of the
investor: the higher the amount he is willing to risk with the investment, the more he will
care for ensuring profitable operation later. It does not seem to be a sound industrial policy
to block efficiency increase in a specific company by specific regulations beyond the limits
of general labour, environmental etc. regulations and competition policy. An in-depth
appraisal of the Hungarian experience with such criteria (Csáki and Macher, 1998) has
found that:
4 This section relies on findings to be published in Hunya and Kalotay (2000).

18
– the enforcement of the 'soft' – environmental, employment etc. – conditions stipulated in
the privatization contracts cannot be considered successful;
– unfulfilled contractual commitments have not been penalized, particularly because
some of these conditions by nature are difficult to quantify (e.g. an estimate of the costs
of environmental cleanup is extremely difficult);
– the incorporation of such conditions in the contract in most cases resulted in the
reduction of the purchase price; and as the fulfilment of the commitments proved to be
uncertain and unpenalizable, the country turned out to be a net loser in this respect.
Hence the question arises under what conditions the government can afford the trade-off
between revenues and commitments, especially when privatization takes place under
budgetary pressures with a need to maximize revenues. In this respect, a comparative
study of privatization sales to foreign investors in the Czech Republic, Hungary, Poland
and Slovenia (Rojec, 1995) suggested the following policies:
– ensure competition between potential buyers;
– a realistic price should be determined through bidding and negotiating with potential
buyers as the proper valuation of assets before sale is not really possible;
– a premium can be required for the purchase of a controlling share in an enterprise, as
compared with the purchase of minority stakes;
– in most cases, the national, non-discriminatory treatment of investors is enough; special
treatment of foreigners is to be limited to a minimum.
In sum, an optimum policy on privatization sales to foreign investors should focus on two
basic criteria: on the one hand, on the sales price offered, and, on the other hand, the
reputation and business plan of the investors.
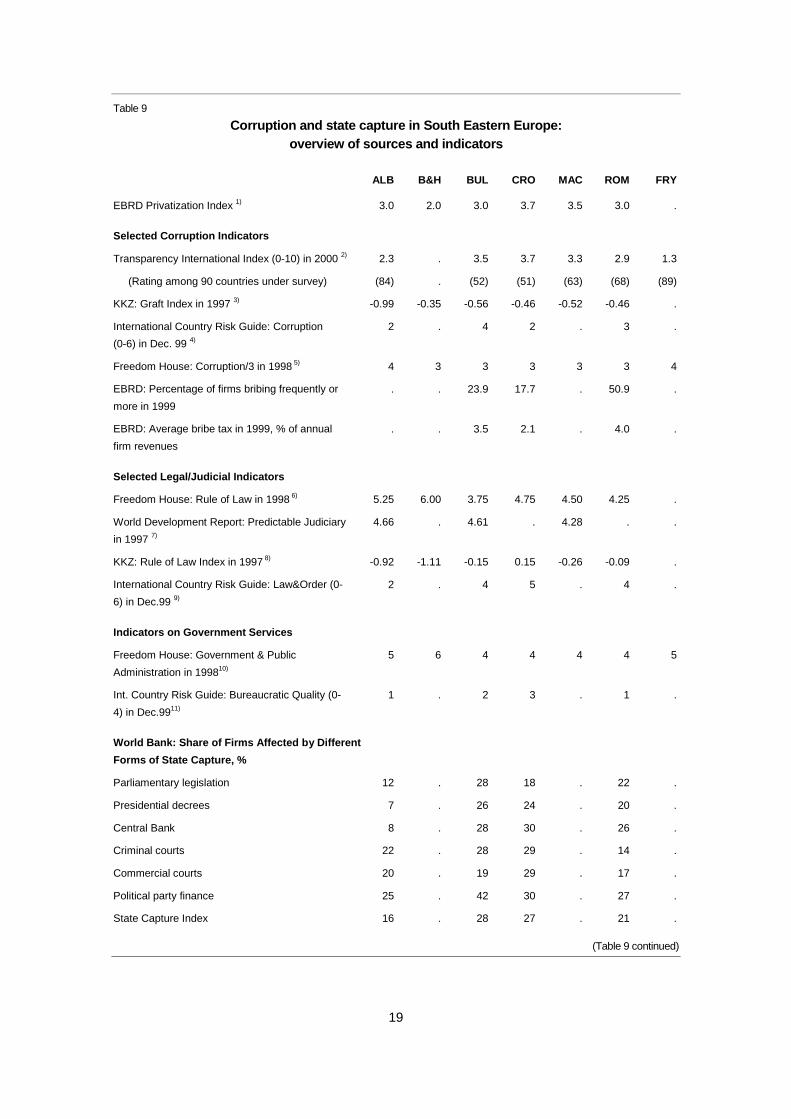
4 Corruption and state capture
Can the quality of public governance be quantified ? The large literature on the subject is
based mainly on surveys of limited size (Table 9). Here we refer to one of them which has
the largest sample: the 1999 Business Environment and Enterprise Performance Survey
(BEEPS) was carried out for 20 CEE and FSU countries (Hellman et al., 2000, also EBRD,
1999). It looks at various features of government capture, administrative corruption,
government transparency and public interference in the economy by asking a sample of
company executives about experience. Beyond various studies in individual countries, this
is the main source of information to compare various regions and countries within regions.
Some of the features are summarized below.
19
Table 9
Corruption and state capture in South Eastern Europe:overview of sources and indicators
ALB B&H BUL CRO MAC ROM FRY
EBRD Privatization Index 1) 3.0 2.0 3.0 3.7 3.5 3.0 .
Selected Corruption Indicators
Transparency International Index (0-10) in 2000 2) 2.3 . 3.5 3.7 3.3 2.9 1.3
(Rating among 90 countries under survey) (84) . (52) (51) (63) (68) (89)
KKZ: Graft Index in 1997 3) -0.99 -0.35 -0.56 -0.46 -0.52 -0.46 .
International Country Risk Guide: Corruption
(0-6) in Dec. 99 4)
2 . 4 2 . 3 .
Freedom House: Corruption/3 in 1998 5) 4 3 3 3 3 3 4
EBRD: Percentage of firms bribing frequently or
more in 1999
. . 23.9 17.7 . 50.9 .
EBRD: Average bribe tax in 1999, % of annual
firm revenues
. . 3.5 2.1 . 4.0 .
Selected Legal/Judicial Indicators
Freedom House: Rule of Law in 1998 6) 5.25 6.00 3.75 4.75 4.50 4.25 .
World Development Report: Predictable Judiciary
in 1997 7)
4.66 . 4.61 . 4.28 . .
KKZ: Rule of Law Index in 1997 8) -0.92 -1.11 -0.15 0.15 -0.26 -0.09 .
International Country Risk Guide: Law&Order (0-
6) in Dec.99 9)
2 . 4 5 . 4 .
Indicators on Government Services
Freedom House: Government & Public
Administration in 199810)
5 6 4 4 4 4 5
Int. Country Risk Guide: Bureaucratic Quality (0-
4) in Dec.9911)
1 . 2 3 . 1 .
World Bank: Share of Firms Affected by Different
Forms of State Capture, %
Parliamentary legislation 12 . 28 18 . 22 .
Presidential decrees 7 . 26 24 . 20 .
Central Bank 8 . 28 30 . 26 .
Criminal courts 22 . 28 29 . 14 .
Commercial courts 20 . 19 29 . 17 .
Political party finance 25 . 42 30 . 27 .
State Capture Index 16 . 28 27 . 21 .
(Table 9 continued)

20
Table 9 continued
Notes: 1) The privatization index is an average of small-scale and large-scale privatization indices. - 2) Composite of surveyindicators (from up to 14 sources). Larger values indicate less corruption. Data for Albania and FYR Macedonia refer to 1999(rating among 99 countries under survey). - 3) Kaufmann, Kraay, and Zoido-Lobaton Graft Index; sample size 155 countries;composite index of various survey indicators; larger values indicate less corruption. - 4) Sample size 140 countries; measurescorruption within the political system; higher values indicate less corruption. - 5) Sample size 28 countries; 1-7 scale based onexpert perceptions; lower values indicate less corruption. - 6) Sample size 28 countries; 1-7 scale based on expert perceptions;lower values are an indication of judicial independence and human rights protection. - 7) Sample size 67 countries; averageresponse on a 1-6 scale, agreeing or disagreeing with statement that "unpredictability of the judiciary presents a major problemfor my business operations"; from WDR 1997 survey of private firms. - 8) Kaufmann, Kraay, and Zoido-Lobaton Rule of LawIndex; sample size 166 countries; composite index of various survey indicators; larger values indicate greater law and order. -9) Sample size 140 countries; law and order each comprises zero to three points, and assesses the strength and impartiality ofthe legal system, and popular observance of the law respectively; higher values indicate greater law and order. - 10) Samplesize 28 countries; 1-7 scale based on expert perceptions; lower values indicate greater transparency, decentralization, andpower of the legislature. - 11) Sample size 140 countries; the institutional strength and quality of the bureaucracy is anothershock absorber that tends to minimize revisions of policy when governments change; high points are given to countries wherethe bureaucracy has the strength and expertise to govern.
In terms of government capture (private influence on the formation of laws and regulations)
the three SEECs under survey – Bulgaria, Croatia and Romania – performed much worse
than Central European countries (Czech Republic, Hungary, Poland) but better than
CIS countries. The frequency of bribing public officials to avoid taxes or other regulation
showed similar differences. Among the SEECs, Croatia usually features better than the
other two countries. The efficiency of government services is considered good by 25% in
Bulgaria, 28% in Romania and 40% in Croatia. The latter is in line with the CEEC average.
In terms of the frequency, amount and effectiveness of bribery in more general terms,
Romania performed much worse than the other two SEECs which were comparable with
CEECs. Not only the high amount of bribes is a problem in Romania, but also the relatively
low rate of delivery of the 'paid' service. Investors may consider this messy situation
especially risky. In contrast, Croatia together with Slovenia was among the transition
countries with the lowest level of administrative corruption.
As for the functioning of the legal system, corruption or dishonest behaviour of courts has
been witnessed by 40% of companies in the three SEECs. The security of contracts and
property rights is questioned by more than 40% in Romania and Bulgaria and 34% in
Croatia. The predictability and transparency of state legislation is generally weak in
Romania and Bulgaria. The situation in Croatia is considered even better than in Hungary
and the Czech Republic. These data explain why many investor surveys consider legal risk
as one of the major impediments of investment in transition countries but especially in
Romania and Bulgaria.
Weak governments and corrupt institutions may not totally deter FDI. As another survey
found out, local-market-oriented projects may come in lower-technology sectors and in the
form of joint ventures (Smarzynska and Wie, 2000). Corruption reduces inward foreign
investment and shifts the ownership structure towards joint ventures. As corruption makes
21
the local bureaucracy less transparent, the value of using a local partner to cut through the
bureaucratic maze increases. Export-oriented, greenfield, 100% foreign FDI projects in
technologically advanced industries have the strongest positive economic effects on host
countries in terms of growth, employment and external balance, but it is exactly this kind of
investment that is mostly hindered by corruption.
In countries liable for government capture, investors rely on tailored legislation in single
cases of privatization or other large investment projects. While this can be a necessary
stimulus for those who benefit, it is detrimental for the legal system and competition.
Examples of tailor-made incentives appear in Romania in the Renault–Dacia takeover
while other investors withdrew from projects when agreed benefits were abolished
(Akmaya–Petromidia).
5 Conclusions
5.1 How to explain low FDI in SEECs ?
The economic development in the past ten years has been disappointing, the institutional
framework is still far from being efficient, and FDI inflow is meagre. Foreign investors react
to instability and lack of development by avoiding these countries as investment sites. The
origin of problems is complex. Analysts stress one or the other aspect, but good policies
have to take all of them into consideration. This section provides an overview of the
explanations given for bad economic performance and low FDI in the Balkans; the
following section provides a few ideas how to overcome them.
A. Path dependence. This has to do with inherited economic structures and institutions. In
some countries, severe distortions emerged under communist rule. Capacities and
capabilities were built in juxtaposition to market demand. Price and other regulatory
systems corresponded to the arbitrary development targets. These rigid systems were
especially unsuitable for absorbing shocks. When liberalization came, even in a gradual
Romanian way, it was a big shock as the required structural change was immense. The
economy was put under considerable “strain”, to use the term of Daniel Daianu, a
prominent advocator of path dependence (Daianu, 1997 and 2000). Path dependence in
the form of distorted structures certainly explains some of the transformation problems of
Albania, Bulgaria and Romania. These distortions were in these countries larger and the
communist rules stiffer than in most CEECs.
Foreign investors may to a certain extent benefit from penetrating countries with distorted
structures. Their advantage over domestic firms is so big that they can drive out any local
competitor from the domestic market and introduce own products either imported or
assembled on the spot. To avoid this, many governments introduced protective measures
22
either directly or indirectly to serve the interest of local producers (providing subsidies,
tolerating tax arrears, etc.). In Albania, on the other hand, the previous economy, especially
industry, was crashed and not really replaced.
The post-Yugoslav republics have had to struggle with less structural distortion as their
past experience in Yugoslavia was to a large extent different from that of the other
transition countries. Companies were much more integrated into Western production
structures by trade, licensing and subcontracting than other SEECs and even CEECs.
There was also some direct investment. A reconstruction of such ties seems to be more
feasible for Croatia than the present Yugoslavia.
The self-management system has made privatization by sales less appropriate in the
post-Yugoslav republics. FDI in the form of privatization-related takeover has been almost
impossible. But the success of Slovenia in economic development and some promising
developments in Croatia demonstrate that the restructuring needs of inherited capacities
have not been very big and progress could be achieved without the help of foreign
investors.
B. Primacy of policy. This approach means not only that suitable policies can be found in
any circumstances, but also that some general policy package exists which leads to
successful transformation and a rapid inflow of FDI. The primacy of policy is the natural
approach of governments and international financial organizations conducting consulting
activity in the region. Governments have also viewed specific policies related to FDI,
restructuring or investments as a necessary stimulus for increasing FDI. Such policy
measures may be erroneously regarded as substitutes for general economic and legal
stability. In addition, inappropriate policies can produce new impediments to FDI.
For most of the transformation period, SEE countries lacked coherent economic strategies.
They have mostly acted with the technical assistance of international donor organizations
but not really internalizing the know-how of good policymaking. Policy mistakes largely
contributed to growing external and internal debts which put tight limits on future policy
choice. Frequent legislative changes (see Appendix on Romania) discouraged investors.
The privatization process messed up rather than clarified ownership rights (see section on
privatization).
Investment and FDI policies are widespread in the region, but show important differences
among countries. One extreme is the new Croatian investment promotion law which puts
together all related aspects. The other extreme is Romania where investment and FDI
promotion have been merged with regional development. Whatever the position of
investment promotion, available funds are usually scarce and not competitive on the
international scale.
23
C. Disintegration, war and ethnic conflict. The most distinct feature of the western part
of the Balkans is that it has been involved in violent conflicts. War misallocated resources
and demolished wealth. Institutions were transformed and human capabilities restructured
to meet the needs of the war economy.
The split-up of former Yugoslavia, even if it had proceeded in a peaceful manner, would
have increased strain in the emerging national economies. The size of the freely
accessible market shrank and trade reorientation incurred additional costs. In small
countries the size of the market does not attract local-market-oriented FDI and the local
skill level may not allow much successful export-oriented production either. If political
conflicts can be solved, a re-integration process can be expected: resumption of regional
trade, regional networking and investment activity of companies.
Violent disintegration made the division of markets even more abrupt. There is
considerable difference by countries concerning the involvement in segregation and violent
action. Croatia emerged, after severe war-related losses, as an intact country with a rapidly
improving environment for FDI. The reconstruction of promising industries such as tourism,
services and part of manufacturing has started. In contrast, Bosnia and Herzegovina lacks
a unified internal market. It relies on international aid for financing consumption. Aid may
generate some FDI in the retail and service sectors but mainly crowds out productive
investments. No reconstruction of the economy is in sight. Investment guarantee schemes
introduced by the World Bank and the EU try to cover political risk. But the administrative
and legal framework remain so cumbersome and unpredictable that investors continue to
avoid the country. FR Yugoslavia is not war-damaged albeit by bombing. But it is
exhausted, and impoverished by a decade of warship and international isolation. Even
after the Miloševic regime has been voted out, there is still a very long way to go until
normal investment conditions are created. Old productive capacities have not been
maintained for ten years, investment needs for relaunching production are huge.
Macedonia has not been damaged by wars but negatively affected by its indirect impacts.
The locked-in geographical position has been a major impediment to trade and investment.
For all countries in the region, a re-integration of markets is essential for the attraction of
manufacturing investments. As a first step, border controls must be improved, procedures
simplified and cleared from bribing. Low tariffs and simple tariff systems as well as
free-trade agreements can be useful steps.
D. Economic and institutional underdevelopment. What are the more relevant
problems of SEE countries, those of economic transformation or those related to
backwardness ? One line of thought stresses the latter and relies on hard facts concerning
the level of income either due to communist past (Albania), transformational recession
24
(Bulgaria) or war-related damages (Yugoslavia). Falling back in terms of economic
performance for most of the 1990s, SEE countries suffered an erosion of industrial and
organizational skills. A process of de-industrialization and ruralization took place: the share
of industry in GDP declined rapidly while that of agriculture increased. In the wake of land
redistribution, large masses returned to subsistence farming. The new Balkan economy, a
mix of subsistence farming and small-scale trade and services, attracts FDI mostly in the
retail, tourism and banking sectors. At the same time, advantages in terms of schooling
and industrial skills still remain compared to developing countries of similar development
levels. A recovery policy may rely on the skills of the labour force.
Not only poverty makes these countries a development case but also their weak
institutions (see also section on corruption). Vladimir Gligorov et al. (2000) stress that
corporate governance can hardly function properly without the proper functioning of public
governance. Market institutions can hardly deliver efficiency if the political and legal
institutions are distorted and dysfunctional.
5.2 Benefits and problems related to foreign penetration and takeovers:lessons from CEECs
Countries can transform and grow faster if they rely on foreign direct investment
– Progress in transformation, FDI inflow and economic growth are interdependent. The
pace of restructuring has been fastest in countries where FDI was attracted also by
privatization. Economic growth is usually low during stepped-up restructuring but
accelerates later.
– The economic recession in some transition countries (Czech Republic, Bulgaria and
Romania) in the second half of the 1990s could not be cured without a restructuring of
the enterprise sector. These countries need both massive capital investments and the
integrating force of foreign capital to improve their access to knowledge and
international networking.
– Technologies relevant for growth are principally developed by multinationals and can
only be accessed within their networks. A country which, like Hungary, encourages
foreign penetration in the economy may develop up-to-date industrial and export
structures faster than others.
– A comparison of the performance of domestic-owned and foreign-owned enterprises in
CEECs proves the overall positive effects of FDI in terms of structural upgrading and
increasing competitiveness.
Problems emerging in connection with high foreign penetration
– Foreign direct investment inflows cannot be treated as unrequited transfers: they
finance profit-oriented ventures whose foreign owners expect to realize and, to a

25
smaller or larger extent, also to repatriate the generated profit. Current account deficits
are in part produced by FDI inflows.
– National economic policies in countries with intensive foreign penetration are exposed
to high competition between locations of production and consumption. They are limited
regarding the choice of policy targets and policy tools (e.g. tax increase). But under
strict foreign competitive control, the likelihood of grave policy mistakes may also
diminish.
– Most of the FDI in transition countries has been local-market-oriented. Such
investments depend on the development of the purchasing power and the size of the
potential market. With the ageing of the projects, the motivation of entry becomes less
important, subsidiaries take up new functions, enlarge or shrink their original task in the
multinational networks.
5.3 Policy conclusions
The experience with public policies in the region has been disappointing for reasons
connected with weak states and corrupt practices. Strengthening public institutions and
building credibility can be development targets of their own. In the given situation, policy
recommendations must keep in mind that these countries can only cope with simple
policies; they are unable to run very sophisticated programmes or apply complicated tools.
General recommendations may include the following:
a. Reduce political risk by supporting peace and democracy. Donor countries may
increase funds to guarantee against political risk in the region. Too much aid may drive
out private investment and fund corruption.
b. Support re-integration, ease border controls, reduce transaction costs. The size of
attainable markets must grow in order to attract larger and export-oriented investment
projects.
c. Investment promotion policies must become more stable and transparent.
d. Restructuring and privatization of ailing industries, restructuring and capitalization of the
banking system as well as policies directed at the promotion of small and medium-size
businesses are necessary to strengthen market-economy rule.
e. Available local knowledge and skills are to be utilized as the basic educational level of
the population is good.
f. The legal system must become more transparent and less corruptible. Simple
legislation and institutions (smaller governments) are usually less corruptible than more
complex, fuzzy ones.

26
In general, one may keep in mind that the situation of each economy must be assessed
from all relevant aspects in order to arrive at applicable policies yielding the expected
results. Policy advice must be honest about delineating the area and the conditions under
which it is applicable. The suggestion of Alan Winters should be taken seriously:
’International organizations and donors (...) frequently talk about "best practice". For
long-run objectives like development, this raises serious questions of how we know what is
best. Some clarity on this would be welcome. Most of what we say will, at best, be
provisional.’ An especially cautious approach is necessary when advising on
transformation-related issues such as privatization and the role of the foreign sector in the
economy.
However cautious the approach of recommendations, the benefit of having efficient firms in
support of economic growth is obvious. Efficient firms emerge under good corporate
governance and in international networking. These are benefits that strategic investors can
bring to a country. The experience of the Central European countries clearly demonstrates
that FDI has on the whole benefited economic growth and international competitiveness
and that transformation may proceed much more slowly without than with the penetration
of foreign capital.
27
References
Bond, Eric, Steve Chiu and Antonio Estache (1995), ’Trade Reform Design as a Signal to Foreign Investors:
Lessons for Economies in Transition’, World Bank Policy Research Working Paper no. 1490.
Boscaiu, Voicu et al. (2000), ’Impactul commertului exterior si investitiilor straine directe asupra productivitatii sidistributiei veniturilor in industria prelucratoare. Cazul Romaniei’, Centrul Roman de Politici Economice,
Bucharest, July.
Csáki, György and Ákos Macher (1998), 'The ten years of Hungarian privatization (1988-1997)', Budapest:Hungarian Privatization and State Holding Company, http://www.apvrt.hu/ TORTENET/angol.html.
Daianu, Daniel (1997), 'Explaining shocks in post-communist economies', Revue d’Etudes Comparatives Est-Oest no. 1.
Daianu, Daniel (2000), ’Structure, Strain and Macroeconomic Dynamic in Romania’, in Rühl and Daianu (2000),
pp. 5-34.
EBRD (1999), Transition Report, London.
Gligorov, Vladimir, Mary Kaldor and Loukas Tsoukalis (2000), 'Balkan reconstruction and European integration',in V. Gligorov (ed.), Balkan Reconstruction: Economic Aspects, The Vienna Institute for International Economic
Studies (WIIW), Vienna, pp. 259-320.
Hellman, Joel, Geraint Jones, Daniel Kaufmann and Mark Schankerman (2000), 'Measuring Governance,
Corruption, and State Capture: How Firms and Bureaucrats Shape the Business Environment in TransitionEconomies', World Bank Policy Research Working Paper No. 2312, April.
Hunya, Gábor (1997a), 'Large privatization, restructuring and foreign direct investment', in S. Zecchini (ed.),,Lessons from the Economic Transition: Central and Eastern Europe in the 1990s, Boston: Kluwer Academic
Publishers, pp. 275-300.
Hunya, Gábor (1998), 'Recent developments of FDI and privatization', The Vienna Institute Monthly Report, 5,
pp. 1-7.
Hunya, Gábor (2000a), 'International Competitiveness. Impacts of FDI in CEECs', WIIW Research Reports,
No. 268, The Vienna Institute for International Economic Studies, August.
Hunya, Gábor (ed.) (2000b), Integration through foreign direct investment: making central European industriescompetitive, Edward Elgar Publ., Cheltenham, UK.
Hunya, Gábor and Kálmán Kalotay (2000), 'Privatization and FDI in Central and Eastern Europe', Transnational
Corporations, Vol. 9. No. 1 (forthcoming)
Rojec, Matija (1995), 'Foreign direct investment and privatization in Central and Eastern Europe', final reportprepared for ACE Project (Ljubljana), mimeo.
United Nations Conference on Trade and Development (UNCTAD) (1997), World Investment Report 1997:Transnational Corporations, Market Structure and Competition Policy, Geneva and New York: United Nations,
United Nations publication.
Rühl, Christof and Daniel Daianu (eds.) (2000), Economic Transition in Romania: Past Present and Future,
Proceedings of the conference 'Romania 2000. 10 years of transition – past, present and future', 21-22 October1999, Bucharest, The World Bank and Romanian Centre for Economic Policies.
Smarzynska, Beata and Shang-Jin Wie (June 2000), 'Corruption and the Composition of Foreign DirectInvestment: Firm-Level Evidence', World Bank Policy Research Working Paper no. 2360.
28
Appendix
Policies diverting FDI: the case of Romania
In general, the low level and declining trend of economic development, backward
infrastructure, unfavourable geographical location, and functional problems of
market-economy institutions have deterred FDI from Romania. At the same time, other
factors such as the relatively large size of the country, its diversified industry and low labour
costs are remarkable factors of attraction. All these factors are not enough to explain the
overall low level of FDI in Romania and especially its fluctuation over the past ten years.
This country stands as an example for a country of institutional uncertainty and
government capture.5
Legal, policy and institutional change during 1997-2000
Starting in early 1997, a number of changes regarding the legal and institutional framework
for FDI have taken place. A brief summary of the changes may show the legal mess
investors have been facing:
– End-1996 to early 1997: Law no. 35/1991 regarding foreign investment was abolished.
This law was in force for more than six years. It provided positive discrimination to
foreign investors in the form of fiscal incentives, like two to five years of tax holiday
depending of the field of investment. It guaranteed legal consistency and protected the
investor against future changes of the law.
– June 1997: Emergency Ordinance no. 31/1997 was introduced in place of the former
law. It granted less incentives and these only to larger investors. It introduced a
threshold of 350,000 US dollars for incentives and a complex scheme for granting them,
including mathematical formulas. This Ordinance could not be enforced. Its application
norms were enacted only on 29 December 1997. At the same date, the institution
nominated to implement it, the Romanian Development Agency, ceased to exist.
– 30 December 1997: Emergency Ordinance no. 92/1997 was issued concerning the
stimulation of investments. This Ordinance introduced national treatment (the equality of
treatment for Romanian and foreign investors), at the same time it drastically reduced
the incentives (mainly fiscal – no more tax holidays) to investors.
5 The words of Romanian President Emil Constantinescu (in his speech of 17 July 2000) explaining why he refrains from
standing as a candidate for a second term sheds some light on the political situation in his country:’We live in a time of people who sell and purchase principles, ideologies, seats in Parliament and Government, usinglies, blackmail, vulgarity and manipulation of people by any means. Far too many see the political function just as ameans for bringing power and wealth. I have tried through my conduct to dispel this opinion, but I don’t think Isucceeded.’ Dismayed by the little help he received in his campaign against corruption, Constantinescu reminded thatthree years ago ’in Romania there used to be a mafia-type system where an octopus of front companies benefited fromthe high protection of state institutions. A small number of professionals has managed, despite enormous pressures, touncover the entire system.’ Currently the situation has only become worse.
29
– 1998: Emergency Ordinance no. 92/1997 was debated in the Romanian Parliament
during 1998 and was promulgated as Law on direct investment no. 241 in December
1998.
– March 1999: Despite the fact that Law no. 241/1998 stipulated that its provisions would
not be changed for a period of five years (a rather unusual provision), only three months
after its promulgation, in March 1999, the incentives granted to investors were
suspended by the 1999 Budget Law. The fact that the budget law was considered in
force since 1 January 1999 determined a retroactive application and hence a
suspension of the incentives already and legally granted to investors. Particularly
affected were some companies that had signed privatization deals on the specific
assumption that the law was to be maintained for at least five years (Akmaya for the
privatization of Petromidia, Britten Norman for the privatization of Aerostar Bacau).
– May 1999: Emergency Ordinance no. 67/1999 regarding some measures for the
development of economic activity re-established a number of incentives for investment
projects in excess of USD 50 million.
– June 1999: Government Decision no. 519 established (following discussions with the
International Monetary Fund) an indefinite moratorium on the granting of incentives.
– Current situation: The present legal framework provides national treatment for foreign
investors, no incentives for any investors (Romanian or foreign). Incentives can be
applied in the framework of specific policies such as for disadvantaged areas, free trade
zones, rural tourism, oil exploration.
This rapid succession of changes in the foreign investment regime has had extremely
negative effects, generating a strong reserve on the part of foreign investors to operate in
such a volatile climate. Known examples are: Solectron (a large US company in the
electronics sector) that had in view to create 5,000 jobs in Timisoara and had to reduce its
plans in order to adapt to the current environment; Continental AG, that delayed for more
than one year its decision to invest in a tire factory due to the volatility of the legislation.
Current government and international standpoints concerning FDI in Romania
FDI has not been in the focus of the Romanian governments’ economic policy in the last
few years. Aside of some general statements on public occasions, FDI is not even a
subject included in the medium-term (2000-2004) strategy. This negative position of the
Romanian government can be mainly explained by the strong influence of local economic
interests. Political stakeholders and their economic associates are in no way xenophobic.
They just feel that they cannot compete with foreign investors in an open and transparent
environment and try to maintain an advantage by keeping these foreign investors at a
distance.

30
Local analysts also draw a parallel between the attitude of the government and that of
some international organizations. The International Monetary Fund, the World Bank and
the European Commission, which are closely monitoring the Romanian economy, do not
mention FDI promotion in their recommendations. The EU Commission generously funded,
after 1990, the establishment of foreign investment promotion agencies in all Central and
East European countries (Hungary, Poland, Czech Republic, Romania, Bulgaria) and also
in the Baltic states. In Romania, the Commission provided, during 1991-1996, over
ECU 5 million to the Romanian Development Agency for the foreign investment promotion
activity. Given these circumstances, it may be difficult to understand the total silence of the
Commission regarding the recent FDI policy of the Romanian governments and especially
the closing of the foreign investment promotion agency set up with EU money.
Position of the foreign business community
Representatives of the Association of Foreign Investors claim that they have to pass
through rather non-transparent procedures and have been faced with high transaction
costs. One of the most difficult aspects is represented by the fact that the whole system
(legal and institutional) is unpredictable: even issues that have been agreed upon or even
included in a law can be changed discretionally. (For a detailed description of procedures
see FIAS, 1999a.) Many investors believe that the coalition in power does not want foreign
investors because these investors could affect the personal Romanian interests involved in
privatization or various businesses.
A point supporting the above can be found in Tismaneanu (1999): ‘Romania got stuck in
the first phase of transition. A certain sector, made up by people either belonging to the old
nomenklatura or those who directed themselves extremely fast into the slots of
opportunities that appeared in the first period of transformation, is no longer interested in
securing and generating the second phase of transition in which it is possible that the new
types of competition could lead to the loss of the monopoly they have.'
A similar view was expressed by representatives of the Foreign Investors’ Council (1999
and 2000). The main difficulties for foreign investors were summarized in the following
recommendations:
– An in-depth improvement is required for the process of developing, introducing and
applying laws. Laws need to be coherent, understandable and practical. Currently laws
are devised without the economic players being given the opportunity to provide their
input and advice, and then they are implemented without the necessary training,
equipment and enforcement system.
– The fight against corruption and development of an underground economy is not visible
enough – the results of this lack of action being a significant shortfall in governmental
revenues and unfair treatment of those law abiding enterprises that pay taxes.

31
– The clarification of the long-term status of property is also essential to stability and
confidence.
– More attention should also be given to create a stronger spirit of entrepreneurship and
decreasing bureaucracy. A strong and growing medium-size and small enterprise
sector is essential for stable, sound development.
The Association of German Investors conducted a survey among its members in
December 1996 and repeated it in December 1999. The findings show that a deterioration
of the business environment was perceived between the two dates. Again the volatility of
the legal and institutional framework was invoked together with the high transaction costs.
Position of local business community, researchers and the public
The local business community is confronted with the same problems as foreign investors.
They have the same complaints (legal and institutional instability, high transaction costs,
fiscal repression of business) and even started to join their efforts in the discussions with
the Romanian government. Starting in spring 2000, the Foreign Investors’ Council often
appeared together with the Romanian Association of Businessmen and requested a more
friendly business climate. This shows that there are no tensions between foreign and local
investors.
In a study published by the International Centre for Entrepreneurial Studies in Bucharest,
(1999), Costea Munteanu lists causes of the low level of FDI in Romania: the volatility of
the political environment, the inefficiency of the administration, general corruption. He also
includes the absence of a foreign investment promotion agency.
In a very well documented Ph.D. thesis on FDI, Anda Mazilu (Mazilu, 1999) identifies
among the causes that have placed Romania in an unfavourable position:
– the volatility of the legislative and institutional framework;
– the counter-productive role played by the State Ownership Fund (SOF) in relation to
foreign investors. Its operation has not been transparent, business-friendly and
consistent;
– the generally high level of bureaucracy;
– uncertainty on the right of foreign investors to own land until early 1997.
The general public acknowledges the positive effects of foreign investors on the supply of
goods and on securing workplaces. Strong feelings of the public against some privatization
deals involving foreign investors were caused by the gross non-observance of the
contracts by the investors and not by their foreign status. The privatization of Romtelecom
to the Greek OTE has been under investigation of several Parliamentary commissions due
32
to the fact that the Greek investors abused certain contractual provisions and increased
excessively the telephone tariffs, exploiting the monopoly position they enjoy until end of
2002. At the same time, the investment commitments have not been fulfilled. The
privatization contract of TEPRO Iasi SA (a metallurgy plant producing metal pipes and
slabs) with the Czech company Zelezarny Vesely was under investigation and is now very
close to revision because the investor did not fulfil its contractual obligations: almost no
investment has been made, the equipment was partly exported as scrap metal, more than
the agreed number of staff has been laid off.
The topic of FDI is little present in current public discussion, priority being given to day-to-
day problems. The sharp decline of purchasing power of the population and the serious
dysfunction of the public institutions are much hotter issues than FDI. The November
elections may also put the FDI subject on a lower position because the perception is that
the electorate is much more sensitive to its individual needs than to macroeconomic
problems.
General investment promotion
Starting in 2000, investment promotion has substituted FDI policy. Although some
observers and foreign investors consider it premature, the abolition of FDI-related incentive
schemes is in line with EU regulations. Investments are stimulated by general rules of
taxation, by regional policy and by the policy related to small and medium-size enterprises
(SMEs).
The general level of corporate income tax has been lowered to 25%. (For the earlier
system see FIAS, 1999b.) A specific exception to the rule is that profits tax incentives can
be granted for investments exceeding USD 50 million, at the discretion of the government.
This allows for special treatment in the case of large, mainly foreign investment projects.
Profits earned on sales for exports are taxed 5% only. In addition, a 10% fiscal credit for
financing technological equipment has been provided. Only SMEs benefit from customs
duty and VAT exemption on imported technology equipment. They are given priority when
state-owned assets are sold. They can pay in instalments during three to five years
following a downpayment of 5-20% of the price. A special credit guarantee fund as well as
several internationally financed projects and credit schemes serve the easier access of
SMEs to financial means of investment.
33
Appendix references
Bonciu, Florin (2000), ’Impediments and prospects of FDI in Romania’, WIIW, Vienna, mimeo
FIAS (1999a), ’Romania: Administrative barriers to investment’
FIAS (1999b), ’Romania: Business taxation and incentives’
Foreign Investors Council (1999 and 2000), 'White Book. Investment climate in Romania – proposals forimprovement'.
Dunning, J. (1993), Multinational Enterprises and the Global Economy, Addison Wesley Publ., Wokingham.
Mazilu, Anda (1999), 'Transnationals and competitiveness', Editura Economica, Bucharest.
Tismaneanu, Vladimir (1999), 'Romania got stuck in the first phase of transition', Curentul, 5 October.
International Centre for Entrepreneurial Studies (1999), 'From recession to growth through FDI', Bucharest,
November.