recent economic developments in singapore 4 march 2016/media/mas/monetary policy and...
TRANSCRIPT
Monetary Authority of Singapore Economic Policy Group
17 September 2014
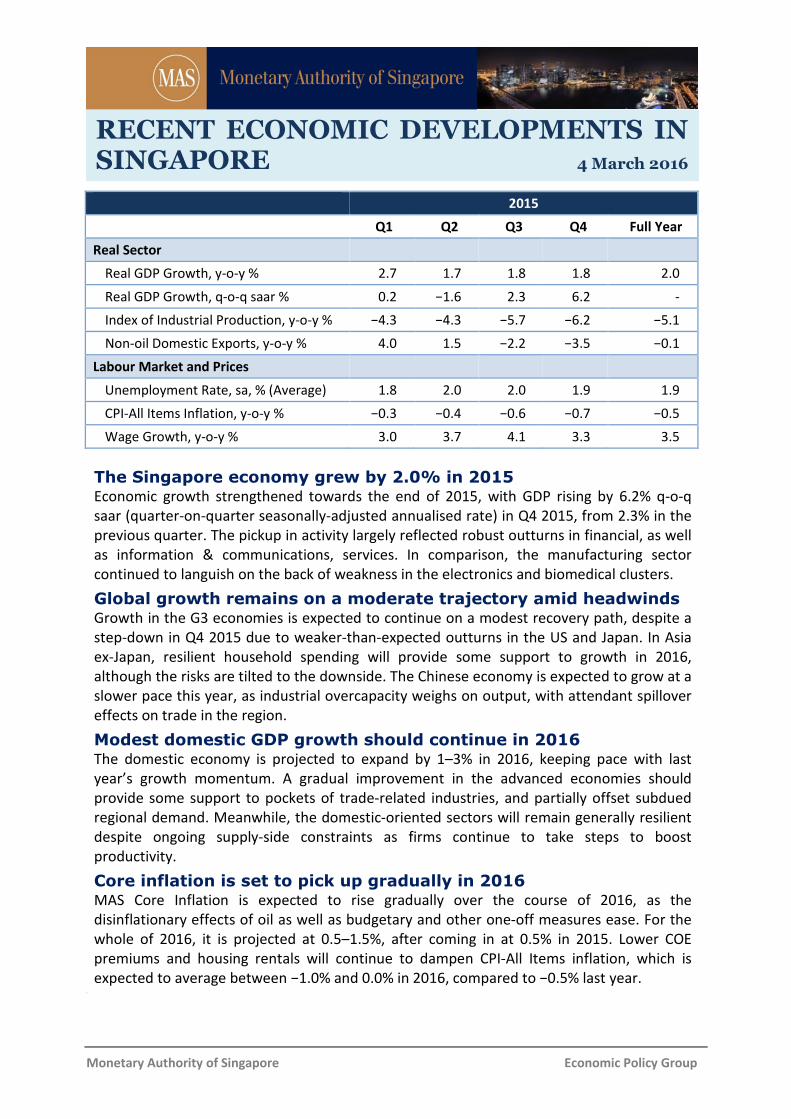
The Singapore economy grew by 2.0% in 2015 Economic growth strengthened towards the end of 2015, with GDP rising by 6.2% q-o-q
saar (quarter-on-quarter seasonally-adjusted annualised rate) in Q4 2015, from 2.3% in the
previous quarter. The pickup in activity largely reflected robust outturns in financial, as well
as information & communications, services. In comparison, the manufacturing sector
continued to languish on the back of weakness in the electronics and biomedical clusters.
Global growth remains on a moderate trajectory amid headwinds Growth in the G3 economies is expected to continue on a modest recovery path, despite a
step-down in Q4 2015 due to weaker-than-expected outturns in the US and Japan. In Asia
ex-Japan, resilient household spending will provide some support to growth in 2016,
although the risks are tilted to the downside. The Chinese economy is expected to grow at a
slower pace this year, as industrial overcapacity weighs on output, with attendant spillover
effects on trade in the region.
Modest domestic GDP growth should continue in 2016 The domestic economy is projected to expand by 1–3% in 2016, keeping pace with last
year’s growth momentum. A gradual improvement in the advanced economies should
provide some support to pockets of trade-related industries, and partially offset subdued
regional demand. Meanwhile, the domestic-oriented sectors will remain generally resilient
despite ongoing supply-side constraints as firms continue to take steps to boost
productivity.
Core inflation is set to pick up gradually in 2016 MAS Core Inflation is expected to rise gradually over the course of 2016, as the
disinflationary effects of oil as well as budgetary and other one-off measures ease. For the
whole of 2016, it is projected at 0.5–1.5%, after coming in at 0.5% in 2015. Lower COE
premiums and housing rentals will continue to dampen CPI-All Items inflation, which is
expected to average between −1.0% and 0.0% in 2016, compared to −0.5% last year. Is i
2015
Q1 Q2 Q3 Q4 Full Year
Real Sector
Real GDP Growth, y-o-y % 2.7 1.7 1.8 1.8 2.0
Real GDP Growth, q-o-q saar % 0.2 −1.6 2.3 6.2 -
Index of Industrial Production, y-o-y % −4.3 −4.3 −5.7 −6.2 −5.1
Non-oil Domestic Exports, y-o-y % 4.0 1.5 −2.2 −3.5 −0.1
Labour Market and Prices
Unemployment Rate, sa, % (Average) 1.8 2.0 2.0 1.9 1.9
CPI-All Items Inflation, y-o-y % −0.3 −0.4 −0.6 −0.7 −0.5
Wage Growth, y-o-y % 3.0 3.7 4.1 3.3 3.5
RECENT ECONOMIC DEVELOPMENTS IN SINGAPORE 4 March 2016

Monetary Authority of Singapore 2 Economic Policy Group
A. External Developments
G3 growth fell in Q4 2015 on a pullback in the US and Japanese
economies
Overall GDP growth in the G3 economies slowed to 0.5% q-o-q saar in Q4 2015, from 1.5%
in Q3. Although economic activity continued to expand modestly in the Eurozone, US
growth moderated while Japan’s economy contracted due to a cutback in private
consumption spending. The G3 growth forecast for 2016 has been revised down to 1.7%
(from 2.0% in December 2015), which represents only a marginal improvement from the
1.6% pace of expansion recorded in 2015.
Growth in the US economy decelerated to
1.0% q-o-q saar in Q4 2015, from 2.0% a
quarter earlier. The loss of momentum was
broad-based, reflecting weakness in both the
manufacturing and services sectors. Despite
an increase of 2.5% q-o-q saar in real
disposable incomes, arising in part from lower
oil prices, household consumption growth
eased to 2.0% q-o-q saar in Q4, from 3.0%
in the preceding quarter. Meanwhile,
non-residential fixed investment fell for the
first time since Q3 2012, by 1.9% q-o-q saar,
as equipment spending contracted alongside structures, reflecting a pullback in oil-related
capital expenditure as well as in the manufacturing sector which faced persistent
headwinds. The sustained appreciation of the US dollar continued to exert a drag on net
exports in Q4, subtracting 0.3% point from GDP growth, with the change in inventories
shaving off another 0.1% point.
Economic activity in the US should rebound in the near term, supported by resilient
household spending. Favourable labour market conditions, as seen in the steady decline in
the unemployment rate to a post-crisis low of 4.9% in January 2016, suggest that consumer
spending will remain firm, thus providing the main underpinning to GDP growth this year.
Average hourly earnings for private sector workers surged by 0.5% m-o-m sa in January, the
second strongest monthly gain since the recovery from the Global Financial Crisis (GFC).
Despite the stock market rout at the beginning of the year, consumer surveys in February
indicated that household sentiment stayed resilient. Nonetheless, some headwinds to
growth remain, with tepid external demand and a strong US dollar weighing on exports, and
capex in the energy industries likely to be depressed as global oil prices stay low for a longer
period. All in, GDP growth in the US is expected to come in at 2.2% in 2016, before rising
slightly to 2.4% in 2017.
Growth in the US eased in Q4 2015, while
output in Japan contracted.
Source: Datastream and CEIC
2010 2011 2012 2013 2014 2015-8
-4
0
4
8
12
% Q
OQ
SA
AR
Q4
US
JapanEurozone

Monetary Authority of Singapore 3 Economic Policy Group
Growth momentum in the Eurozone held steady in Q4 2015, supported by firm domestic
demand. GDP growth came in at 1.1% q-o-q saar in Q4, similar to the outturn of 1.2% in Q3.
Nonetheless, this marked a fairly notable deceleration in economic momentum, with GDP
growth easing from the average rate of 1.9% registered in H1 2015 to 1.1% in H2. While the
pace of activity in Germany, France and Spain remained unchanged in Q4, as compared to
the previous quarter, Italy stagnated. The German economy expanded by 1.1% q-o-q saar in
Q4, as a pickup in government spending and construction-related investment offset a
negative export drag. Amid an ongoing recovery in the labour market, the Spanish economy
grew by 3.2% q-o-q saar, posting yet another quarter of solid gains. Meanwhile, growth in
France stood firm at 1.4% q-o-q saar in Q4, even as private consumption faltered in the
aftermath of the Paris terror attacks in November. In comparison, growth momentum in
Italy slipped for the third straight quarter, with GDP rising by an anaemic 0.4% q-o-q saar in
Q4. Elsewhere in the Eurozone, Greece relapsed into recession, as the imposition of capital
controls since June and fiscal austerity took a toll on economic activity.
While the Eurozone’s recovery remains largely on track, the growth outlook has
weakened slightly. The Eurozone Composite Output PMI fell to 53.0 in February, from 53.6
in January and 54.3 in December, largely due to an export-induced slump in the
manufacturing sector. In addition, the recent turbulence in Eurozone financial markets, if it
persists, could have negative spillovers to the real economy via the confidence and credit
channels. More positively for growth, the ECB stands ready to enhance monetary stimulus
even as interest rates remain in negative territory, which may provide further support to
domestic demand at the margin. Alongside continued improvements in the labour market,
as well as an easier fiscal stance, GDP growth in the Eurozone is projected at 1.6% in 2016,
up slightly from 1.5% in 2015.
The Japanese economy contracted in Q4 due to an unexpected fall-off in domestic
demand. GDP fell by 1.4% q-o-q saar, following an expansion of 1.3% in Q3, resulting in
sub-par growth of 0.4% for 2015 as a whole. Private consumption declined by 3.3% in Q4,
reflecting in part a pullback in spending on winter wear and utilities due to unseasonably
warm weather, while residential investment retracted by 4.8% after rising for three
quarters. Cutbacks in public investment spending and inventory destocking subtracted 0.5%
point each from overall GDP growth. In comparison, private non-residential investment
recorded a second consecutive quarter of expansion, rising by 5.7% q-o-q saar in Q4 2015.
Net trade also contributed positively to growth on account of a relatively sharper decline in
imports vis-à-vis exports.
A pickup in domestic demand in the latter half of this year should support a modest
recovery in Japan. In particular, consumer spending is anticipated to pick up in the later
part of this year, ahead of another consumption tax hike scheduled for April 2017 and
underpinned by a further increase in real wages. Capital investment by firms should also
expand gradually, given diminishing industrial slack and healthy corporate profits. However,
the extent of the rise in capex could be constrained if the current appreciation of the yen
persists, despite the Bank of Japan’s move in cutting its policy rate to negative 0.1% in

Monetary Authority of Singapore 4 Economic Policy Group
January 2016. On balance, Japan’s GDP growth is anticipated to come in at 1.0% in 2016,
before slowing to 0.6% in 2017 largely on account of the next consumption tax hike.
CPI inflation in the G3 economies turned up
in Q4 2015, although low energy costs
continued to restrain price pressures.
Headline inflation in the US and the Eurozone
came in slightly higher in Q4, at 0.5% and
0.2% y-o-y, respectively, aided by improving
domestic conditions and accommodative
monetary policy. Core inflation in the US rose
to 2.0% y-o-y, alongside declining slack in the
labour market. In the Eurozone, core inflation
also crept up for the third consecutive
quarter, rising to 1.0% in Q4, as the effects of
euro depreciation filtered through to prices. In Japan, headline CPI inflation edged up to
0.3% y-o-y in Q4 2015 from 0.2% in Q3, due in part to higher food inflation. Taking into
consideration the renewed fall in oil prices at the beginning of 2016, the headline inflation
forecast for the G3 economies as a whole has been revised down to 0.9% this year, from a
previous estimate of 1.3%. Nonetheless, this still marks a significant increase from the 0.2%
inflation outcome in 2015.
Asia ex-Japan growth stabilised in Q4 2015
The Asia ex-Japan region registered growth of
4.6% y-o-y in Q4 2015, unchanged from the
previous quarter. While economic activity in
China and India slackened, this was
counterbalanced by a slightly stronger
performance in the ASEAN-4 economies.
From the expenditure perspective, firm
private consumption in most economies
offset the weakness in exports and private
investment. Looking ahead, growth in Asia ex-
Japan is expected to come in at a subdued
4.6% in 2016, a shade lower than the 4.7%
recorded in 2015, as the region continues to
contend with a slowdown in China and low
commodity prices.
In China, headline growth softened marginally in Q4 2015, alongside a continued
divergence in the performances of the industrial and services sectors. GDP growth came in
at 6.8% y-o-y in Q4, compared to 6.9% in Q3. The services industry was the main driver of
growth, led by buoyant financial sector activity. Retail sales rose by 11.1% y-o-y, up from
Inflation in the G3 economies picked up
slightly in Q4 2015.
Source: Datastream and CEIC
Growth in Asia ex-Japan came in unchanged
in Q4.
Source: CEIC and EPG, MAS estimates
* Regional groupings are weighted by Singapore's non-oil
domestic exports (2009–13 average).
Note: NEA-3 refers to Hong Kong, Korea and Taiwan while
ASEAN-4 refers to Indonesia, Malaysia, Thailand and the
Philippines.
2010 2011 2012 2013 2014 2015-2
-1
0
1
2
3
4
% Y
OY
Q4
US
Japan
Eurozone
0
2
4
6
8
10
12
14
2010 2011 2012 2013 2014 2015
% Y
OY
Q4
IndiaChina
ASEAN-4*
NEA-3*

Monetary Authority of Singapore 5 Economic Policy Group
10.7% in Q3, supported by a halving of car purchase taxes. For the year as a whole, the
Chinese economy expanded by 6.9%, with tepid growth in the industrial sector offset by a
strong showing in the services industries. The industrial sector’s pace of expansion slipped
to 6% last year from 7.3% in 2014, as manufacturing and construction activities were
weighed down by excess production capacity and a housing stock overhang. Fixed asset
investment (FAI) in both the manufacturing and the real estate sectors continued to cool
amid sluggish exports and developers’ reluctance to embark on new projects, although
infrastructure investment helped to cushion the slowdown. In comparison, growth in the
services sector strengthened to 8.3% last year, from 7.8% the year before, with its share of
China’s GDP rising to 50.5%, compared to 48.1% in 2014.
High-frequency data signal a slackening in growth momentum for the Chinese economy.
The official manufacturing PMI for February fell to a 51-month low of 49.0, as new orders
lapsed. While staying in positive territory, the non-manufacturing PMI showed a weaker
pace of expansion in the same month. As the authorities pursue structural reforms and
implements plans to reduce excess capacity in the economy, workers could be laid off from
heavy industry, posing a downside risk to household consumption. Nonetheless, the central
government is expected to buffer slowing growth by introducing more targeted fiscal
support. Accordingly, the consensus has pegged China’s GDP growth at 6.5% this year, at
the lower end of the government’s 6.5–7.0% range.
India’s GDP growth eased in Q4 2015, alongside slowing fixed investment. Overall growth
dipped to 7.3% y-o-y in Q4 from 7.7% in the previous quarter, as weaker investment growth
more than offset a pickup in private consumption. India’s investment recovery lost
momentum, with gross fixed capital formation growth retreating to 2.8% y-o-y in Q4 from
7.6% the quarter before, largely due to weak private capital spending. However, household
consumption expanded by 6.4% y-o-y in Q4, with firm urban spending more than
compensating for weak rural demand. Meanwhile, net exports contributed positively to
overall growth, after posing a slight drag in the preceding two quarters, as the contraction
in imports outpaced the fall in exports. Looking ahead, the Indian economy should remain
on a modest recovery path, supported by low energy prices and accommodative monetary
conditions. Nonetheless, risks to growth are skewed to the downside amid a weaker global
environment and potential financial stability concerns stemming from fragile bank and
corporate balance sheets. All in, GDP growth is expected to come in at 7.4% in FY20161,
picking up further to 7.7% the following year.
Growth in the NEA-3 economies lost traction in Q4 2015. The region as a whole registered
an expansion of 1.6% q-o-q saar in Q4, down from 2.2% in the preceding quarter. On a y-o-y
basis, growth came in at 1.4% in Q4, unchanged from the pace in Q3 2015. Even though
domestic activities held up reasonably well, these economies continued to be buffeted by
headwinds from weak global trade flows, reflecting in part waning demand from China. In
Hong Kong, GDP increased by just 0.9% q-o-q saar in Q4, down from the 2.2% recorded in
1 India reports its economic figures on a Financial Year basis. FY2016 refers to the period from April 2015 to March 2016.

Monetary Authority of Singapore 6 Economic Policy Group
Q3, as a fall in net exports outweighed increases in domestic consumption and gross capital
formation. Korea also saw a significant step-down in growth to 2.3% q-o-q saar in Q4 2015,
from 5.3% in Q3, on account of a retrenchment in construction investment and the
persistent drag from flagging exports. In contrast, aided by a rebound in private
consumption, the Taiwanese economy expanded by 2.2% q-o-q saar in Q4 2015, reversing
two quarters of declines.
Looking ahead, the region will experience only a modest pickup in growth. Retail sales in
Hong Kong are expected to remain depressed, amid further declines in Chinese tourist
arrivals. Taiwan’s economic prospects would continue to be restrained by slower global
trade and its knock-on effects on manufacturing and employment. In Korea, elevated
household debt levels could blunt the efficacy of the accommodative monetary policy put in
place since June 2015, even as the country’s consumer electronics manufacturers face
challenging external headwinds and stiff competition from China. Overall, growth in the
NEA-3 is projected to improve modestly to 2.1% this year and further to 2.4% in 2017, from
1.9% in 2015.
In the ASEAN-4 economies, GDP growth held steady at 4.6% in Q4, as an improvement in
domestic demand provided a positive offset to continued weakness in exports. Domestic
demand was boosted by a surge in investment activity in Indonesia, Thailand and the
Philippines, mainly reflecting a ramp-up in public infrastructure works. Private consumption
also strengthened across the ASEAN-4 economies, recording growth rates at or above their
ten-year averages, with the exception of Malaysia. In contrast, exports from the region
contracted, owing to a persistent slump in global commodity markets, particularly in
energy-related products. Nonetheless, there were some signs of a tentative upturn in the
exports of manufactured products. Notably, Malaysia posted significant increases in
shipment volumes of machinery and transport equipment as well as some other
manufactures over the past two quarters. The Philippines also recorded strong growth in
real exports of office and telecommunications equipment.
Growth is expected to remain below trend in most of the ASEAN-4 economies in 2016. In
Malaysia, GDP growth is projected to decelerate to 4–4.5% this year, given its considerable
exposure to the slowing China economy and primary commodities, particularly the oil and
gas segments. At the same time, domestic demand growth is likely to moderate somewhat,
as fiscal expenditures are constrained by weak oil and gas revenues, while poor economic
sentiment weighs on private sector spending. Although the global slump in commodities
will also affect Indonesia adversely, the impact will be offset by a pickup in public and
private investment. In 2016, the Indonesian economy is forecast to expand by about 5%,
slightly higher than last year’s pace of 4.8%. Meanwhile, Thailand will also see marginally
stronger, but still sub-par, growth of about 3%. While a surge in public construction activity
should lend some support, private sector spending would likely stay lacklustre in the face of
weak consumer confidence and continued political uncertainty. In contrast, the Philippines
economy is expected to expand at an above-trend pace for the fifth year in a row, growing
by around 6% in 2016, higher than its ten-year average of 5.4%. Growth will be undergirded

Monetary Authority of Singapore 7 Economic Policy Group
by continued strength in household spending, ongoing infrastructure projects, as well as
additional fiscal stimulus in the run-up to the Presidential election in May.
Headline inflation in Asia ex-Japan was
subdued in Q4 2015. CPI inflation for the
region as a whole came in marginally lower at
2.3% y-o-y in Q4, compared to 2.4% the
quarter before. Price pressures in China and
ASEAN-4 eased, while inflation in the NEA-3
and India rose. In China, headline inflation
declined to 1.5% y-o-y in Q4 from 1.7% in the
previous quarter, as pork prices rose at a
more moderate pace. Producer prices fell by
a sharper 5.9% y-o-y, weighed down by
widespread industrial gluts. In the ASEAN-4
economies, headline inflation moderated
significantly to 3.0% y-o-y in Q4 from 4.2% in
Q3, mainly reflecting easing energy price
pressures, particularly in Indonesia. Meanwhile, persistent weakness in economic activity
kept underlying inflation low in the region, with the exception of Malaysia, where prices
had been lifted by the introduction of the Goods and Services Tax (GST) last April. In the
NEA-3 economies, CPI inflation rose to 1.1% y-o-y in Q4 2015 from 0.7% in Q3, due to
higher food prices in Korea and Taiwan. An increase in food prices was also the main reason
for a pickup in headline inflation in India, to 5.3% in Q4 2015 from 3.9% the quarter before.
With growth anticipated to come in below potential, headline inflation in Asia ex-Japan is
expected to moderate to 2.2% in 2016, before rising to 2.6% in 2017.
CPI inflation remained subdued in Asia ex-
Japan.
Source: CEIC and EPG, MAS estimates
* Regional groupings are weighted by 2013 nominal GDP.
** India’s series uses CPI (Industrial Workers) prior
to 2012.
0
4
8
12
16
2010 2011 2012 2013 2014 2015
% Y
OY
Q4
India**
China
ASEAN-4*
NEA-3*

Monetary Authority of Singapore 8 Economic Policy Group
Table 1: Consensus Forecasts of GDP Growth
2014 2015 Forecast
2016 2017
Percent
Industrial
US 2.4 2.4 2.2 2.4
Japan 0.0 0.4 1.0 0.6
Eurozone 0.9 1.5 1.6 1.7
UK 2.9 2.2 2.2 2.2
NEA-3
Hong Kong 2.6 2.4 1.9 2.1
Korea 3.3 2.6 2.7 2.8
Taiwan 3.9 0.7 1.9 2.6
ASEAN-4
Indonesia 5.0 4.8 4.9 5.3
Malaysia 6.0 5.0 4.3 4.6
Thailand 0.8 2.8 3.0 3.3
Philippines 6.1 5.8 5.9 5.9
China 7.3 6.9 6.5 6.3
India* 6.6 7.2 7.4 7.7
Source: CEIC and Consensus Economics, Feb 2016
*Refers to fiscal year ending Mar.

Monetary Authority of Singapore 9 Economic Policy Group
B. Domestic Developments
The Singapore economy grew modestly in 2015
Growth in the Singapore economy gathered pace in Q4 2015, with GDP rising by 6.2% q-o-q
saar, up from 2.3% in the preceding quarter. The acceleration largely reflected robust
expansions in modern services, including financial services and information &
communications. Domestic-oriented activities also recorded some improvement in
momentum. In contrast, the trade-related industries continued to experience softer
outturns. For the year as a whole, GDP grew by 2.0% in 2015, down from 3.3% in 2014. The
moderation in growth trajectory last year was broad-based across most sectors, in part
reflecting the effects of the synchronised slowdown in the Chinese and regional economies.
Some production activities were also disproportionately affected due to their exposures to
sector-specific headwinds buffeting the global IT and oil & gas industries. Further, some of
the manpower-reliant sectors which have been affected by ongoing efforts to boost
productivity continued to face transitory supply-side constraints to growth.
The manufacturing sector shrank by 4.9%
q-o-q saar in Q4 2015 after posting a fall of
6.0% in Q3. The sector saw weak outturns
mainly in the electronics and biomedical
clusters, although the transport engineering
and precision engineering clusters recouped
some of the losses incurred in previous
quarters. Against the backdrop of a steep
10% y-o-y contraction in global PC shipments
in Q42, output in the PC-related segments of
the domestic electronics cluster remained in
negative territory. Meanwhile, the slump in the biomedical cluster partly reflected some
scaling back in the pharmaceuticals segment due to a shift in product mix. Further, the
chemicals sector experienced a drop in output due to maintenance works at key
petrochemical installations.
For 2015 as a whole, the manufacturing sector declined by 5.2%, the first contraction since
the GFC. The pullback in output was especially pronounced in the electronics and transport
engineering clusters. Within the domestic IT cluster, the semiconductors segment was
buffeted by a slowdown in global electronics demand for final products such as PCs and
mobile devices. Worldwide semiconductor chips sales fell by 0.2% in 2015, the first decline
recorded since 2012. The marine & offshore segment within the transport engineering
cluster was also beleaguered by rig delivery delays and cancellations amid ongoing cutbacks
to oil exploration activities. In turn, these developments generated negative spillovers to
supporting segments within the precision engineering cluster.
Production remained lacklustre in Q4 2015.
2 Source: International Data Corporation Worldwide Quarterly PC Tracker
2013 2014 2015-12
-8
-4
0
4
8
12
% P
oin
t C
ontr
ibution t
o IIP
Q
OQ
SA
Gro
wth
Electronics ChemicalsBiomedical Precision EngTransport Eng General MfgOverall IIP
Q4

Monetary Authority of Singapore 10 Economic Policy Group
Mirroring the weak overall production in Q4 2015, the trade-related services industries also
conceded momentum during the quarter. Notably, the fall-off in oil refining output weighed
on wholesale activity in the oil-related segment, with oil export volumes seeing a decline.
This in turn dragged on the transport & storage sector, as evident by the sharp pullback in
sea cargo volumes handled.
Meanwhile, following a mild 0.9% q-o-q saar expansion in the preceding quarter, the
financial services sector saw a 34.1% surge in activity in Q4 2015. Growth was largely
underpinned by the fund management industry, which posted a significant step-up in net
fees and commissions earned and recognised at the end of the year. The insurance industry
also witnessed healthy gains, supported in part by increased sales of life insurance policies.
The life insurance business was likely to have benefited from wider distribution via
bancassurance, in tandem with the launch of new products. In contrast, the financial
intermediation segment had to contend with slowing regional trade and economic growth,
as well as concerns over the sustainability of corporate debt levels amid rising interest
rates. As a result, domestic and offshore non-bank loan volumes contracted by 1.4% and
3.3% q-o-q respectively in Q4.
Tourism-related activities experienced some moderation in growth in Q4 2015 after a
robust showing in the previous quarter, with total visitor arrivals declining by 0.6% q-o-q
sa. In tandem with the dip in arrivals, hotel occupancy rates fell from 86.8% sa in Q3 to
85.3% in Q4. The fall in tourist arrivals also weighed on the domestic retail sector, with
overall retail sales volumes (excluding motor vehicles) declining in the quarter, especially in
discretionary spending on items such as watches and jewellery.
Domestic-oriented sectors, including
essential services, information &
communications services and construction,
remained supportive of growth. Healthcare
services were bolstered by the ramp-up
of operations at Ng Teng Fong General
Hospital, as well as the opening of Yishun
Community Hospital in December last year.
The information & communications sector
benefited from increasing wireless broadband
subscriptions, while the business services
sector saw sustained corporate demand for
professional services such as accounting and consultancy services. A firm expansion of
6.0% q-o-q saar in the construction sector also imparted some impetus to overall growth in
Q4, as works on public infrastructural projects resumed after a temporary pause in the
preceding quarter. However, the sector experienced a step-down in growth for 2015 as a
whole, as activity in private residential and non-residential works tapered off.
Construction activities picked up in Q4.
Source: EPG, MAS estimates
2012 2013 2014 201590
100
110
120
130
140
150
Index (
Q1 2
012=
100),
SA
Private Works Certified Payments
Public WorksCertified Payments
Total Certified Payments
Q4

Monetary Authority of Singapore 11 Economic Policy Group
The domestic economy is expected to grow at a modest pace in 2016
Against the sluggish external backdrop, GDP growth in Singapore is forecast to come in at
1–3% in 2016. While gradual improvements in the G3 economies, particularly the US, over
the rest of the year should impart some impetus to Singapore’s external-oriented
industries, the recent downshift in US import demand3 suggests that such positive spillovers
could be limited. Following a lacklustre performance in 2015, the global IT industry is
expected to recover only gradually, given subdued external demand conditions and
elevated inventory levels for mobile and PC devices. Moreover, the extent to which the
local IT industry is able to leverage on cyclical upticks will be capped by some ongoing
transitions away from volume manufacturing, toward providing high-value services within
manufacturing such as chip design and delivery of IT services.
The protracted slowdown in China will continue to feature in the region’s immediate
growth outlook, dampening demand for some of Singapore’s external-facing services such
as entrepôt-related transport & storage activities, accommodation and arts, entertainment
& recreational services. Subdued regional economic prospects may also weigh on growth in
offshore lending. Within the oil-related industries, the marine & offshore engineering
segment continues to face sluggish rig orders amid sustained weakness in oil prices and a
global oversupply of rigs. Stockpiling by commodity traders, as well as the accumulation of
China’s strategic crude oil reserves, could however lead to intermittent spurts of growth in
oil trading, transport and storage.
With the trade-related industries buffeted by external headwinds, modern services will play
a more important role in supporting growth this year. Notably, demand for information &
communications services is expected to be firm, with the government’s “Smart Nation”
initiative, which includes procurement of a wide range of IT services and infrastructure4,
providing the boost. Meanwhile, the life insurance industry should continue to register
healthy gains, given Singapore’s relatively lower life insurance penetration rate as
compared to other advanced Asian economies.5
The domestic-oriented sectors as a whole will remain broadly supportive, underpinned by
ongoing enhancements to social services and transport infrastructure. Increased
government expenditure in the healthcare and education sectors will help to meet pent-up
demand for essential services, even as expansions in transport facilities continue apace.
3 Growth of US imports averaged −2.4% y-o-y in Q1–Q3 2015, compared to an average of 5.2% y-o-y over the longer span of
Q1 2001 – Q3 2015.
4 In May 2015, the government announced that it will be launching $2.2 billion worth of ICT tenders in FY2015 to procure
digital and data services, web services, and information communications infrastructure to develop the Smart Nation Platform.
5 Singapore’s life insurance penetration rate (gross life insurance premiums as a percentage of GDP) stands at 5.7% as of 2014.
This is lower than Hong Kong (11.7%), Japan (6.7%) and Korea (8.2%) according to the latest OECD insurance statistics, which is
only available up to 2013.

Monetary Authority of Singapore 12 Economic Policy Group
There are potential external and domestic headwinds to growth. Transitional drags in
China from ongoing reforms and persistent weakness in its residential property market
could weigh on prospects in the region. A reprisal of the volatility witnessed in the Chinese
stock and currency markets in 2015 and early 2016 could also dampen investor and
business sentiments.
On the domestic front, there are challenges as the restructuring towards productivity-led
growth proceeds apace. Notably, companies will face continued margin pressures arising
from a confluence of labour supply constraints and a subdued external environment.
Notwithstanding the short-term challenges to growth, the restructuring exercise would
facilitate Singapore’s transformation into a knowledge- and skills-intensive economy over
the medium term, and set the stage for the next phase of sustainable growth for a mature
economy with binding resource constraints.

Monetary Authority of Singapore 13 Economic Policy Group
C. Labour Market and Consumer Prices
Overall employment grew by 15,500 in Q4 2015
Preliminary estimates indicated that overall employment expanded by 15,500 in
Q4 2015, higher than the 12,600 workers added in the preceding quarter. The pickup was
supported by increased hiring in services. Headcount gains in construction moderated,
while more workers in manufacturing were laid off.
The services sector employed 20,900 more workers in Q4, a step-up from the 13,300 jobs
created in the previous quarter. Hiring rose in retail trade and accommodation & food
services to meet the seasonal rise in demand during the year-end festivities. At the same
time, employment creation remained resilient in the domestic services segments including
community, social and personal (CSP) as well as administrative & support services.
Due to the slowdown in private-sector building activities, job gains in construction
moderated to 1,300 in Q4 2015, about one-third of that in Q3. Meanwhile, the
manufacturing sector shed 6,700 workers, following the 4,300 job cuts in the previous
quarter. This was the fifth consecutive quarter of contraction in manufacturing
employment, reflecting weaker demand conditions confronting the various clusters.
The overall unemployment rate eased in
Q4 2015. Reflecting stronger employment
gains in Q4 2015, the overall seasonally-
adjusted unemployment rate inched down to
1.9%, from 2.0% in Q3. Similarly, the resident
unemployment rate dropped to 2.9%, from
3.0% three months ago. Meanwhile, overall
redundancies rose to 4,200 in Q4, from
3,460 in the preceding quarter, as the
manufacturing sector saw higher layoffs amid
weak cyclical demand conditions and ongoing
business restructuring in various industries.
Wage growth moderated to 3.3% on a y-o-y basis in Q4 2015, from 4.1% in the previous
quarter. The slowdown was partly due to the retail and accommodation & food services
segments, which hired more part-time and temporary workers with lower average monthly
salaries. Wage gains continued to be uneven across sectors, being higher in transport &
storage and professional services, and lower in manufacturing and administrative & support
services.
For the whole of 2015, overall wages grew by 3.5%, while preliminary estimates showed
that total employment expanded by 31,800 or 0.9%. Over the near term, employment
creation is expected to remain subdued and wage pressures are likely to ease in line with
the tepid economic environment. Nonetheless, labour demand will continue to be uneven
The overall unemployment rate eased in
Q4 2015.
2010 2011 2012 2013 2014 2015
1.6
1.8
2.0
2.2
2.4
-20
0
20
40
60
Per
Cent, S
A
Changes in E
mplo
yment
('000)
ConstructionServices IndustryManufacturingOverall Unemployment Rate (RHS)
Q4

Monetary Authority of Singapore 14 Economic Policy Group
across sectors and wage increments will be larger in industries where manpower shortages
are more acute, such as CSP services.
Inflation eased in Q4 2015 before picking up slightly in January 2016
Inflation edged down in the last quarter of
2015. MAS Core Inflation, which excludes the
costs of accommodation and private road
transport, fell to 0.2% y-o-y in Q4 2015 from
0.4% in Q3, largely due to lower electricity
tariffs following the slide in global oil prices in
the previous quarter.6 CPI-All Items inflation
was also dampened by softer housing rentals
and car prices, and eased to −0.7% in Q4 2015
from −0.6% in Q3.
For the whole of 2015, CPI-All Items inflation
eased to −0.5% from 1.0% in the preceding year, while MAS Core Inflation was 0.5%
compared to 1.9% in 2014. The main contributors to the negative headline inflation rate in
2015 were car prices and housing rentals (−0.7% point), and prices of oil-related items,
including petrol, electricity and gas (−0.5% point).
In January 2016, MAS Core Inflation and CPI-All Items inflation edged up to 0.4% and
−0.6% respecBvely, on account of a smaller decline in the cost of oil-related items, and as
some temporary disinflationary effects from budgetary and other one-off measures
dissipated.
The drag from oil-related items on year-ago inflation eased slightly in January due to base
effects. Prices of oil-related items fell by 8.7% in Q4 compared to a drop of 8.1% in Q3, as
the reduction in electricity tariffs more than offset the impact of higher petrol pump prices
on a year-ago basis. 7 However, the pace of decline in prices of oil-related items slowed to
−3.2% in January 2016, as a result of the low base in January last year.
Food inflation edged down to 1.7% in Q4 and January, from 1.8% in Q3. The cost of
prepared meals rose at a slower pace of 2.3% in Q4 and 1.8% in January, compared to 2.5%
in Q3 2015, largely due to more modest price increases in restaurants. Meanwhile,
non-cooked food inflation eased to 0.6% in Q4 from 0.8% in the previous quarter, amid
MAS Core Inflation and CPI-All Items inflation
rose in January 2016.
6 The fuel cost component of the electricity tariff is based on the average forward fuel oil and dated Brent prices in the first two
and a half months in the preceding quarter, and makes up approximately half of the electricity tariff.
7 Petrol pump prices rose by 1.4% y-o-y in Q4 2015 compared to a 3.5% decline in the previous quarter. This reversal is mainly
on account of the relatively low base in the last quarter of 2014 when petrol pump prices fell sharply following the plunge in
global oil prices. The cost of petrol incorporates the hike in petrol duty rates announced in Budget 2015.
2010 2011 2012 2013 2014 2015-2
0
2
4
6
% Y
OY
MAS Core Inflation
CPI-All Items Inflation
2016 Jan

Monetary Authority of Singapore 15 Economic Policy Group
subdued global food commodity prices. It subsequently picked up to 1.5% in January, as
various supermarket price discounts expired.8
Services inflation picked up in Q4 but slowed again in January. After rising to 0.8% in Q4
2015 from 0.6% in Q3, overall services inflation fell to 0.5% in January due to a slower pace
of increase in education services fees and public road transport fares.9 Meanwhile, the cost
of healthcare services picked up in January as the disinflationary effects of enhanced
medication subsidies introduced at the beginning of last year dissipated.10
The costs of accommodation and private road transport continued to fall. Accommodation
cost was lower by 3.0% and 3.1% in Q4 and January respectively, extending the 2.9% drop
in Q3, as the housing rental market continued to soften. Private road transport cost
declined by a more moderate 1.7% in Q4 compared to the 2.1% fall in Q3, as the higher cost
of petrol more than offset the larger drop in car prices amid weaker Certificate of
Entitlement (COE) premiums. An even sharper correction in COE premiums led to a steeper
1.8% decline in the cost of private road transport in January.
Looking ahead, external sources of inflation should remain generally muted, given ample
supply buffers in the major commodity markets and weak global demand conditions.
Notably, global oil prices have fallen significantly since mid-October, and are expected to
average lower for the whole of 2016 compared to last year. On the domestic front, wages
are expected to continue to increase, although at a more moderate pace than last year. The
pass-through of wage costs to consumer prices may also be tempered by the subdued
economic growth environment. Car prices and housing rentals will continue to dampen
overall inflationary pressures, given the expected increase in the supply of COEs and newly-
completed housing units, respectively.
The 2016 CPI-All Items inflation forecast has been revised down to −1.0–0.0% from
−0.5–0.5%, while the MAS Core Inflation forecast remains unchanged at 0.5–1.5%. The
revision in the forecast range for headline inflation took into account the significant step-
down in global oil prices in recent months and the larger-than-expected decline in COE
premiums.11 The forecast for MAS Core Inflation remains unchanged, as it incorporates a
8 For example, NTUC introduced a “Big Value Bag” price promotion campaign from July to December 2015, which comprised
discounts on daily essentials, cooked food, health products and insurance plans.
9 Public transport fares were reduced by 1.9% from 27 December 2015. However, given that the fare reduction took place
towards the end of the month, the impact was only fully incorporated in January 2016.
10 Since January 2015, lower- to middle-income Singaporeans have been able to receive enhanced medication subsidies at
subsidised Specialist Outpatient Clinics (SOC) and polyclinics. Singaporeans who qualify for the Pioneer Generation Package
(PGP) are entitled to an additional 50% off the remaining cost of the subsidised medications. These factors had a dampening
effect on year-ago inflation between January 2015 and December 2015.
11 Car prices fell sharply at the start of the year as car COE premiums fell by about $2,500 (4%) on average over the first four
bidding exercises of 2016.

Monetary Authority of Singapore 16 Economic Policy Group
smaller weight of oil-related items12 and excludes private road transport costs. MAS Core
Inflation is expected to pick up gradually over the course of 2016 as the disinflationary
effects of oil, as well as budgetary13 and other one-off measures, dissipate.
12
The oil-related items in CPI-All Items inflation include electricity, liquefied petroleum gas & gas (for domestic use), as well as
fuels & lubricants (including petrol). Fuels & lubricants are a component of private road transport costs, and are thus excluded
from MAS Core Inflation. As a result, the weight of oil-related items is 5.0% in CPI-All Items inflation, but only 2.5% in MAS Core
Inflation.
13 The budgetary measures include medical subsidies under the Pioneer Generation Package, the reduction in the
concessionary foreign domestic worker (FDW) levy, the abolition of national examination fees for Singaporeans, and road tax
rebates.

Monetary Authority of Singapore 17 Economic Policy Group
D. Macroeconomic Policies
Monetary Policy: MAS reduced the rate of appreciation of the
S$NEER policy band slightly in October 2015
In October 2015, MAS reduced the slope of
the S$NEER policy band slightly, while
keeping it on a modest and gradual
appreciation path. There was no change to
the width of the policy band and the level at
which it was centred. This measured
adjustment to the policy stance was assessed
to be appropriate in view of the slightly
weaker-than-envisaged growth outlook.
Together with the policy easing in January
2015, the October policy move will be
supportive of economic growth into 2016,
while ensuring price stability over the medium term.
The Singapore economy is expected to grow at a modest pace in 2016. Prospects for
global economic growth are relatively muted. The modest pace of expansion in the G3
economies and slowdown in China’s growth momentum are likely to continue to pose
headwinds to the external-oriented sectors of the Singapore economy. In comparison,
domestic-oriented sectors such as healthcare and education should stay broadly resilient.
On balance, Singapore’s GDP growth is projected to come in at 1–3% in 2016, following the
2.0% growth registered in 2015.
MAS Core Inflation will pick up gradually over 2016. Imported inflation is expected to stay
generally benign amid weak global demand conditions and ample supply buffers. Oil prices,
in particular, have been volatile and are now expected to average lower in 2016 compared
to 2015. Domestically, the pass-through of underlying wage pressures to consumer prices
should be restrained given the modest growth environment. Nonetheless, the
disinflationary effects of oil, as well as budgetary and other one-off measures, will dissipate
over the course of 2016. MAS Core Inflation is thus expected to pick up gradually and
average 0.5–1.5% this year, compared to 0.5% in 2015. CPI-All Items inflation will remain
low, as car prices and housing rentals are dampened by the expected increase in the supply
of COEs and newly-completed housing units, respectively. In February 2016, MAS lowered
the full year forecast for CPI-All Items inflation to −1.0–0.0% from −0.5–0.5%, while keeping
the forecast range for MAS Core Inflation unchanged. This took into account the significant
step-down in global oil prices since mid-October and the larger-than-expected decline in
COE premiums at the start of the year.
MAS reduced slightly the appreciation path of
the S$NEER policy band in October 2015.
98
100
102
104
106
108
Apr Jul Oct Jan Apr Jul Oct Jan Apr Jul Oct Jan Apr Jul Oct
Ind
ex
(2–
5 A
pr
20
12 A
vera
ge
=10
0)
2012
Appreciation
Depreciation
indicates release of Monetary Policy Statement
2013 20152014

Monetary Authority of Singapore 18 Economic Policy Group
Fiscal Policy: The FY2015 Budget focused on laying the foundations for future growth and strengthening social security
The FY2014 Budget outcome was a smaller deficit of $0.1 billion (0.0% of GDP), compared
to the $1.2 billion shortfall projected earlier. This was mainly due to higher-than-expected
revenue from motor vehicle taxes, vehicle quota premiums and corporate income tax,
which more than offset a slightly larger expenditure outturn on manpower.
Budget 2015 was centred on building Singapore’s future in four major areas. First, it
focused on developing human capital. Details of the SkillsFuture initiative were unveiled,
encompassing credits for work skills-related courses, awards to develop mastery in
specialist skills in identified growth clusters, training support for mid-career workers, and
stronger industry collaboration, among other measures. The wide range of measures would
help Singaporeans develop deep skills and expertise, with the government playing the role
of an active enabler.
Second, the Budget aimed to entrench the impact of past restructuring initiatives by
expanding on previous measures to boost innovation and internationalisation of local
firms. Financial support to encourage businesses to innovate and venture abroad was
increased. Budget 2015 also introduced concessionary tax rates for internationalising firms,
and piloted a new risk-sharing scheme to provide young and fast-growing companies with
alternative financing options. To give businesses more time to adjust to rising costs as they
restructure, the Transition Support Package, which was due to lapse in 2015, would instead
be phased out gradually—the Wage Credit Scheme and Corporate Income Tax Rebate were
extended, although the Productivity and Innovation Credit Bonus was allowed to expire.
There was also a deferment in the previously announced foreign worker levy increases, to
help firms gradually adapt to a permanently tight labour market.
Third, major infrastructural investments were committed to meet Singapore’s future
economic and social needs. These included the development of Changi Airport’s new
terminal T5, improvements in housing estates and the public transport system, as well as
the expansion in the capacity of hospitals and nursing homes.
Fourth, Budget 2015 made further strides in strengthening social security for lower- and
middle-income Singaporeans. Building on existing measures in our social security
framework, such as Workfare and enhanced medical subsidies for the elderly, this Budget
introduced the Silver Support Scheme, which provides an income supplement for the
bottom 20–30% of Singaporeans aged 65 and above based on their lifetime income, extent
of family support, and housing type. The Budget also aimed to enhance CPF savings by
raising the salary ceiling to benefit middle-income workers, and increasing the CPF
contribution rates as well as interest rates earned on CPF balances for Singaporeans aged
55 and above.
In order to meet increased government spending over the medium term, Budget 2015
introduced two measures to strengthen the revenue base. The first was the proposal to
Monetary Authority of Singapore 19 Economic Policy Group
allow the government to spend up to 50% of the expected long-term real returns on its net
assets managed by Temasek, on top of that by MAS and GIC. Second, personal income tax
rates were raised by 1–2% points for the top 5% of income earners. This also had the effect
of making the tax regime more progressive and thus more equitable.
For FY2015, the government has projected an overall budget deficit of $6.7 billion (1.7%
of GDP). This includes special transfers, top-ups to trust and endowment funds, and
revenue from net investment returns. The basic balance, which includes special transfers
only (excluding top-ups to endowment and trust funds), is projected to record a deficit of
$9.6 billion (2.4% of GDP).

Monetary Authority of Singapore 20 Economic Policy Group
Summary of Fiscal Position
FY 2013 FY 2014 Revised FY 2015 Budgeted
$billion % of GDP $billion % of GDP $billion % of GDP
Operating Revenue 57.0 14.9 61.3 15.7 64.3 16.0
Total Expenditure 51.7 13.5 57.2 14.6 68.2 17.0
Operating
Expenditure 39.7 10.4 43.3 11.1 48.7 12.1
Development
Expenditure 12.0 3.1 13.9 3.5 19.5 4.8
Primary
Surplus/Deficit (-) 5.3 1.4 4.2 1.1 (3.9) (1.0)
Less: Special Transfers
Excluding Top-ups to
Endowment and Trust
Funds
3.0 0.8 4.3 1.1 5.7 1.4
Basic
Surplus/Deficit (-) 2.3 0.6 (0.2) (0.0) (9.6) (2.4)
Less: Top-ups to
Endowment and Trust
Funds
5.6 1.5 8.5 2.2 6.0 1.5
Add: NIR Contribution 8.3 2.2 8.6 2.2 8.9 2.2
Budget
Surplus/Deficit (-) 5.0 1.3 (0.1) (0.0) (6.7) (1.7)
Note: Figures may not tally due to rounding.
Source: Ministry of Finance
____________________________
Note: Labour market statistics were obtained from the Ministry of Manpower, while trade and index of industrial production
(IIP) data were provided by IE Singapore and EDB respectively. All other data in this document were obtained from the
Building and Construction Authority, Department of Statistics, or Ministry of Trade and Industry, unless otherwise stated.
Monetary Authority of Singapore 21 Economic Policy Group
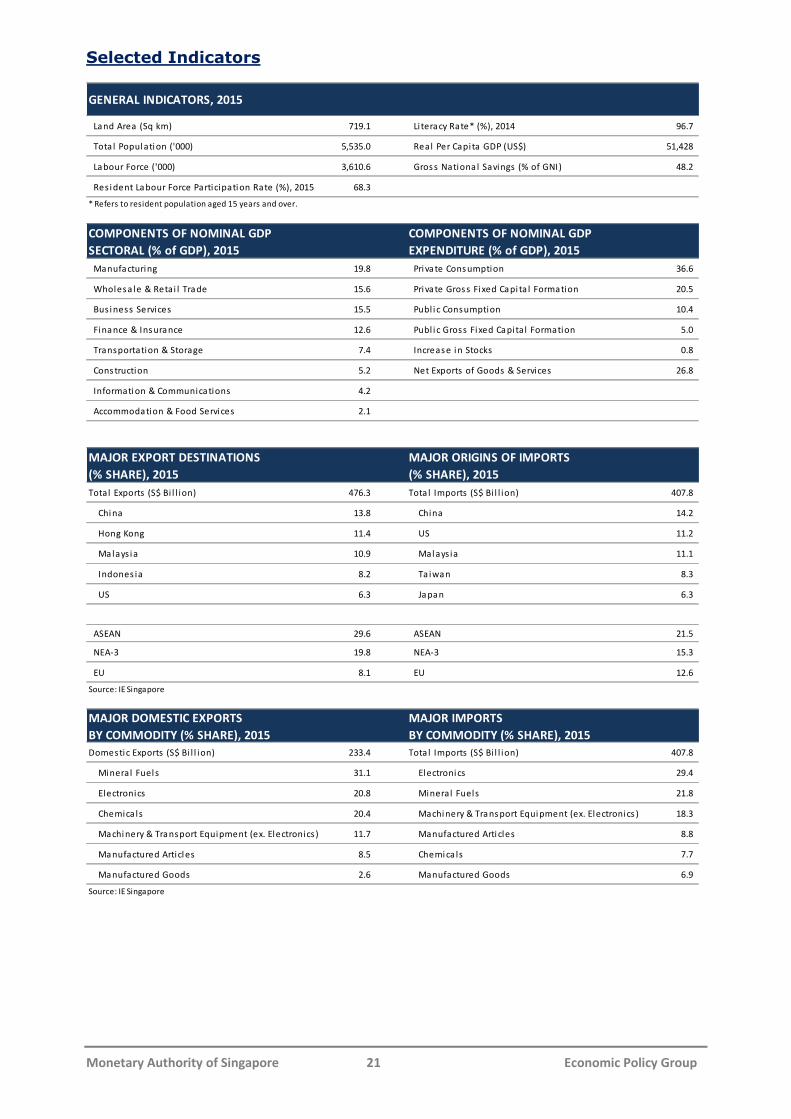
Selected Indicators
Land Area (Sq km) 719.1 Li teracy Rate* (%), 2014 96.7
Tota l Popul ati on ('000) 5,535.0 Real Per Capita GDP (US$) 51,428
Labour Force ('000) 3,610.6 Gros s Nationa l Savings (% of GNI) 48.2
Res i dent Labour Force Participati on Rate (%), 2015 68.3
* Refers to resident population aged 15 years and over.
COMPONENTS OF NOMINAL GDP
SECTORAL (% of GDP), 2015
COMPONENTS OF NOMINAL GDP
EXPENDITURE (% of GDP), 2015
Manufacturing 19.8 Pri vate Cons umption 36.6
Wholesa le & Retai l Trade 15.6 Pri vate Gros s Fixed Capi ta l Formation 20.5
Bus i ness Services 15.5 Publ i c Consumption 10.4
Fi nance & Ins urance 12.6 Publ i c Gross Fi xed Capital Formation 5.0
Transportation & Storage 7.4 Increas e i n Stocks 0.8
Cons truction 5.2 Net Exports of Goods & Services 26.8
Informati on & Communications 4.2
Accommodation & Food Services 2.1
MAJOR EXPORT DESTINATIONS
(% SHARE), 2015
MAJOR ORIGINS OF IMPORTS
(% SHARE), 2015
Total Exports (S$ Bi l l ion) 476.3 Tota l Imports (S$ Bi l l ion) 407.8
Chi na 13.8 China 14.2
Hong Kong 11.4 US 11.2
Malays i a 10.9 Mal ays ia 11.1
Indones ia 8.2 Ta iwan 8.3
US 6.3 Japan 6.3
ASEAN 29.6 ASEAN 21.5
NEA-3 19.8 NEA-3 15.3
EU 8.1 EU 12.6
Source: IE Singapore
MAJOR DOMESTIC EXPORTS
BY COMMODITY (% SHARE), 2015
MAJOR IMPORTS
BY COMMODITY (% SHARE), 2015
Domestic Exports (S$ Bi l l ion) 233.4 Tota l Imports (S$ Bi l l ion) 407.8
Mineral Fuel s 31.1 El ectroni cs 29.4
Electronics 20.8 Mineral Fuels 21.8
Chemica ls 20.4 Machi nery & Trans port Equi pment (ex. Electronics ) 18.3
Machi nery & Transport Equipment (ex. Electronics) 11.7 Manufactured Arti cles 8.8
Manufactured Articl es 8.5 Chemi ca ls 7.7
Manufactured Goods 2.6 Manufactured Goods 6.9
Source: IE Singapore
GENERAL INDICATORS, 2015

Monetary Authority of Singapore 22 Economic Policy Group
OVERALL ECONOMY 2014 2015 2014 Q3 2014 Q4 2015 Q1 2015 Q2 2015 Q3 2015 Q4 Dec-15 Jan-16
GDP at current prices (S$ bi l) 388.2 402.5 96.7 101.0 100.1 100.3 100.1 102.0 na na
GDP (US$ bil ) 306.4 292.7 77.3 78.0 73.8 74.6 71.9 72.5 na na
Real GDP Growth (YOY % change) 3.3 2.0 3.1 2.8 2.7 1.7 1.8 1.8 na na
Real GDP Growth (QOQ SAAR % change) na na 2.0 6.9 0.2 -1.6 2.3 6.2 na na
By Sector (YOY % change):
Manufacturing 1/
2.7 -5.2 1.7 -1.2 -2.9 -5.2 -6.0 -6.7 -11.9 -0.5
Electronics 1/
-0.2 -6.8 0.0 -2.8 -4.7 -3.8 -6.3 -12.2 -13.7 1.7
Non-electronics 1/
4.2 -4.2 2.6 -0.2 -4.1 -4.5 -5.4 -3.0 -10.9 -1.6
Finance & Insurance 9.1 5.3 10.5 12.5 8.1 6.6 4.6 2.4 na na
Business Services 1.6 1.5 0.4 1.6 2.4 0.6 2.0 0.8 na na
Construction 3.5 2.5 1.7 0.2 -1.6 3.6 3.0 4.9 na na
Transportation & Storage 2.6 0.0 1.0 0.4 1.3 -1.0 0.4 -0.9 na na
Information & Communications 7.0 4.2 8.6 8.6 5.2 5.8 2.5 3.3 na na
Wholesale & Retai l Trade 2.1 6.1 3.8 1.9 5.7 5.5 6.4 6.8 na na
Accommodation & Food Services 1.7 0.2 0.9 1.7 -0.3 -1.1 1.1 0.9 na na
By Expenditure Component (YOY % change):
Consumption 1.7 4.9 0.9 2.9 3.5 3.8 6.1 6.3 na na
Private 2.2 4.5 1.3 3.1 3.5 4.5 4.6 5.5 na na
Public -0.1 6.6 -0.7 2.2 3.7 1.0 12.2 9.4 na na
Gross Fixed Capital Formation -2.6 -1.0 -6.3 -1.1 -4.2 2.3 -1.6 -0.7 na na
Private -5.2 -2.2 -9.3 -2.4 -3.5 0.4 -1.8 -3.9 na na
Public 10.4 3.8 9.3 4.9 -6.6 10.6 -0.7 13.8 na na
External Demand 4.3 2.5 2.0 3.8 4.1 0.4 2.7 2.8 na na
TRADE
Total Exports, fob (YOY % change) 0.8 -7.2 -1.6 -4.2 -6.0 -9.0 -8.0 -5.7 -6.4 -15.1
Non-Oi l Domestic Exports -1.5 -0.1 0.9 -0.1 4.0 1.5 -2.2 -3.5 -7.2 -9.9
Re-Exports 2.5 -0.9 -2.4 -1.0 1.1 -5.6 -0.5 1.4 0.0 -12.8
Total Imports, ci f (YOY % change) -0.6 -12.1 -5.7 -6.0 -16.1 -13.0 -9.1 -9.9 -10.6 -13.6
WAGE-PRICE INDICATORS
Unemployment Rate (SA,%) 2.0 1.9 1.9 1.9 1.8 2.0 2.0 1.9 na na
Average Nominal Wages (S$ per month) 4,727 4,892 4,314 5,040 5,259 4,611 4,493 5,205 na na
Consumer Price Index Inflation (YOY % change) 1.0 -0.5 1.0 0.0 -0.3 -0.4 -0.6 -0.7 -0.6 -0.6
MAS Core Inflation (YOY % change) 1.9 0.5 2.0 1.6 1.1 0.2 0.4 0.2 0.3 0.4
FINANCIAL INDICATORS
S$ Exchange Rate Against: (end-period)
US Dollar 1.3213 1.4139 1.2728 1.3213 1.3765 1.3474 1.4253 1.4139 1.4139 1.4277
100 Japanese Yen 1.1060 1.1743 1.1643 1.1060 1.1447 1.1014 1.1884 1.1743 1.1743 1.1853
Euro 1.6072 1.5457 1.6157 1.6072 1.4876 1.5080 1.6045 1.5457 1.5457 1.5575
Interest Rates (end-period, % p.a.)
3-month Fixed Deposit Rate 0.14 0.18 0.14 0.14 0.17 0.16 0.18 0.18 0.18 0.19
3-month S$ SIBOR 2/
0.46 1.19 0.41 0.46 1.01 0.82 1.14 1.19 1.19 1.25
Prime Lending Rate 5.35 5.35 5.35 5.35 5.35 5.35 5.35 5.35 5.35 5.35
Money Supply (end-period)
Broad Money, M2 (YOY % change) 3.3 1.5 1.9 3.3 4.1 3.6 3.2 1.5 1.5 1.1
Straits Times Index (end-period) 3/
3,365.2 2,882.7 3,276.7 3,365.2 3,447.0 3,317.3 2,790.9 2,882.7 2,882.7 2,629.1
YOY % change 6.2 -14.3 3.4 6.2 8.1 1.9 -14.8 -14.3 -14.3 -22.5
GOVERNMENT BUDGET 4/
Operating Revenue (S$ mil ) 59,995 63,562 16,595 14,034 14,340 16,857 17,888 14,477 na na
Total Expenditure (S$ mil) 54,805 61,155 12,950 14,214 18,565 12,127 14,352 16,111 na na
Operating Expenditure 41,758 45,359 9,702 11,326 13,960 7,988 11,123 12,289 na na
Development Expenditure 13,047 15,797 3,248 2,888 4,605 4,140 3,230 3,822 na na
Primary Surplus/Deficit (S$ mil) 5,190 2,407 3,645 -179 -4,224 4,730 3,535 -1,634 na na
% of GDP 1.3 0.6 3.8 -0.2 -4.2 4.7 3.5 -1.6 na na
BALANCE OF PAYMENTS
Current Account Balance (% of GDP) 17.4 19.7 21.4 18.4 21.2 16.6 20.6 20.2 na na
Goods Balance 26.0 28.2 28.8 26.5 30.8 26.9 26.5 28.6 na na
Services Balance -1.5 -1.3 -1.0 -1.0 -1.5 -2.4 -0.7 -0.7 na na
Primary Income Balance -4.9 -4.7 -4.2 -4.9 -5.6 -5.4 -2.7 -5.2 na na
Secondary Income Balance -2.2 -2.5 -2.2 -2.2 -2.5 -2.4 -2.5 -2.5 na na
Capital & Fin Account Balance (% of GDP) -15.1 -19.1 -19.1 -18.1 -24.3 -13.3 -20.5 -18.5 na na
Direct Investment 9.6 10.2 6.3 11.5 12.1 6.8 13.3 8.5 na na
Portfolio Investment -17.4 -18.7 -5.1 -0.1 -17.5 -10.4 -19.5 -27.3 na na
Financial Derivatives 3.9 6.8 3.4 5.7 4.6 7.4 8.3 6.9 na na
Other Investment -11.2 -17.4 -23.7 -35.1 -23.5 -17.1 -22.6 -6.5 na na
Overall Balance (% of GDP) 2.2 0.4 3.5 0.1 -1.3 2.7 0.5 -0.3 na na
Official Foreign Reserves (US$ mil) 5/
256,860 247,747 266,142 256,860 248,404 253,280 251,640 247,747 247,747 244,859
Months of Imports 8.4 10.0 8.5 8.4 8.6 9.3 9.7 10.0 10.0 10.1
Source:1/ Index of Industrial Production from EDB.2/ ABS Benchmarks Administration Co Pte Ltd3/ Straits Times Index from SGX. 4/ Ministry of Finance
5/ MAS
na: Not a vai l able