recent developments in lc/ms analysis of foodlc/ms analysis … · recent developments in lc/ms...
TRANSCRIPT

Recent Developments in LC/MS Analysis of FoodLC/MS Analysis of Food
Contaminants
(Agilent 1290 Infinity uHPLC, Agilent 6230 TOF, 6460/6490 QQQ and 6540 Q-
TOF.)
Dr Peter StoneAgilent Technologies IncAgilent Technologies Inc,
Santa Clara, CA.

Fast Target Screening of Analytes Using high sensitivity 6460 Triple Quadrupole with 1290 uHPLC
Subfemtogram, on-column sensitivity
Five Orders of Linearity Five Orders of Linearity 3,000 m/z mass range Fast Pos/Neg switching, 30 millisec New Method Development Tool – MH Optimizer “Dynamic Multiple Reaction Monitoring” for MRMs scheduled by peak
retention times instead of time segmentsg

MassHunter “Dynamic MRM”
Many applications require screening of 100 – 1000 compounds in one MRM method !• Food, environmental and Forensic analysis (e.g. Doping Control)• Subsequent quantitation of positives in dedicated methods
WITHOUT Dynamic MRM• Need to manually set up multiple time segments to maximize dwell time• Tedious and fragile for chromatographic time shifts• Tedious and fragile for chromatographic time shifts
WITH Dynamic MRM• Automatic setup of overlapping time segments without user intervention• Automatic setup of overlapping time segments without user intervention• Even less MRMs per time results in even longer dwell time / sensitivity• Unaffected by chromatographic time shifts

Segmentation with NO Dynamic MRM functionality300 Component Standard300 Component Standard
100pg on-column
Page 4

6460 QqQ Method Conditions

NO Seqmentation with Dynamic MRMs
EIC Overlay of 250 pesticide Mix spiked into Food matrix(500 total transitions, on‐column amount 2.5pg) using dynamic MRMs.

3x101.725 1 1
1.31.325
1.351.375
1.41.425
1.451.475
1.51.525
1.551.575
1.61.625
1.651.675
1.71 1
Rt
0.8750.9
0.9250.95
0.9751
1.0251.05
1.0751.1
1.1251.15
1.1751.2
1.2251.25
1.275
x3 x4 x4 x3 x4 x2 x1# Concurrent dMRM =
Cycle time
0.450.475
0.50.525
0.550.575
0.60.625
0.650.675
0.70.725
0.750.775
0.80.825
0.85
8.366
0.050.075
0.10.125
0.150.175
0.20.225
0.250.275
0.30.325
0.350.375
0.40.425
0.45
Counts vs. Acquisition Time (min)0.5 1 1.5 2 2.5 3 3.5 4 4.5 5 5.5 6 6.5 7 7.5 8 8.5 9 9.5 10 10.5 11 11.5 12 12.5 13 13.5 14 14.5 15 15.5 16 16.5
Selection of 24 pesticide transitions from previous slideTo illustrate efficiency of cycle times using dynamic MRMs.

3x101.725 1 1
1.31.325
1.351.375
1.41.425
1.451.475
1.51.525
1.551.575
1.61.625
1.651.675
1.71 1
0.8750.9
0.9250.95
0.9751
1.0251.05
1.0751.1
1.1251.15
1.1751.2
1.2251.25
1.275
x3 x4 x4 x3 x4 x2 x1# Concurrent dMRM =
Cycle time
0.450.475
0.50.525
0.550.575
0.60.625
0.650.675
0.70.725
0.750.775
0.80.825
0.85
8.366
0.050.075
0.10.125
0.150.175
0.20.225
0.250.275
0.30.325
0.350.375
0.40.425
0.45
Counts vs. Acquisition Time (min)0.5 1 1.5 2 2.5 3 3.5 4 4.5 5 5.5 6 6.5 7 7.5 8 8.5 9 9.5 10 10.5 11 11.5 12 12.5 13 13.5 14 14.5 15 15.5 16 16.5
Selection of 24 pesticide transitions from previous slideTo illustrate efficiency of cycle times using dynamic MRMs.

8 Minute Dynamic MRM Analysis 6460 QqQ- 250 Pesticide Screen.250 Pesticide Screen.
2x10
8.4
8.6
8.8
9
9.2
9.4
9.6 1 1
500ppt, dynamic MRMRetention Time Window = 12 sec
6.4
6.6
6.8
7
7.2
7.4
7.6
7.8
8
8.2
Peak widths ~ 1 second
4.4
4.6
4.8
5
5.2
5.4
5.6
5.8
6
6.2
Zorbax Eclipse Plus C182.1 x 100mm (1.8μm)
2 4
2.6
2.8
3
3.2
3.4
3.6
3.8
4
4.2
4.4 ( μ )
0 4
0.6
0.8
1
1.2
1.4
1.6
1.8
2
2.2
2.4
3.193427
0.4
Counts vs. Acquisition Time (min)0.2 0.4 0.6 0.8 1 1.2 1.4 1.6 1.8 2 2.2 2.4 2.6 2.8 3 3.2 3.4 3.6 3.8 4 4.2 4.4 4.6 4.8 5 5.2 5.4 5.6 5.8 6 6.2 6.4 6.6 6.8 7 7.2 7.4

Target Screening of PPCPs in Aquatic Food Matrices LC/MS/MS QQQ
Pharmaceuticals and Personal Care Products (PPCPs) refer, in general, to any product used by individuals for personal health or cosmetic reasons or used by agribusiness to enhance growth or health of livestockagribusiness to enhance growth or health of livestock.
PPCPs comprise a diverse collection of thousands of chemical substances, including prescription and over-the-counter therapeutic drugs, veterinary drugs, fragrances, and cosmetics.and cosmetics.

EPA 1694 - Identification of PPCPs in Water
IbuprofenIsochlortetracycline (ICTC)LincomycinLomefloxacinMetforminMiconazole
AcetaminophenAlbuterolAmpicillinAnhydrochlortetracycline (ACTC)Anhydrotetracycline (ATC)AzithromycinAntibiotics
Pain KillersMinocyclineNaproxenNorfloxacinNorgestimateOfloxacinOrmetoprimOxacillinOxolinic acid
AzithromycinCaffeineCarbadoxCarbamazepineCefotaximeChlortetracycline (CTC)CimetidineCiprofloxacinClarithromycin
Antibiotics
Oxytetracycline (OTC)Penicillin VPenicillin GRanitidineRoxithromycinSarafloxacinSulfachloropyridazineSulfadiazine
ClarithromycinClinafloxacinCloxacillinCodeineCotinineDehydronifedipineDemeclocyclineDigoxigeninDigoxin
SulfadimethoxineSulfamerazineSulfamethazineSulfamethizoleSulfamethoxazoleSulfanilamideSulfathiazoleTetracycline (TC)
DigoxinDiltiazem1,7-DimethylxanthineDiphenhydramineDoxycyclineEnrofloxacin4-Epianhydrochlortetracycline(EACTC)4-Epianhydrotetracycline (EATC)
Birth Control SteroidsThiabendazoleTriclocarbanTriclosanTrimethoprimTylosinVirginiamycinWarfarinOther standards
p y y ( )4-Epichlortetracycline (ECTC)4-Epioxytetracycline (EOTC)4-Epitetracycline (ETC)ErythromycinErythromycin anhydrateFlumequineFluoxetineGemfibrozil
Anti-Depressants

Where are PPCPs found in the environment?
PPCPs in the environment are frequently found in aquatic environments because PPCPs dissolve easily and don't evaporate at normal temperature and pressure Practices suchevaporate at normal temperature and pressure. Practices such as the use of sewage sludge ("biosolids") and reclaimed water for irrigation bring PPCPs into contact with the soil (landfill also).

List of PPCP Target Analytes (EPA 1694, Positive Analysis)Compound Name Precursor Ion Product Ion Fragmentor (V) Collision Energy (V) RT RT Window Ion Polarityp g ( ) gy ( ) y
1,7-Dimethylxanthine 181.0 124.0 90 15 0.658 0.50 Positive4-Epianhydrotetracycline 427.0 410.0 90 15 3.473 0.50 Positive
4-Epichlortetracycline 479.0 462.0 134 17 2.416 0.50 Positive4-Epitetracycline 445.0 410.0 110 15 1.777 0.50 PositiveAcetaminophen 152.0 110.0 90 15 0.656 0.50 Positive
Albuterol 240.0 148.0 90 15 0.489 0.50 PositiveAmphetamine 136 1 91 0 70 13 0 880 0 50 PositiveAmphetamine 136.1 91.0 70 13 0.880 0.50 Positive
Anhydrotetracycline 427.0 410.0 90 15 3.473 0.50 PositiveAtenolol 267.2 145.0 134 21 0.502 0.50 Positive
Azithromycin 749.5 591.4 130 30 3.254 0.50 PositiveCaffeine 195.0 138.0 110 15 1.072 0.50 PositiveCarbadox 263.0 130.0 80 35 3.097 0.50 Positive
Chlorotetracycline 479.0 462.0 110 15 2.416 0.50 PositiveyCimetidine 253.0 159.0 100 10 0.489 0.50 Positive
Clarithromycin 748.5 158.0 110 25 4.384 0.50 PositiveClonidine 230.0 44.0 150 25 0.764 0.50 Positive
Cloxacillin degradate 469.0 160.0 70 15 4.625 0.50 PositiveCloxacillin 436.0 160.0 90 15 4.557 0.50 PositiveCodeine 300.0 215.0 130 25 0.709 0.50 PositiveCotinine 177 0 80 0 90 25 0 420 0 50 PositiveCotinine 177.0 80.0 90 25 0.420 0.50 Positive
Dehydronifedipine 345.0 284.0 130 25 4.662 0.50 PositiveDemeclocycline 465.0 448.0 130 15 2.394 0.50 Positive
Dextromethorphan 272.2 170.9 152 41 3.365 0.50 PositiveDiazepam 285.1 193.0 162 33 4.818 0.50 Positive
Digoxigenin 391.0 355.0 90 15 3.036 0.50 PositiveDiltiazem 415.0 178.0 130 25 3.702 0.50 Positive
Diphenhydramine 256.0 167.0 70 15 3.463 0.50 PositiveDoxycycline 445.0 428.0 110 15 3.008 0.50 PositiveEnrofloxacin 360.0 316.0 130 15 2.237 0.50 Positive
Erythromycin Anhydrate 716.5 158.0 90 25 4.201 0.50 PositiveErythromycin 734.5 158.0 90 35 3.854 0.50 Positive
Erythromycin-Labeled 736.5 578.0 90 15 3.851 0.50 Positive
33/65 PPCP Analytes (Only quantifier ion transitions shown)

uHPLC - PPCPs from EPA 1694 (Positive Polarity)
3x10
8
8.2
8.4
8.6 1 1
3 min analysis
6
6.2
6.46.6
6.8
7
7.2
7.4
7.67.8 3 min analysis,
112 transitions65 compounds (Fish extract) Zorbax Eclipse + C18
44.2
4.4
4.6
4.8
5
5.25.4
5.6
5.8(Fish extract) Zorbax Eclipse + C18
2.1x50mm, 1.8um
Min dwell=4.3ms
2
2.2
2.4
2.6
2.83
3.2
3.4
3.6
3.8
0.2
0.40.6
0.8
1
1.2
1.4
1.61.8
2
1.550
Counts vs. Acquisition Time (min)0.05 0.1 0.15 0.2 0.25 0.3 0.35 0.4 0.45 0.5 0.55 0.6 0.65 0.7 0.75 0.8 0.85 0.9 0.95 1 1.05 1.1 1.15 1.2 1.25 1.3 1.35 1.4 1.45 1.5 1.55 1.6 1.65 1.7 1.75 1.8
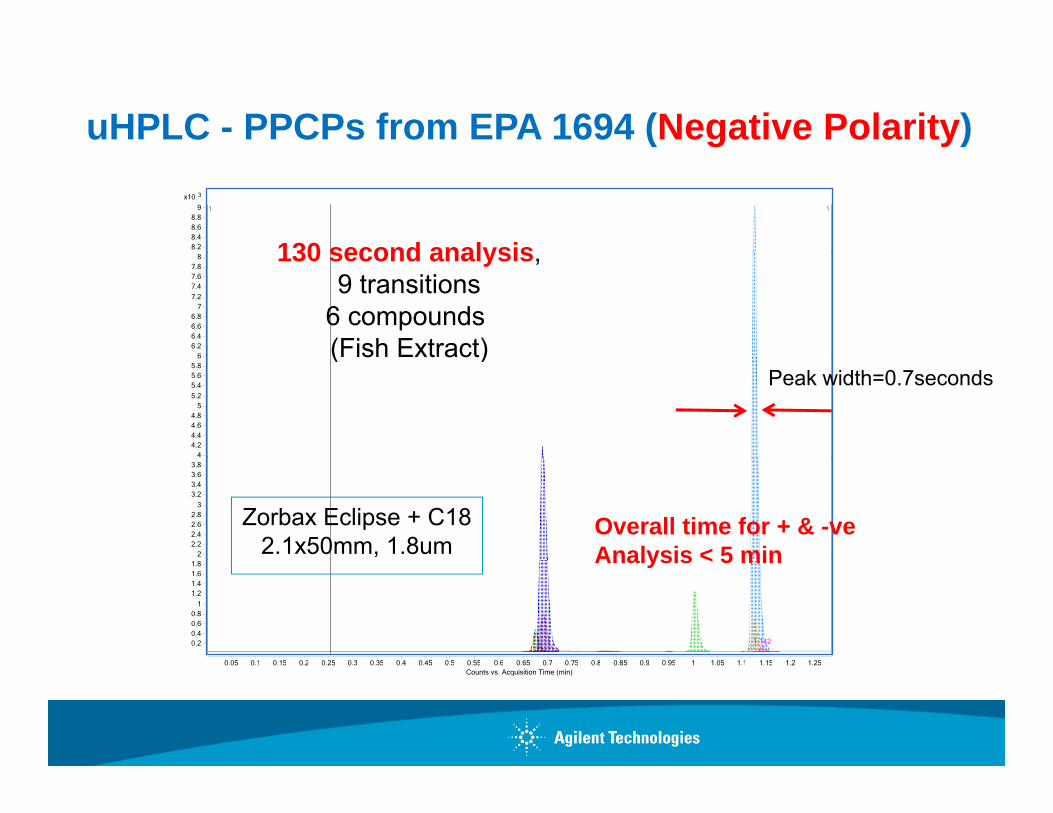
uHPLC - PPCPs from EPA 1694 (Negative Polarity)3x10
8.28.48.68.8
9 1 1
130 second analysis
66.26.46.66.8
77.2
7.47.67.8
8 130 second analysis,9 transitions
6 compounds (Fish Extract)
44.24.44.64.8
55.2
5.45.65.8
6 (Fish Extract)Peak width=0.7seconds
22.22.42.62.8
3
3.23.43.63.8
Zorbax Eclipse + C182.1x50mm, 1.8um
Overall time for + & -ve Analysis < 5 min
0.20.40.60.8
1
1.21.41.61.8
1.142
0 05 0 1 0 15 0 2 0 25 0 3 0 35 0 4 0 45 0 5 0 55 0 6 0 65 0 7 0 75 0 8 0 85 0 9 0 95 1 1 05 1 1 1 15 1 2 1 25
Analysis < 5 min
Counts vs. Acquisition Time (min)0.05 0.1 0.15 0.2 0.25 0.3 0.35 0.4 0.45 0.5 0.55 0.6 0.65 0.7 0.75 0.8 0.85 0.9 0.95 1 1.05 1.1 1.15 1.2 1.25

Chromatographic Precision (1290/6460, dynamic MRM)
Albuterol 100fg on column Fish Extract Spike
N= 5 (@100fg), %RSD (area) = 5.436907
Albuterol, 100fg on-column Fish Extract Spike
240.0 -> 148.0 , 240.0 -> 166.0
N= 35 (all Cal levels), %RSD (RT) = 0.5182964
ses
Cou
nts 2x10
11.05
1.1
1.151.2
Ratio=17.4
Res
pon
0 75
0.8
0.850.9
0.95
1
R2=0.995154120.5
0.55
0.60.65
0.70.75
0.3 0.4 0.5 0.6 0.7
0.35
0.4
0.45
Quant & Qual transitionsQuant & Qual transitions20% outlier ratio boundary

Chromatographic Precision (1290/6460, dynamic MRM)
A h t i 100f l Fi h E t t ik
N= 5 (@100fg) %RSD (area) = 6 902997
Amphetamine, 100fg on-column Fish Extract spike
N= 5 (@100fg), %RSD (area) = 6.902997
N= 35 (all Cal levels), %RSD (RT) = 0.50386361 1x10
7 8
7.9
8
8.1
8.2
8.3
8.4
8.5
8.6
8.7
8.8
8.9
9
Cou
nts
Res
pons
es
6.4
6.5
6.6
6.7
6.8
6.9
7
7.1
7.2
7.3
7.4
7.5
7.6
7.7
7.8
R2=0.998619564.9
5
5.1
5.2
5.3
5.4
5.5
5.6
5.7
5.8
5.9
6
6.1
6.2
6.3
4.2
4.3
4.4
4.5
4.6
4.7
4.8
Counts vs. Acquisition Time (sec)35 36 37 38 39 40 41 42 43 44 45 46 47 48 49 50 51 52 53 54 55 56 57 58 59 60 61 62 63 64 65 66 67 68 69 70
Quant & Qual transitions20% outlier ratio boundary20% outlier ratio boundary

NO Seqmentation with Dynamic MRMs
EIC Overlay of 250 pesticide Mix spiked into Food matrix(500 total transitions, on‐column amount 2.5pg) using dynamic MRMs.

# of concurrent MRMs
Dynamic Dwell Times (ms)

Agilent >600 Compound Dynamic MRM Database
September, 2009Page 20 LC/MS Pesticide Analysis

Analyses of PFCs with Agilent Jetstream ESIAgilent Jetstream ESI
6460 QQQ
Peter JW StonePeter JW StoneAgilent Technologies Inc.Santa Clara, CaliforniaSanta Clara, California

Compounds Analyzed in the Study
Target compound Precursor ion (m/z)
Product ion (m/z)
perfluoro-1-butanesulfonate (PFBS) 298.8 80.3perfluoro-n-hexanoic acid (PFHxA) 312.8 268.9perfluoro-n-heptanoic acid (PFHpA) 362.9 318.9perfluoro-1-hexanesulfonate (PFHxS) 398 8 79 9perfluoro 1 hexanesulfonate (PFHxS) 398.8 79.9perfluoro-n-octanoic acid (PFOA) 412.8 368.9perfluoro-n-nonanoic acid (PFNA) 462.8 418.9perfluoro-1-octanesulfonate (PFOS) 498.8 79.9perfluoro-n-decanoic acid (PFDA) 512.8 468.9perfluoro-n-undecanoic acid (PFUA) 562.8 518.9perfluoro-1-decanesulfonate (PFDS) 598.8 80perfluoro-n-dodecanoic acid (PFDoA) 612.9 568.9p ( )perfluoro-n-tridecanoic acid (PFTriA) 662.9 619perfluoro-n-tetradecanoic acid (PFTA) 712.8 669

Rapid Resolution HPLC Parameters
RRLC Configuration: Agilent 1200 Series Binary Pump SL (G1312B) , High Performance Well Plate Sampler SL Plus (G1367D) with Thermostat (G1330B) Thermostated Column Compartment SL with 10Port2Pos SL Plus (G1367D) with Thermostat (G1330B), Thermostated Column Compartment SL with 10Port2Pos (G1316B)
Column: Zorbax Eclipse Plus C18, 2.1 x 50mm (1.8um)
Column temperature: 55°CColumn temperature: 55°CInjection volume: 1 uL (test 1A- LOD); 0.2-1ul (test 1B - MDL)Autosampler temp: 4°CNeedle wash: flushport (100% Methanol), 5 secondsMobile phase: A = 2mM NH4-Acetate in Water
B = 2mM NH4-Acetate in MeOHB 2mM NH4 Acetate in MeOHGradient flow rate: 0.5 mL/min (no split)Gradient: Time (min) %B
0 60.5 66 958 95

Agilent Jetstream QQQ MS Parameters
MS: Agilent 6460A Triple Quadrupole LC/MS/MS
QQQ MS ConditionsI M d ESI A il J S N iIon Mode ESI+Agilent Jet Stream, Negative
Source conditions:Capillary Voltage 2500 VCharging electrode 0 VDrying gas (nitrogen) 4 L/minDrying gas (nitrogen) 4 L/minDrying gas temperature 350 ºCNebulizer gas (nitrogen) 60 psiSheath Gas temperature 350 ºCSheath Gas flow 12 L/min
MRM acquisition:
Q1 and Q2 Resolution 0.7 amu [autotune]Delta EMV 0V

Dynamic MRM PFC TransitionsQ2- Frag
Quant ion Name Precursor Q1-Res ProductQRes
gVoltage CE RT RT Delta IonPolarity
PFBS 298.9 unit 80.0 unit 133 45 3.623 1 NegativePFDA (C13)2 514.9 unit 469.9 unit 102 5 5.542 1 Negative
PFDA 512.9 unit 469.0 unit 102 5 5.543 1 NegativePFDoA (C13)2 614.9 unit 570.0 unit 97 5 5.961 1 Negative
PFDoA 612.9 unit 569.0 unit 97 5 5.961 1 NegativegPFDS 598.9 unit 80.0 unit 205 94 5.752 1 NegativePFHpA 362.9 unit 319.0 unit 66 5 4.626 1 Negative
PFHxA (C13)2 314.9 unit 269.9 unit 66 5 4.141 1 NegativePFHxA 312.9 unit 268.9 unit 66 5 4.143 1 Negative
PFHxS (O18)2 402.9 unit 83.9 unit 174 49 4.671 1 NegativePFHxS 398.9 unit 80.0 unit 174 49 4.671 1 Negative
PFNA (C13)5 467.9 unit 423.0 unit 66 5 5.296 1 NegativePFNA 462.9 unit 418.9 unit 66 5 5.296 1 Negative
PFOA (C13)4 416.9 unit 371.9 unit 86 5 5.001 1 NegativePFOA 412.9 unit 368.9 unit 86 5 5.003 1 Negative
PFOS (C13)4 502.9 unit 80.0 unit 210 50 5.301 1 NegativePFOS 498.9 unit 80.0 unit 210 50 5.302 1 NegativePFTA 712.9 unit 669.0 unit 112 9 6.255 1 NegativePFTriA 662.9 unit 619.0 unit 102 9 6.117 1 Negative
PFUA (C13)2 564.9 unit 519.9 unit 92 5 5.764 1 NegativePFUA 562.9 unit 519.0 unit 92 5 5.762 1 Negative
Qual ion Name Precursor Q1-Res ProductQ2-Res Frag CE RT RT Delta IonPolarity
PFBS 298.9 unit 98.9 unit 133 29 3.623 1 NegativePFDoA 612.9 unit 169.0 unit 97 25 5.961 1 NegativePFHpA 362.9 unit 169.0 unit 66 13 4.626 1 NegativePFHxS 398.9 unit 99.0 unit 174 45 4.671 1 NegativePFNA 462.9 unit 169.0 unit 66 17 5.296 1 NegativePFOA 412.9 unit 169.0 unit 86 13 5.003 1 NegativePFOS 498 9 it 99 0 it 210 50 5 302 1 N tiPFOS 498.9 unit 99.0 unit 210 50 5.302 1 NegativePFUA 562.9 unit 169.0 unit 92 21 5.762 1 Negative

PFCs - Overlay of all transitions – Dynamic MRM
Spiked Kidney extract(1pg on-column)( pg )

LOD – PFBS – less than 10 fg on-column (5 fg on-column)
LOD
BLANK
LOD (fg on column) SNR 3:1
PFC-STD #14.6
PFC-STD #2 3 33.3
PFC-STD #3 7
Ave (n=3): 5

LOD – PFHxS – < 10 fg on-column (2.6 fg on-column)
LOD
BLANK
LOD (fg on column) SNR 3:1
PFC-STD #12.1
PFC-STD #2 2 62.6
PFC-STD #3 3.1
Ave (n=3): 2.6

LOD – PFOA – < 10 fg on-column (43.7 fg on-column) LOD
BLANK(fg on column) SNR 3:1 estimated
PFC-STD #155.6
PFC-STD #2 36 136.1
PFC-STD #3 39.5
Ave (n=3): 43.7
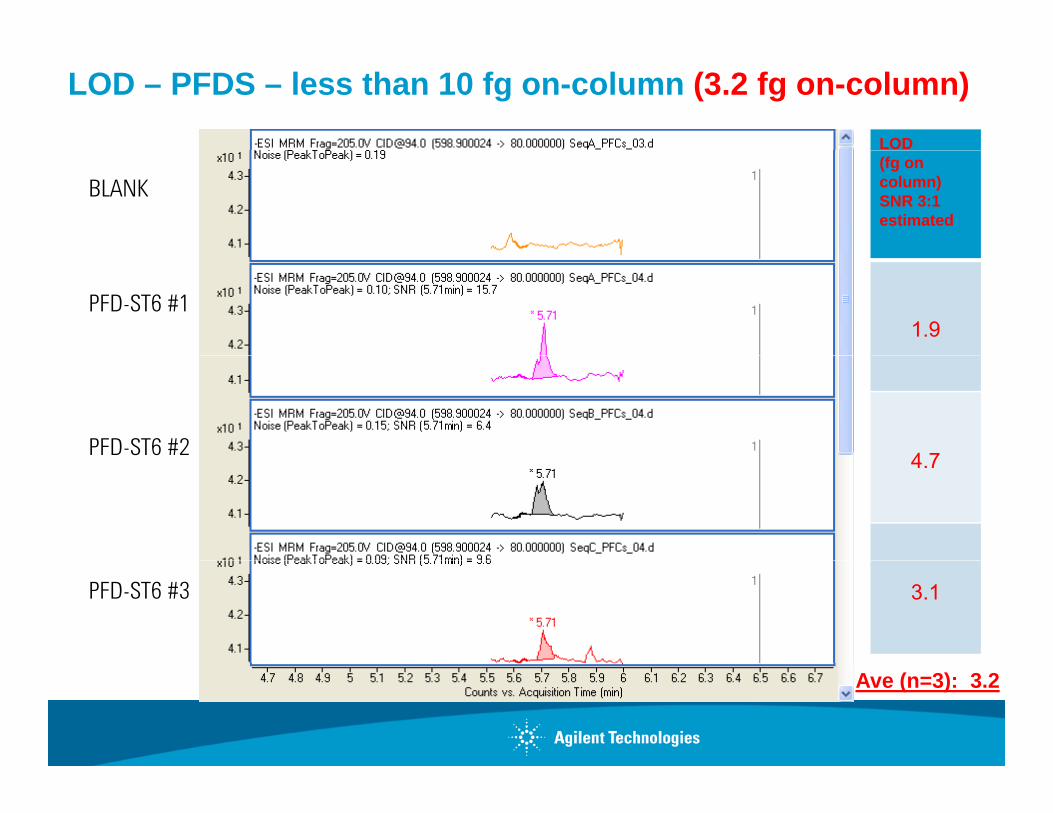
LOD – PFDS – less than 10 fg on-column (3.2 fg on-column) LOD
BLANK(fg on column) SNR 3:1 estimated
PFD-ST6 #11.9
PFD-ST6 #2 4 74.7
PFD-ST6 #3 3.1
Ave (n=3): 3.2

PFC Suite LODs – SummaryCompounds LODs (fg on column)Compounds LODs (fg on column)
SNR 3:1
PFBS 5.0
PFHxA 8.4
PFHpA 12.2
PFHxS 2.6
PFOA 43 7PFOA 43.7
PFNA 75.0
PFOS 5.7
36 3
The lowest concentration that all 13 compounds can be detected is at level of less than 75fg on column.
PFDA 36.3
PFUA 44.0
PFDS 3.2
PFDoA 55.9
PFTriA 74.2
PFTA 21.7

Overlay Chromatograms of Non-Optimised versus AJS-Optimized ResponsesAJS Optimized Responses

Calibration Curve for PFHxALinear Correlation = 0.99890661Linear Correlation 0.99890661
PFHxA - 5 Levels, 5 Levels Used, 15 Points, 15 Points Used, 0 QCson
ses 2x10
1 2
y = 1.2009 * x + 0.1780R^2 = 0.99890661
Rel
ativ
e R
espo
0.8
0.9
1
1.1
1.2
0.4
0.5
0.6
0.7
0
0.1
0.2
0.3
Relative Concentration-5 0 5 10 15 20 25 30 35 40 45 50 55 60 65 70 75 80 85 90 95 100 105
-0.1

Calibration Curve for PFHxSLinear Correlation = 0.99611386
PFHxS - 5 Levels, 5 Levels Used, 15 Points, 15 Points Used, 0 QCson
ses 2x10 y = 1.4423 * x + 0.0057
R^2 = 0.99611386
Linear Correlation 0.99611386
Rel
ativ
e R
espo
1
1.1
1.2
1.3
1.4
1.5
0.5
0.6
0.7
0.8
0.9
1
-0 1
0
0.1
0.2
0.3
0.4
Relative Concentration-5 0 5 10 15 20 25 30 35 40 45 50 55 60 65 70 75 80 85 90 95 100 105
0.1
Page 34

Calibration Curve for PFOALinear Correlation = 0.99957820
PFOA - 5 Levels, 5 Levels Used, 15 Points, 15 Points Used, 0 QCson
ses 2x10
1.4
y = 1.3472 * x + 0.0441R^2 = 0.99957820
Linear Correlation 0.99957820
Rel
ativ
e R
espo
0 9
1
1.1
1.2
1.3
0 4
0.5
0.6
0.7
0.8
0.9
0 1
0
0.1
0.2
0.3
0.4
Relative Concentration-5 0 5 10 15 20 25 30 35 40 45 50 55 60 65 70 75 80 85 90 95 100 105
-0.1
Page 35

Calibration Curve for PFNALinear Correlation = 0.99914396
PFNA - 5 Levels, 5 Levels Used, 15 Points, 15 Points Used, 0 QCson
ses 2x10 y = 1.4162 * x + 0.0126
R^2 = 0.99914396
Linear Correlation 0.99914396
Rel
ativ
e R
espo
1
1.1
1.2
1.3
1.4
0 4
0.5
0.6
0.7
0.8
0.9
-0 1
0
0.1
0.2
0.3
0.4
Relative Concentration-5 0 5 10 15 20 25 30 35 40 45 50 55 60 65 70 75 80 85 90 95 100 105
-0.1
Page 36
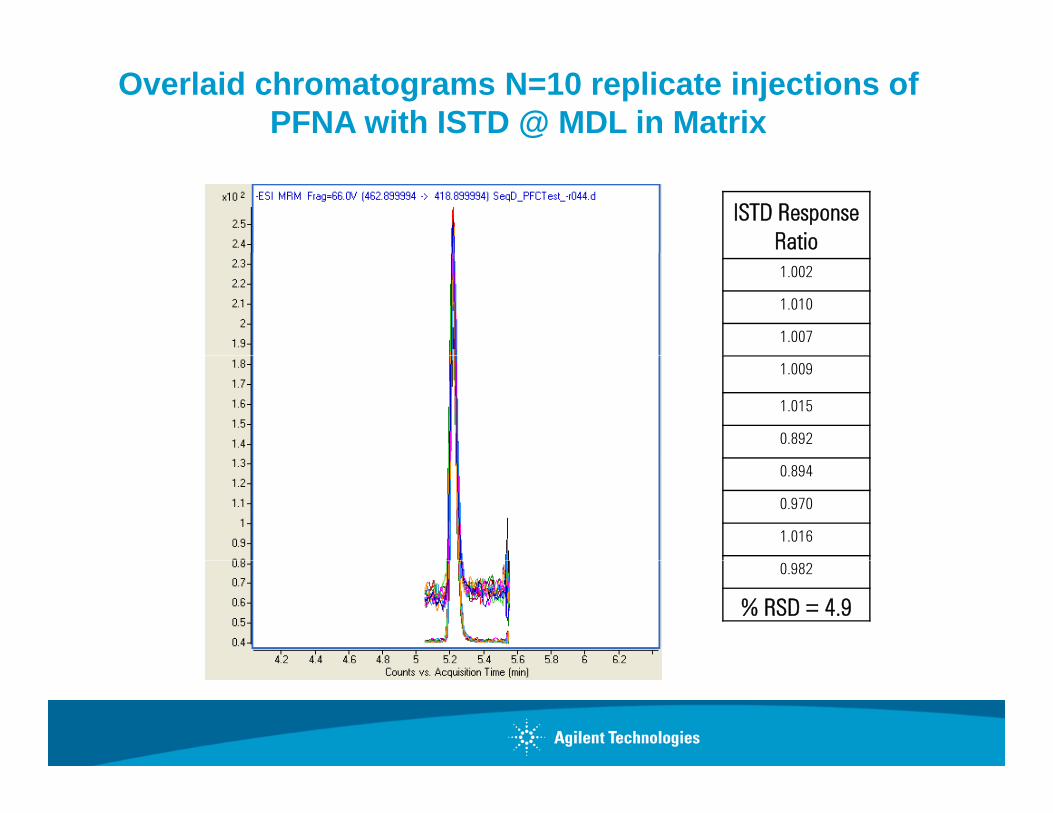
Overlaid chromatograms N=10 replicate injections of PFNA with ISTD @ MDL in Matrix
ISTD ResponseRatio1.002
1.010
1.007
1.009
1.015
0.892
0.894
0.970
1.016
0.982
% RSD = 4.9

MDLs from PFC_Test – Summary (n=10) (Liver Spike)Compoun
dMDLs
(i j i % RSD MDLs LODs 3 x LODs MDLs
ds (injection volume ul) (fg on
column)(fg on
column)SNR 3:1
(fg oncolumn)
SNR 10:1
PFBS 0.4 7.4 400 5.0 14.9 97.7
PFHxA 0.4 4.3 400 8.4 25.3 110.5
PFHpA 0.8 11.3 800 12.2 36 7 249.036.7PFHxS 0.2 20.2 200 2.6 7.8 44.62
PFOA 0.6 5.9 600 43.7 131.2 291.5
PFNA 1.0 4.9 1000 75.0 225 1 421.3225.1PFOS 0.2 23.9 200 5.7 17.0 58.3
PFDA 0.6 11.0 600 36.3 109.0 275.3
PFUA 0.8 5.7 800 44.0 132.0 303.9
PFDS 0.2 18.6 200 3.2 9.7 54.9
PFDoA 0.8 6.2 800 55.9 167.7 594.5
PFTriA 0.8 5.9 800 74.2 222.5 494.5
PFTA 0.8 10.8 800 21.7 65.1 503.2

New 6490 - World’s Most Sensitive LC/QQQ
iFunnel Technology Agilent Jet Stream Hexabore capillary Dual-stage ion funnel
Collision Cell – hexapoleTapered structure for increased ion acceptanceReduction of background noise
Improved Quad Drive ElectronicsImproved Quad Drive ElectronicsHigher RF power capabilityQuad drive frequency increased to 1.4 MHz
39

NEW IF UNNE L T ECHNOLOGYiFunnel Technology captures 10X more ions
Agilent Jet Stream Hexabore Capillary Dual Ion Funnel
• Thermal confinement of ESI plume
• Efficient desolvation to
• 6 capillary inlets• Samples 6X more ion rich
gas from the source
• Removes the gas but captures the ions
• Removes neutral noisecreate gas phase ions
• Creates an ion rich zone
gas from the source• Captures the majority of
the gas from the source region
• Removes neutral noise• Extends turbo pump life
region
40
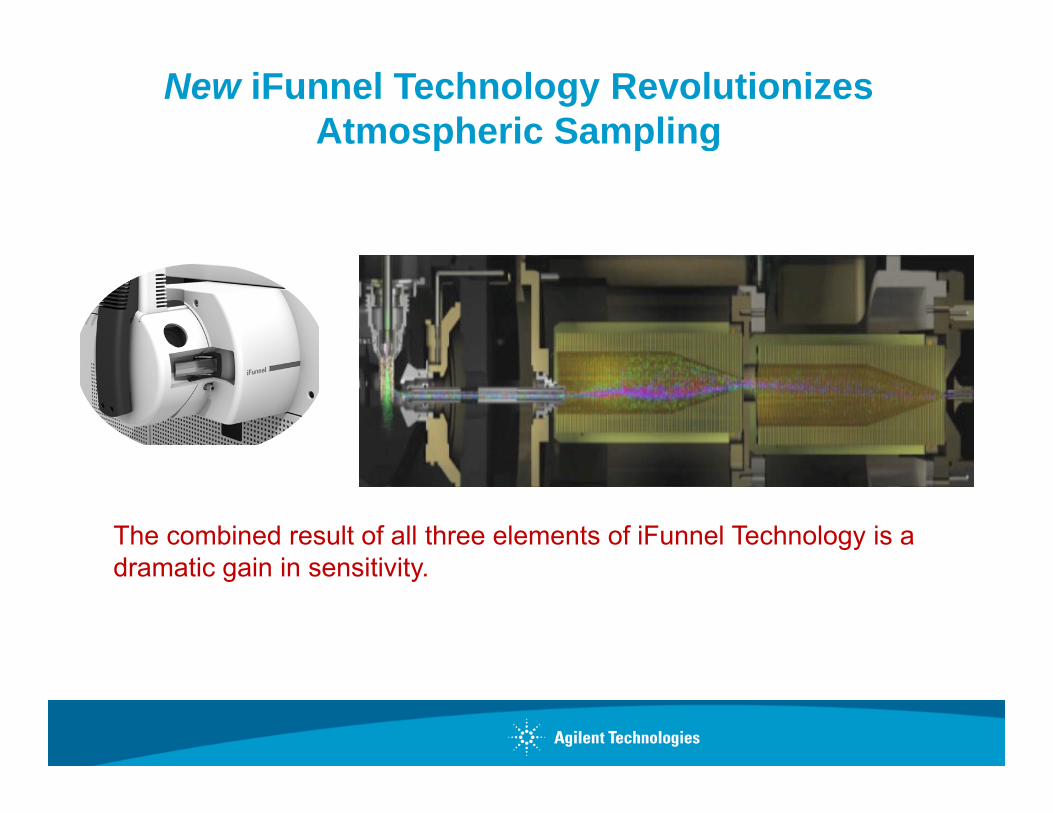
New iFunnel Technology RevolutionizesAtmospheric Samplingp p g
The combined result of all three elements of iFunnel Technology is a d ti i i iti itdramatic gain in sensitivity.

Agilent Triple Quads: 2006 – 2010Relentless increase in signal-to-noise specsRelentless increase in signal to noise specs
6490
8000
9000
10000
rpin
e
4000
5000
6000
7000
1 pg
rese
r
1000
2000
3000
4000
64106430
6460
SNR
1
0
2006 2007 2008 2009 2010
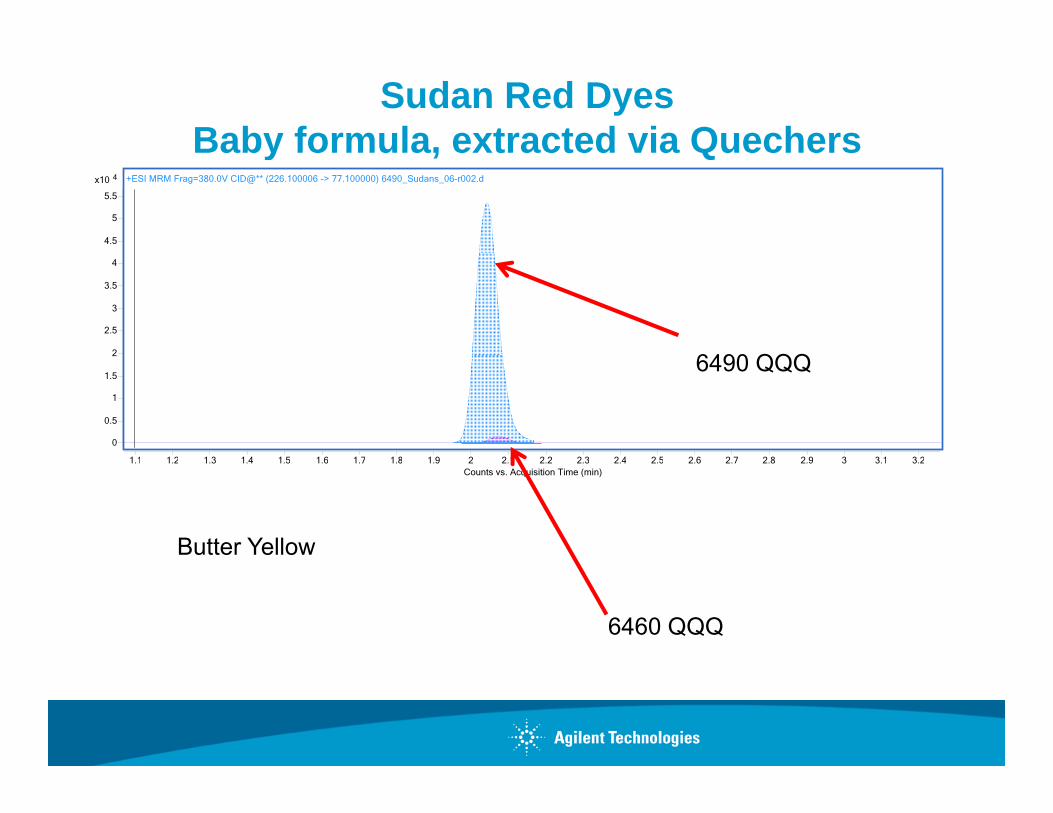
Sudan Red Dyes Baby formula, extracted via QuechersBaby formula, extracted via Quechers
4x10
4.5
5
5.5
+ESI MRM Frag=380.0V CID@** (226.100006 -> 77.100000) 6490_Sudans_06-r002.d
2
2.5
3
3.5
4
6490 QQQ
0
0.5
1
1.5
2
1 1 1 2 1 3 1 4 1 5 1 6 1 7 1 8 1 9 2 2 1 2 2 2 3 2 4 2 5 2 6 2 7 2 8 2 9 3 3 1 3 2
6490 QQQ
Counts vs. Acquisition Time (min)1.1 1.2 1.3 1.4 1.5 1.6 1.7 1.8 1.9 2 2.1 2.2 2.3 2.4 2.5 2.6 2.7 2.8 2.9 3 3.1 3.2
Butter Yellow
6460 QQQ

Sudan Red Dyes Baby formula, extracted via QuechersBaby formula, extracted via Quechers
LOD = 23fg on column
Cou
nts
Butter Yellow

Recent Advances in Ultra High Definition Mass SpectrometryDefinition Mass Spectrometry with the 1290 Infinity uHPLC
Systemy
(Agilent 1290 Infinity uHPLC, Agilent 6230 TOF and 6540 Q-TOF )Agilent 6230 TOF and 6540 Q TOF.)
Peter StoneAgilent Tecnologies IncAgilent Tecnologies Inc,
Santa Clara, CA.

Ultra High Definition Optimizing all Analytical DimensionsOptimizing all Analytical Dimensions
Signal Response
• Sensitivity• Dynamic Range• LinearitySignal Response Linearity
S ti S d• Separation Speed• Peak Capacity
Mass Spectrum
• Mass Accuracyy• Resolving Power• Acquisition Rate
Page 46

17 minute analysis – 224 Pesticides6230 TOF/1290 Infinity uHPLC6230 TOF/1290 Infinity uHPLC
5x10
5.5
61 1
3
3.5
4
4.5
5
0 5
1
1.5
2
2.5
0
0.5
Counts vs. Acquisition Time (min)1 2 3 4 5 6 7 8 9 10 11 12 13 14 15 16
3 Hz Data Acquisition Speed50pg on-column

3 minute analysis – 224 Pesticides 6230 TOF/1290 Infinity uHPLC
5x10
4.5
51 1
2.5
3
3.5
4
0.5
1
1.5
2
0
Counts vs. Acquisition Time (sec)5 10 15 20 25 30 35 40 45 50 55 60 65 70 75 80 85 90 95 100 105 110 115 120 125 130 135 140 145 150 155 160 165 170 175
10 Hz Data Acquisition Speed50pg on-column

90 second analysis – 224 Pesticides 6230 TOF/1290 Infinity uHPLC
20 Hz Data Acquisition Speed50pg on-column

Agilent 6230 TOF Pesticide Screening224 pesticides, 50 pg on column
17 min
224 pesticides, 50 pg on column
17 min.
3 min.Thiabendazole
Peak Width=0.8 sec23 data points
1.5 min. -1.8 ppm
SpectralResolution &
Isotopic Fidelity

Focused AMRT Databases(Personal Compound Databases (PCD)
Pesticides, Part # (G6854AA):
1600 l t t t (f l & t )• 1600 analyte content (formulae & accurate mass)
• Structures
CAS Numbers & Links to external website (pubchem)• CAS Numbers & Links to external website (pubchem)
Forensic & Toxicology Part # (G6855AA):Forensic & Toxicology, Part # (G6855AA):
• ~7000 analytes content (formulae & accurate mass)
• Structures• Structures
• CAS Numbers & Links to external website (pubchem)
Page 51

Agilent TOF Screening Solution (PCD)
Agilent 6230 TOFg- 20K resolution- 5 decades in-scan- Low Pg Sensitivity
FBF
Find by Formula
Page 52

PCD Search Results For 50pg Forensic Spiked Blood – PCD Search Confirmed compound 9 as Cocaine
Page 53

Retention Time Scoring (example – aldicarb sulfone/acetamiprid/butoxycarboxim)( p p y )
2ppm mass tolerance window:pp ass to e a ce do
Acetamiprid [C10H11ClN4], m/z=222.06722Aldicarb-sulfone [C7H14N4O4S], m/z=222.06743Butoxycarboxim [C7H14N4O4S], m/z=222.06743
Page 54
y [ 7 14 4 4 ],
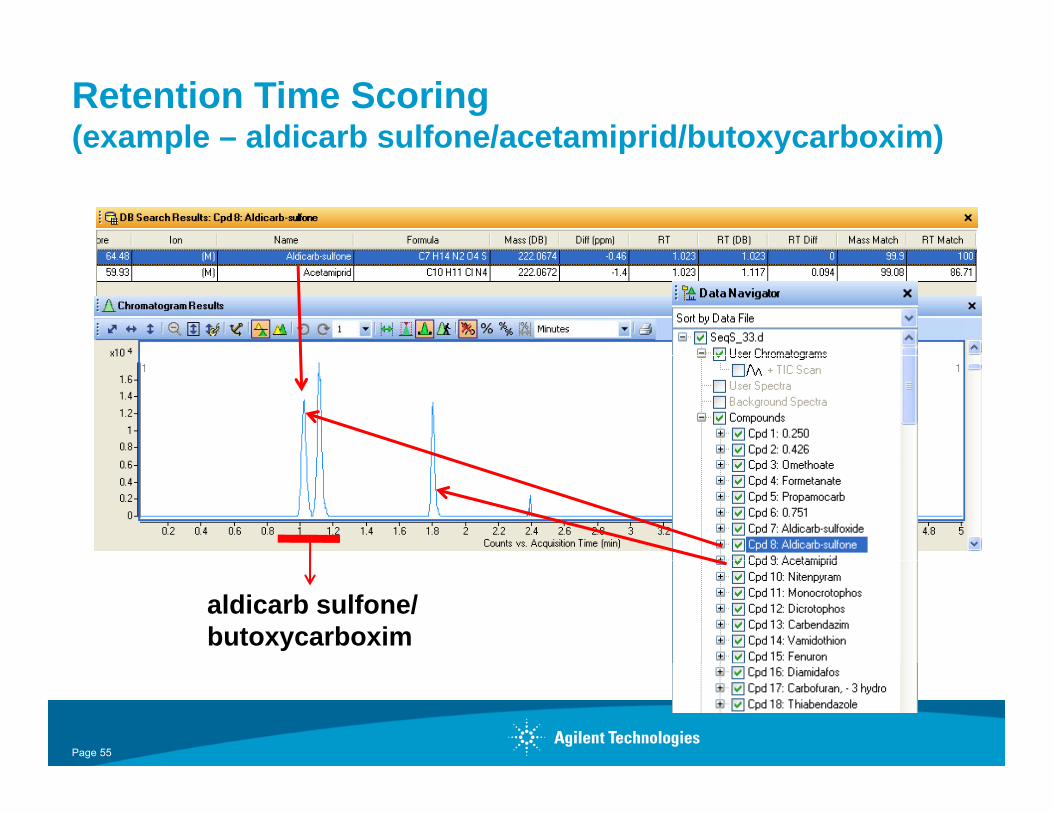
Retention Time Scoring(example – aldicarb sulfone/acetamiprid/butoxycarboxim)( p p y )
aldicarb sulfone/butoxycarboxim
Page 55

PESTICIDE Non‐target Screen, 6230 TOF/1290 uHPLC 3 minute analysis, Zorbax Eclipse + C18 2.1x100mm, 1.8um
100 l 10 H A i i i100pg on‐column, 10 Hz Acquisition.

3 minute analysis, Zorbax Eclipse + C18 2.1x100mm, 1.8umy , p ,6230 TOF/1290uHPLC, 100pg on‐column, 10 Hz Acquisition.
4x10
2.279.6
Cpd 164: Thidiazuron
1 2
1.4
1.6
1.8
2
0.9second Peak width (FWHM)
0.4
0.6
0.8
1
1.2
0.2
Counts vs. Acquisition Time (sec)60 61 62 63 64 65 66 67 68 69 70 71 72 73 74 75 76 77 78 79 80 81 82 83 84 85 86 87 88 89 90 91 92 93 94 95 96 97 98 99 100

1290 Infinity/6230 TOFFind By Formula PCD SearchFind By Formula PCD Search
3-minute 1290/6230 TOF Screening (224 +ve Pesticide suite)
Analyte amount # of compounds Average Mass a yte a ou t(on-column)
# o co pou dsidentified (%)
e age assAccuracy (ppm)
500fg 45 (20%) 0.24
1.25pg 96 (43%) 0.51
2 5pg 124 (55%) 0 492.5pg 124 (55%) 0.49
5pg 163 (73%) 0.12
25pg 202 (90%) 0.70
50pg 217 (97%) 0.06
125pg 224 (100%) 0.60

Non-target Screen (6230 TOF/1290 uHPLC), 202/224 (90%) Pesticides Identified90 second Analysis time 20Hz (2GHz mode)
5x10
0 925
0.95
0.975
1
1.025
1.05
1.075
1.1 63.0Cpd 109: Terbutryn
(4ppm mass tolerance FBF)
0.7
0.725
0.75
0.775
0.8
0.825
0.85
0.875
0.9
0.925 (4ppm mass tolerance, FBF)25 pg on-column
0.475
0.5
0.525
0.55
0.575
0.6
0.625
0.65
0.675
0 225
0.25
0.275
0.3
0.325
0.35
0.375
0.4
0.425
0.45
0.025
0.05
0.075
0.1
0.125
0.15
0.175
0.2
0.225
Counts vs. Acquisition Time (sec)2 4 6 8 10 12 14 16 18 20 22 24 26 28 30 32 34 36 38 40 42 44 46 48 50 52 54 56 58 60 62 64 66 68 70 72 74 76 78 80 82 84 86 88 90

510
Terbutryn 90 second Analysis time 20Hz (2GHz mode) Zorbax Eclipse Plus C18 (2.1x50mm x 1.8um) 6230TOF/1290 UHPLC
5x10
0 90.920.940.960.98
11.021.041.061.08 63.0
Cpd 109: Terbutryn
0 680.7
0.720.740.760.78
0.80.820.840.860.88
0.9
0 7 d
0 460.48
0.50.520.540.560.58
0.60.620.640.660.68 0.7 second
Peak width @ half height >16 Data points
across peak
0.260.28
0.30.320.340.360.38
0.40.420.440.46 across peak
0.040.060.08
0.10.120.140.160.18
0.20.220.24
Counts vs. Acquisition Time (sec)2 4 6 8 10 12 14 16 18 20 22 24 26 28 30 32 34 36 38 40 42 44 46 48 50 52 54 56 58 60 62 64 66 68 70 72 74 76 78 80 82 84 86 88 90

6230 TOF Speed, Mass Resolution & Dynamic Range – Example: Tebuconazole (2GHz mode)Range Example: Tebuconazole (2GHz mode)
Tebuconazole 3 min analysis 1.5 min analysis(on-column amount) 10Hz acquisition 20Hz acquisition
Mass Error (ppm)
MassResolution
Mass Error (ppm)
MassResolution
500pg on-column -0 9 8542 1 46 8546500pg on column 0.9 8542 1.46 8546250pg on-column -1.79 8626 -1.02 8617125pg on-column -0.8 8711 1.82 8803
0 l 1 8822 0 06 892250pg on-column -1.77 8822 -0.06 892225pg on-column -2.03 8749 1.51 8918Peak Width FWHM (sec) 0.8 0.5
[M+H]+=308.152947

6230 TOF Speed, Mass Resolution & Dynamic Range – Example: Tebuconazole (4GHz mode)Range Example: Tebuconazole (4GHz mode)
Tebuconazole 3 min analysis 1.5 min (on-column amount) 10Hz
acquisitionanalysis
3Hz acquisitionMass Error
(ppm)Mass
ResolutionMass Error
(ppm)Mass
Resolution
250pg on-column -0.26 17765 -0.2 17949125pg on-column 0.4 17314 0.1 1743250pg on-column -0 31 16959 0 2 1722650pg on-column -0.31 16959 0.2 1722625pg on-column -0.35 17122 0.03 171195pg on-column -1.42 16177 0.03 164992.5pg on-column ND ND -1.13 16262Peak Width FWHM (sec) 0.8 0.5

Agilent’s New 6540 Ultra High DefinitionAccurate Mass Q-TOFAccurate Mass Q TOF
Exceptional accurate mass, sensitivity, dynamic range and resolution … perfect match for 1290 Infinity UHPLC
500 ppb mass accuracy
match for 1290 Infinity UHPLC
500 ppb mass accuracyfemtogram sensitivity5 decades dynamic range40,000 resolving power20 Spectra/secExcellent Linearity and IsotopicExcellent Linearity and Isotopic
FidelitySupports Agilent Jet Stream and
HPLC-ChipHPLC-Chip
Page 63

Ion Beam Compression (IBC)* TechnologyDrives Higher ResolutionDrives Higher Resolution
Compressed and cooled ion beam ensures the best sensitivityperformance in high resolution mode
Exit from collision cell
Into slicer and pulser region
Narrowed beam slit enables mass resolutionof 40K
Up to 10-fold ion beam compression * Patent pending
Page 64

Pesticide Screen 1290 Infinity/6540 Q-TOF

4x10
2
2.2
2.4 145.06481924909
1 naphthol
1290/6540 90sec analysis250 pesticides (125pg on-column)
0 8
1
1.2
1.4
1.6
1.8
2 1‐naphthol Mass [M+H]+ = 145.064891
Resolution = 249090.06 ppm
0
0.2
0.4
0.6
0.8
146.06893917868
Counts vs. Mass-to-Charge (m/z)145 145.5 146 146.5 147
4x10
2.4
2.6
2.8
33.2
3.4
3.6
3.84
4.2
4.4
4.6
4.85
5.2 74.9Cpd 201: Naphthol, 1-
0.2
0.40.6
0.8
1
1.21.4
1.6
1.8
2
2.2
Counts vs. Acquisition Time (sec)58 60 62 64 66 68 70 72 74 76 78 80 82 84 86 88 90
4x10
3.5
4
4.5
5
5.5422.208059
38636
Fenpyroximate EMass [M+H]+ = 422.208059
Resolution = 38636
4x10
4 5
5
5.5
6
6.5
7
7.5
8
8.5
9 732.46871447094
Spinosad AMass [M+H]+ = 732.468714
Resolution = 47094
0.5
1
1.5
2
2.5
3
423.21126333121
424.213956
Resolution 38636‐0.25ppm
0
0.5
1
1.5
2
2.5
3
3.5
4
4.5
733.47226542144
734.47514735133
731 731 5 732 732 5 733 733 5 734 734 5 735 735 5 736 736 5 737 737 5 738
Resolution 47094‐0.77ppm
0
29032
Counts vs. Mass-to-Charge (m/z)421.5 422 422.5 423 423.5 424 424.5 425 425.5
Counts vs. Mass-to-Charge (m/z)731 731.5 732 732.5 733 733.5 734 734.5 735 735.5 736 736.5 737 737.5 738

25pg on-column 1290 Infinity/6540 Q-TOF 3min 92% identified pesticides
5x10
0 94
0.96
0.98
1
1.02
1.04
1.06
1.08
1.1 1 1
0.72
0.74
0.76
0.78
0.8
0.82
0.84
0.86
0.88
0.9
0.92
0.94
0 48
0.5
0.52
0.54
0.56
0.58
0.6
0.62
0.64
0.66
0.68
0.7
0.26
0.28
0.3
0.32
0.34
0.36
0.38
0.4
0.42
0.44
0.46
0.48
0 02
0.04
0.06
0.08
0.1
0.12
0.14
0.16
0.18
0.2
0.22
0.24
118.6
0
0.02
Counts vs. Acquisition Time (sec)5 10 15 20 25 30 35 40 45 50 55 60 65 70 75 80 85 90 95 100 105 110 115 120 125 130 135 140 145 150 155 160 165 170 175

1290 Infinity/6540 Q-TOF - Emamectin B1a, 50pg on-column 3min, pg

1290 Infinity/6540 Q-TOF - 1-naphthol, 50pg on-column 3minp , pg
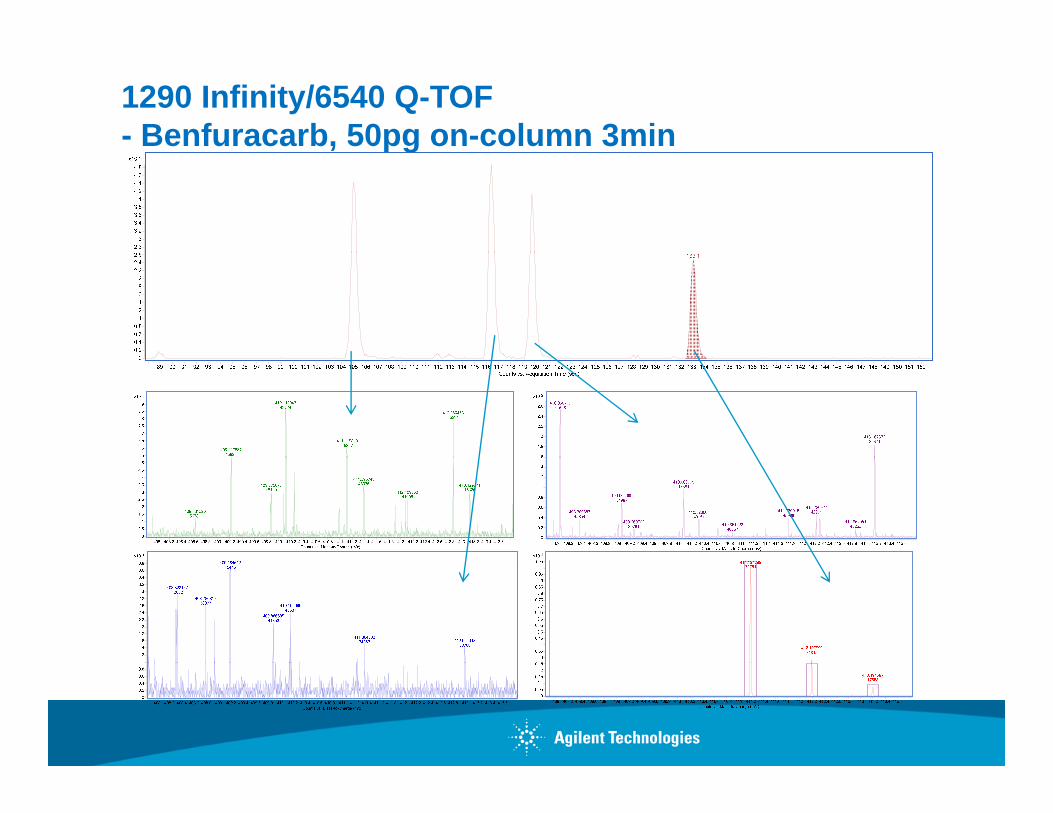
1290 Infinity/6540 Q-TOF - Benfuracarb, 50pg on-column 3min, pg

1290 Infinity/6540 Q-TOF - Benfuracarb, 50pg on-column 3min, pg

Non-Targeted Screen Summary (QTOF/TOF)
•Agilent TOF/Q-TOF for ‘unknown’ screening (low ppm mass accuracy.)•Agilent MassHunter PCD utilizes the accurate mass data to provideAgilent MassHunter PCD utilizes the accurate mass data to provide reliable ‘positives’ for qualitative screens.
• Extra Confirmation with Isotope abundance (pattern), spacing and mass matchingmatching.• 1600 Pesticide analytes• Fully Automated integration with MassHunter Qualitative Analysis SW.
•Reliable Data mining Algorithms (MFE or FBF )Reliable Data mining Algorithms (MFE or FBF.)•Low pico-gram on-column Sensitivity.•Fully Automated.Faster data acquisition with 1290 Infinity UHPLC•Faster data acquisition with 1290 Infinity UHPLC.
Page 72

Questions?
Thank You for Listening.