reasoning –data interpretation - anujjindal.in · data interpretation i.1) directions for...
TRANSCRIPT

DAILY QUESTIONS
28th MAY ‘18
REASONING – DATA INTERPRETATION
DATA INTERPRETATION
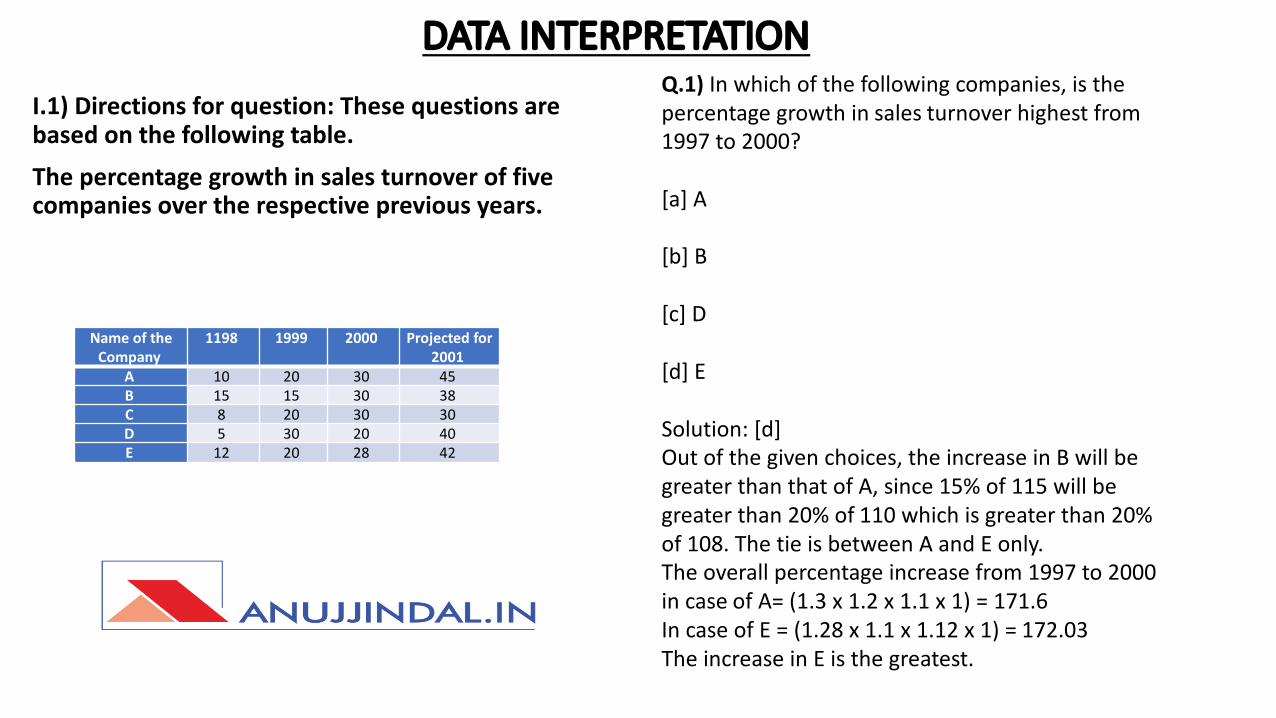
I.1) Directions for question: These questions are based on the following table.
The percentage growth in sales turnover of five companies over the respective previous years.
Name of the Company
1198 1999 2000 Projected for 2001
A 10 20 30 45B 15 15 30 38C 8 20 30 30D 5 30 20 40E 12 20 28 42
Q.1) In which of the following companies, is the percentage growth in sales turnover highest from 1997 to 2000?
[a] A
[b] B
[c] D
[d] E
Solution: [d]Out of the given choices, the increase in B will be greater than that of A, since 15% of 115 will be greater than 20% of 110 which is greater than 20% of 108. The tie is between A and E only.The overall percentage increase from 1997 to 2000 in case of A= (1.3 x 1.2 x 1.1 x 1) = 171.6In case of E = (1.28 x 1.1 x 1.12 x 1) = 172.03The increase in E is the greatest.
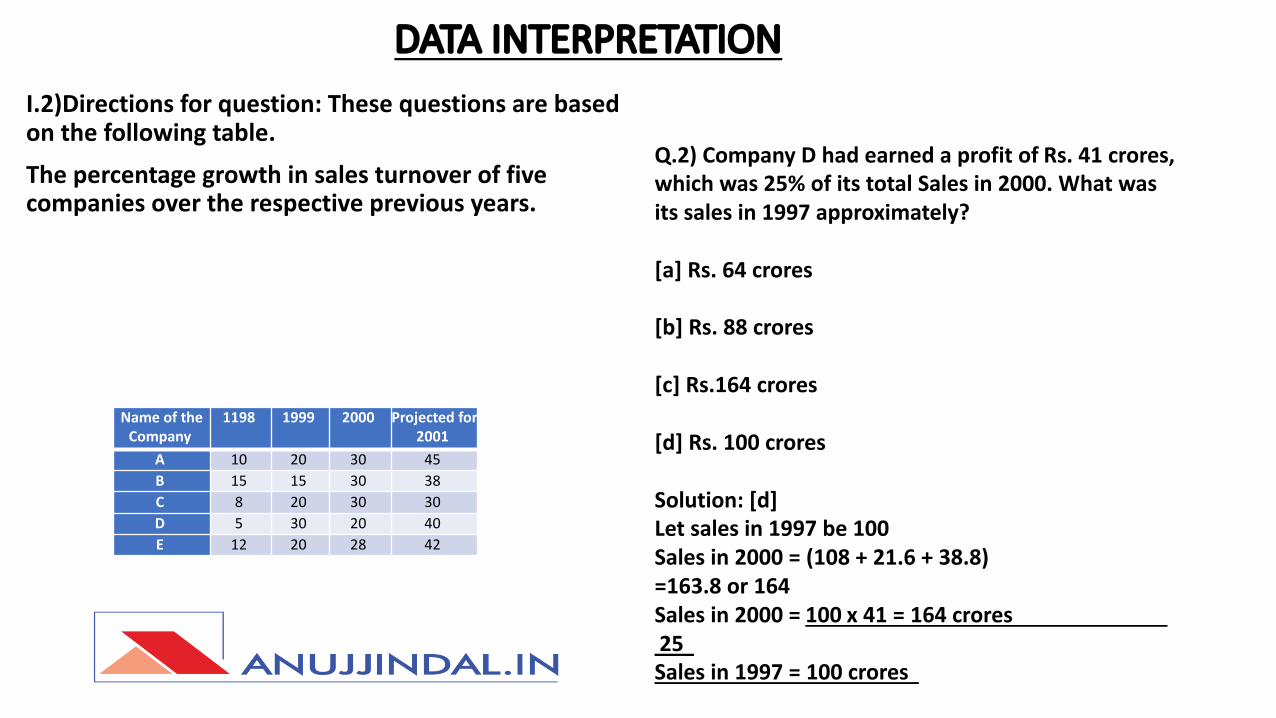
DATA INTERPRETATIONI.2)Directions for question: These questions are based on the following table.The percentage growth in sales turnover of five companies over the respective previous years.
Name of the Company
1198 1999 2000 Projected for 2001
A 10 20 30 45B 15 15 30 38C 8 20 30 30D 5 30 20 40E 12 20 28 42
Q.2) Company D had earned a profit of Rs. 41 crores, which was 25% of its total Sales in 2000. What was its sales in 1997 approximately?
[a] Rs. 64 crores
[b] Rs. 88 crores
[c] Rs.164 crores
[d] Rs. 100 crores
Solution: [d]Let sales in 1997 be 100Sales in 2000 = (108 + 21.6 + 38.8)=163.8 or 164Sales in 2000 = 100 x 41 = 164 crores25Sales in 1997 = 100 crores
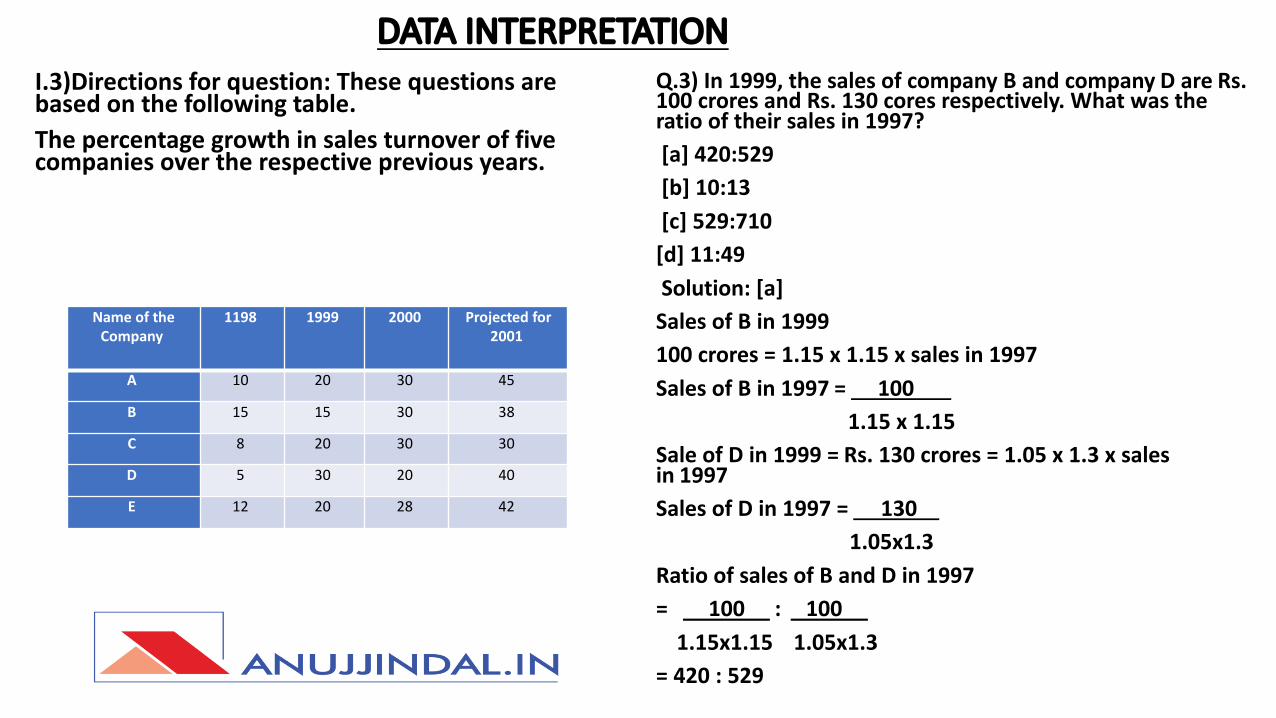
DATA INTERPRETATIONI.3)Directions for question: These questions are based on the following table.The percentage growth in sales turnover of five companies over the respective previous years.
Q.3) In 1999, the sales of company B and company D are Rs. 100 crores and Rs. 130 cores respectively. What was the ratio of their sales in 1997?
[a] 420:529
[b] 10:13
[c] 529:710
[d] 11:49
Solution: [a]
Sales of B in 1999
100 crores = 1.15 x 1.15 x sales in 1997
Sales of B in 1997 = 100
1.15 x 1.15
Sale of D in 1999 = Rs. 130 crores = 1.05 x 1.3 x sales in 1997
Sales of D in 1997 = 130
1.05x1.3
Ratio of sales of B and D in 1997
= 100 : 100
1.15x1.15 1.05x1.3
= 420 : 529
Name of the Company
1198 1999 2000 Projected for 2001
A 10 20 30 45
B 15 15 30 38
C 8 20 30 30
D 5 30 20 40
E 12 20 28 42
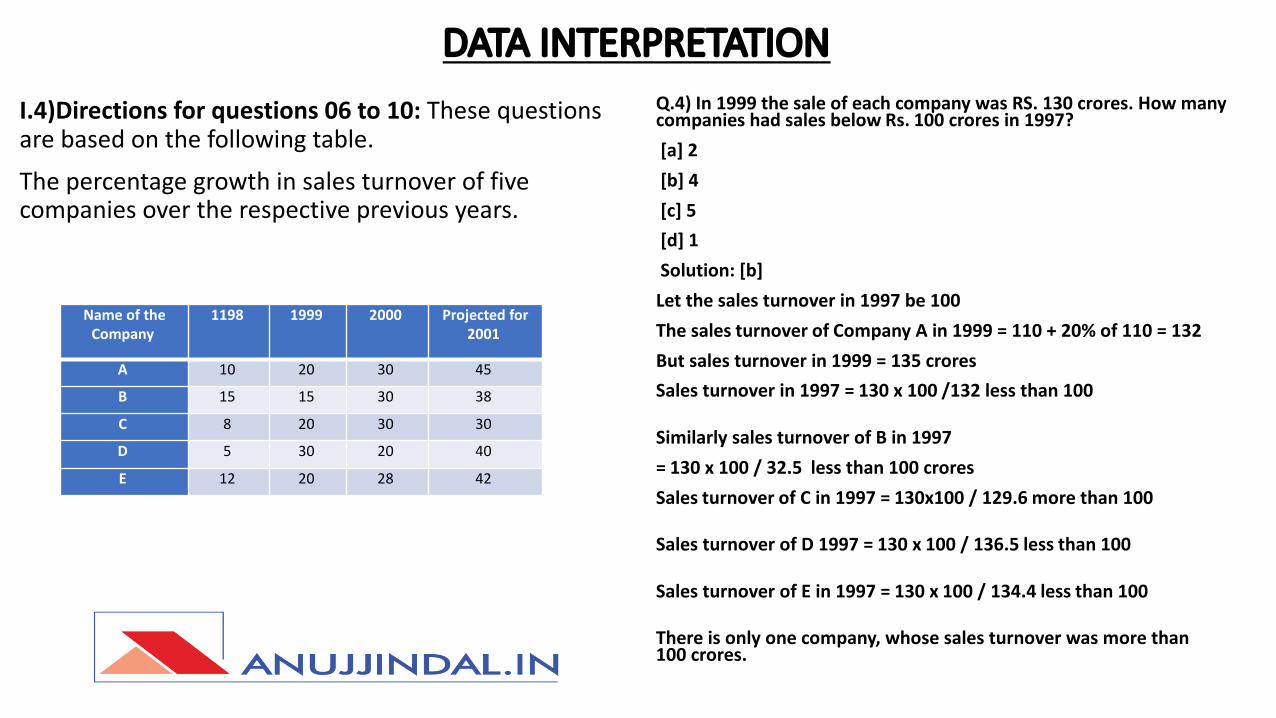
DATA INTERPRETATIONI.4)Directions for questions 06 to 10: These questions are based on the following table.The percentage growth in sales turnover of five companies over the respective previous years.
Q.4) In 1999 the sale of each company was RS. 130 crores. How many companies had sales below Rs. 100 crores in 1997?[a] 2[b] 4[c] 5[d] 1Solution: [b]Let the sales turnover in 1997 be 100The sales turnover of Company A in 1999 = 110 + 20% of 110 = 132But sales turnover in 1999 = 135 croresSales turnover in 1997 = 130 x 100 /132 less than 100
Similarly sales turnover of B in 1997= 130 x 100 / 32.5 less than 100 croresSales turnover of C in 1997 = 130x100 / 129.6 more than 100
Sales turnover of D 1997 = 130 x 100 / 136.5 less than 100
Sales turnover of E in 1997 = 130 x 100 / 134.4 less than 100
There is only one company, whose sales turnover was more than 100 crores.
Name of the Company
1198 1999 2000 Projected for 2001
A 10 20 30 45
B 15 15 30 38
C 8 20 30 30
D 5 30 20 40
E 12 20 28 42
DATA INTERPRETATION
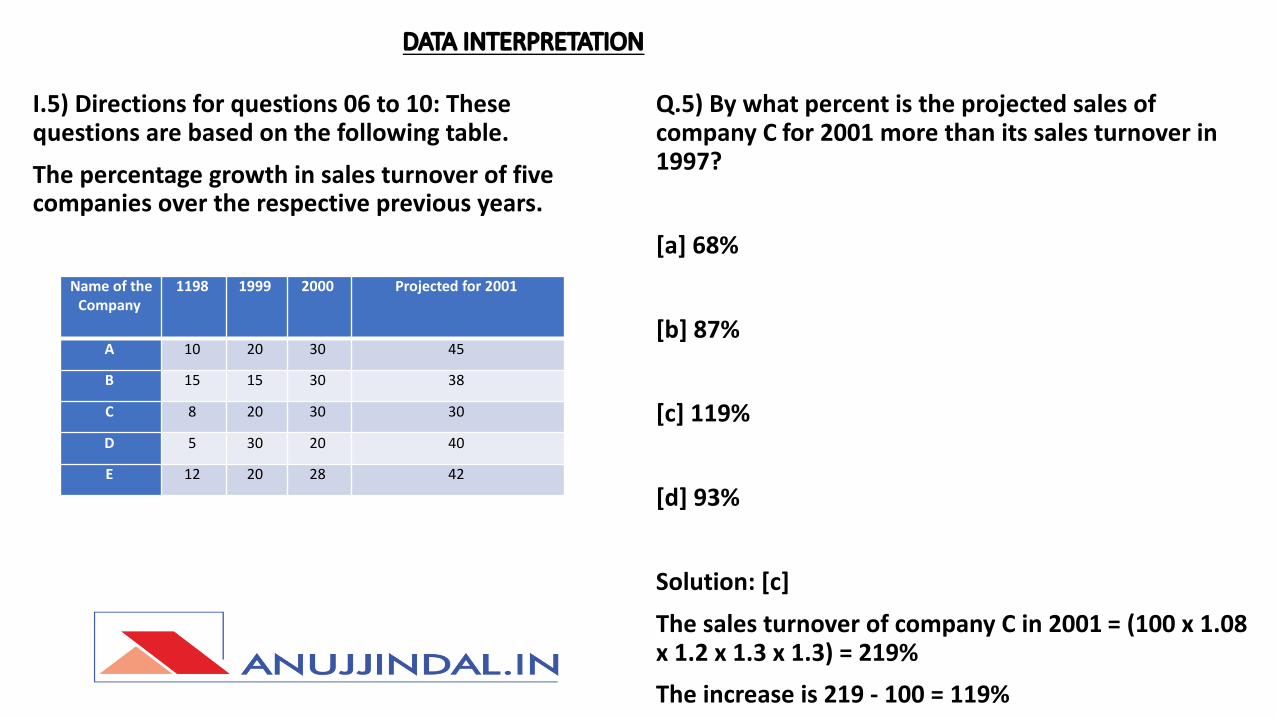
I.5) Directions for questions 06 to 10: These questions are based on the following table.The percentage growth in sales turnover of five companies over the respective previous years.
Q.5) By what percent is the projected sales of company C for 2001 more than its sales turnover in 1997?
[a] 68%
[b] 87%
[c] 119%
[d] 93%
Solution: [c]The sales turnover of company C in 2001 = (100 x 1.08 x 1.2 x 1.3 x 1.3) = 219%The increase is 219 - 100 = 119%
Name of the Company
1198 1999 2000 Projected for 2001
A 10 20 30 45
B 15 15 30 38
C 8 20 30 30
D 5 30 20 40
E 12 20 28 42

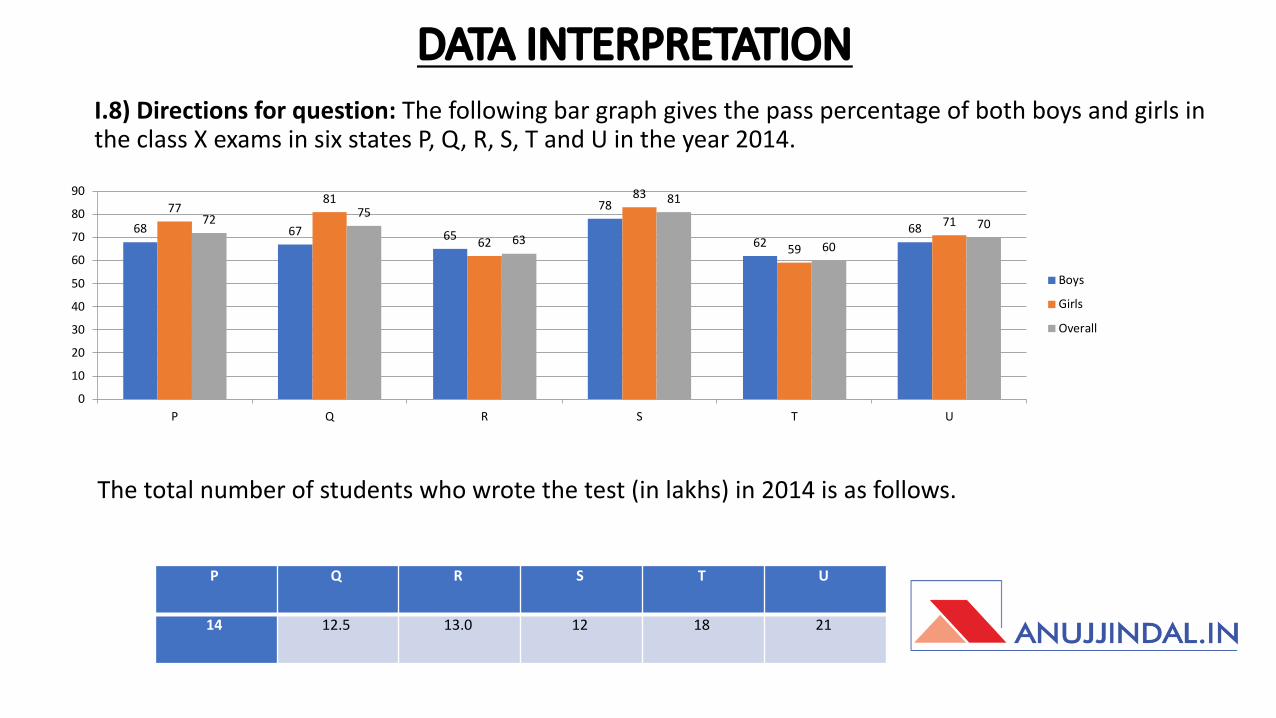
DATA INTERPRETATIONI.6) Directions for question: The following bar graph gives the pass percentage of both boys and girls in the class X exams in six states P, Q, R, S, T and U in the year 2014.
68 67 65
78
6268
7781
62
83
59
7172 75
63
81
60
70
0
10
20
30
40
50
60
70
80
90
P Q R S T U
Boys
Girls
Overall
P Q R S T U
14 12.5 13.0 12 18 21
The total number of students who wrote the test (in lakhs) in 2014 is as follows.
Q.6) What is the ratio of boys to girls in state R?
[a] 1:2[b] 2:1[c] 2:3[d] 3:2
Solution: [a]Let the ratio of boys to girls be x : y65x+62y = 63
x+y65x + 62y = 63x + 63y2x = yx/y = 1/2.
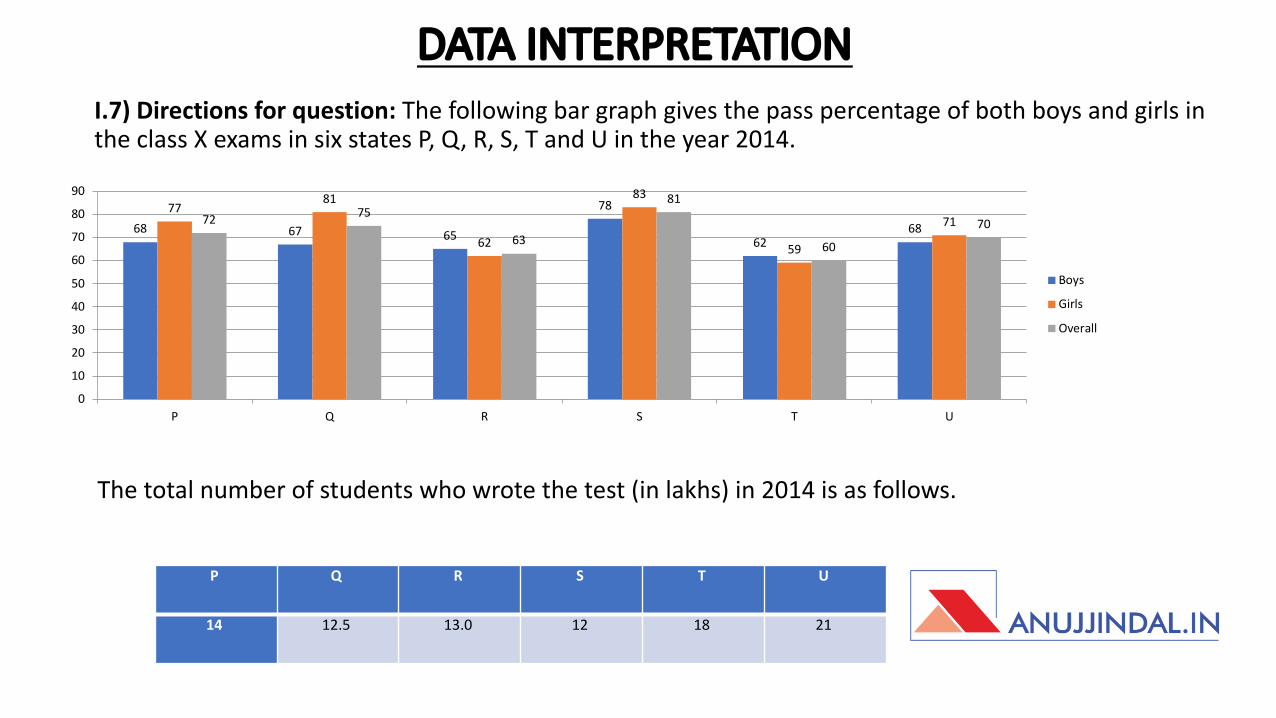
DATA INTERPRETATIONI.7) Directions for question: The following bar graph gives the pass percentage of both boys and girls in the class X exams in six states P, Q, R, S, T and U in the year 2014.
68 67 65
78
6268
7781
62
83
59
7172 75
63
81
60
70
0
10
20
30
40
50
60
70
80
90
P Q R S T U
Boys
Girls
Overall
P Q R S T U
14 12.5 13.0 12 18 21
The total number of students who wrote the test (in lakhs) in 2014 is as follows.
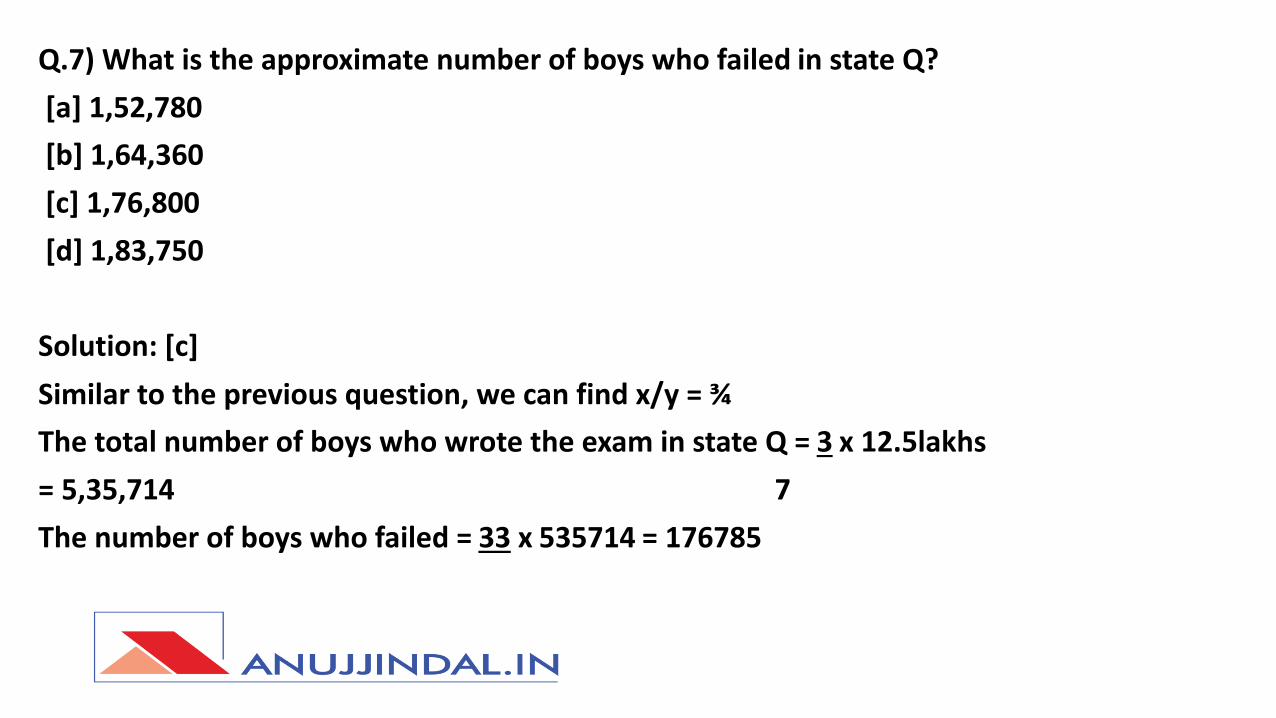
Q.7) What is the approximate number of boys who failed in state Q?
[a] 1,52,780
[b] 1,64,360
[c] 1,76,800
[d] 1,83,750
Solution: [c]
Similar to the previous question, we can find x/y = ¾
The total number of boys who wrote the exam in state Q = 3 x 12.5lakhs
= 5,35,714 7
The number of boys who failed = 33 x 535714 = 176785
DATA INTERPRETATIONI.8) Directions for question: The following bar graph gives the pass percentage of both boys and girls in the class X exams in six states P, Q, R, S, T and U in the year 2014.
68 67 65
78
6268
7781
62
83
59
7172 75
63
81
60
70
0
10
20
30
40
50
60
70
80
90
P Q R S T U
Boys
Girls
Overall
P Q R S T U
14 12.5 13.0 12 18 21
The total number of students who wrote the test (in lakhs) in 2014 is as follows.
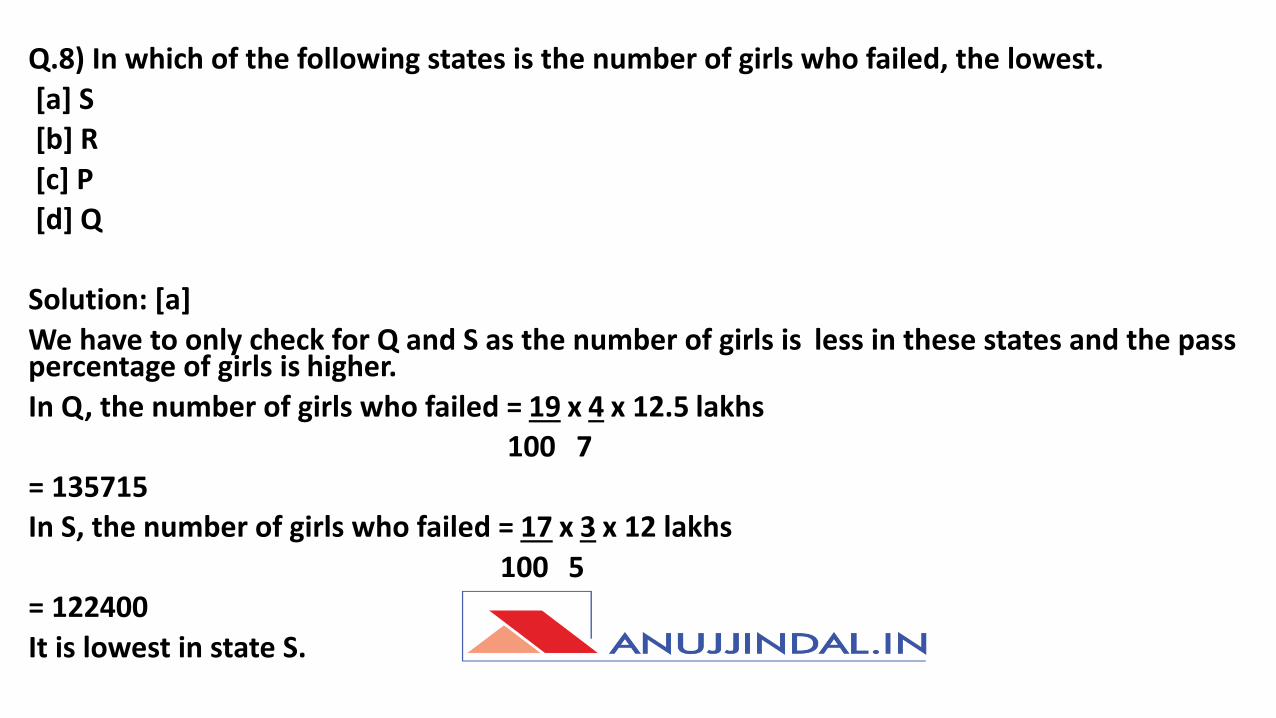
Q.8) In which of the following states is the number of girls who failed, the lowest.[a] S[b] R[c] P[d] Q
Solution: [a]We have to only check for Q and S as the number of girls is less in these states and the pass percentage of girls is higher.In Q, the number of girls who failed = 19 x 4 x 12.5 lakhs
100 7= 135715In S, the number of girls who failed = 17 x 3 x 12 lakhs
100 5= 122400It is lowest in state S.

DATA INTERPRETATIONI.9) Directions for question: The following bar graph gives the pass percentage of both boys and girls in the class X exams in six states P, Q, R, S, T and U in the year 2014.
68 67 65
78
6268
7781
62
83
59
7172 75
63
81
60
70
0
10
20
30
40
50
60
70
80
90
P Q R S T U
Boys
Girls
Overall
P Q R S T U
14 12.5 13.0 12 18 21
The total number of students who wrote the test (in lakhs) in 2014 is as follows.
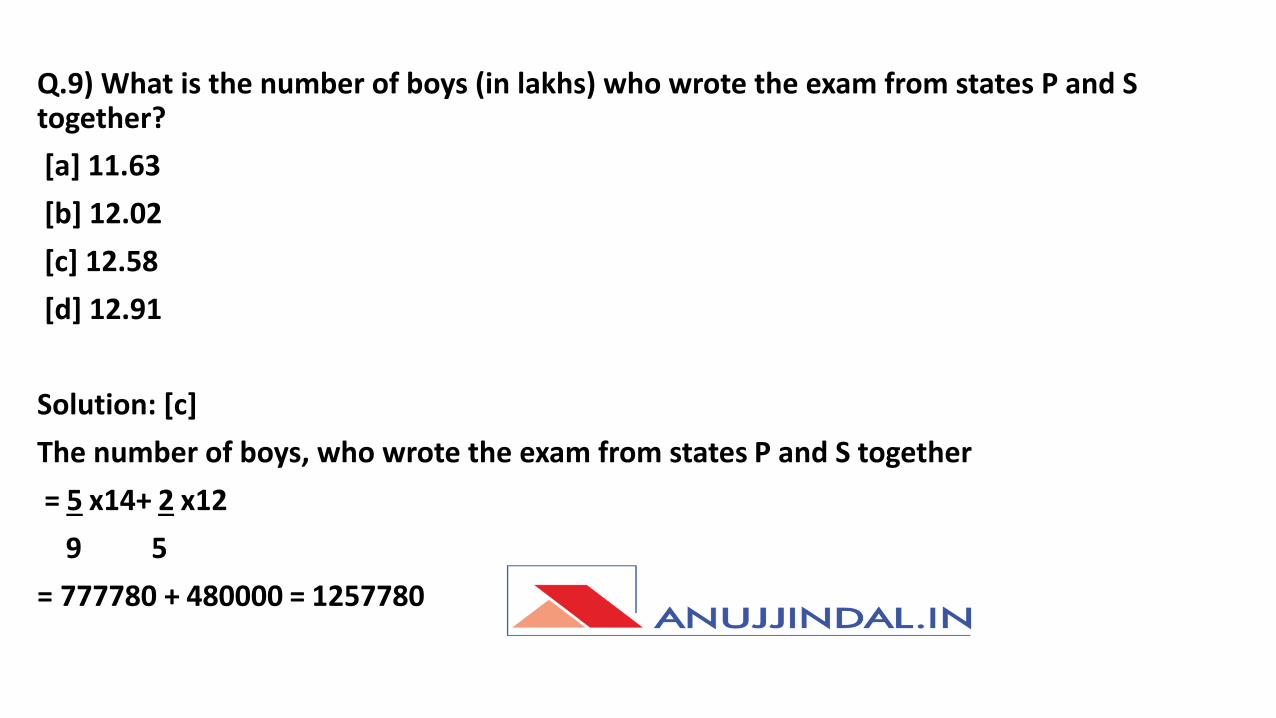
Q.9) What is the number of boys (in lakhs) who wrote the exam from states P and S together?[a] 11.63[b] 12.02[c] 12.58[d] 12.91
Solution: [c]The number of boys, who wrote the exam from states P and S together= 5 x14+ 2 x12
9 5= 777780 + 480000 = 1257780
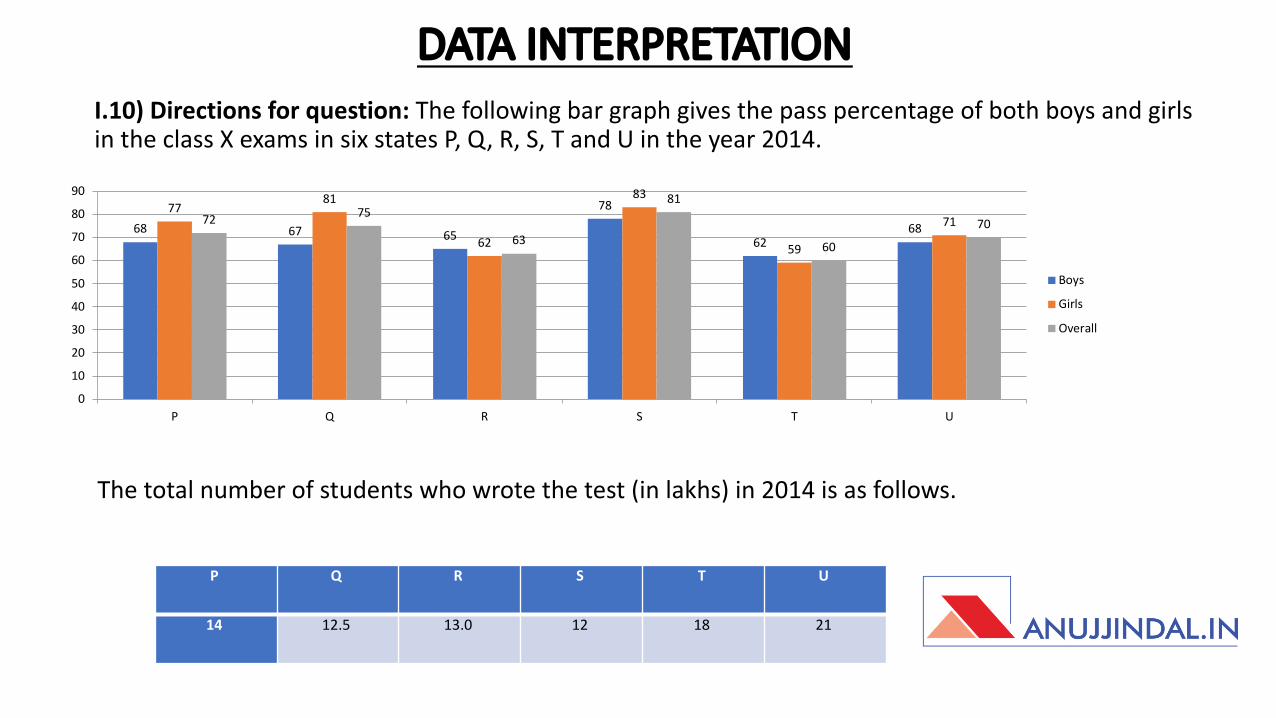
DATA INTERPRETATIONI.10) Directions for question: The following bar graph gives the pass percentage of both boys and girls in the class X exams in six states P, Q, R, S, T and U in the year 2014.
68 67 65
78
6268
7781
62
83
59
7172 75
63
81
60
70
0
10
20
30
40
50
60
70
80
90
P Q R S T U
Boys
Girls
Overall
P Q R S T U
14 12.5 13.0 12 18 21
The total number of students who wrote the test (in lakhs) in 2014 is as follows.
Q.10) In how many of the given states is the percentage of boys writing the exam more than 50?[a] 1[b] 2[c] 3[d] 4
Solution:[a]Only in state P is the percentage of boys writing the exam greater than 50.