reality check on the true cost of recurring bad quality in your … · · 2017-04-02reality check...
TRANSCRIPT

Reality Check on the True Cost of Recurring Bad Quality in Your Lab… - How to Find It - How to Fix It - How to Sustain the Cost Savings
Lucia M. Berte www.LaboratoriesMadeBetter.com
1

2
Schiffauerova A, Thompson T. A review of research on cost of quality models and best practices. International Journal of Quality and Reliability Management, Vol.23, No.4, 647-669, 2006.

Fact:
3
“It’s cheaper to do the job right the first time than to recover from an error.” Philip Crosby

A lab that didn’t “get it”…
4
Baltimore Sun, August 13, 2004 Lab workers warned Md. General 2 years ago “Laboratory workers at Maryland General Hospital warned top hospital administrators and state officials in writing nearly two years ago of serious and long-standing testing problems that put patients and employees at risk…”
…and you know the rest of that multi-million dollar
fix-it story…
5
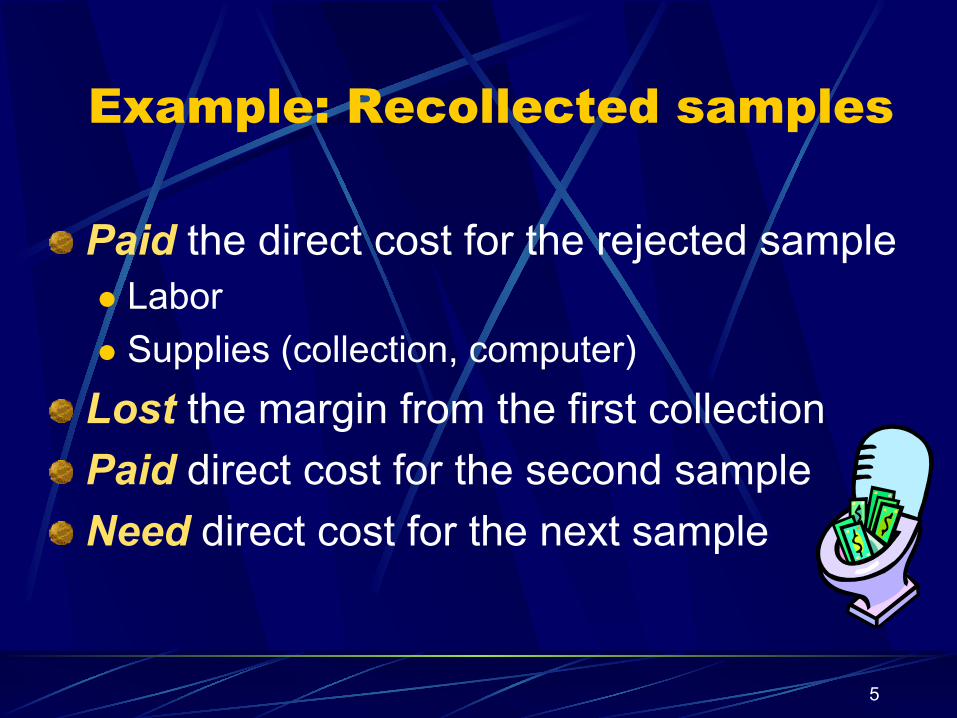
Example: Recollected samples
! Paid the direct cost for the rejected sample l Labor l Supplies (collection, computer)
! Lost the margin from the first collection ! Paid direct cost for the second sample ! Need direct cost for the next sample

6
What’s the cost of quality
in YOUR laboratory
?
7
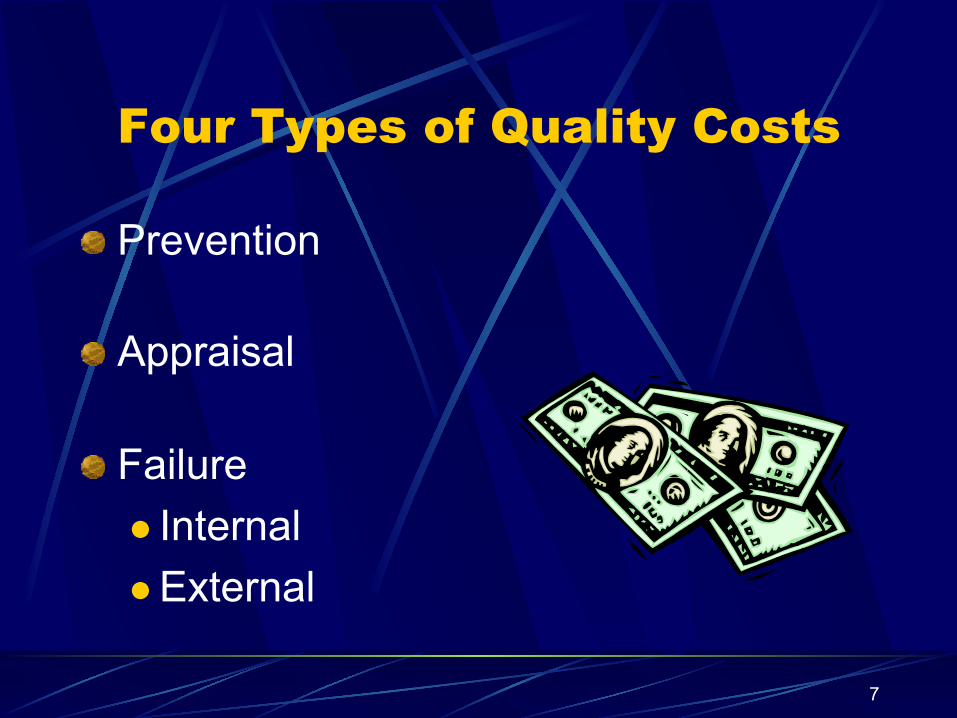
Four Types of Quality Costs
! Prevention
! Appraisal
! Failure l Internal l External

8
Prevention Costs
! Quality planning
! Supplier capability
! Process capability
! Preventive maintenance
! Quality improvement l Meetings l Projects l Education l Training
! Work process
training
9
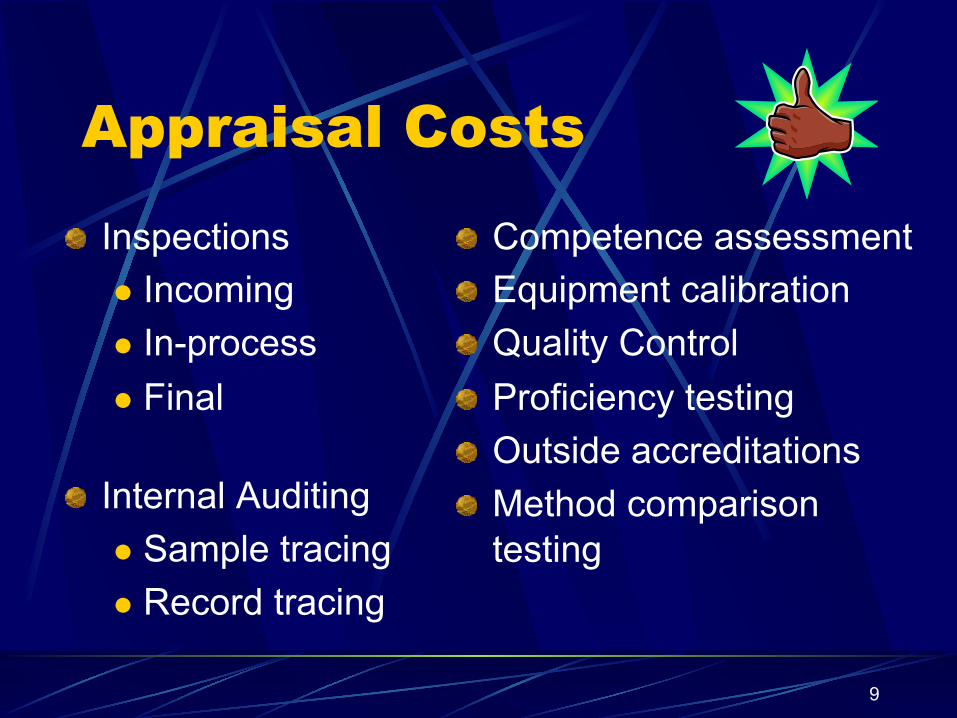
Appraisal Costs
! Inspections l Incoming l In-process l Final
! Internal Auditing
l Sample tracing l Record tracing
! Competence assessment ! Equipment calibration ! Quality Control ! Proficiency testing ! Outside accreditations ! Method comparison
testing

10
11
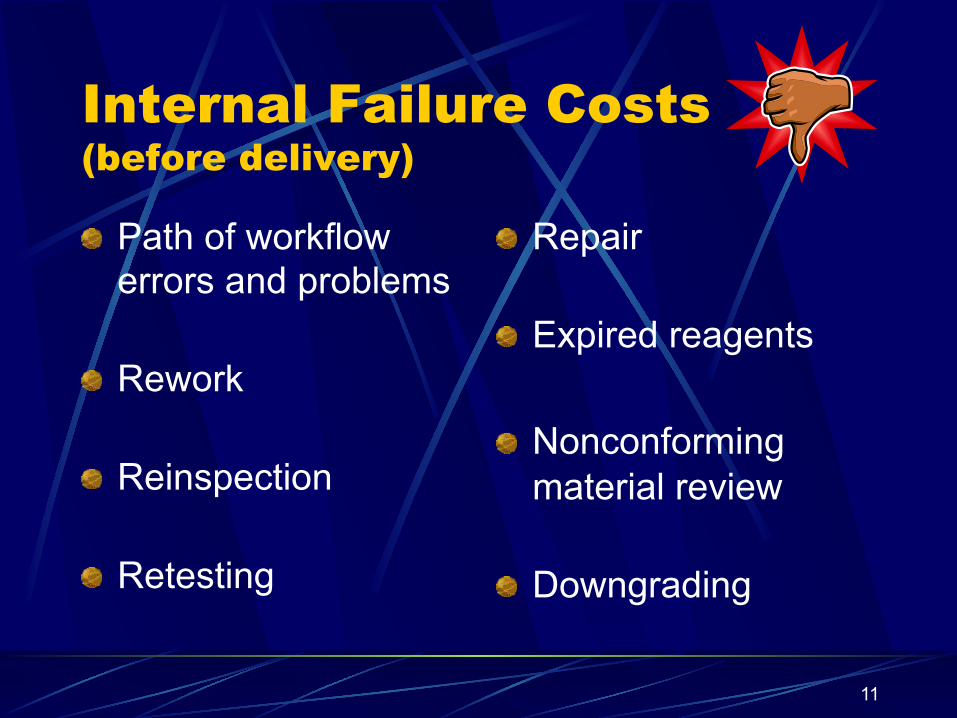
Internal Failure Costs (before delivery)
! Path of workflow errors and problems
! Rework
! Reinspection
! Retesting
! Repair
! Expired reagents
! Nonconforming material review
! Downgrading
12
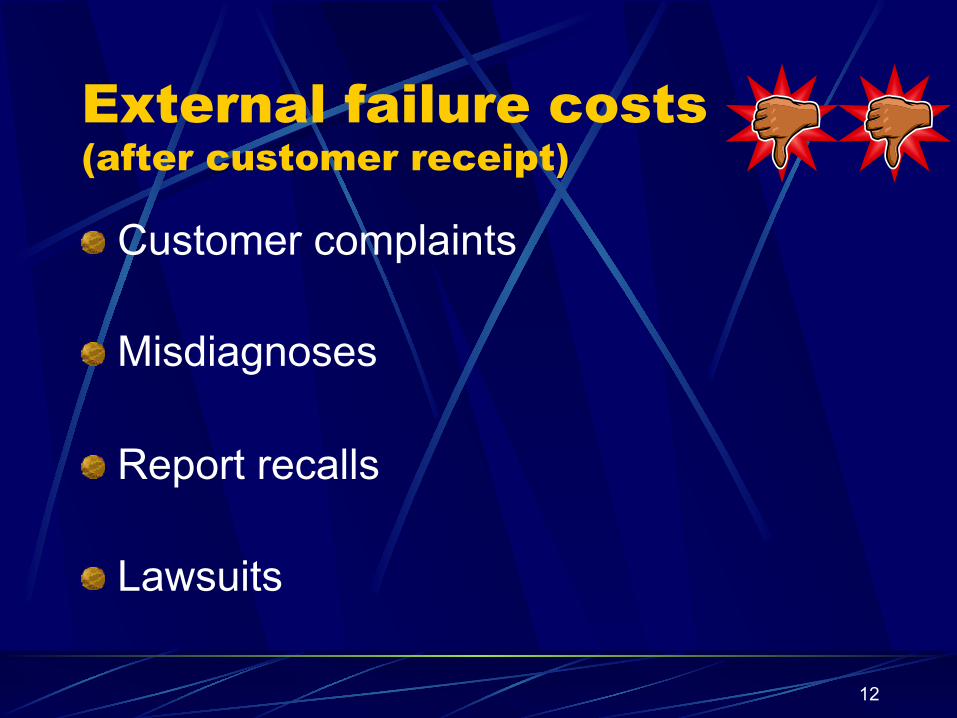
External failure costs (after customer receipt)
! Customer complaints
! Misdiagnoses
! Report recalls
! Lawsuits
13
14
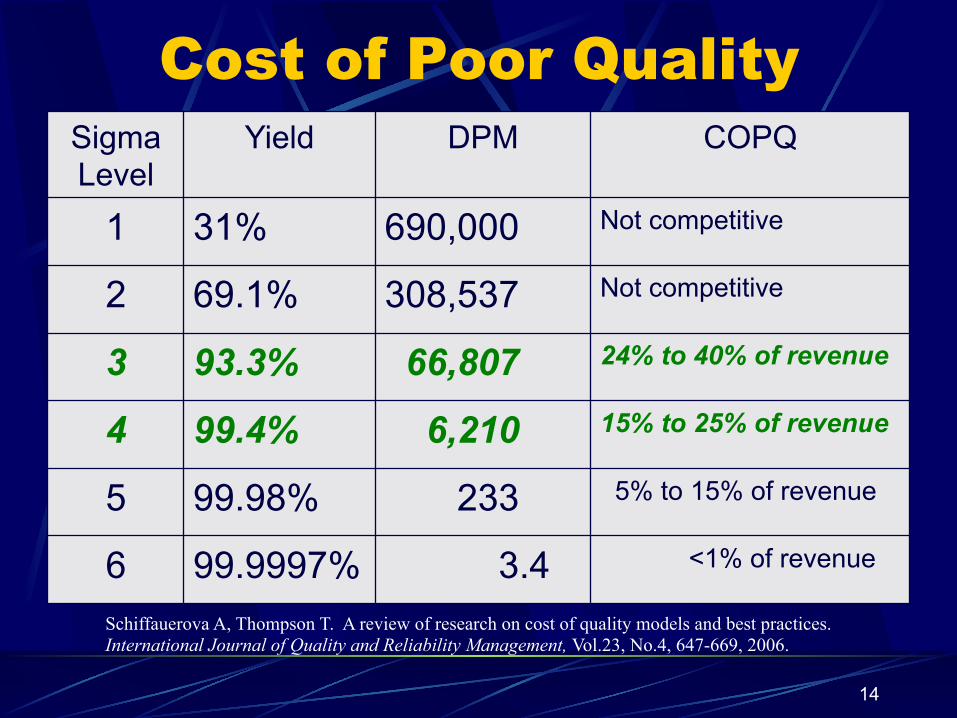
Cost of Poor Quality Sigma Level
Yield DPM COPQ
1 31% 690,000 Not competitive
2 69.1% 308,537 Not competitive
3 93.3% 66,807 24% to 40% of revenue
4 99.4% 6,210 15% to 25% of revenue
5 99.98% 233 5% to 15% of revenue
6 99.9997% 3.4 <1% of revenue
Schiffauerova A, Thompson T. A review of research on cost of quality models and best practices. International Journal of Quality and Reliability Management, Vol.23, No.4, 647-669, 2006.
15
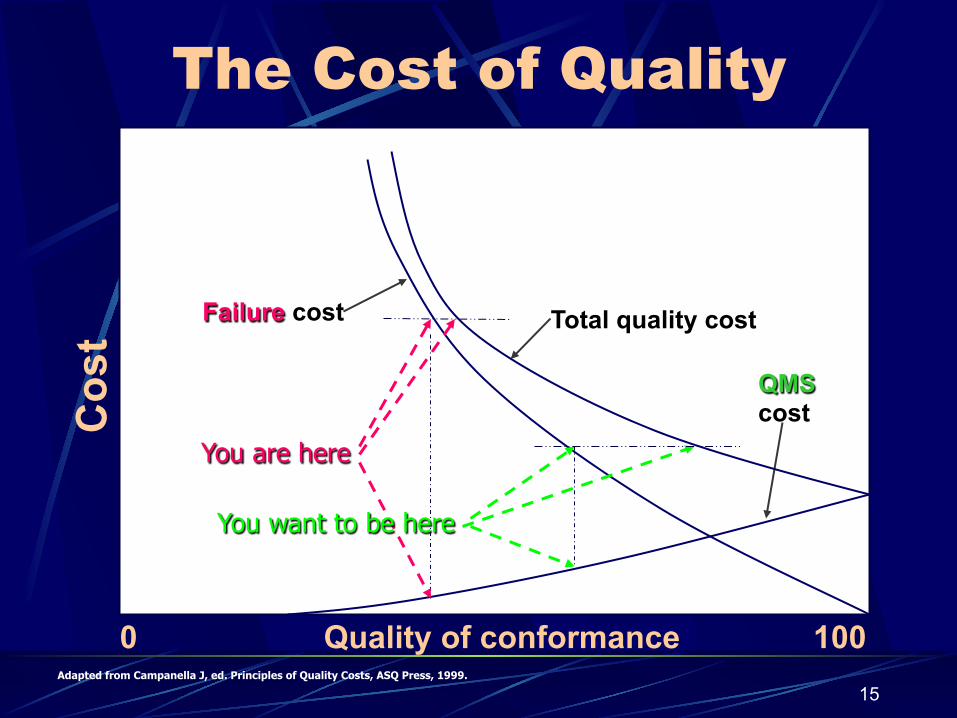
Cos
t
0 Quality of conformance 100
The Cost of Quality
Adapted from Campanella J, ed. Principles of Quality Costs, ASQ Press, 1999.
Failure cost
QMS cost
Total quality cost
You are here
You want to be here
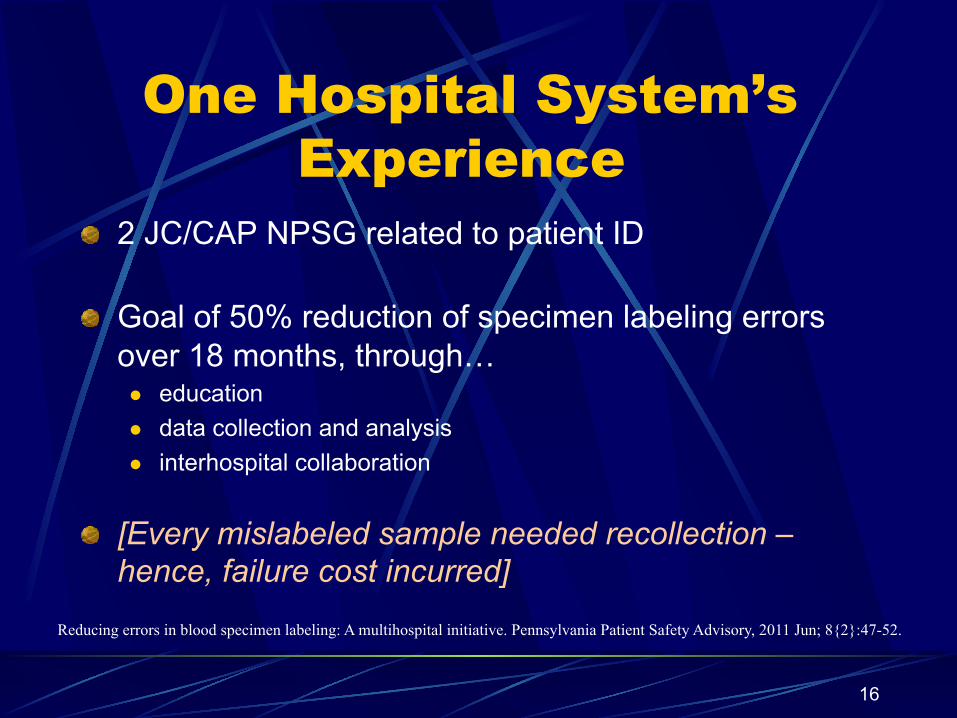
One Hospital System’s Experience
! 2 JC/CAP NPSG related to patient ID
! Goal of 50% reduction of specimen labeling errors over 18 months, through… l education l data collection and analysis l interhospital collaboration
! [Every mislabeled sample needed recollection – hence, failure cost incurred]
16
Reducing errors in blood specimen labeling: A multihospital initiative. Pennsylvania Patient Safety Advisory, 2011 Jun; 8{2}:47-52.
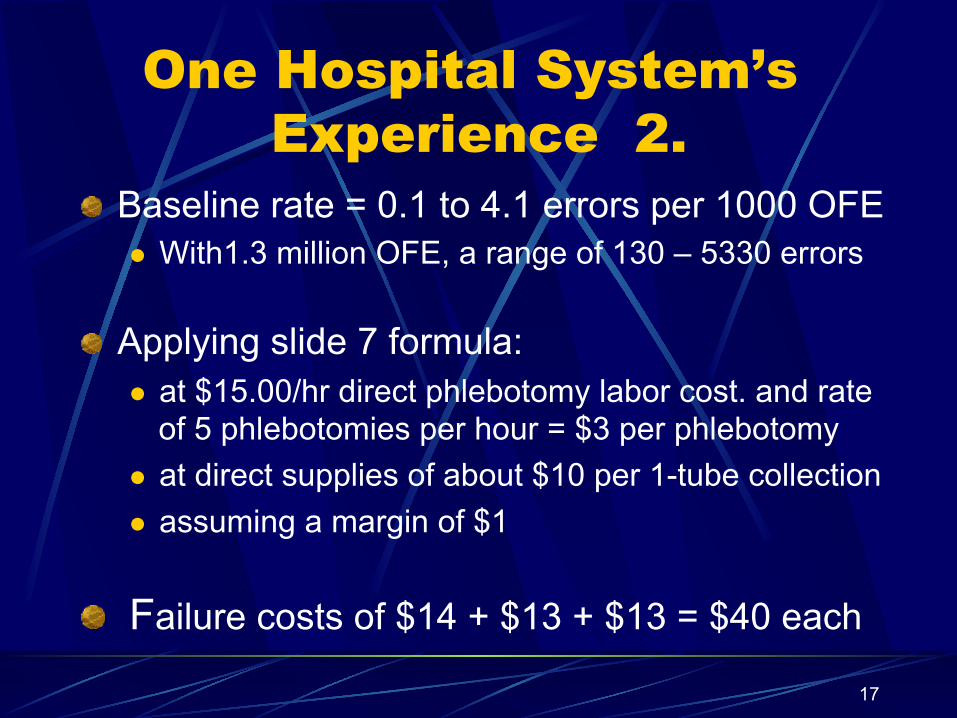
One Hospital System’s Experience 2.
! Baseline rate = 0.1 to 4.1 errors per 1000 OFE l With1.3 million OFE, a range of 130 – 5330 errors
! Applying slide 7 formula:
l at $15.00/hr direct phlebotomy labor cost. and rate of 5 phlebotomies per hour = $3 per phlebotomy
l at direct supplies of about $10 per 1-tube collection l assuming a margin of $1
! Failure costs of $14 + $13 + $13 = $40 each
17
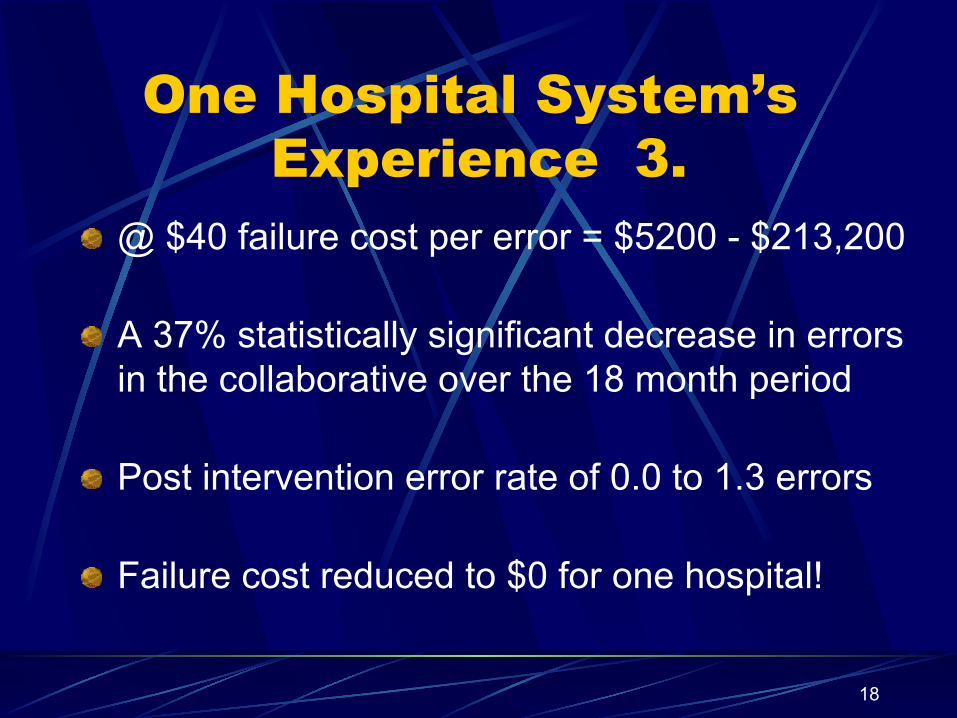
One Hospital System’s Experience 3.
! @ $40 failure cost per error = $5200 - $213,200
! A 37% statistically significant decrease in errors in the collaborative over the 18 month period
! Post intervention error rate of 0.0 to 1.3 errors
! Failure cost reduced to $0 for one hospital!
18
19
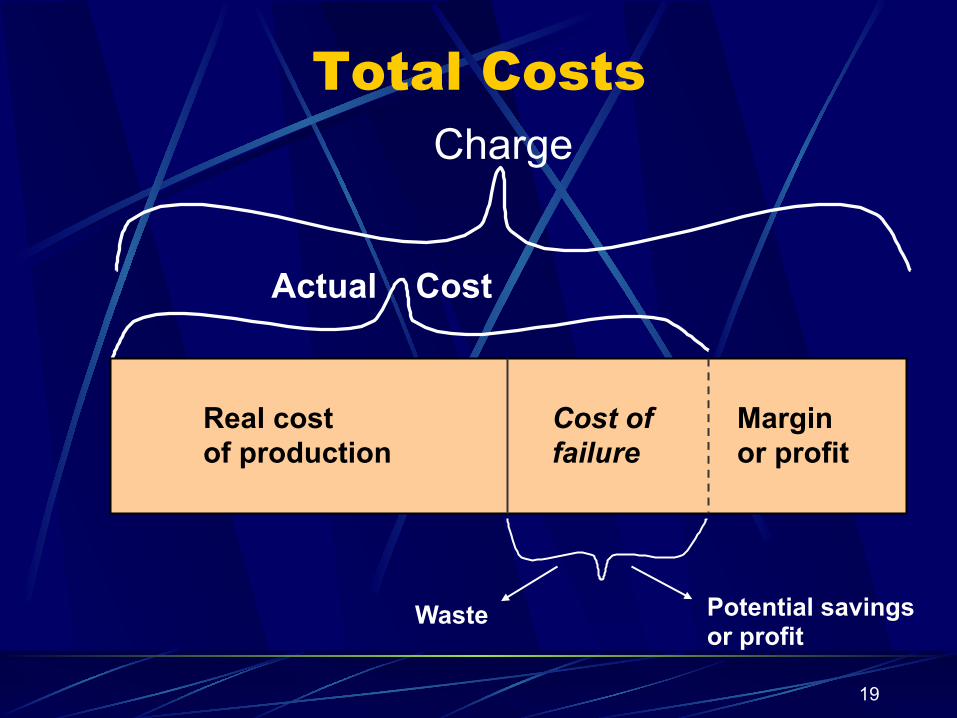
Total Costs
Actual Cost
Real cost of production
Cost of failure
Margin or profit
Waste Potential savings or profit
Charge

20
Key to Your Lab’s Survival
Real cost of production
Cost of failure
Margin or profit
Eliminate THIS !!
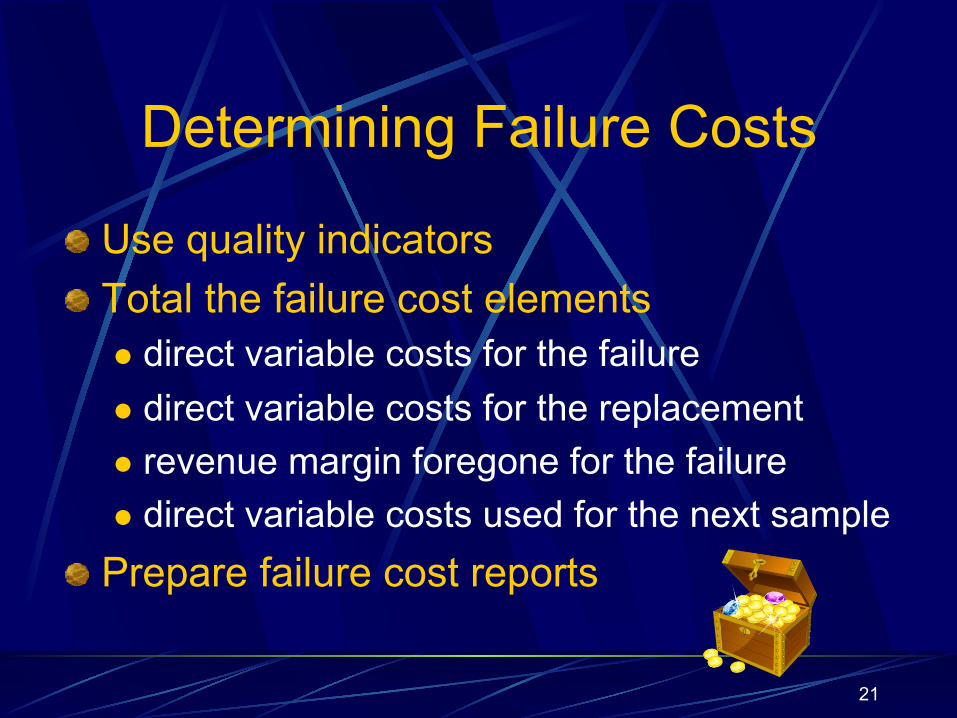
21
Determining Failure Costs
! Use quality indicators ! Total the failure cost elements
l direct variable costs for the failure l direct variable costs for the replacement l revenue margin foregone for the failure l direct variable costs used for the next sample
! Prepare failure cost reports
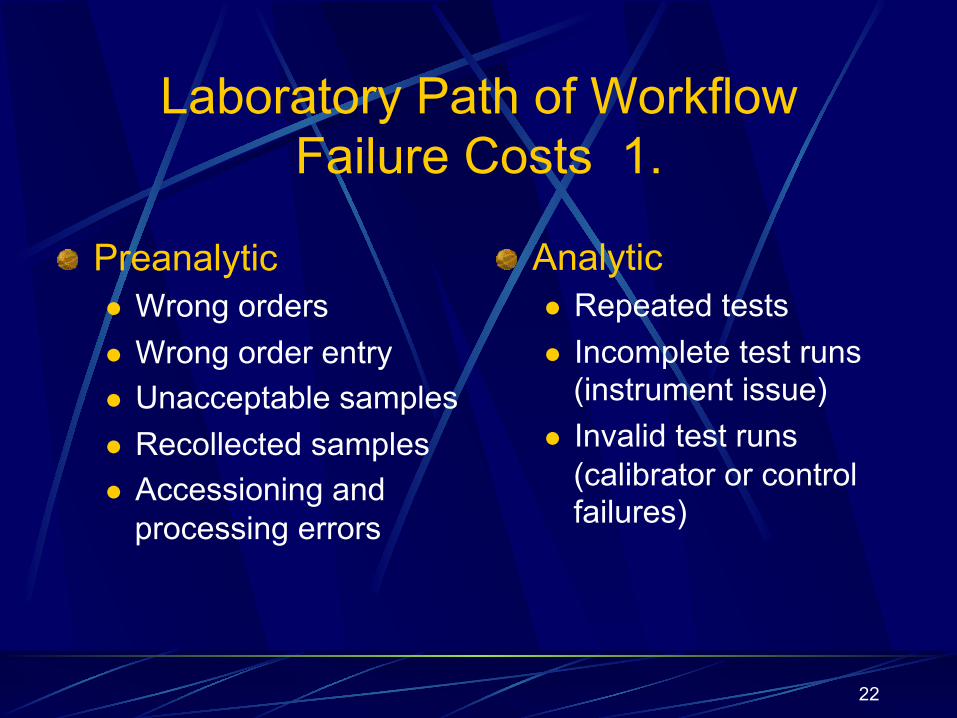
22
Laboratory Path of Workflow Failure Costs 1.
! Preanalytic l Wrong orders l Wrong order entry l Unacceptable samples l Recollected samples l Accessioning and
processing errors
! Analytic l Repeated tests l Incomplete test runs
(instrument issue) l Invalid test runs
(calibrator or control failures)

23
Laboratory Path of Workflow Failure Costs 2.
! Postanalytic l Result recalls l Reprinted reports l Redelivered reports l Remedial action on occurrences l Complaint resolution l Lawsuits

Management Infrastructure Failure Costs
! Forgone revenue from lost customers
! Lab safety accidents ! Staff turnover and
replacement ! Expired reagents and
supplies ! Overstock ! Equipment downtime
! LIS downtime ! TAT outliers ! Resolving document
problems ! Confidentiality violations ! Resolving system
interface issues ! Recurring NCE
“corrective actions”
24
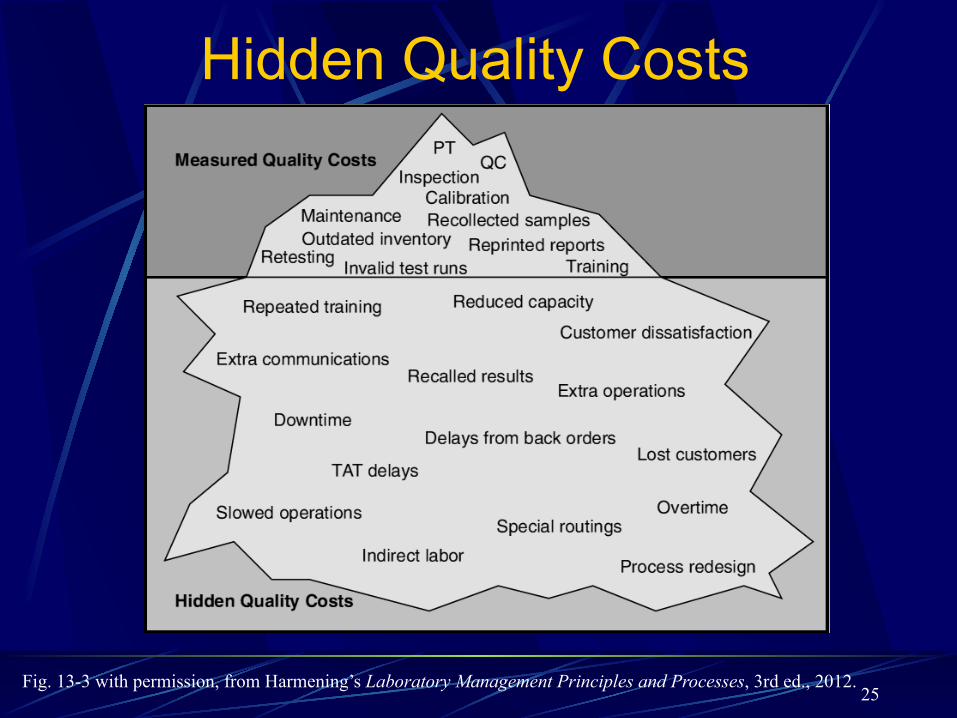
Hidden Quality Costs
25 Fig. 13-3 with permission, from Harmening’s Laboratory Management Principles and Processes, 3rd ed., 2012.

26
Quality-Based Costing Identifies
! Non-value-added activities to be eliminated
! Waste caused by poor quality
! Areas where financial performance can be improved
! Cost justification for needed corrective actions
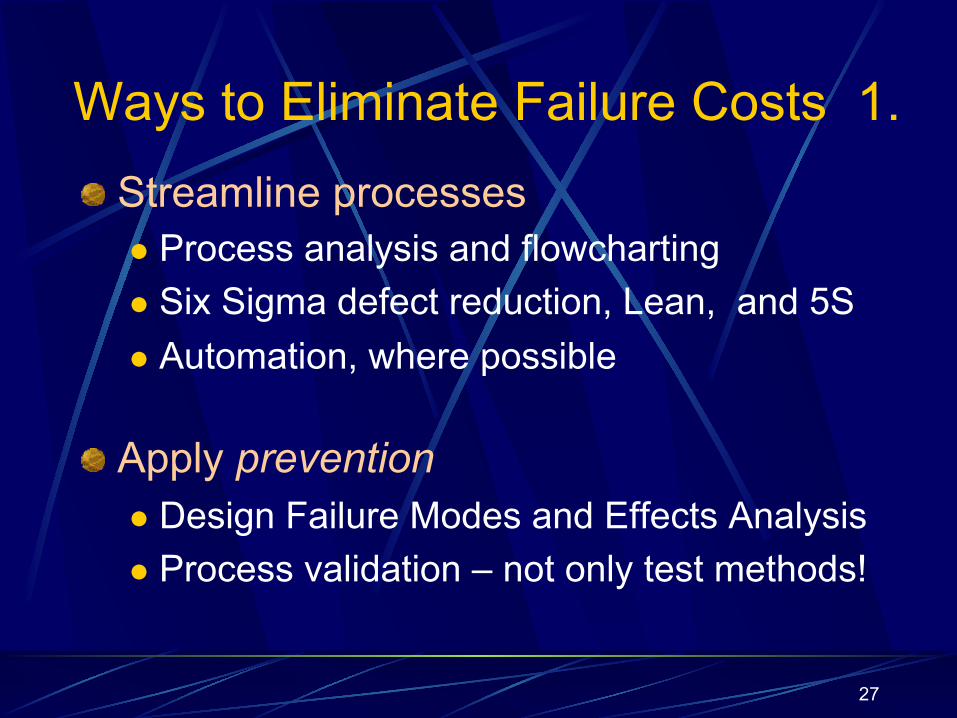
Ways to Eliminate Failure Costs 1. ! Streamline processes
l Process analysis and flowcharting l Six Sigma defect reduction, Lean, and 5S l Automation, where possible
! Apply prevention
l Design Failure Modes and Effects Analysis l Process validation – not only test methods!
27
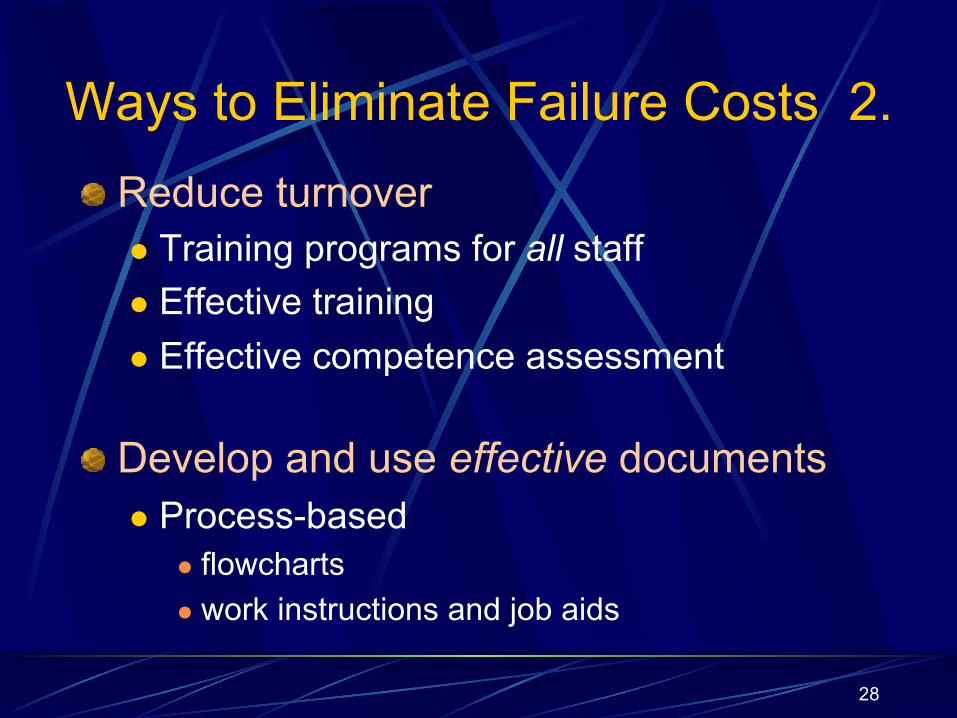
Ways to Eliminate Failure Costs 2. ! Reduce turnover
l Training programs for all staff l Effective training l Effective competence assessment
! Develop and use effective documents
l Process-based l flowcharts l work instructions and job aids
28
29
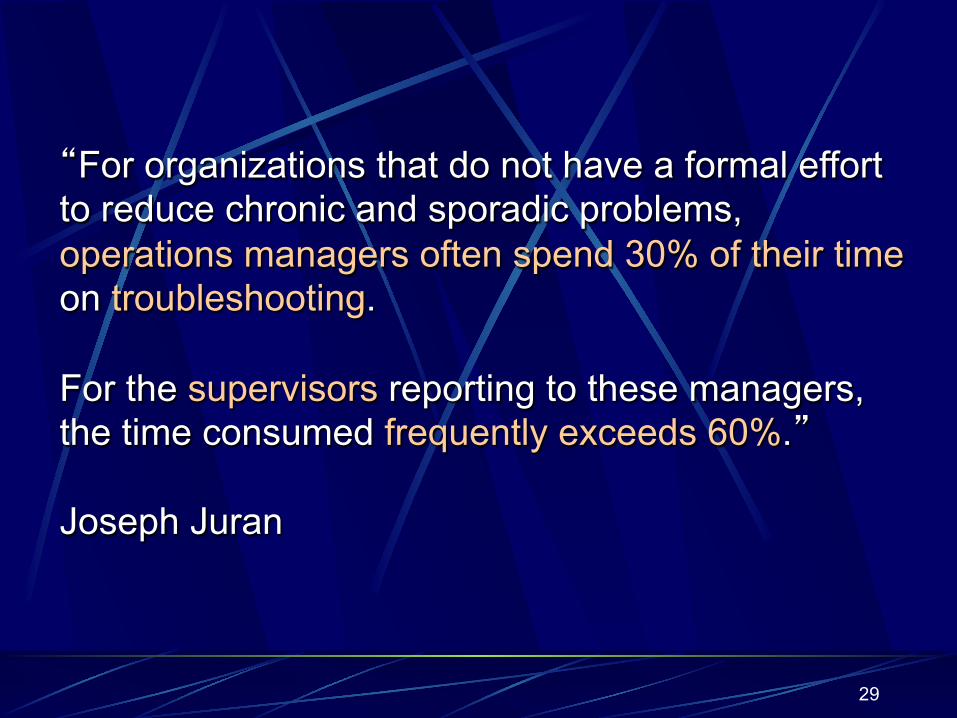
“For organizations that do not have a formal effort to reduce chronic and sporadic problems, operations managers often spend 30% of their time on troubleshooting. For the supervisors reporting to these managers, the time consumed frequently exceeds 60%.” Joseph Juran
30
What’s the cost of quality
in YOUR laboratory
?

Take Home Message #1
31
For each failure there is a root cause. Causes are preventable. Prevention is always cheaper.

Take Home Messages 2-8
! Know the 4 types of quality costs – P, A, IF, EF ! Identify P and A costs on your lab’s budget. ! Calculate IF and EF costs and prepare reports ! Invest in P and A to ê IF + EF ! Use RCA and CI to further ê A ! The language of the C-Suite is $$$$$$$
32

33
“Costs do not exist to be calculated.
Costs exist to be reduced.”
Taiichi Ohno
Final Message

Additional Resources ! Schiffauerova A, Thompson T.
A review of research on cost of quality models and best practices. International Journal of Quality and Reliability Management, Vol.23, No.4, 647-669, 2006.
! Reducing errors in blood specimen labeling: A multihospital initiative. Pennsylvania Patient Safety Advisory, 2011 Jun; 8{2}:47-52.
! Berte LM. The Cost of Quality. In: Harmening DM. Laboratory Management Principles and Processes, 3rd ed. St. Pete, FL, DH Publishing and Consulting, Inc. 2012.
! Wood DC, mng ed. Principles of Quality Costs, 4th ed. Milw, WI: ASQ Quality Press, 2013.
! Wood DC. The Executive Guide to Understanding and Implementing Quality Cost Programs. Milw, WI: ASQ Quality Press, 2007.
34