real-time urban regional route planning model for
TRANSCRIPT

Abstract: Advancement in the novel technology of connected vehicles has presented opportunities and challenges for smart urban transport and land use. To improve the capacity of urban transport and optimize land-use planning, a novel real-time regional route planning model based on vehicle to X communication (V2X) is presented in this paper. First, considering the traffic signal timing and phase information collected by V2X, road section resistance values are calculated dynamically based on real-time vehicular driving data. Second, according to the topology structure of the current regional road network, all predicted routes are listed based on the Dijkstra algorithm. Third, the predicted travel time of each alternative route is calculated, while the predicted route with the least travel time is selected as the optimal route. Finally, we design the test scenario with different traffic saturation levels and collect 150 sets of data to analyze the feasibility of the proposed method. The numerical results have shown that the average travel times calculated by the proposed optimal route are 8.97 seconds, 12.54 seconds, and 21.85 seconds, which are much shorter than the results of traditional navigation routes. This proposed model can be further applied to the whole urban traffic network and contribute to a greater transport and land-use efficiency in the future.
Keywords: Intelligent transportation system, vehicle to X communica-tion system (V2X), real-time route planning, connected vehicles(CV), dynamic traffic guidance
Real-time urban regional route planning model for connected vehicles based on V2X communication
Article history:Received: April 16, 2019Received in revised form: February 11, 2020 Accepted: February 20, 2020Available online: November 10, 2020
Copyright 2020 Pangwei Wang, Hui Deng, Juan Zhang & Mingfang Zhanghttp://dx.doi.org/10.5198/jtlu.2020.1598ISSN: 1938-7849 | Licensed under the Creative Commons Attribution – Noncommercial License 4.0
The Journal of Transport and Land Use is the official journal of the World Society for Transport and Land Use (WSTLUR) and is published and sponsored by the University of Minnesota Center for Transportation Studies.
T J T L U http://jtlu.orgV. 13 N. 1 [2020] pp. 517–538
Pangwei WangNorth China University of [email protected] Juan Zhang (corresponding author)University of [email protected]
Hui DengNorth China University of [email protected]
Mingfang ZhangNorth China University of [email protected]

518 JOURNAL OF TRANSPORT AND LAND USE 13.1
1 Introduction
Urban road congestion is a serious issue due to the increasing number of vehicles, meanwhile lack of accurate and efficient traffic guidance system is another significant reason. The current limited transport resources cannot support such oversaturated traffic flows because of inevitable traffic congestion which has a great influence on travelers not only in travel time increase, but also in economic loss (Yigitcanlar & Kamruzzaman, 2014; Ford, Dawson, Blythe, & Barr, 2018). Cervero analyzed the impacts that link urban transport to land use from cities development, vehicles intelligence, air quality, economy effects and traffic systems et al., which means the land-use pressure can be alleviated by design smart cities and transport systems to relieve congestion, cleanse the air and conserve energy (Cervero, 2013).
To solve the above problems, some scholars and researchers have designed intelligent route naviga-tion systems to optimize driving trajectories for smart vehicles, which usually consider the traffic flow and origin to destination (OD) information (Faisal, Yigitcanlar, Kamruzzaman, & Currie, 2019). These systems provide real-time traffic information and optimal routes for drivers with the aim of balancing the traffic flow of urban road networks and reducing the average delay of intersections. Route planning model is one of the core parts of route navigation systems, and also the premise of achieving the route guidance. Therefore, improving route planning models has a very important impact on the develop-ment of navigation systems and road traffic management (Jabbarpour, Zarrabi, Khokhar, Shamshire-band, & Choo, 2018).
The route planning model is usually established based on the optimal route algorithm, and an op-timal route is calculated dynamically based on the OD information in a regional road network. The op-timized standards include shortest travel distance, shortest travel time and minimum fuel consumption, etc. (Huang, Zhang, Shang, & Yu, 2017). Recently, many advanced approaches have been proposed to address the route planning problems. On the basis of a scale-free dynamic and stochastic network model, Yu, Li, and Wu (2010) defined the concept of shortest route and proposed a temporal ant colony optimization algorithm to search for the shortest routes in the network. Li, Wang, Gao, and He (2013) designed a model for dynamic route planning based on the optimized ant colony algorithm to achieve the purpose of distributing traffic flow in the network reasonably, the performance was more obvious in large-scale dynamic traffic networks. Wang, Li, Fang, and Li (2015) presented a multimeric ant col-ony optimization (MACO) algorithm to deal with intelligent traffic real-time route planning problems under the wireless sensor networks of intelligent transportation. This algorithm not only considered multiple factors of the road, but also dynamically adjusted the route planning according to real-time traffic situation. Considering typical insufficient planning methods caused by traditional route, Wang, Huang, Liu, and Zhang (2018) designed an improved A* algorithm for route-planning of two-wheeled self-balancing vehicles. In the proposed algorithm, a new heuristic function was presented to improve the efficiency of the route-planning of vehicles, and a dynamic weighting method for the evaluation function was proposed to balance the requirement between velocity and precise. These algorithms have many advantages, but they cannot satisfy the requirements of fast response for high-speed-large-scale applications. Therefore, some neural network architectures have been designed to address the planning problems (Wang & Qiao, 2010). Liu, Qiu, Qu, and Ji (2015) proposed a modified pulse coupled neural network model which topologically organized with only local lateral connections among neurons. The computational complexity of the algorithm hinges on the length of the shortest route with regardless of the number of existing routes in graphs. Unlike the traditional neural networks, Huang, Yan, Wang, and Wang (2017) proposed a time-delay neural network (TDNN) framework to solve the time-dependent shortest route problems.
Different from above literatures mainly focusing on planning algorithm, more traffic parameters

519Real-time urban regional route planning model for connected vehicles based on V2X communication
are taken into account to address the problems of route planning. Sen, Pillai, Joshi, and Rathi (2001) improved the traditional methods which did not consider travelers’ tolerance of travel time changes, and presented a novel multi-objective planning model based on mean and variance of travel time to provide travelers with routes that may have the least change in travel time to satisfy more practical needs. Ac-cording to the theory of stochastic advantage, Wu and Nie (2011) proposed a unified route selection method by which conservative or radical routes were calculated for travelers. Under this method, a risky behavior model with considering the actual needs and preferences of travelers was built. Xing and Zhou (2011) proposed a sampling-based method to dynamically construct the proxy objective function with multi-day travel time observations and used the sub-gradient algorithm to reduce the optimality gap to iteratively improve the quality of the planned routes. Chen et al. (2013) also studied the reliability of the predicted travel time in the route planning system, and used the multi-standard shortest route method to determine the reliable shortest route between origin and destination, which ensure the higher reliabil-ity of the provided route. Backfrieder, Ostermayer, and Mecklenbräuker (2016) designed a method of intelligent management for intelligent transportation network systems. It provided route suggestions to networked vehicles based on the minimum congestion prediction algorithm, and proved its effectiveness in the real scene through dynamic microscopic traffic simulation.
It can be seen from the above literatures, advanced route planning systems are inseparable from the support of massive real-time traffic data (Liu et al., 2016). However, under traditional methods of data collection, the traffic data are mainly obtained indirectly from sources such as videos, radars, detectors, floating vehicles, etc., which are deviated from the real scene to a certain extent, resulting in insufficient calculation accuracy and real-time performance (Zhu, Song, Wu, & Yu, 2016). Meanwhile, the traditional route planning system usually does not consider time taken by vehicles to steer under the influence of light control signals when it calculates the resistance weight of the road section. But in the actual urban road, the road resistance is obviously different by the influence of traffic signals (Qin, Feng, Sun, & Sun, 2015).
With the application of connected vehicles and V2X communication, more traffic data used in route planning model can be collected from connected vehicles, infrastructure, and other traffic sensors. V2X communication provides a new improvement scheme for a new route planning system that can obtain more abundant and accurate vehicles driving data (Wang, Chen, Chen, & Han, 2016; Wang, Yu, Xiao, & Wang, 2017). Therefore, a novel route planning model based on V2X for connected ve-hicles is proposed in this paper, which considers the urban traffic signal timing and phase. Then, an opti-mal route planning method is also proposed, which can obtain the regional optimal route. Furthermore, the model presented in this paper can provide technical support and theoretical basis for route planning problems to promote smart urban transport and land use.
The paper is organized as follows. Firstly, the architecture of the real-time route planning system in V2X communication and the contributions are introduced and highlighted in this paper respectively. Secondly, a route planning model integrating V2X-based road resistance calculation model and Dijkstra algorithm-based optimal route planning is formulated and solved for connected vehicles. Thirdly, the model is tested on the simulation platform with VISSIM/MATLAB. Finally, conclusions are summa-rized and future research directions are proposed.
2 Real-time route planning system for connected vehicles
The technology of connected vehicles can acquire multi-source data by V2V/V2I communication be-tween vehicles and roadside devices, replacing some data that cannot be obtained or only can be in-directly calculated in traditional methods. Besides, the data collected by connected vehicles has high real-time performance and accuracy. Dynamic route planning aims at reducing travel time and avoiding

520 JOURNAL OF TRANSPORT AND LAND USE 13.1
unnecessary driving distance, which requires support from a large amount of data. Therefore, applying the connected vehicles to route planning system can help to obtain the regional optimal route quickly. The details of route planning system are described from the perspectives of structure, characteristics, and processes.
Figure 1. Structure of connected vehicles
2.1 Structure of route planning system based on V2X communication
The real-time route planning system is designed based on V2X communication, and the structure of route planning system is shown as Figure 2. Remote servers are used to summarize the real-time road network information in urban region and to provide route planning services. On Board Units (OBUs) installed on vehicles can receive the vehicle data through the Controller Area Network (CAN) protocol from Electronic Control Units (ECUs). Road Side Units (RSUs) actively send information to establish V2I communication with OBUs. Then OBUs report the required statistical data to RSUs, and send a route planning request to remote servers. RSUs firstly calculate the travel time of each lane, according to the reported data from the same direction and the same period, then report the result to remote servers. Finally the received server returns the required information and instructions to OBUs in real-time on the basis of the travel time and the traffic signal information. As shown Figure 2, the roadside equip-ment of each intersection has the function of data summary and analysis between road network nodes and adjacent nodes, which contribute to a higher flexibility and more accuracy in real-time performance than the traditional background data processing.

521Real-time urban regional route planning model for connected vehicles based on V2X communication
Figure 2. Structure of route planning system based on V2X communication
2.2 Characteristics of route planning system based on V2X communication
To find the optimal route of the urban region, the travel time is selected as the road resistance weight by traditional dynamic route planning method. However, the time variation of the traffic state leads to the great change of road resistance weight. Therefore, in order to ensure accuracy, average travel time in a certain period is selected as the short-term prediction to represent the road resistance weight in tradi-tional method. Because the prediction results are always affected by different sampling intervals, under the influence of traffic signal. The vehicles’ travel time does not change continuously with the move-ment of the traffic wave, while it may suddenly increase because of phase switching. Thus, to guarantee the accuracy of route planning results, we select the optimal sampling interval in one signal cycle and predict the travel time of each vehicle and the signal status when the vehicle reaches the stop line. Precise predictions cannot be realized by traditional methods but the technology of connected vehicles provides the possibility to this system.

522 JOURNAL OF TRANSPORT AND LAND USE 13.1
Figure 3. Characteristics of route planning system based on V2X
The route planning method based on V2X communication described in this paper can further predict the signal control event at the intersection. The feature structure is shown in Figure 3, according to the data and instructions of intelligent roadside devices, the required time of the vehicle to the stop line can be calculated, and the signal timing will be predicted following the required time calculation. Thereby the time route resistance is calculated due to traffic signal control, then the exact predicted value of the whole road resistance of each vehicle can be obtained.
In summary, to improve the capacity of urban transport and optimize the land-use planning, com-pared with the traditional methods, there are three characteristics in this proposed route planning system of connected vehicles:
1. The road resistances are dynamically calculated with the consideration of the timing and the phase of traffic signal in urban intersections;
2. The travel time that influence the traffic channelization in different routes is calculated;3. The real-time traffic information of speed, spacing, queue and saturation are all collected based
on V2X communication.
2.3 The process of route planning for connected vehicles
During the process of route planning, traditional methods can dynamically predict the optimal routes by considering the travel time and traffic flow. However, once there is any emergency existing in an intersection, the subsequent predictions may be incorrect. So traditional method is difficult to solve the real-time routes with multiple intersections because of the computational complexity of random events. To improve the accuracy of route planning, we present the hierarchical optimization strategy for connected vehicles to reduce the computational complexity and improve the reliability of predicted results. The whole process is shown in Figure 4 and the flow chart is shown in Figure 5.
The main steps are described as follows:1. OBUs equipped in connected vehicles send the optimal route request and OD information to
the remote server, and then wait for the sort results subsequently;2. The remote server calculates the global optimal route according to the OD information and the
road network information of RSUs, and then selects two routes with the minimum travel time as alternative routes which are shown as yellow and blue lines in Figure 4;
3. The remote server finds the overlapped sections (or nodes) of the two routes and mark them as public sections, which is shown as green line in Figure 4. Thus, two alternative sections between

523Real-time urban regional route planning model for connected vehicles based on V2X communication
node 1 and node 2, node 3 and destination D (two phases) are obtained;4. The optimal planned route is sent to OBUs, connected vehicles will drive along the designated
route until they enter the alternative section (node 1 to node 2) at the next intersection which can be determined by the traffic data collected from GPS and V2X communication;
5. OBUs send the regional optimal route planning request to the remote server. The remote server calculates the travel time of the two alternative routes respectively considering the influence of timing, phase and channelization, then returns the route with the minimum travel time of the two routes to OBUs.
6. After vehicles have left from node 2, the optimal route from node 2 to position D is recalculated, and the process of 2-6 is repeated until the vehicle reaches the destination D.
The key idea of this proposed model is established based on the data of traffic signals. These data are collected from V2X communication which is provided by the technology of connected vehicles. With the model we further compare multiple routes with similar travel time given by the global algorithm. Considering the impact of traffic signal, all of the selected routes are sorted and the optimal route for current urban region is gradually calculated in our research.
Figure 4. Process of route planning method for connected vehicles

524 JOURNAL OF TRANSPORT AND LAND USE 13.1
Figure 5. Flow chart of route planning method for connected vehicles
3 Route planning model considering traffic signal
Based on the above route planning strategy, a new road resistance calculation method considering the traffic signal is established in this section. The obtained optimal route according to the regional road network topology and details about the route planning model are described as follows:
3.1 Dynamic data interactive method based on V2X communication
To determine the road resistance value of each lane, it is necessary to ensure that the dynamic vehicle data used to calculate the travel time are differentiated according to vehicles’ driving direction. There-fore, the road is divided into two parts: road section and intersection area, which is shown in Figure 6. From this division method, the steering direction is determined after the vehicle going through the intersection area, then the final vehicle driving data will be uploaded to RSUs through V2X network and recorded in dataset of the specified steering direction.
RSUs equipped in intersections can not only establish V2X communication with connected ve-hicles which are driving in current road section, but also broadcast the positioning range of the intersec-tion area. Connected vehicles decide whether enter or leave the intersection by comparing the location information of the intersection and the GPS data, then upload the required data to the specific position. Driving process of vehicles on each road is shown in Figure 6, in which four key position nodes of A, B, C and D are marked: Position A indicates that the vehicle has not entered the road yet, and the diving data recorded in the vehicle still belongs to upstream road section. Position B represents that the vehicle has just left the intersection area of the upstream node, completed the data interactive process with previous RSU, and started to record the driving data again. Position C means that the vehicle enters intersection area from road section, meanwhile it informs RSU ready to receive vehicle data, then the RSU records the vehicle ID in the database. Position D represents that the vehicle is moving away from

525Real-time urban regional route planning model for connected vehicles based on V2X communication
the intersection area, and the driving data used to calculate the real-time road resistance value between point B and point D is sent to the RSU, at the same time the vehicle starts to record the data of next road section.
Figure 6. Division of two-phase communication process
In this V2X communication system, RSUs are used to collect traffic information to calculate road
resistances. There are mainly three functions of RSUs described as follows:1. Data collected: RSUs are connected to traffic signal controllers to read the information of timing
and phase and collect the vehicle driving data in current road section by V2X communication.2. Data sorted: The steering is judged based on the position when vehicle enters (Figure 6, point C)
and exits (Figure 6, point D) intersections, then the steering data can be stored to the appropriate database.
3. Data selected: RSUs filter abnormal data according to road static characteristics and vehicle dynamic data, such as the distance traveled by the vehicle that is much longer than the road length.
After received traffic data from RSUs, OBUs will read and upload the driving data for the calcula-tion of road resistance values. A group of data will be recorded for each steering road section, and the final data summarized by RSUs is shown in Table 1.
From the above description, we can know that travel distances are the constant data recorded in OBUs, RSUs can obtain the information of traffic signal and calculate the average speed and queue ac-cording to the V2X data.
Table 1. Communication data of OBUs and RSUs
Data name Data meaning
Average speed v Average speed of all vehicles on the road section in a certain time
Average number of queued vehicles N
The average number of queued vehicles per cycle on the road section in a certain time
Signal control cycle C The signal control cycle of intersection
Start time of green phase Ps The green light starts time of the phase in the signal cycle
Duration of green phase Pd The green light duration of the phase in the signal cycle
Control time of current signal c It is now in the second of signal control
IntersectionRoad sectionarea

526 JOURNAL OF TRANSPORT AND LAND USE 13.1
3.2 Road resistance calculation method based on V2X
The road resistance in this route planning system is a microscopic variable, which especially means the predicting travel time from the road section (Figure 6, position B) to the intersection (Figure 6, position D). Therefore, the road resistance values are different for each vehicle in the free-flowing traffic.
A trajectory diagram of a group of 6 connected vehicles driving into a road section is shown in Figure 6. The horizontal axis represents the time which equals to a signal control cycle of the down-stream intersection. The vertical axis indicates the length of the road section, where the green trajectory indicates the constant speed driving process, the yellow trajectory means the acceleration or deceleration driving process, and the red trajectory implies the parking process. The driving speeds of six vehicles are similar but the road resistance values are quite different due to the influence of signal control and queues.
To improve the fault tolerance of this method, the yellow light time in the signal control is counted in the red light time. The signal control cycle � of the downstream intersection beginning at the red light can be expressed as:
(1)
where TRx is red light time during current signal cycle, TGx is green light time. The upper corners �=��� are indicated as left, straight and right respectively. If the right turn is not limited to TRR = 0 , we can conclude TRL = TRS , TGL = TGS for the two-phase control intersection.
cix is the moment when the vehicle enters the road, v is the average speed, cox is the signal control cycle, and it is calculated in Equation (2) when there is no queue or deceleration in the whole process:
(2)
If cox < TRX , the vehicle will stop during red time; if cox > TRX, there is a dissipation process for queued vehicles. Three cases are divided as shown in Figure 7:
Without considering the situation of secondary queue, the green light timeTGX can be expressed as:
(3)
where T1X is the time of queue dissipating, T2X is the affected time of following vehicles, and T3X is the unaffected time for the following vehicles.
Thus, three cases for the calculation of the road resistance value can be shown as follows:
(4)

527Real-time urban regional route planning model for connected vehicles based on V2X communication
Figure 7. Three situations in road resistance calculation
To determine the value of T1X and T2X , the number of queued vehicles need to be judged at the intersection. Considering the continuity of the traffic state in absence of emergencies, the values will be calculated by RSUs according to the average number of queued vehicles N in the last two signal control cycles.
The time T1X can be calculated in Equation (5) :
(5)
where TxX is the vehicles’ queue time, TpX is the time of queued vehicles required to leave the intersection.According to the kinematic formula, the time TxX is calculated as follows:
(6)
where a is the acceleration of the vehicle, dp is the queued vehicles’ spacing, dg is the driving vehicles’ spacing, and N is the maximum number of queued vehicles.
In the process of queuing dissipation, the last queued vehicle starts to accelerate until the average speed of the road section reaches v . According to the actual queue length, there can be two situations.
If 2a (N - 1) (dp + d1 ) ≤ v2, where d1 is the length of the vehicle. The vehicle accelerates to pass through the intersection, and the time required to pass through the intersection TpX is defined as follows:
(7)
If 2a (N - 1) (dp + d1 ) > v2, the vehicle accelerates at first and then passes through the intersection
528 JOURNAL OF TRANSPORT AND LAND USE 13.1
at a constant speed, the time required to pass through the intersection TpX is defined as:
(8)
It can be seen that the value T1X under the current predicted queue length can be calculated based on the actual situation.
During the T2X phase, the vehicle will decelerate instead of stopping in road sections, because the vehicle in front is still in the process of not starting or slow acceleration. Suppose that a certain vehicle in the lane is numbered N + 1, under critical conditions, the speed will decelerate to 0 and then accelerate, the duration T2X can be regarded as the delay time caused by the deceleration behavior of the vehicle. The process of acceleration and deceleration are the uniform variable motions, so the average speed during the variable process is 0.5v , the maximum delay time T2X can be expressed as:
(9)
According to T1X, T2X , Equation (4) can be used to demonstrate the driving state of vehicles after entering the road section at any ciX time.
When the current direction of the intersection is not a right turn, there may be a queue at the in-tersection with the length of the queue S as:
(10)
where ci1X , ci2X , ci3X are divided points when the vehicle arrives at the intersection at the time of traffic signal located at coX = TRX + T1X , coX = TRX + T1X + T2X and coX = TRX + T1X + T2X + T3X respectively. Therefore, the constant speed and deceleration process of the vehicle can be modeled as:
(11)
(12)
(13)
For a complete signal control cycle C, if the entry time of the upstream intersection ciX is between ci1X and ci2X, case 2 will be encountered at the intersection; if ciX is between ci2X and ci3X, case 3 will be encountered; otherwise, case 1 will be encountered.
The specific exit time co1X, co2X and co3X of the vehicle entering the road section in three cases are calculated respectively. For case 3, without queuing and deceleration, Equation (2) represents the calcu-lation method of exit time. For the other two cases, the specific deceleration process in case 2 and the specific queue order n in case 1 shown in Equation (14) need to be calculated. In this case, the decelera-tion time and the queue order can be predicted by the proportion of the vehicle’s driving time ciX to the total duration:

529Real-time urban regional route planning model for connected vehicles based on V2X communication
(14)
(15)
(16)
Therefore, based on the time of upstream driving entry ciX and the vehicle exit coX, the current road resistance value �k can be calculated as Equation (17):
(17)
For a whole route with multiple intersections, the calculation result of the previous road section �k can be used as an input to iterate into the solution process of the next road section, so that the road resistance value of the current complete route will be computed. Therefore, the calculation method of the road resistance value based on V2X will be realized.
3.3 Optimal route planning method based on Dijkstra algorithm
Once the road networks covered by the actual connected vehicles after the OD points are selected, the regional road network model can be established according to the actual road network node. The process is shown in Figure 8:
Figure 8. Road network model established based on V2X
The intersection in the road network is defined as a network node, and the road between any two intersections represents the edge connected with two nodes. The weight of the edge is provided by the road network. Then the road network can be represented as a weighted directed graph G = (V, E), where

530 JOURNAL OF TRANSPORT AND LAND USE 13.1
V= {v1, v2, L vⁿ } is the set of nodes, E= {e1, e2, L em } is the set of edges, the edge indicates that the cur-rent road segment vi and vj are any two points in the graph , Rij as the road resistance value is denoted from node vi to node vj . Rij is the weight of the current road segment if there is an edge from vi to vj, otherwise, Rij = ∞. Z is denoted as the set of all feasible routes where Z ={ λ1, λ2, L λⁿ }, then the final optimal route is calculated based on Dijkstra algorithm (Ciesielski, Falcão, & Miranda, 2018; Galán-García, Aguilera-Venegas, & Rodriguez-cielos, 2015). The specific steps are stated as follows:
We defined two label types T (temporary label) and P (permanent label), where label P indicates the shortest route right from node vo to node vi , and label T indicates the upper limit value of the estimated route weight from node vo to node vi . The data set � is defined to store the route resistance values from the starting point vo to each node, and then the data set � is defined to store all the nodes with the lowest resistance value vo.
Step 1: All nodes are labeled as T at the beginning, where T(vi )= ∞. The original point vo is la-beled as P when started the route planning, where P(vo) = 0. Initially, the data set A = {Ro} and the data set � only have a starting point vo , where P={vo}.
Step 2: The node vi with the lowest resistance value of node vo is selected, then it is re-marked as label P, meanwhile it is added to data set � . At this time, A = {Ro , Roi } , P = { vo , vi }.
Step 3: For the node vi , labeled P need to be considered whether exist such a point vj which be-longs to the data set �, then vj is labeled as T. If there is an existing node vj , it will be defined as follows:
(18)
When there is an additional node vⁿ which can reach node vj , we will compare the road resistance values of both two routes. If Riⁿ + Rⁿj < Rij , the route vo → vi → vⁿ → vj is the better one, otherwise vo → vi → vj is the better route. When arriving at node vj through other nodes vk , the data set � and � can be defined as follows:
(19)
(20)
Step 4: When all the rest nodes labeled T are replaced, the lowest resistance value of node vj is remarked as P:
(21)
If more than two minimum values exist, any one of them can be selected and remarked as P. The calculation process will be finished until the destination note vd is labeled as P. At this time, the data set

531Real-time urban regional route planning model for connected vehicles based on V2X communication
is redefined as A = {Ro , Roi , L , Rij , L , Rjd } , P = {vo , vi , L , vj , L , vd }. The optimal route λ ( λ ϵ Z ) from the origin to destination can be described as:
(22)
Then the total road resistance value of the optimal route R(λ) can be calculated as follows:
(23)
Finally, the optimal route in the current urban regional road network based on V2X has the small-est road resistance value in all data sets of feasible routes:
(24)
4 Simulation results and data analysis
4.1 Scenario test and data collection
In this section, an urban regional road network in Beijing is selected for model verification. The position OD is selected from Bajiao East Street West Station to shidai Garden South Road. According to the route planning model mentioned in section 3, all feasible routes are calculated as shown in Figure 9, and the final route details are shown in Table 2. The whole experimental process is divided into three stages: 6:00-8:00, 8:00-10:00, 10:00-12:00. At the same time, the route planning result is compared with the routes calculated by an existing navigation system.
Figure 9. Feasible routes in test scenario
532 JOURNAL OF TRANSPORT AND LAND USE 13.1
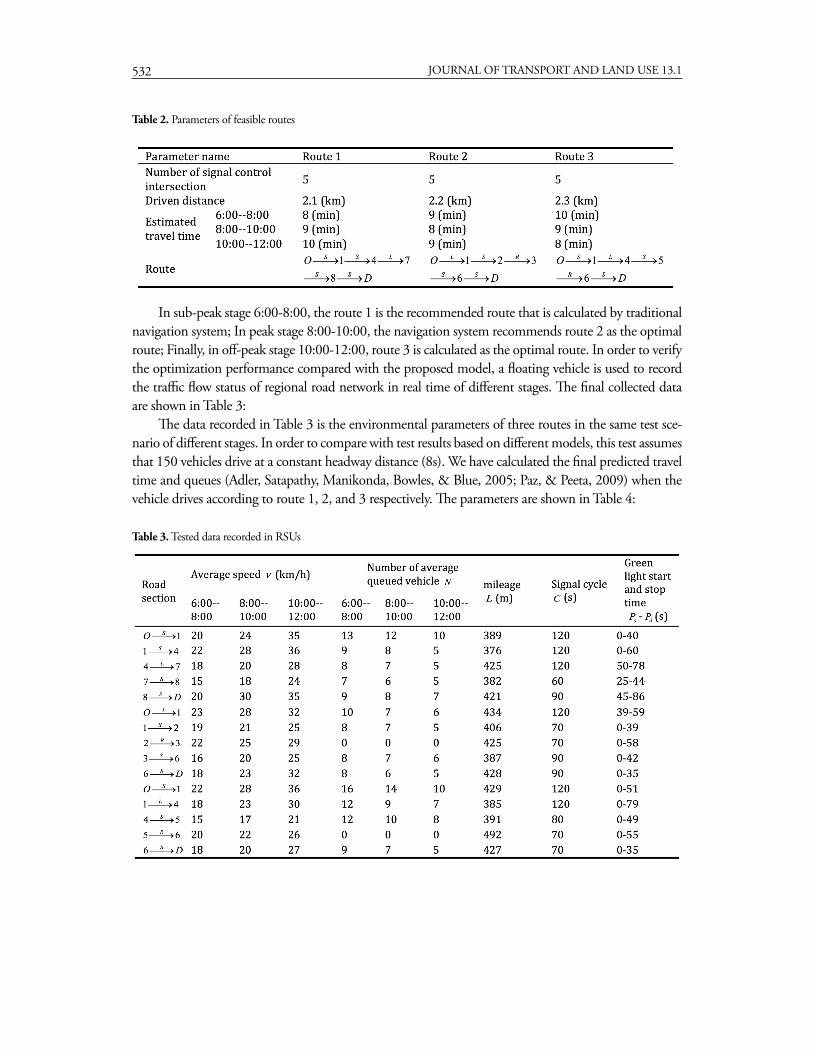
Table 2. Parameters of feasible routes
In sub-peak stage 6:00-8:00, the route 1 is the recommended route that is calculated by traditional navigation system; In peak stage 8:00-10:00, the navigation system recommends route 2 as the optimal route; Finally, in off-peak stage 10:00-12:00, route 3 is calculated as the optimal route. In order to verify the optimization performance compared with the proposed model, a floating vehicle is used to record the traffic flow status of regional road network in real time of different stages. The final collected data are shown in Table 3:
The data recorded in Table 3 is the environmental parameters of three routes in the same test sce-nario of different stages. In order to compare with test results based on different models, this test assumes that 150 vehicles drive at a constant headway distance (8s). We have calculated the final predicted travel time and queues (Adler, Satapathy, Manikonda, Bowles, & Blue, 2005; Paz, & Peeta, 2009) when the vehicle drives according to route 1, 2, and 3 respectively. The parameters are shown in Table 4:
Table 3. Tested data recorded in RSUs

533Real-time urban regional route planning model for connected vehicles based on V2X communication
Table 4. Parameters of connected vehicles
Parameter Value
a 3 (m/s2)
dl 4.3 (m)
dp 0.5 (m)
dg 6 (m)
4.2 Test results analysis
For vehicles drive at different stages, the final calculation results are shown in Figures 10, 11 and 12. We can figure out that the travel time of the adjacent vehicles may have a large difference even from the same starting point O due to the influence of signal control, which leads to the difference of the optimal route selection. It can be seen from the experimental results of the predicted travel time of three routes, this proposed method recommends the same optimal route with the navigation system in most cases. However, the travel time of the route recommended by the proposed method is shorter than that routes recommended by navigation methods in rare cases.
(a) Calculation results of travel time
(b) Calculation results of number of queues
Figure 10. Experimental results during 6:00 to 8:00

534 JOURNAL OF TRANSPORT AND LAND USE 13.1
(a) Calculation results of travel time
(b) Calculation results of number of queues
Figure 11. Experimental results during 8:00 to 10:00

535Real-time urban regional route planning model for connected vehicles based on V2X communication
(a) Calculation results of travel time
(b) Calculation results of number of queues
Figure 12. Experimental results during 10:00 to 12:00
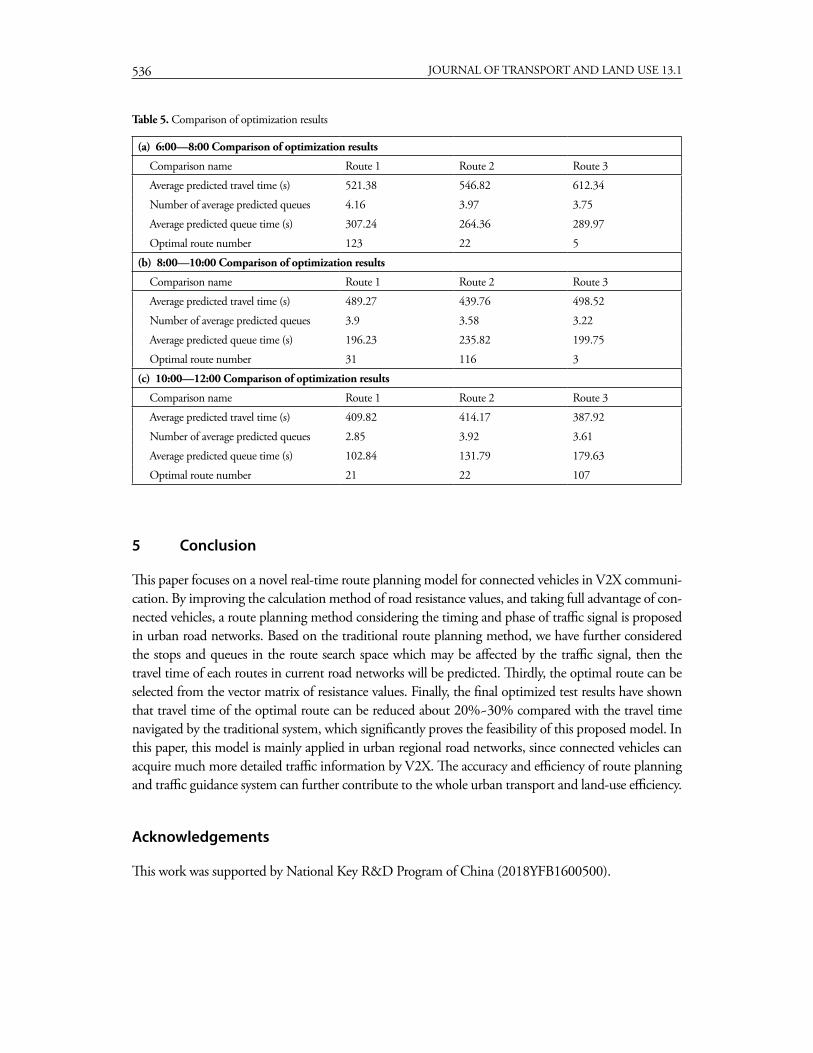
By comparing and analyzing the experimental results of three routes, the final tested data is shown
in Table 5. It can be seen that the optimization performance in off-peak stage is better than that in peak stage. During 6:00-8:00, although the average predicted travel time for route 1 is better than the other two routes, there are also 27 results indicating that route 1 is not the best choice, which can be optimized by this proposed method. During 8:00-10:00, although the average predicted travel time of route 2 is the best one, there are 34 results indicate that route 2 is not. During 10:00-12:00, the average predicted travel time of route 3 is better than the other two routes, and 43 results indicate that route 3 is not the best one. If the vehicle follows the optimal route provided by this method in this paper, the travel time can be further optimized about 18%, 23%, and 29%, respectively. By further calculation, in the 150 sets of experiments, the average travel time of the optimal route calculated by this method in different stages are 8.97 seconds, 12.54 seconds and 21.85 seconds, which are shorter than the recommended route by the traditional navigation system. These results prove the effectiveness of the route planning method.
536 JOURNAL OF TRANSPORT AND LAND USE 13.1
Table 5. Comparison of optimization results
(a) 6:00—8:00 Comparison of optimization results
Comparison name Route 1 Route 2 Route 3
Average predicted travel time (s) 521.38 546.82 612.34
Number of average predicted queues 4.16 3.97 3.75
Average predicted queue time (s) 307.24 264.36 289.97
Optimal route number 123 22 5
(b) 8:00—10:00 Comparison of optimization results
Comparison name Route 1 Route 2 Route 3
Average predicted travel time (s) 489.27 439.76 498.52
Number of average predicted queues 3.9 3.58 3.22
Average predicted queue time (s) 196.23 235.82 199.75
Optimal route number 31 116 3
(c) 10:00—12:00 Comparison of optimization results
Comparison name Route 1 Route 2 Route 3
Average predicted travel time (s) 409.82 414.17 387.92
Number of average predicted queues 2.85 3.92 3.61
Average predicted queue time (s) 102.84 131.79 179.63
Optimal route number 21 22 107
5 Conclusion
This paper focuses on a novel real-time route planning model for connected vehicles in V2X communi-cation. By improving the calculation method of road resistance values, and taking full advantage of con-nected vehicles, a route planning method considering the timing and phase of traffic signal is proposed in urban road networks. Based on the traditional route planning method, we have further considered the stops and queues in the route search space which may be affected by the traffic signal, then the travel time of each routes in current road networks will be predicted. Thirdly, the optimal route can be selected from the vector matrix of resistance values. Finally, the final optimized test results have shown that travel time of the optimal route can be reduced about 20%~30% compared with the travel time navigated by the traditional system, which significantly proves the feasibility of this proposed model. In this paper, this model is mainly applied in urban regional road networks, since connected vehicles can acquire much more detailed traffic information by V2X. The accuracy and efficiency of route planning and traffic guidance system can further contribute to the whole urban transport and land-use efficiency.
Acknowledgements
This work was supported by National Key R&D Program of China (2018YFB1600500).

537Real-time urban regional route planning model for connected vehicles based on V2X communication
References
Adler, J. L., Satapathy, G., Manikonda, V., Bowles, B., & Blue, V. J. (2005). A multi-agent approach to cooperative traffic management and route guidance. Transportation Research Part B: Methodological, 39(4), 297–318. https://doi.org.10.1016/j.trb.2004.03.005
Backfrieder, C., Ostermayer, G., & Mecklenbräuker, C. F. (2016). Increased traffic flow through node-based bottleneck prediction and v2x communication. IEEE Transactions on Intelligent Transportation Systems, 18(2), 349–363. https://doi.org.10.1109/tits.2016. 2573292
Cervero, R. (2013). Linking urban transport and land use in developing countries. Journal of Transport and Land Use, 6(1), 7–24. https://doi.org.10. 5198/jtlu.v6i1.425
Chen, B. Y., Lam, W. H., Sumalee, A., Li, Q., Shao, H., & Fang, Z. (2013). Finding reliable shortest paths in road networks under uncertainty. Networks & Spatial Economics, 13(2), 123–148. https://doi.org.10.1007/s11067-012-9175-1
Ciesielski, K. C., Falcão, A. X., & Miranda, P. A. (2018). Path-value functions for which Dijkstra’s al-gorithm returns optimal mapping. Journal of Mathematical Imaging and Vision, 60(7), 1025–1036. https://doi.org.10.1007/s10851-018-0793-1
Faisal, A., Yigitcanlar, T., Kamruzzaman, M., & Currie, G. (2019). Understanding autonomous ve-hicles: A systematic literature review on capability, impact, planning and policy. Journal of Transport and Land Use, 12(1), 45–72. https://doi.org.10.5198/jtlu.2019.1405
Ford, A., Dawson, R., Blythe, P., & Barr, S. (2018). Land-use transport models for climate change mitigation and adaptation planning. Journal of Transport and Land Use, 11(1), 83–101. https://doi.org/10.5198/ jtlu.2018.1209
Galán-García, J. L., Aguilera-Venegas, G., Galán-García, M. Á., & Rodriguez-cielos, P. (2015). A new probabilistic extension of Dijkstra’s algorithm to simulate more realistic traffic flow in a smart city. Applied Mathematics and Computation, 267, 780–789. https://doi.org/10.1016/j.amc.2014.11.076
Huang, W., Yan, C., Wang, J., & Wang, W.(2017). A time-delay neural network for solving time-dependent shortest path problem. Neural Networks, 90, 21–28. https://doi.org/10.1016/j.neu-net.2017.03.002
Huang, W., Zhang, Y., Shang, Z., & Yu, J.X. (2017). To meet or not to meet: Finding the shortest paths in road network. IEEE Transactions on Knowledge and Data Engineering, 30(4), 772–785. https://doi.org/10.1109/tkde.2017.2777851
Jabbarpour, M. R., Zarrabi, H., Khokhar, R. H., Shamshireband, S., & Choo, K. K. R. (2018). Appli-cations of computational intelligence in vehicle traffic congestion problem: A survey. Soft Comput-ing, 22(7), 2299–2320. https://doi.org/10.1007/s00500-017-2492-z
Li, L. R., Wang, L., Gao, Y. B., & He, C. (2013). A dynamic path planning model based on the optimal ant colony algorithm. Journal of Guangxi University: Nat Sci Ed, 38(2), 359–367.
Liu, G., Qiu, Z., Qu, H., & Ji, L. (2015). Computing k shortest paths using modified pulse-coupled neural network. Neurocomputing, 149, 1162–1176. https://doi.org/10.1016/j.neucom.2014.09.012
Liu, J., Wan, J., Wang, Q., Deng, P., Zhou, K., & Qiao, Y. (2016). A survey on position-based routing for vehicular ad hoc networks. Telecommunication Systems, 62(1), 15–30.
Paz, A., & Peeta, S. (2009). On-line calibration of behavior parameters for behavior-consistent route guidance. Transportation Research Part B: Methodological, 43(4), 403–421. https://doi.org/10.1016/j.trb.2008.07. 007
Qin, Q., Feng, M., Sun, J., & Sun, B. (2015, August). Prediction of road resistance based on historical/real-time information and road quality. In 12th International Conference on Fuzzy Systems and Knowl-edge Discovery (FSKD), 1073–1077. https://doi.org/10.1109/fskd. 2015.7382091

538 JOURNAL OF TRANSPORT AND LAND USE 13.1
Sen, S., Pillai, R., Joshi, S., & Rathi, A. K. (2001). A mean-variance model for route guidance in ad-vanced traveler information systems. Transportation Science, 35(1), 37–49. https://doi.org/10.1287/trsc. 35.1.37.10141
Wang, P. W., Yu, H. B., Xiao, L., & Wang, L. (2017). Online traffic condition evaluation method for connected vehicles based on multisource data fusion. Journal of Sensors, 2017(11), 1–11. https://doi.org/10.1155/2017/7248189
Wang, Q., Huang, W., Liu, B., & Zhang, Y. (2018). An improved A∗ algorithm for path-planning of two-wheeled self-balancing vehicle. 13th IEEE Conference on Industrial Electronics and Applications (ICIEA), 841–846. https://doi.org/10.1109/iciea.2018.8397830
Wang, X., & Qiao, Q. (2010). Solving the shortest path routing problems by integrating a fast search-ing strategy into a hysteretic neural network with transient chaos. Sixth International Conference on Natural Computation, 2, 598–602. https://doi.org/10.1109/icnc.2010.5583418
Wang, Z., Chen, Y., Chen, N., & Han, W. (2016). A control strategy of urban expressway under CVIS. International Journal of Simulation — Systems, Science & Technology, 16(1), 30–34.
Wang, Z., Li, J., Fang, M., & Li, Y.(2015). A multimetric ant colony optimization algorithm for dy-namic path planning in vehicular networks. International Journal of Distributed Sensor Networks, 11(10), 1–10. https://doi.org/10.1155/2015/271067
Wu, X., & Nie, Y. M. (2011). Modeling heterogeneous risk-taking behavior in route choice: A stochas-tic dominance approach. Transportation Research Part A Policy & Practice, 45(9), 896–915. https://doi.org/10.1016/j.sbspro.2011.04.523
Xing, T., & Zhou, X. (2011). Finding the most reliable path with and without link travel time cor-relation: A Lagrangian substitution based approach. Transportation Research Part B Methodological, 45(10), 1660–1679. https://doi.org/10.1016/j.trb.2011.06.004
Yigitcanlar, T., & Kamruzzaman, M. (2014). Investigating the interplay between transport, land use and the environment: A review of the literature. International Journal of Environmental Science and Technology, 11, 2121–2132. https://doi.org/10.1007/s13762-014-0691-z
Yu, F., Li, Y., & Wu, T. J. (2010). A temporal ant colony optimization approach to the shortest path problem in dynamic scale-free networks. Physica A: Statistical Mechanics and its Applications, 389(3), 629–636. https://doi.org/10.1016/j.physa.2009.10.005
Zhu, T., Song, Z., Wu, D., & Yu, J. (2016). A novel freeway traffic speed estimation model with mas-sive cellular signaling data. International Journal of Web Services Research, 13(1), 69–87. https://doi.org/10.4018/jwsr.2016010105