real-time structured light-based otoscopy for quantitative
TRANSCRIPT

Real-time structured light-basedotoscopy for quantitativemeasurement of eardrum deformation
Sam Van der JeughtJoris J. J. Dirckx
Sam Van der Jeught, Joris J. J. Dirckx, “Real-time structured light-based otoscopy for quantitativemeasurement of eardrum deformation,” J. Biomed. Opt. 22(1), 016008 (2017),doi: 10.1117/1.JBO.22.1.016008.
Downloaded From: https://www.spiedigitallibrary.org/journals/Journal-of-Biomedical-Optics on 14 Jan 2022Terms of Use: https://www.spiedigitallibrary.org/terms-of-use

Real-time structured light-based otoscopy forquantitative measurement of eardrum deformation
Sam Van der Jeught* and Joris J. J. DirckxUniversity of Antwerp, Department of Physics, Laboratory of Biomedical Physics, Groenenborgerlaan 171, B-2020 Antwerp, Belgium
Abstract. An otological profilometry device based on real-time structured light triangulation is presented.A clinical otoscope head is mounted onto a custom-handheld unit containing both a small digital light projectorand a high-speed digital camera. Digital fringe patterns are projected onto the eardrum surface and are recordedat a rate of 120 unique frames per second. The relative angle between projection and camera axes causesthe projected patterns to appear deformed by the eardrum shape, allowing its full-field three-dimensional (3-D)surface map to be reconstructed. By combining hardware triggering between projector and camera with a dedi-cated parallel processing pipeline, the proposed system is capable of acquiring a live stream of point clouds ofover 300,000 data points per frame at a rate of 40 Hz. Real-time eardrum profilometry adds an additional dimen-sion of depth to the standard two-dimensional otoscopy image and provides a noninvasive tool to enhance thequalitative depth perception of the clinical operator with quantitative 3-D data. Visualization of the eardrum fromdifferent perspectives can improve the diagnosis of existing and the detection of impending middle ear pathol-ogy. The capability of the device to detect small middle ear pressure changes by monitoring eardrum deforma-tion in real time is demonstrated. © 2017 Society of Photo-Optical Instrumentation Engineers (SPIE) [DOI: 10.1117/1.JBO.22.1.016008]
Keywords: otoscopy; tympanic membrane; profilometry; real time; graphics processing unit.
Paper 160709R received Oct. 17, 2016; accepted for publication Dec. 20, 2016; published online Jan. 11, 2017.
1 IntroductionThe tympanic membrane (TM) or eardrum is a thin membranethat separates the middle ear from the external ear. Besides con-ducting sound wave vibrations from air to the ossicles, the TMprotects the middle ear from external influences that may causeinfections. The three-dimensional (3-D) conical shape of the TMplays a crucial role in this process and any structural change toits topography can be an indicator for existing or impendingpathology. In the following, we will refer to the measurementof the TM surface shape as “tympano-topography.”
Currently, primary clinical diagnosis of middle ear inflam-mation or otitis media is carried out using a standard otoscope.In the otoscope head, a magnifying lens is placed directlybehind a disposable speculum, allowing for visual inspectionof the ear canal and the external side of the TM. Althoughthis generally suffices for the detection of visually observabledefects, such as TM ruptures, retraction pockets, or inflamma-tion of the cutaneous layer, otoscopic examination is limited totwo-dimensional (2-D) visualization of the eardrum structureonly, and no information on structurally less discernible abnor-malities can be generated. By extending the 2-D qualitative viewof the TM with real-time 3-D surface shape information, a newdimension of quantitative data is made available to the operator,which may support correct diagnosis of currently manifestedpathology and open up a new area of predictive otologicaldiagnostics.
Due to the relatively small dimensions of the human TM(8 to 10 mm diameter, 1 to 2 mm apex height), measuringthe dynamic deformation of its 3-D surface shape in vivo with
sufficiently high resolution is not a trivial task. Recent reportsof optical coherence tomography (OCT) systems have demon-strated the capability of the technique to measure human TMthickness in vivo and in real time by delivering and collectingthe light through a handheld probe.1,2 Although additional dataon the internal structure of the membrane is generated thisway, extracting the 3-D surface shape model from the axialdepth scans requires full-field segmentation which is typicallydone in postprocessing. In addition, the required broadbandlight source reduces portability of the otoscopic OCT system.Alternatively, digital holography has been used to measuremicrodeformations and 3-D vibrational (sound-induced) motionof TMs3,4 using double exposure, multiple wavelength tech-niques, but subwavelength stability of the measurement sampleis required between subsequent exposures.
Recently, we have developed a real-time microscopic pro-filometry system5 capable of acquiring 30 microscopic heightmaps per second with depth resolutions in the micrometerrange by projecting structured light patterns onto the objectsurface through one optical pathway of a stereoscopic operationmicroscope and by recording the deformed patterns throughthe second pathway. Although this resulted in high-quality3-D maps of the object surface with depth resolution in theorder of 10 μm, a rather large working distance of 200 to415 mm from object lens to target surface was required.Unfortunately, the human ear canal has a sigmoid shape andstraight optical passage to the TM cannot always be guaran-teed. Similarly, a number of other medical procedures sufferto extract 3-D information directly from optically inaccessiblehuman tissue due to anatomical limitations. These include thefamily of minimally invasive laparoscopic surgery techniques
*Address all correspondence to: Sam Van der Jeught, E-mail: [email protected] 1083-3668/2017/$25.00 © 2017 SPIE
Journal of Biomedical Optics 016008-1 January 2017 • Vol. 22(1)
Journal of Biomedical Optics 22(1), 016008 (January 2017)
Downloaded From: https://www.spiedigitallibrary.org/journals/Journal-of-Biomedical-Optics on 14 Jan 2022Terms of Use: https://www.spiedigitallibrary.org/terms-of-use
employed during gallbladder removal,6 hernia repair,7 removalof part of the colon or small intestine,8 removal of the spleen,9
removal of the adrenal glands,10 and removal of the kidneys.11
Although correct 3-D orientation is critical in these procedures,the operator is typically provided only with a live feed of 2-Dimages. To provide the laparoscopic surgeon with better depthperception, marker-less tracking systems have been designed toalign the real-time video feed to preoperatively recorded 3-DCT scans of the tissue surface as an overlaid augmenteddisplay.12 Depth accuracy of these supplementing tracking sys-tems is limited since they rely on prerecorded measurementsand provide no direct, real-time feedback on the current topol-ogy of the observed tissue.
To this end, recent efforts have been made to integrate opticalprofilometry systems into miniaturized 3-D otoscopic and endo-scopic devices. The first stereoscopic endoscopy systems illumi-nated the object surface with uniform light and imaged the sceneusing a dual sensor setup. This was achieved by employingeither two imaging sensor chips with two distinct lenses13 ora single lens behind two pupil openings combined with a len-ticular array and a single imaging sensor.14,15 Either way, 3-Ddata were extracted from the dual-viewpoint images by solvingthe correspondence problem. The quality of this technique isknown to depend heavily on the optical structure of the imagedscene and suffers from featureless areas or shadow effects.Alternatively, the correspondence problem can be solved byreplacing one of the two imaging sensors with a light sourcethat projects predefined structured light patterns onto the scene.This way, triangulation can be performed directly by virtuallyintersecting the projected and the intercepted light rays usingcustom reconstruction algorithms.
In endoscopy, the narrow size of the sensor head and thesmall diameter of the attached flexible shaft complicate thedesign of the device optics that are required for projectionand recording of the fringe patterns. As size constraints prohibitimplementation of a digital light projector (DLP) unit into thesensor head itself, light is typically generated remotely outsideof the endoscope and supplied through glass fibers. To solve thecorrespondence problem, the projected light must be providedwith position dependent and uniquely identifiable markers. Oneway to landmark the object surface is to illuminate the scenewith a grid of dots of multiple wavelengths.16 After identifica-tion of these dots in the camera image, the correspondenceproblem can be solved and 3-D reconstruction of the object sur-face can be performed. This technique is highly sensitive to thedynamic range and color resolution of the employed CCD chipand produces 3-D point clouds of limited density. Another wayto install codification into the projected light beams is to passthe light through a ring-shaped slide placed in the sensor head,generating colored cones around the central endoscope axis in acircular pattern.17 Although this design is optimized for imag-ing of tubular cavities, no 3-D information of the object scenein front of the endoscope head is generated. Alternatively, dual-barrel systems with separate endoscopes for illumination andobservation have been proposed,18 but these result in largeand impractical setups and are generally unsuited for commonmedical applications. A detailed overview of 3-D endoscopicsystems can be found in Refs. 19 and 20.
In otoscopy, the limited penetration depth of the scanner headimposes fewer dimensional restrictions onto the otoscopicdevice than is the case in standard endoscopy. As the humanear canal has an average length of about 25 mm and a diameter
of 7 mm, the eardrum can generally be monitored in its entiretyby inserting a funnel-shaped speculum into the canal. Recently,a light field otoscope has been reported that uses a microlensarray in combination with a main imaging lens placed directlybehind the speculum to capture both the intensity and the angu-lar distribution of light rays coming from the eardrum surface.21
The plenoptic camera-based setup allows submillimeter resolu-tion height maps of the TM to be constructed. Although thistechnique provides the operator with shape estimation of the ear-drum under static conditions, the depth precision is insufficientto quantify local deformations of the membrane or to measuredynamic effects. More recently, Das et al.22 proposed a struc-tured light-based otoscopic device capable of achieving depthresolutions in the order of 20 to 30 μm. Their prototype containsa portable LED projector for the projection of structured lightpatterns onto the eardrum and a telephoto lens arrangementwhose output is coupled to a webcam sensor. The conicalshape of the speculum enables a small angle between projectionand recording axis to be made and the 3-D otoscopic deviceoptics to be redesigned into a new, compact device. SinceDas et al. employed multiphase structured light profilometryin combination with a low-end projector-camera system,recording and visualization of height maps required 1.5 s permeasurement. This relatively long acquisition time not onlyreduces the height measurement precision due to patient oroperator movement but also inhibits monitoring of dynamiceardrum deformation.
Both the detection of weak spots on the eardrum and theevaluation of Eustachian tube (ET) functioning require 3-Dshape data of the TM to be gathered when varying pressuresare applied over the membrane. As pressure stabilization isa dynamic process,23 multiple intermediate measurements arerequired, and real-time feedback of the TM surface shapechange is needed. In the following, we present a new 3-D oto-scopic handheld device containing a real-time structured lighttriangulation engine with custom triggering between projectionand camera hardware and a dedicated digital signal processingpipeline based on graphics processor unit programming. Byusing a DLP with configurable digital micromirror device(DMD) displays, any single- or multi-shot structured lightprofilometry technique can be employed. This way, the pixelperiod of projected fringes or the number of total phase-shiftedframes per 3-D measurement can easily be modified, dependingon the reflectivity profile of the object surface, the requireddepth resolution, and the minimum 3-D frame rate. The 3-Dotoscope generates a live stream of 40 full-field surfacemaps per second, each containing a point cloud of 300,000data points per frame. For a comprehensive overview of currentstate-of-the-art real-time structured light profilometry tech-niques, we direct the reader to Zhang24 and Van der Jeughtand Dirckx.25
This paper is organized as follows: the next section presentsthe experimental setup and outlines the technical aspects of thedevice. A brief overview of the parallel digital signal processingpipeline and the employed structured light profilometry tech-nique is given. Section 3 demonstrates the experimental resultsof the 3-D otoscopic device, including measurements of calibra-tion samples with known topographies and an ex vivo TM.Section 4 discusses important aspects of the hardware setupand the employed algorithms and explores the transition ofthe device into the clinical setup. Finally, Sec. 5 concludesthe paper.
Journal of Biomedical Optics 016008-2 January 2017 • Vol. 22(1)
Van der Jeught and Dirckx: Real-time structured light-based otoscopy for quantitative measurement of eardrum deformation
Downloaded From: https://www.spiedigitallibrary.org/journals/Journal-of-Biomedical-Optics on 14 Jan 2022Terms of Use: https://www.spiedigitallibrary.org/terms-of-use

2 Methods
2.1 Experimental Setup
A standard clinical otoscope was used as the base optical setupfor our real-time 3-D scanning device. In its standard configu-ration, the otoscope consists of a handle and a head with at itsdistal end an attachment for disposable plastic specula. Uniformwhite light is generated in an LED module located inside theotoscope handle and is injected into the ear canal via a plasticmirror. The light that is reflected from the TM is focused ontothe observer eye by a 3× magnifying lens placed at the rear ofthe head.
To provide the otoscopic device with digital fringe projectionand 3-D data extraction capabilities, several modifications to itsoptical configuration were implemented. First, the LED moduleand the entire otoscope handle were removed from the otoscopehead. The plastic mirror was replaced by a semitransparent mir-ror (SM) that was installed inside the otoscope head at a 40 degto 45 deg angle between central speculum axis and formerhandle shaft. Next, a custom-handheld aluminum frame wasdesigned to align a high-speed CCD sensor (Imperx IGV-B0620M, 210 frames per second, 640 × 480 pixels, 12-bitgrayscale images) perpendicularly to the prior otoscope handleaxis. Finally, the magnifying lens was removed and a TexasInstruments (TI) lightcrafter pico projector evaluation modulewas installed at the rear of the otoscope head. The modified oto-scopic unit and a schematic overview of its optical layout areshown in Fig. 1. In its entirety, the prototype weighs around800 g and can easily be held in one hand. The device is poweredand connected to the PC only through flexible cables and caneasily be maneuvered under any angle. Nevertheless, futureiterations of the hardware design will include more detail toergonomics and form factor.
Uniform red, green, or blue light is generated by theRGB-LED light engine inside the TI lightcrafter module andreaches the DMD under a fixed angle. The light is reflectedby the individually rotating micromirrors into a pixelated(608 × 684 pixel) grayscale fringe pattern that is projectedonto the object surface after passing the projector lens andthe SM. The deformed fringe pattern is observed by theCCD sensor after being reflected on the SM and after passingthe observation lens. The coaxial bayonet neill–concelman cableenables triggering between CCD and DMD, and the recordedfringe patterns are transferred from CCD memory to RAMmemory using the gigabit ethernet interface.
The TI lightcrafter module is a compact (116 mm × 65 mm)DLP-based light projection system containing flash memory foron-board pattern and sequence storage. It generates 8-bit gray-scale patterns at a rate of 120 Hz and binary patterns at a rate of4 kHz. The pico projector and its focusing lens system was ori-ented so that the central projection axis of the projected imagesenters the head under an angle of α ¼ 20 deg relative to theobservation axis. This angle between projection and observationaxes causes the projected fringe patterns to appear deformed bythe object shape and allows the 3-D object surface data to beextracted.
The duty cycle of the rapidly rotating micromirrors deter-mines the amount of light that is reflected toward the outputand therefore sets the grayscale intensity per pixel. In contrastto commercial video projectors, which adopt nonlinear dutycycles for better subjective visual effect, the lightcrafter moduleis designed to maintain a linear relation between input and out-put grayscale intensity or “gamma curve.” The micromirror dutycycle is divided discretely into 8-bit planes, each representing afraction between 1/2th and 1/256th of the total illuminationtime. Therefore, to avoid visual artifacts, it is important thatthe projector-camera system is synchronized to record integermultiples of the total illumination time only. To ensure propertriggering, custom-made electronics were built to connect thetrigger output of the lightcrafter logic board to the high-speedcamera, and the camera exposure time was set to the intervalbetween successive trigger pulses, corresponding to 1/120th ofa second or 8.33 ms per image capture.
2.2 Real-Time Digital Signal Processing Pipeline
The digital nature of the DLP unit allows us to implement anystructured light projection technique in the otoscopic profilom-eter. Without loss of generality, in the following we describe theimplementation of the standard three-phase 2þ 1 technique.26
This technique requires only three unique intensity imagesper 3-D measurement and therefore allows a high 3-Dframe rate to be obtained. For a similar description of four-phasefringe pattern pipelines, we direct the reader to Van derJeught et al.5
Before acquisition, three preconstructed 8-bit digital patternsare uploaded to the on-board flash memory of the lightcraftermodule and are displayed in a loop: two line patterns with sinus-oidally varying intensity distribution and a relative phase shiftof π∕2 and a single uniform white image. When observed bythe camera under a relative angle with the projection axis, theseline patterns appear deformed by the object shape and can bedescribed as follows:
EQ-TARGET;temp:intralink-;e001;326;96I1ði; jÞ ¼ I 0ði; jÞ þ I 0 0ði; jÞ sinfφði; jÞg; (1)Fig. 1 (a) Modified otoscopic unit and (b) schematic overview of itsoptical layout with enlarged detail of otoscope head.
Journal of Biomedical Optics 016008-3 January 2017 • Vol. 22(1)
Van der Jeught and Dirckx: Real-time structured light-based otoscopy for quantitative measurement of eardrum deformation
Downloaded From: https://www.spiedigitallibrary.org/journals/Journal-of-Biomedical-Optics on 14 Jan 2022Terms of Use: https://www.spiedigitallibrary.org/terms-of-use

EQ-TARGET;temp:intralink-;e002;63;752I2ði; jÞ ¼ I 0ði; jÞ þ I 0 0ði; jÞ cosfφði; jÞg; (2)
EQ-TARGET;temp:intralink-;e003;63;729I3ði; jÞ ¼ I 0ði; jÞ; (3)
with I1−3ði; jÞ the three deformed intensity patterns at pixelindices i and j, I 0 the average or background intensity, I 0 0the intensity profile modulation or fringe pattern amplitude, andφði; jÞ the phase map of the deformed fringe pattern sequence.The phase map can be obtained by solving Eqs. (1)–(3)
EQ-TARGET;temp:intralink-;e004;63;648φði; jÞ ¼ tan−1�I1 − I3I2 − I3
�: (4)
The phase φ is now extracted from the three input intensityimages and can be linked directly to the local object height zthrough proper calibration and scaling and by removing theartificial 2π discontinuity jumps that originate from the limitedprinciple value domain ½−π; π� of the arctangent function.
To achieve real-time display of 3-D height maps, severaloptimization techniques were employed in the proposedsetup. First, acquisition, digital signal processing, and visuali-zation of height maps are executed simultaneously in anasynchronous workload organization. Second, all digital signalprocessing components themselves are designed to operate inparallel on the graphics processing unit (GPU) of a standardgraphics card. Third, GPU interoperability between paralleldata processing interface compute unified device architecture(CUDA) and visualization interfaces, OpenGL and GLSL,were established to minimize data transfers across the PCIbus and to relieve the CPU from most computationally intensivetasks. The entire software library, from data acquisition to on-screen rendering of 3-D measurement results, was written incustom C++-based code to ensure optimal data flow controland memory management. The digital signal processing pipe-line was executed on a commercial GTX980 graphics cardwith 3072 CUDA cores and 4096MB of on-board GDDR5RAM memory.
A more detailed schematic overview of the real-time2þ 1-phase profilometry pipeline is presented in Fig. 2. Inputfringe patterns I1−3 are acquired continuously and are down-loaded from the camera data buffer in blocks of three. This proc-ess is supported by hardware triggering and controlled by theCPU. Simultaneously, the previous block of fringe patterns istransferred from host (CPU) to device (GPU) memory, where
the 12-bit grayscale input images are stored as 2-byte unsignedinteger texture arrays. Next, control over the data processingpipeline is passed over to the GPU and the CPU returns todata acquisition control. The first step in the digital signalprocessing pipeline is the extraction of the wrapped phaseφW from the three input fringe patterns using Eq. (4). As thephase of neighboring pixels can be calculated independently,this process is highly suited for parallel implementation.Next, the original, continuous phase signal φU is recoveredby adding an integer multiple of 2π to every phase value ofthe wrapped phase grid φW in a process commonly referredto as 2-D phase unwrapping.27 A 3 × 3 Gaussian filter kernelis applied to the unwrapped phase array to reduce spikes causedby motion or system noise, and the filtered phase values φf areconverted to actual 3-D Euclidian coordinates by applying thereference-plane-based calibration approach.28 After recordingthe phase grid of a reference plane φR, where the base planedepth is set to z ¼ 0, the difference between φR and subsequentphase measurements is proportional to the object depth z bysome constant scaling value. This scaling value zS can theneasily be obtained from calibration measurements on an objectof known dimensions. Finally, point normals to the vertex geom-etry zN are calculated by taking the cross products of neighbor-ing phase value gradients so that Phong29 lighting may beapplied in 3-D visualization mode. Note that the digital signalprocessing blocks as shown in Fig. 2 are not scaled to representthe respective time they take but are in fact expanded to fill themaximum time slot they could take up without obstructing thereal-time pipeline. In reality, the entire digital signal processingof the three images, including memory transfer from host todevice, takes up only 11.2 ms in total.
The GPU-calculated height measurements are visualizedfrom GPU memory and no additional device-to-host memorytransfers are needed. For final rendering of the result, two graph-ics application programming interfaces are employed: OpenGLand GLSL. To allow off-screen rendering, i.e., the drawing ofscenes into buffers other than the frame or screen buffer, a stan-dard double buffering technique is employed. To this end, anadditional OpenGL frame buffer object is created as a back-buffer and its output is bound to GPU texture memory. Onlywhen the backbuffer is fully rendered, it is swapped with thescreen buffer or front buffer, effectively hiding the renderingprocess from the user while minimizing latency. For final dis-play, three small shader programs are written in the OpenGL
Fig. 2 (Color online) Real-time three-step 2þ 1-phase shifting profilometry timeline. Horizontally alignedblocks occur sequentially; vertically aligned blocks occur simultaneously. At all times, fringe patternacquisition, digital signal processing, and on-screen rendering of successive measurements areexecuted asynchronously. Following the data-processing cycle of one 3-D-measurement (blue, diago-nally hatched), three input fringe patterns are first captured by the high-speed camera and transferredfrom CPU to GPU memory. Next, the digital signal processing pipeline performs successive wrappedphase extraction (φW ), phase unwrapping (φU ), Gaussian filtering (φf ), phase-to-height conversionand scaling (zS), and normal calculation (zN ). Finally, the 3-D height map is rendered and displayed.
Journal of Biomedical Optics 016008-4 January 2017 • Vol. 22(1)
Van der Jeught and Dirckx: Real-time structured light-based otoscopy for quantitative measurement of eardrum deformation
Downloaded From: https://www.spiedigitallibrary.org/journals/Journal-of-Biomedical-Optics on 14 Jan 2022Terms of Use: https://www.spiedigitallibrary.org/terms-of-use

shading language GLSL. The first one incorporates the previ-ously calculated point normals in a 3-D Phong light reflectionmodel, computing the virtual illumination brightness and colorof the object surface pixel per pixel, depending on user-definedvariables such as object surface reflectance and 3-D position oflight source and observer. The second one converts the heightvalues to a pixel color using a predefined color map, generatinga 2-D color-coded height map that is projected onto the objectsurface for quick assessment of object topography. The third oneprojects the uniform bright image that was gathered in theacquisition step of the 2þ 1-phase technique onto the objectsurface. This shader program enhances operator orientation asobject texture features that cannot be resolved as heightdifferences are incorporated into the final 3-D result, also.
3 Results
3.1 Measurement Precision
To determine the depth resolution of the proposed otoscopicprofilometry setup, the surface profile of a flat glass platewas measured at various discrete distance intervals aroundthe central focal plane. Pregenerated structured light patternswith a sinusoidal intensity profile of 24 pixels per fringe period
were projected onto the glass plate surface. The glass plate itselfwas mounted onto a translation stage, which allowed displace-ment along the projection (or Z-) axis. The projected fringe pat-terns spanned a field of view of 8.15 × 6.11 mm across the glassplate surface, which was coated with magnesium oxide to ensuregood diffuse reflectivity. Cross sections of these measurementsalong the central pixel lines in both X- and Y-dimensions areshown in the top row of Fig. 3. The numerical differencebetween these cross sections at depths of Z ¼ þ4 mm (red),Z ¼ 0 mm (black), and Z ¼ −4 mm (blue) around the centralfocal plane are included in the second row. No Gaussiansmoothing was applied to the 3-D data.
It can be seen that measurement precision decreases withincreasing distance of the object to the focal plane. This effectis standard for structured light projection techniques due tothe fact that the contrast of the projected fringe patterns deteri-orates away from the focal plane due to defocusing effects.With decreasing fringe pattern contrast, the intensity valuesI1−3ði; jÞ in Eq. (4) converge toward each other. This reducesthe numerical digital range of the intensity ratio formula usedto calculate the phase φði; jÞ and limits the measurement reso-lution of the technique. Furthermore, it should be noted that theprojection optics of the TI lightcrafter module are designed for
Fig. 3 The surface profile of a flat glass plate was measured at discrete intervals around the central focalplane Z ¼ 0 to determine the measurement precision of the proposed otoscopic system. Cross sectionsof these depth measurements along (a) the X -axis and (b) the Y -axis are included in the first row, and thecorresponding depth measurement errors (dZ ) at object depths of Z ¼ þ4 mm (red), Z ¼ 0 mm (black),and Z ¼ −4 mm (blue) are included in the second row. (c) Plots the 2-D-RMS values of the differencebetween the full flat glass plate measurements and their respective best planar fits in function of objectdepth.
Journal of Biomedical Optics 016008-5 January 2017 • Vol. 22(1)
Van der Jeught and Dirckx: Real-time structured light-based otoscopy for quantitative measurement of eardrum deformation
Downloaded From: https://www.spiedigitallibrary.org/journals/Journal-of-Biomedical-Optics on 14 Jan 2022Terms of Use: https://www.spiedigitallibrary.org/terms-of-use
asymmetric upward projection. When the projected fringe pat-terns reach the object surface outside of the focal plane, theycontain a certain amount of geometric distortion relative tothe angle between the normal of the object surface and the cen-tral projection axis. The accumulated measurement errors due tofringe pattern defocus and geometric distortion artifacts largelyremain within a region of dZ ¼ �200 μm.
To quantize the system’s mean measurement error as a func-tion of object depth, the full-field two-dimensional root-mean-square (2D-RMS) values of the differences between the flatplate measurements at each depth interval and their respectivebest 2-D plane fits are plotted in part of Fig. 3(c). From this plot,axial resolution of 3-D measurements can be determined, giventhe total object depth span and assuming that the object is placedcentrally around the focal plane. The measurement error indepth (dZ) increases with distance away from the centralfocal plane, though remains below an RMS of 60 μm withina region of �4 mm around Z ¼ 0.
3.2 Calibration Standard and Live VisualizationSoftware
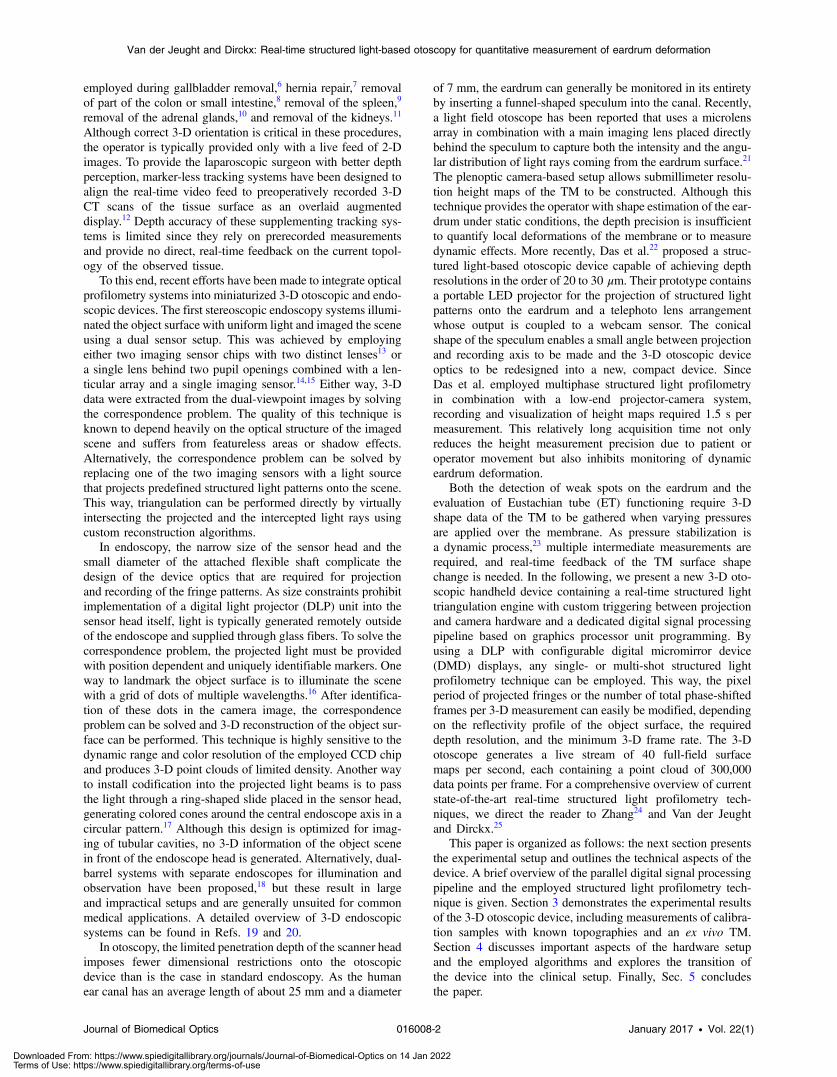
To demonstrate the real-time digital signal processing and visu-alization engine of the proposed otoscopic profilometry setup, acalibration standard with right-angled triangular ridges of 2.2-mm deep was measured. Again, the object was coated with mag-nesium oxide to ensure maximum diffuse reflection and itsheight profile was distributed symmetrically around the focalplane. A still frame from the live-recorded measurementvideo (Video 1) is shown in part of Fig. 4(a). The centralpixel line of the resulting 3-D measurement is highlighted inred. The cross section of the height measurement along this cen-tral pixel line is illustrated in blue in Fig. 4(b) with its segmentedlinear fit overlaid in red. The numerical difference betweenheight measurement and linear fit is included in Fig. 4(c).
As can be seen in the measurement video, the softwareallows the user to rotate the object in 3-D perspective viewand to control visualization effects, such as colormap range,position of virtual light source relative to the observer, and qual-ity threshold of rendered height map data. The video stream wasrecorded directly from the computer screen using frame grabbersoftware and was resampled from 40 fps to 29.97 fps in accor-dance with standard H.264 codec protocol. During live measure-ment, the user is able to switch between custom shader programsdesigned to emphasize either the height profile or the texture ofthe object surface. For fast assessment of the object’s heightprofile, the object vertices are each assigned a color rangingfrom blue (low Z-value) to red (high Z-value). Alternatively,the shader can superimpose the uniformly lit input intensityimage onto the object surface to incorporate texture featuresin the 3-D model. Finally, a blend or a combination of thesetwo shader programs can be selected, which is shown in thefirst part of Video 1 and Fig. 4(a).
To reduce high-frequency phase noise during live measure-ments, a 3 × 3 Gaussian filter is applied to the unwrapped 3-Ddata. As a result, the 3-D geometry is smoothed out, and sharpcorners become rounded. This effect can be seen clearly inFigs. 4(b) and 4(c) when measuring the right-angled indenta-tions of the calibration standard. The measurement noisestays well within dZ ¼ �50 μm, except at the borders betweensuccessive segmented lines, where the height measurementsdeviate up to dZ ¼ �100 μm from the linear fit. Since the oto-scopic profilometer was designed mainly to measure the surfaceprofile of human TMs that typically possess a smooth 3-D tent-like shape and generally do not contain features with edgedtransitions, rounding artifacts of sharp angles do not impedethe intended 3-D TM shape measurements. Nevertheless, theGaussian filter is optional and can easily be omitted fromthe digital signal processing pipeline by the user during livemeasurement.
3.3 Dynamic Pressurization of Tympanic MembraneEx Vivo
As a first step toward implementation of real-time tympano-topography in the clinical ENT office, the otoscopic profilom-eter was used to measure the 3-D shape distortion of an ex vivoTM caused by dynamic pressurization. A fresh (frozen) tempo-ral bone was obtained from the Life Legacy Foundation, and theTM remained in situ during the measurements. To mimic an invivo measurement setup, the ear canal was left intact, and theTM was optically accessible only by inserting a plastic specu-lum into the ear canal. A small drop of water base cosmetic dyewas used to coat the TM with a diffusely reflecting white layer.The middle ear cavity was (de-)pressurized by inserting a smalltube through one of the mastoid cells and by sealing the remain-der of the mastoid cells airtight using two-component siliconpaste. The air tube was connected to a pressure generator thatwas controlled manually. The measurement setup is shown inFig. 5.
Dynamic pressurization of the TM was established by alter-nating the middle ear cavity pressure between −0.4 kPa andþ0.4 kPa several times over the course of a 7.1-s measurementperiod. The 2þ 1 phase-shifting profilometry technique wasused to monitor the 3-D deformation of the TM shape in realtime, and the measurement results were downloaded to CPURAM memory buffers and stored in computer memory for post-processing and analysis purposes. Figure 6 shows the various
Fig. 4 (a) Video 1 still frame from live measurement video demon-strating the real-time otoscopic profilometry technique, including across section of the object’s height profile Z along (b) the centralpixel line, and (c) its measurement error dZ . (Video 1, 5.65 MB, mp4[URL: http://dx.doi.org/10.1117/1.JBO.22.1.016008.1]).
Journal of Biomedical Optics 016008-6 January 2017 • Vol. 22(1)
Van der Jeught and Dirckx: Real-time structured light-based otoscopy for quantitative measurement of eardrum deformation
Downloaded From: https://www.spiedigitallibrary.org/journals/Journal-of-Biomedical-Optics on 14 Jan 2022Terms of Use: https://www.spiedigitallibrary.org/terms-of-use

steps in the reconstruction process as it is applied to one of the284 sets of three input intensity images [Figs. 6(a) to 6(c)]. Twoof these images contain sinusoidally varying intensity profileswith a relative phase shift of π∕2 and the third one has a uniformintensity profile. Together, they can be combined to form aphase map of the object [Fig. 6(d)] from which the height profileis constructed after removal of the 2π-discontinuities [Fig. 6(e)].Next, the phase values are converted to absolute height values,Gaussian filtering is applied to the 3-D geometry, and a refer-ence map is deducted from the resulting height map. As we areinterested in monitoring the 3-D shape deformation of the mem-brane when pressure is applied over it, we have chosen to assignthe first unwrapped phase map of the measurement stream(at pressure 0 kPa) as the default reference geometry to be sub-tracted from the subsequent phase maps. The resulting heightdeformation maps [Fig. 6(e)] are therefore to be interpretedrelative to zero pressurization.
It should be noted that a quality map is constructed in realtime for every trio of input intensity patterns by calculating theintensity modulation [the I 0 0-term in Eqs. (1) and (2)] pixel perpixel and by performing binary thresholding accordingly. This
way, parts of the image that are out of focus, contain shadows, orare under- or overexposed can be excluded from the phase mapand do not affect the resulting 3-D measurement. However, theuser is able to set outer limits to the region of interest by markingthe region with an interactive polygon, should manual interven-tion be required. The quality map threshold value and the boun-daries of the binary mask can be modified in real time duringacquisition. Incorporation of the dynamic quality map in themeasurement pipeline increases the robustness of the techniqueduring live measurement when local structural irregularities(e.g., the tissue of the ear canal partially blocking the view ofthe TM in the upper right side of the measurement sequence inFig. 6) might otherwise induce measurement artifacts in thereconstruction of the 3-D phase map.
As shown in Fig. 7, the pressure change in the middle earcavity results in height deformation of the TM. Part (I)shows the height deformation map of the TM when the appliedpressure was near maximum at þ0.4 kPa overpressure in themiddle ear cavity. The manubrium border of the malleus ismarked by a dashed black line, and three distinct locationson the membrane surface along the manubrium (black), nearthe center of the posterior part of the pars tensa (blue), andnear the side of the pars tensa toward the annulus (red) are indi-cated by asterisks. The corresponding height deformation pro-files of the membrane at these locations are plotted in function oftime in part (II) and reflect the pressure change cycles clearly.It can be seen that the TM surface along the manubrium (blackline) hardly moves during pressurization and that maximummembrane deformation occurs toward the center of the parstensa (blue line) and to a lesser degree near the edge of thepars tensa (red line). This observation is confirmed by the 2-D[part (III), (a) to (e)] and 3-D [part (IV), (f) to (j)] visualizationsof the full-field membrane height deformation maps, plottedhere at discrete intervals [(a) to (e)] during a pressurizationcycle. A full video of the eardrum deformation response isincluded in Video 2. The (semitransparent) colored height defor-mation map is plotted on top of the input intensity image toillustrate the deformation of the projected line patterns on themoving object surface.
Since full-field phase maps are recorded, the user is able tomonitor membrane deformation at any desired point on the
Fig. 6 Various steps of the 2þ 1 phase-shifting profilometry pipeline during measurement of TM (left ear,medial view) shape deformation. (a)–(c) Input intensity images, (d) wrapped phase map, (e) unwrappedphase map, and (d) height deformation map.
Fig. 5 Dynamic tympano-topography measurement setup. The oto-scopic profilometer head contains a disposable speculum, which isinserted into the ear canal of an airtight sealed temporal bone. Themiddle ear cavity is pressurized by connecting a small tube throughone of the mastoid cells to a pressure generator (not shown here).
Journal of Biomedical Optics 016008-7 January 2017 • Vol. 22(1)
Van der Jeught and Dirckx: Real-time structured light-based otoscopy for quantitative measurement of eardrum deformation
Downloaded From: https://www.spiedigitallibrary.org/journals/Journal-of-Biomedical-Optics on 14 Jan 2022Terms of Use: https://www.spiedigitallibrary.org/terms-of-use

observable TM surface. This way, the sensitivity of the tech-nique to detect middle ear pressure variation can be maximizedby monitoring the response curves of local areas on the TM thatdeform more than others. As the TM expands up to 1 mm whenrealistic pressure variations of 0.4 kPa are applied to it, the sys-tem’s measurement precision is more than sufficiently highenough to resolve the resulting deformation. Note the asymmet-ric response curve of the TM topography as a function ofinduced pressure. The TM displacement induced by middleear overpressure is larger than for the corresponding underpres-sure by a factor of almost 2. This effect was previously describedby Dirckx and Decraemer30 and can be attributed to the conicalshape of the membrane.
4 DiscussionThe ex vivo TM measurements demonstrate the ability of the3-D otoscope to detect pressure variations in the middle ear cav-ity by monitoring the 3-D shape variation of the eardrum in realtime. By asking patients to perform middle ear cavity (de)pres-surization maneuvers, such as the Valsalva maneuver (forcefulexhalation while closing one’s mouth and nose), TM displace-ment can be measured and eardrum mobility can be quantified.Therefore, the technique may have applications in the diagnosisof different pathologies encountered in the ENT office.
For example, impeded mobility at the level of the eardrummay be used to detect certain cases of otosclerosis or otospon-giosis where fixation of the incudomallear or incudostapedialjoint reduces the mobility of the eardrum.31
Another application could be the detection of local elasticityvariations in the TM. As aberrant local deformations or weakspots due to loss of stiffness of the TM could indicate structuraldamage and be an important precursor for cholesteatoma forma-tion,32 a need for quantitative evaluation of the full-field TMshape in vivo has been expressed.
To link the pathophysiological mechanisms of chronicmiddle ear disease, such as otitis media with effusion (OME)
to loss of TM stiffness, Dirckx et al.33 and von Unge et al.34
have conducted a series of ex vivo tympano-topography experi-ments on gerbil ears. By measuring the 3-D pressure-inducedshape deformations of TMs with varying degrees of otitis mediawhen increasing levels of pressure were applied, a correlationbetween TM volume displacement and stage of OME couldbe made. Therefore, as it has been shown that eardrum topog-raphy is a valuable technique to quantify the stage of the disease,a real-time handheld device to measure eardrum deformationmay also find application in this field.
In addition to the detection of pathologies that result directlyin aberrant eardrum mobility, tympano-topography could alsobe employed as a noninvasive indicator for deficient ET func-tioning. Patients who suffer from obstructive ET dysfunctionlack a mechanism to automatically equalize the air pressurein their middle ear cavity to the outside atmospheric pressure.This leads to inadequate aeration of the middle ear and causesthe eardrum to retract inward with possible destruction of theossicular chain. Recently, a surgical technique to treat obstruc-tive ET dysfunction using a balloon catheter to stretch the ETwas proposed.35 Promising short- and intermediate-term resultswere confirmed by a study of Van Rompaey et al.,36 indicatingno complications within the first year after 41 catheter insertionsin 26 patients. Again, however, the authors stated that the firstpriority is to have an objective evidence-based measurementtechnique to validate the long-term success of the proposed sur-gical procedure. To this end, dynamic tympano-topography mayprovide a solution for early and quantitative detection. By meas-uring the surface shape variation of the TM while patients areasked to perform the Valsalva maneuver, pressure stabilizationof the middle ear cavity and therefore functioning of the ET canbe evaluated objectively and quantitatively by monitoring theresulting changes in TM surface volume.
Due to the digital nature of the projector-camera system,any structured light-based profilometry technique can be imple-mented in the otoscopic profilometer. In this paper, we have
Fig. 7 Video 2 TM height deformation response to dynamic middle ear pressure variation. Heightdeformation profiles and full-field 2-D and 3-D deformation maps are included in parts (II), (III) and (IV),respectively. The positive z-axis is defined toward the observer and the colorbar legend defined inpart I applies to parts (III) and (IV), also. (Video 2, 4.74 MB, mp4 [URL: http://dx.doi.org/10.1117/1.JBO.22.1.016008.2]).
Journal of Biomedical Optics 016008-8 January 2017 • Vol. 22(1)
Van der Jeught and Dirckx: Real-time structured light-based otoscopy for quantitative measurement of eardrum deformation
Downloaded From: https://www.spiedigitallibrary.org/journals/Journal-of-Biomedical-Optics on 14 Jan 2022Terms of Use: https://www.spiedigitallibrary.org/terms-of-use
selected the 2þ 1 phase-shifting technique for two main rea-sons. First, it requires only three distinct input intensity images.This limits the acquisition time of a single 3-D image to 25 msfor our system, sufficiently brief to minimize motion artifactsdue to patient or operator movement. Second, the uniformlylit intensity image can be used in real time during live measure-ments to aid operator orientation when selecting the desired fieldof view on the TM surface.
Although the presented results provide a successful proof-of-principle of tympano-topography as a noninvasive tool tomonitor middle ear pressure change, several optimizations to theotoscopic profilometry prototype system may be necessarybefore validation in the clinical ENT office is in order.Currently, measurement resolution is limited by the 12-bit gray-scale range of the CCD camera. Due to the semitransparentnature of the TM structure, only a fraction of the light projectedonto the TM surface is reflected back. To improve the measure-ment sensitivity, the CCD range needs to be divided into asmany discrete grayscale bins as possible. This can be achievedeither by employing a camera sensor with a higher bit-range orcoating the TM surface with a diffusely reflecting dye or both.
Finally, it is worth mentioning that since the object-to-lensdistance in our system is much larger than the observeddepth variations themselves, the resulting geometric distortionartifacts between object points closer to and farther awayfrom the otoscope head are very small when compared with sys-tems that employ wide-angle lenses close to the object surface(e.g., dual-barrel endoscopic setups).
5 ConclusionAn otoscopic profilometry system based on structured light pro-jection was developed and experimentally tested. The handheldsystem is able to detect and quantify 3-D eardrum deformationcaused by small middle ear pressure changes in real time. Full-field height maps of 3-D objects can be recorded at 40 framesper second with a measurement precision varying between 10and 100 μm, depending on local surface reflection parametersand total object depth span. The device has a form factor similarto existing otoscopes, is easy to use, and provides a first steptoward implementation of quantitative tympano-topography inthe clinical ENT office.
DisclosuresThe authors have no relevant financial interests in the manu-script and no other potential conflicts of interest to disclose.
AcknowledgmentsThe authors thank the Research Foundation—Flanders (FWO)for their financial support.
References1. R. L. Shelton et al., “Optical coherence tomography for advanced
screening in the primary care office,” J. Biophotonics 7(7), 525–533(2014).
2. Z. Hubler et al., “Real-time automated thickness measurement of the invivo human tympanic membrane using optical coherence tomography,”Quantum Imaging Med. Surg. 5(1), 69–77 (2015).
3. S. M. Solís, F. M. Santoyo, and M. D. S. Hernández-Montes, “3Ddisplacement measurements of the tympanic membrane with digitalholographic interferometry,” Opt. Express 20(5), 5613 (2012).
4. M. Khaleghi et al., “Digital holographic measurements of shape and3D sound-induced displacements of tympanic membrane,” Opt. Eng.52(10), 101916 (2013).
5. S. Van der Jeught, J. Soons, and J. J. J. Dirckx, “Real-time microscopicphase-shifting profilometry,” Appl. Opt. 54(15), 4953–4959 (2015).
6. K. Gurusamy, K. Samraj, and B. R. Davidson, “Three dimensionalversus two dimensional imaging for laparoscopic cholecystectomy,”Cochrane Database Syst. Rev. (1), CD006882 (2008).
7. R. C. W. Bell and J. G. Price, “Laparoscopic inguinal hernia repair usingan anatomically contoured three-dimensional mesh,” Surg. Endosc.Other Interv. Tech. 17(11), 1784–1788 (2003).
8. N. J. Durr, G. Gonzalez, and V. Parot, “3D imaging techniques forimproved colonoscopy,” Expert Rev. Med. Dev. 11(2), 105–107 (2014).
9. S. Ieiri et al., “Augmented reality navigation system for laparoscopicsplenectomy in children based on preoperative CT image using opticaltracking device,” Pediatr. Surg. Int. 28(4), 341–346 (2012).
10. M. E. Hurley et al., “Three-dimensional volume-rendered helical CTbefore laparoscopic adrenalectomy,” Radiology 229(2), 581–586(2003).
11. A. Schneider et al., “Augmented reality assisted laparoscopic partialnephrectomy,” in Int. Conf. on Medical Image Computing andComputer-Assisted Intervention, Vol. 17, pp. 357–364 (2014).
12. L. M. Su et al., “Augmented reality during robot-assisted laparoscopicpartial nephrectomy: toward real-time 3D-CT to stereoscopic videoregistration,” Urology 73(4), 896–900 (2009).
13. A. F. Durrani and G. M. Preminger, “Three-dimensional video imagingfor endoscopic surgery,” Comput. Biol. Med. 25(2), 237–247 (1995).
14. A. Tabaee et al., “Three-dimensional endoscopic pituitary surgery,”Neurosurgery 64(Suppl. 5), ons288–ons295 (2009).
15. D. Stoyanov et al., “Real-time stereo reconstruction in roboticallyassisted minimally invasive surgery,” Lect. Not. Comput. Sci. 6361,275–282 (2010).
16. N. T. Clancy et al., “Spectrally encoded fiber-based structured lightingprobe for intraoperative 3D imaging,” Biomed. Opt. Express 2(11),3119–3128 (2011).
17. C. Schmalz et al., “An endoscopic 3D scanner based on structuredlight,” Med. Image Anal. 16(5), 1063–1072 (2012).
18. M. Hayashibe, N. Suzuki, and Y. Nakamura, “Laser-scan endoscopesystem for intraoperative geometry acquisition and surgical robot safetymanagement,” Med. Image Anal. 10(4), 509–519 (2006).
19. P. Mountney, D. Stoyanov, and G. Z. Yang, “Three-dimensional tissuedeformation recovery and tracking,” IEEE Signal Process Mag. 27(4),14–24 (2010).
20. D. J. Mirota, M. Ishii, and G. D. Hager, “Vision-based navigation inimage-guided interventions,” Annu. Rev. Biomed. Eng. 13, 297–319(2011).
21. N. Bedard et al., “Light field otoscope,” in Imaging Systems andApplications, pp. IM3C-6, Optical Society of America (2014).
22. A. J. Das et al., “A compact structured light based otoscope for threedimensional imaging of the tympanic membrane,” Proc. SPIE 9303,93031F (2015).
23. M. H. McDonald et al., “New insights into mechanism of Eustachiantube ventilation based on cine computed tomography images,” Eur.Arch. Oto-Rhino-Laryngol. 269(8), 1901–1907 (2012).
24. S. Zhang, “Recent progresses on real-time 3D shape measurement usingdigital fringe projection techniques,” Opt. Lasers Eng. 48(2), 149–158(2010).
25. S. Van der Jeught and J. J. J. Dirckx, “Real-time structured light pro-filometry: a review,” Opt. Lasers Eng. 87, 18–31 (2016).
26. S. Zhang and S.-T. Yau, “High-speed three-dimensional shape measure-ment system using a modified two-plus-one phase-shifting algorithm,”Opt. Eng. 46(11), 113603 (2007).
27. S. Van der Jeught, J. Sijbers, and J. Dirckx, “Fast Fourier-based phaseunwrapping on the graphics processing unit in real-time imaging appli-cations,” J. Imaging 1(1), 31–44 (2015).
28. Y. Xu et al., “Phase error compensation for three-dimensional shapemeasurement with projector defocusing,” Appl. Opt. 50(17), 2572–2581 (2011).
29. B. T. Phong, “Illumination for computer generated pictures,” Commun.ACM 18(6), 311–317 (1975).
30. J. J. J. Dirckx and W. F. Decraemer, “Human tympanic membranedeformation under static pressure,” Hear. Res. 51(1), 93–105 (1991).
31. W. Alian et al., “The effect of increased stiffness of the incudostapedialjoint on the transmission of air-conducted sound by the human middleear,” Otol. Neurotol. 34(8), 1503–1509 (2013).
Journal of Biomedical Optics 016008-9 January 2017 • Vol. 22(1)
Van der Jeught and Dirckx: Real-time structured light-based otoscopy for quantitative measurement of eardrum deformation
Downloaded From: https://www.spiedigitallibrary.org/journals/Journal-of-Biomedical-Optics on 14 Jan 2022Terms of Use: https://www.spiedigitallibrary.org/terms-of-use

32. M. Von Unge et al., “Evaluation of a model for studies on sequelae afteracute otitis media in the Mongolian gerbil,” Acta Otolaryngol. 129(3),261–267 (2009).
33. J. J. J. Dirckx et al., “Volume displacement of the gerbil eardrum parsflaccida as a function of middle ear pressure,” Hear. Res. 118(1–2),35–46 (1998).
34. M. Von Unge et al., “Tympanic membrane displacement patterns inexperimental cholesteatoma,” Hear. Res. 128(1–2), 1–15 (1999).
35. T. Ockermann et al., “Balloon dilatation eustachian tuboplasty:a clinical study,” Laryngoscope 120(7), 1411–1416 (2010).
36. V. Van Rompaey et al., “Eustachian tube balloon dilation surgery:current state of the art,” Tijdschr. Geneeskd. 70(18), 1052–1059(2014).
Sam Van der Jeught received his PhD in physics in 2015 from theUniversity of Antwerp for his dissertation entitled “Optical techniquesfor real-time morphology measurement of the tympanic membrane.”He is currently researching new optical methods for measuring humaneardrum shape in real-time and in vivo as a postdoctoral fellow withfunding from the Research Foundation—Flanders.
Joris J. J. Dirckx received his PhD in physics in 1991 from theUniversity of Antwerp for his dissertation entitled “Automated moirétopography and its use for shape and deformation measurementsof the eardrum.” He is currently director of the Laboratory ofBiomedical Physics and full professor in the Department of Physics.He teaches courses in general physics, optical microscopy, and bio-medical imaging.
Journal of Biomedical Optics 016008-10 January 2017 • Vol. 22(1)
Van der Jeught and Dirckx: Real-time structured light-based otoscopy for quantitative measurement of eardrum deformation
Downloaded From: https://www.spiedigitallibrary.org/journals/Journal-of-Biomedical-Optics on 14 Jan 2022Terms of Use: https://www.spiedigitallibrary.org/terms-of-use