real-time sensing of cell morphology by infrared waveguide spectroscopy
TRANSCRIPT
Real-Time Sensing of Cell Morphology by InfraredWaveguide SpectroscopyVictor Yashunsky1*., Tal Marciano1., Vladislav Lirtsman1, Michael Golosovsky1, Dan Davidov1,
Benjamin Aroeti2
1 The Racah Institute of Physics, The Hebrew University of Jerusalem, Jerusalem, Israel, 2 Department of Cell and Developmental Biology, The Alexander Silberman
Institute of Life Science, The Hebrew University of Jerusalem, Jerusalem, Israel
Abstract
We demonstrate that a live epithelial cell monolayer can act as a planar waveguide. Our infrared reflectivity measurementsshow that highly differentiated simple epithelial cells, which maintain tight intercellular connectivity, support efficientwaveguiding of the infrared light in the spectral region of 1.4–2.5 mm and 3.5–4 mm. The wavelength and the magnitude ofthe waveguide mode resonances disclose quantitative dynamic information on cell height and cell-cell connectivity. Todemonstrate this we show two experiments. In the first one we trace in real-time the kinetics of the disruption of cell-cellcontacts induced by calcium depletion. In the second one we show that cell treatment with the PI3-kinase inhibitorLY294002 results in a progressive decrease in cell height without affecting intercellular connectivity. Our data suggest thatinfrared waveguide spectroscopy can be used as a novel bio-sensing approach for studying the morphology of epithelialcell sheets in real-time, label-free manner and with high spatial-temporal resolution.
Citation: Yashunsky V, Marciano T, Lirtsman V, Golosovsky M, Davidov D, et al. (2012) Real-Time Sensing of Cell Morphology by Infrared WaveguideSpectroscopy. PLoS ONE 7(10): e48454. doi:10.1371/journal.pone.0048454
Editor: Eshel Ben-Jacob, Tel Aviv University, Israel
Received July 16, 2012; Accepted September 26, 2012; Published October 31, 2012
Copyright: � 2012 Yashunsky et al. This is an open-access article distributed under the terms of the Creative Commons Attribution License, which permitsunrestricted use, distribution, and reproduction in any medium, provided the original author and source are credited.
Funding: This work was supported by the NOFAR grant of the Israel Ministry of Industry and Trade. V.L. acknowledges support from the Lady Davis FellowshipFoundation. The funders had no role in study design, data collection and analysis, decision to publish, or preparation of the manuscript.
Competing Interests: The authors have declared that no competing interests exist.
* E-mail: [email protected]
. These authors contributed equally to this work.
Introduction
Living cells can act as optical devices. For instance, recent
studies have demonstrated single-cell lasing [1] and optical-fiber-
like functioning of the Muller retinal cells [2]. In this work we show
that a live epithelial cell monolayer can operate as a planar optical
waveguide in the infrared spectral region. Several factors conspire
to enable the propagation of infrared waveguide modes in cell
layers: (i) the ability of cells to self-assemble and form a tightly-
bound monolayer; (ii) the refractive index of cells is higher than
that of the surrounding aqueous media; (iii) the cell height is on the
order of the infrared wavelength. We succeeded to excite
waveguide modes in different epithelial cell types using prism
coupler and collimated infrared light. The waveguide mode
excitation is associated with resonant reflectivity minima at certain
incident angles. The magnitude and wavelength of these
resonances is determined by the intercellular connectivity and cell
monolayer thickness (i.e., the average cell height).
These waveguide mode resonances are sensitive to cell
monolayer structure that is controlled by interactions between
the cell cytoskeleton, the membrane, membrane-bound proteins,
and the extracellular environment [3] and reports on the state of
the cell monolayer in the same way as the structure of an
individual cell manifests it’s functioning [4]. While convenient
means to study cell structure such as confocal [5] and atomic force
microscopy [6,7], are excellent for accurate measurements of
structural changes in single cells but have decreased spatial and
temporal resolution in monitoring of cell monolayer structure. The
waveguide spectroscopy method that we propose here is capable to
quantitatively assess the cell monolayer structure containing large
cell population with temporal resolution of a few seconds and
submicron resolution in cell monolayer height. We demonstrate
two case studies in which we use the waveguide mode spectroscopy
to track the cell monolayer structure upon Ca2+ switch and PI3-
kinase inhibition.
Results
Wave Propagation in a Live Cell Monolayer Cultured onSubstrate
We noticed that the cell monolayer cultured on a substrate can
be considered as a planar optical waveguide. From a ‘‘physicist’s
point of view’’, a ,10 mm-thick cell monolayer tightly attached to
flat substrate and bathed with growth medium (99% water) forms
a dielectric trilayer with progressively decreasing refractive indices,
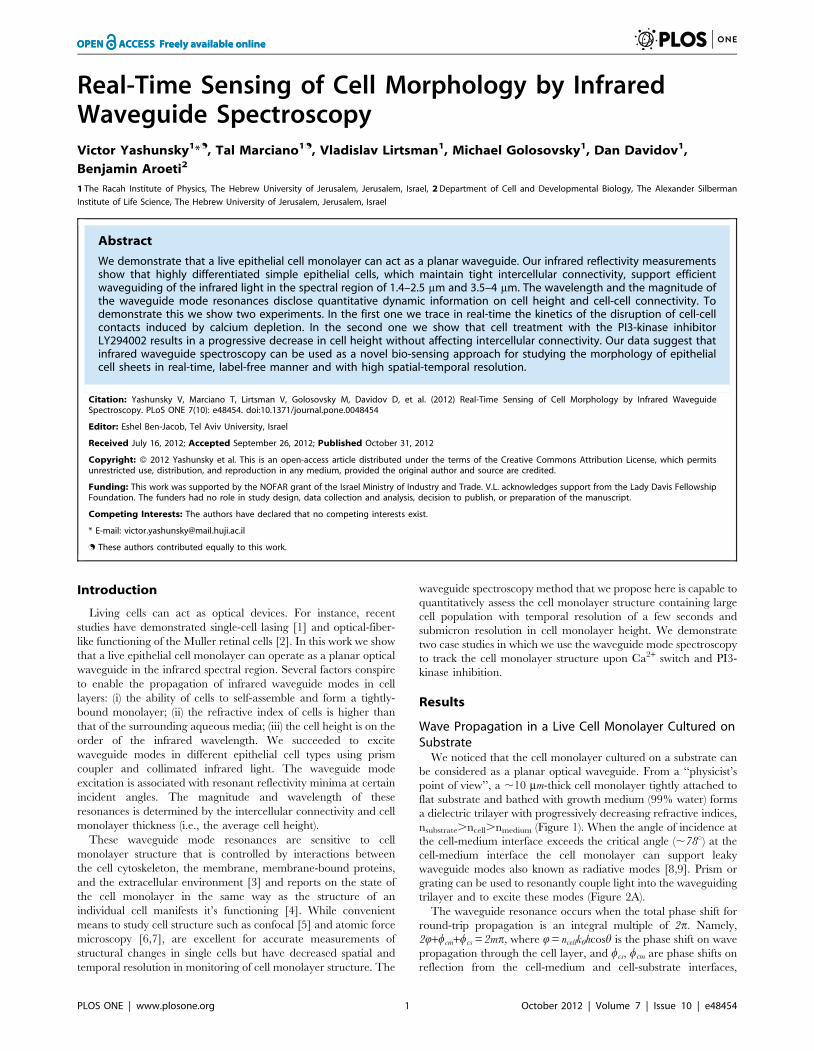
nsubstrate.ncell.nmedium (Figure 1). When the angle of incidence at
the cell-medium interface exceeds the critical angle (,78u) at the
cell-medium interface the cell monolayer can support leaky
waveguide modes also known as radiative modes [8,9]. Prism or
grating can be used to resonantly couple light into the waveguiding
trilayer and to excite these modes (Figure 2A).
The waveguide resonance occurs when the total phase shift for
round-trip propagation is an integral multiple of 2p. Namely,
2Q+wcm+wcs = 2mp, where Q = ncellk0hcosh is the phase shift on wave
propagation through the cell layer, and wcs, wcm are phase shifts on
reflection from the cell-medium and cell-substrate interfaces,
PLOS ONE | www.plosone.org 1 October 2012 | Volume 7 | Issue 10 | e48454
respectively. Here, k0 = 2p/l is the incident wave vector and h is
the cell layer thickness. For p-polarized incident light these
relations yield a set of resonant wavelengths corresponding to
TM1, TM2,… modes,
lTM~4pncellh cos h
2pm{wsc{wcm
ð1Þ
where m = 1,2,… The resonant wavelengths can be tuned by
varying the angle h.
The reflectivity from the trilayer assembly is given by the Airy
formula [10]
R~rsczrcme2 iQ{að Þ
1zrscrcme2 iQ{að Þ
��������2
ð2Þ
where rsc and rcm are complex Fresnel reflection coefficients at the
substrate-cell and cell-medium interfaces, correspondingly;
a = mcellh/cosh is the total attenuation during round trip propaga-
tion in the cell layer and mcell is the attenuation in the cell layer per
unit length. At certain wavelengths/angles the reflectivity R
achieves its minimum due to destructive interference of the waves
reflected from the substrate-cell and cell-medium interfaces
(reflected and refracted waves; Figure 1A). This minimum
corresponds to the waveguide mode excitation. The minimal
reflectivity, DRTM = Roff-resonance2Rresonance, is determined by the
wave attenuation, a. Apart from the intracellular absorption and
scattering, there can be dynamic losses associated with the
incomplete cell-cell attachment. This allows us to exploit the
magnitude of the waveguide resonance DRTM as an indicator of
dynamic changes in the cell-cell connectivity.
The reflection from the cell-substrate interface can be signifi-
cantly improved by introducing a thin conducting layer on top of
the substrate. This has some effect on the resonant wavelength
lTM since the phase shift at the cell-substrate interface becomes
wcs<p (Eq. 2). In addition, conducting layer enables excitation of
the TM0 mode which is essentially the surface plasmon (SP)
[11,12]. It should be noted that the SP mode in cell layer is
different from the waveguide modes in two aspects. First, the SP
mode does not require continuous cell monolayer and can be
excited in disconnected cells as well. The SP resonant wavelength
is
lSP&2pnsubstrate
neff k0 sin hinc
e{1m zn{2
eff
� �1=2ð3Þ
Here, em is the real part of the metal dielectric constant,
neff = (12f)nmedium+fncell is the effective refractive index of the cell
layer, and f is the cell coverage. Second, the SP field exponentially
decays away from the conducting film and does not reach the cell-
medium interface, thus its resonant wavelength lSP practically
does not depend on cell height [13,14].
In one experiment we can measure the waveguide and the
surface plasmon resonance that yield complementary information
on cell layer. The lTM and DRTM measure the average cell height
and the degree of intercellular attachment, while lSP monitors the
cell-substrate coverage.
Waveguide Mode Excitation in a Live Cell MonolayerWe reasoned that a tight epithelial cell monolayer could serve as
a suitable model to observe the waveguide modes in live cells. We
used the Madin-Darby canine kidney (MDCK type II) cells which
are non-cancerous and highly differentiated renal epithelial cells,
commonly used to study epithelial cell biology and epithelial tissue
development [3]. These cells typically grow as a tight and
continuous monolayer with an average height of h = 8-to-14 mm,
depending upon cell culturing conditions, and have intra-layer
height variation of only Dh,1 mm [15–17]. A typical cross-section
of GFP-LifeAct-expressing MDCK cell monolayer visualized by
confocal microscopy is presented in Figure 1B.
We cultured MDCK cells as a confluent monolayer for three
days directly on an Au-coated ZnS prism (see Figure 2A and
Materials and Methods) and measured the reflectivity spectra at
oblique angle using a Fourier-Transform Infrared (FTIR) spec-
trometer [18]. At certain wavelengths we observed reflectivity
minima which we attributed to the surface plasmon (SP) and to the
waveguide mode resonances (TM1 and TM2; Figure 2B). While
the SP appears also in the absence of cells, the TM-resonances
appear only in the presence of intact cell monolayer (Figure S1).
This interpretation is also supported by computer simulation based
on Fresnel reflectivity formulae for a quad-layer (ZnS/Au/cells/
medium) with cell height h as a fitting parameter [19–21] (Figure
S2).
The TM1-mode has been also observed in cancerous and poorly
differentiated epithelial human cells (e.g., the melanoma MEL
1106, and the cervix carcinoma HeLa cells (Figures S3A-D).
Interestingly, however, the TM1-mode resonance was deeper in
the non-cancerous MDCK (Figures S3E and F) and IEC6 (not
shown) epithelial cells. The TM2-mode has been observed so far
only in the non-cancerous cell layers. These data suggest that
tightly interconnected and polarized epithelial cell monolayers
support waveguide mode propagation.
Figure 1. Schematic representation of intracellular leakywaveguide mode propagation in a living cell monolayer. A.Waveguide mode excitation in a living cell monolayer. An electromag-netic wave penetrates at an incident angle hinc from the high-refractive-index substrate into a cell monolayer having a lower refractive index,ncell,. Because nmedium is lower than ncell, this wave undergoes totalinternal reflection at the cell-medium interface. The wave thenimpinges on the cell-substrate interface where it is partially reflected(solid red arrow) and refracted (pale red arrow). Excitation of theradiative (leaky) waveguide mode occurs when the reflected andrefracted waves at the substrate-cell interface interfere destructively,confining the energy within the cell layer. B. XZ-section of epithelialMDCK cell monolayer stably expressing LifeAct-GFP as imaged byconfocal microscopy. Scale bars: 10 mm.doi:10.1371/journal.pone.0048454.g001
Infrared Waveguide Mode in Living Cells
PLOS ONE | www.plosone.org 2 October 2012 | Volume 7 | Issue 10 | e48454

Waveguide Modes Emerge only When Cells DevelopIntercellular Contacts
To prove that the observed resonances are related to waveguide
mode excitation in the cell layer rather than in individual cells, we
studied dynamics of these resonances during cell monolayer
formation. The suspended MDCK cells were introduced into the
flow chamber and allowed to adhere to the Au-substrate until a
confluent cell monolayer is formed. The MDCK cell monolayer
formation exhibits three phases [18] (Figure S4): (I) an early phase
of cell-substrate attachment and spreading; (II) an intermediate
phase whereby cell-cell contacts are established and the small cell
clusters appear; (III) a late phase at which voids between cell
clusters are closed (healed) until a tight and fully confluent cell
monolayer is formed.
Cell monolayer formation was tracked simultaneously by optical
microscopy (Figure 3A) and by the infrared reflectivity spectral
measurements (Figure 3B) at 1 min time intervals. While the
surface plasmon wavelength lSP progressively increases during all
three phases due to growing cell coverage (Figure 3C, upper
panel), the TM1 waveguide mode (Figure 3C, middle and lower
panels) appears only at phase II, upon the initiation of cell-cell
contacts and formation of intact cell clusters. The magnitude of the
TM1 resonance is influenced by the quality of the intercellular
contacts. Thus, the establishment of cell-cell contacts during phase
II is the main contributing factor to the increase in DRTM. Further
increase in DRTM during phase III suggests development of tighter
cell-cell contacts in the cell monolayer.
Figure 2. Excitation of intracellular waveguide modes using a collimated broadband infrared beam. A. Experimental setup. A cell layerwas cultured on an Au-coated ZnS prism as described in Materials and Methods. During the measurement, the cells in the flow chamber wereexposed to culture medium at constant flow. The collimated and polarized infrared beam from the FTIR spectrometer impinges on the gold layer atangle hinc and excites waveguide modes within the cell layer (panel C). The intensity of the reflected beam is measured by an MCT detector.Simultaneously, the cells are optically imaged by a CMOS camera attached to the optical microscope. B. Wavelength-dependent reflectivitymeasurement (Ip/Is, see Materials and Methods) from the ZnS/Au/MDCK cells/medium assembly at hinc = 34.8u. The reflection minima correspond tothe surface plasmon (SP) resonance and to the waveguide mode resonances (TM1 and TM2). C. Schematic representation of the electric fielddistribution for the surface plasmon and TM1 waveguide mode propagating in the cell layer. The surface plasmon penetrates only up to ,2 mm intothe cell layer and is thus sensitive mainly to the cell-substrate interface. The TM1 mode penetrates much further, it is confined within the entire cellvolume and can be used to measure the cell height h. D. Angular-resolved reflectivity spectra from the ZnS/Au/MDCK cells/medium assembly. Thestrong reflectivity minimum (deep blue) arises from the surface plasmon resonance. Its angular dependence mimics the dispersion of the waterrefractive index. A shallow minimum at lower angles (light blue) corresponds to the TM1 waveguide mode. This mode does not appear in the absenceof cell layer (i.e., in a bare Au substrate; see Figure S1).doi:10.1371/journal.pone.0048454.g002
Infrared Waveguide Mode in Living Cells
PLOS ONE | www.plosone.org 3 October 2012 | Volume 7 | Issue 10 | e48454

Figure 3. Waveguide mode appears only when intercellular contacts are formed. A. Three phases in MDCK cell monolayer formation asvisualized by optical microscopy. Suspended MDCK cells were introduced and allowed to adhere to the gold substrate. Scale bar = 20 mm. B. Infraredreflectivity spectra measured during the three phases of monolayer formation. The surface plasmon resonance shifts towards longer wavelengths ascells attach and cover the Au substrate. The TM1 waveguide mode appears only at phase II, in parallel to the establishment of intercellular contacts byneighboring cells. The increasing magnitude of the TM1 resonance, DRTM, is associated with the development and tightening of cell-cell contacts. Theprogressive red-shift of the resonant wavelength lTM results from the increasing cell height. C. Time-resolved measurements of lSP, DRTM, and lTM.The right y-axes show the corresponding changes in the cell coverage f, cell-cell attachment and cell height h. The distinct phases in monolayerformation (I, II and III) are indicated.doi:10.1371/journal.pone.0048454.g003
Infrared Waveguide Mode in Living Cells
PLOS ONE | www.plosone.org 4 October 2012 | Volume 7 | Issue 10 | e48454

The resonance wavelength lTM, which measures the average
cell height in a continuous cell monolayer (see Eq. 1), increases
during phase II. This suggests that the height of the cells, which
attach to each other, grows. Immediately thereafter, at the
beginning of phase III (230–280 min), lTM temporarily decreases.
This indicates the cell height decrease which is probably associated
with cell flattening during cluster merging and void closure. A
similar decrease in cell height has been reported for cells lining the
leading edge of a wounded cell monolayer in wound-healing
experiments [17]. Following this phase, the cell height slowly
grows again, and after 48 hrs of incubation it reaches h,8 mm.
This experiment proves that the waveguide mode appears only
in the well-connected cell monolayer and that the resonance
wavelength can monitor the average cell monolayer height.
Waveguide Modes Sense Changes in Cell MonolayerIntegrity in Response to Calcium Depletion andReplenishment
In the next experiment we analyzed the response of an intact
MDCK monolayer to morphological perturbations induced by
alterations in extracellular Ca2+ concentration. Exposure of an
intact epithelial cell monolayer to low-calcium medium results in
disruption of cell-cell adhesion and in cell morphology changes.
The effect is reversible, the Ca2+ replenishment restores the cell-
cell contacts [22] (Figure 4A). We expected that the disruption of
cell monolayer integrity by Ca2+ depletion and its restoration by
Ca2+-replenishment could be tracked by observing the wavelength
and magnitude of the waveguide and SP resonances. Indeed,
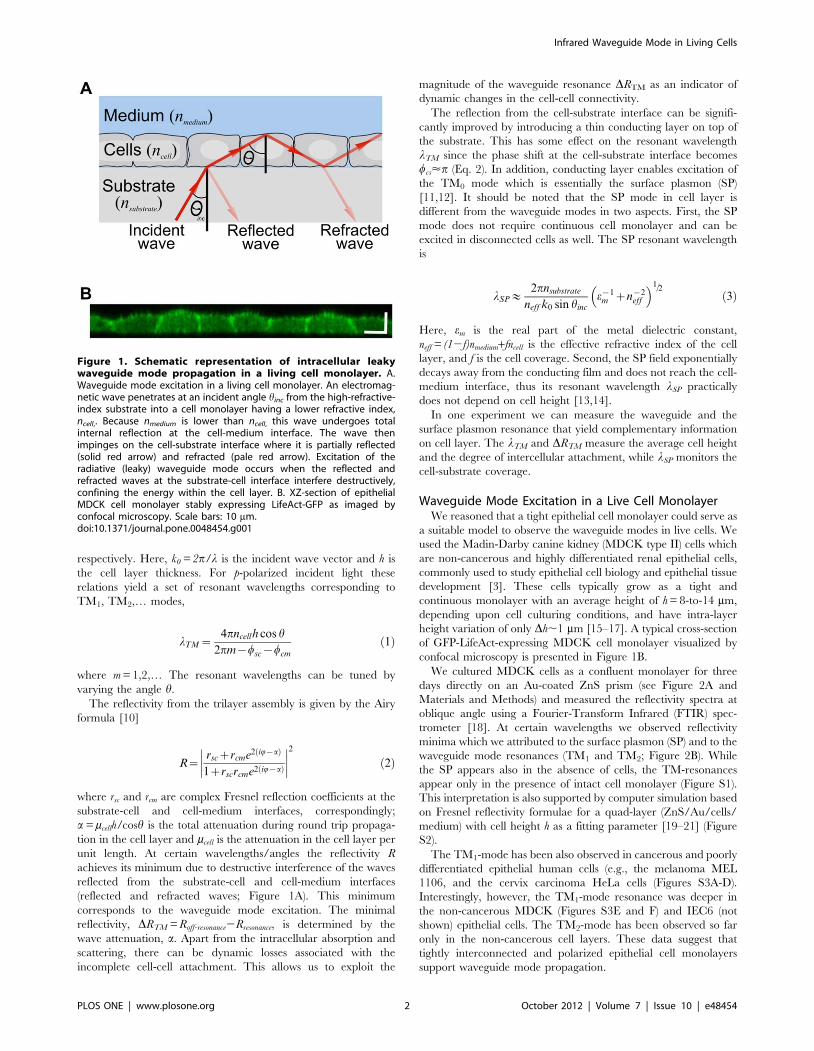
exposure of the cell monolayer to low-calcium medium led to a
sharp blue-shift in lSP (Figure 4B, upper panel), corresponding to
decreasing cell coverage. This response was consistent with optical
images where we observed the appearance of wounds (i.e., cell-
devoid regions) on the substrate following Ca2+ depletion (see
green colored area in Figure 4A, middle panel). Surprisingly
however, ,15 min after cell exposure to low Ca2+ medium, lSP
was red-shifted, indicating that cell coverage was partially restored.
This phenomenon could be attributed to a reduction in cortical
actin tension (further explained below). Cell exposure to medium
containing normal Ca2+ concentration (+Ca2+), produced a red-
shift in lSP, which eventually came back to the original
pretreatment value. Correspondingly, the gaps in cell monolayer
were completely healed (Figure 4A, 140 min). Similar to lSP,
DRTM and lTM (Figure 4B, middle and lower panels, respectively)
revealed a reversible dynamic profile, but with slower response.
We suggest the following model to explain these data. Prior to
Ca2+ depletion, MDCK cells were cultured in medium containing
normal Ca2+ level, conditions under which the cells form a
confluent monolayer with tight cell-cell and cell-substrate adherent
junctions. As previously described [17,23,24], the existence of
actomyosin-bound intercellular junctions (e.g., tight and adher-
ence junctions) generate a tensed cell layer due to pulling forces on
the cell cortex (periphery) (exemplified by double arrowheads in
Figure 4C). Ca2+ depletion disrupts cell-cell junctions [25],
resulting in local loss of cell-cell, but not cell-substrate contacts.
Then, due to the imposed pulling forces between contacting cells,
these ‘‘localized wounds’’ further expand and cell-free substrate
regions appear (red arrows in ‘‘wound’’; Figure 4C and green-
colored areas; Figure 4A, 30 min). This phase corresponds to the
fast blue-sift in lSP (‘‘wound’’; Figure 4B, upper panel). Continuous
cell exposure to low-Ca2+ medium results in progressive
disassembly of intercellular junctions and in lowering of the
intercellular tension (‘‘relax’’; Figure 4C). Disruption of cell-cell
contacts contributes to the decrease of DRTM. At the same time,
the lowering of tension results in cell height reduction which is
detected by a blue-shift in lTM. Since the cell-substrate adhesion is
mediated by Ca-insensitive integrins and Ig-superfamily adhesion
molecules [25], cell coverage could be partially restored due to
relaxation of the intercellular tension (Figure 4C, ‘‘relax’’), as
indicated by the gradual red-shift in lSP (Figure 4B, upper panel).
Ca2+ replenishment causes a fast (20 min) and full recovery in cell
coverage, as indeed indicated by the sharp red shift in lSP
(Figure 4B, upper panel). The restoration of cell-cell contacts is
slower (45 min). The DRTM recovers accordingly (Figure 4B,
middle panel). Cell height restoration, measured by a red shift in
lTM, occurs even at a slower pace (Figure 4B, lower panel). This
reflects the longer time needed for the establishment of cell-cell
junctions mediating the actomyosin tension required for columnar
cell shaping [26].
Phosphatidylinositol 3-kinase (PI3K) Inhibition ReducesCell Height Without Affecting Epithelial MonolayerIntactness
The treatments applied so far are known to have concomitant
effects on cell height, cell-cell and cell-substrate contacts. Our next
aim in the context of examining the analytical abilities of the
waveguide spectroscopy was to apply a treatment that will have a
selective effect. For instance, we looked for a treatment that would
affect the cell height, but not the monolayer integrity. Indeed,
confocal microscopy studies on fixed MDCK cell have shown that
inhibition of the PI3K with LY294002 (LY) has no detectable
effect on MDCK monolayer intactness, while in all cases it
significantly reduced the cell height [15,16].
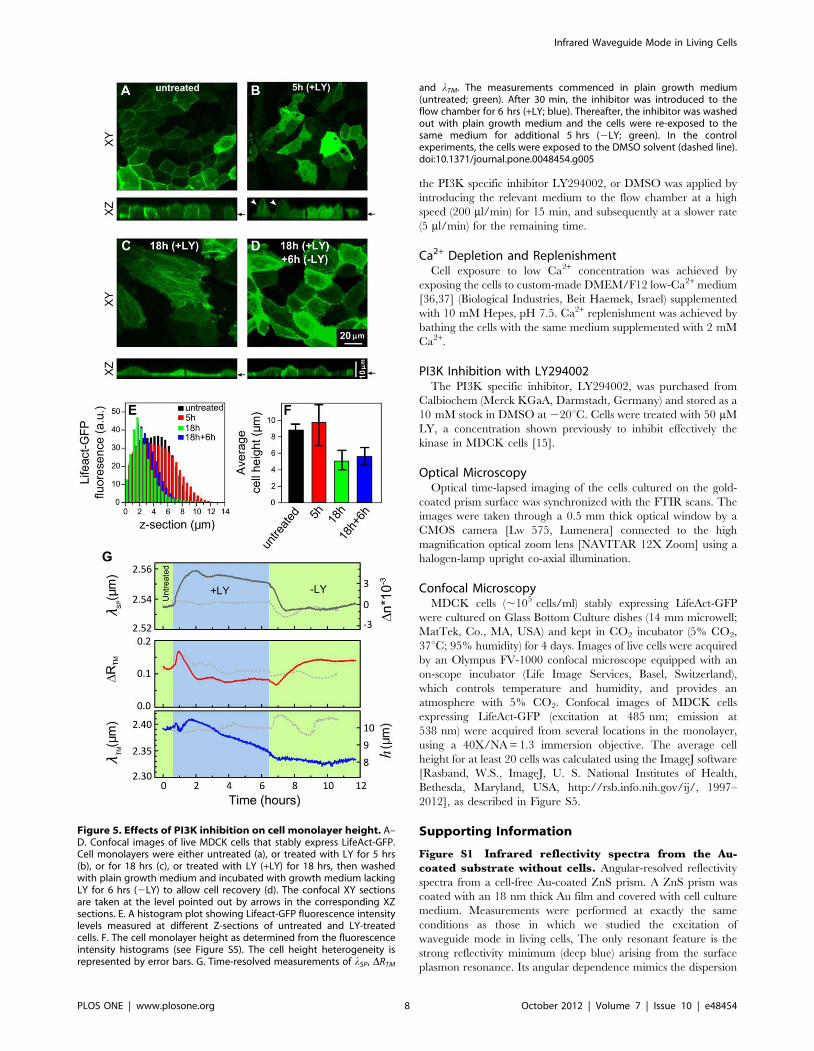
To investigate this effect in live cells, we exposed live GFP-
LifeAct- expressing MDCK monolayers to LY treatment and
examined their morphology using confocal microscope
(Figures 5A–D). The cell height was measured as described (see
Figures 5E,F and S5). Prior to treatment, the cells in the
monolayer revealed a typical cortical actin filament labeling and
their height was approximately 8 mm (Figures 5A and F). The
initial 5 hrs of cell treatment resulted in a significant heterogeneity
in cell height (Figures 5B and F); some cells have bulged out of the
cell layer (indicated with arrows, Figure 5B), thus exhibiting a
taller morphology compared to the neighboring cells. Interesting-
ly, after 18 hrs post-treatment, the cell monolayer remained
confluent, yet, individual cells within the monolayer had
considerably flattened, and their height appeared to be consis-
tently reduced throughout the entire monolayer (Figures 5C and
F). After drug removal and cell monolayer exposure to a plain
growth medium for 6 hrs, the cells’ height and cortical actin
filament labeling partially recovered (Figures 5D and F).
Next, we applied LY treatment to non-labeled MDCK cell
monolayer cultured on gold substrate and structural changes were
monitored using the infrared waveguide spectroscopy technique.
The TM1 resonant wavelength lTM was gradually blue-shifted
during 6 hrs of LY treatment (+LY; Figure 5G, lower panel),
indicating that cell height was reduced from 10 to 8 mm. The
decrease in cell height slowed down significantly upon LY
removal, and partially reversed after 3.5 hrs (2LY; Figure 5G,
lower panel). The surface plasmon wavelength yields complemen-
tary information on cell layer morphology. Indeed, lSP became
red-shifted upon exposure to LY, indicating that the refractive
index neff nearby the substrate was increased, suggesting that the
cell-substrate interactions became even more intimate in the LY-
treated cells. Interestingly, following ,1 hour of LY removal
(2LY; Figure 5G, top panel) the shift in lSP was completely
reversed, essentially reaching its pretreatment values.
The slight reduction in DRTM in response to LY treatment was
similar to that obtained by the control treatment with DMSO
Infrared Waveguide Mode in Living Cells
PLOS ONE | www.plosone.org 5 October 2012 | Volume 7 | Issue 10 | e48454
Figure 4. The effects of extracellular Ca2+ concentration on MDCK cell monolayer structure. A. Optical microscopy. MDCK cells werecultured as a confluent monolayer in Ca2+-containing growth medium for 3 days (untreated). The same cells were then exposed to low-Ca2+ medium
Infrared Waveguide Mode in Living Cells
PLOS ONE | www.plosone.org 6 October 2012 | Volume 7 | Issue 10 | e48454
solvent without LY. We believe that in both cases the DRTM
reduction was most probably related to the increased heteroge-
neity in cell heights (see Figure S5) rather than to cell monolayer
disruption. This interpretation is also supported by the fact that
lSP was red-shifted during the LY treatment. However, the
recovery in DRTM upon LY removal seems to be specific,
suggesting that homogeneity in cell height is restored.
Discussion
We demonstrate that tightly packed live epithelial cell mono-
layers can guide electromagnetic radiation. The infrared wave-
lengths are favorable for the waveguide mode excitation in a living
cell layer for the following reasons: a) the typical thickness of an
epithelial cell monolayer (h,10 mm) is on the order of the infrared
wavelength, and b) scattering losses on intracellular compartments
are relatively low in that wavelength range [20]. Using different
epithelial cell lines, we found that waveguide modes can be excited
in (i) intact cell clusters of at least 100 mm in length; (ii) cell height
uniformity of Dh ,1 mm.
In this study we show that waveguide mode spectroscopy can be
used as a novel label-free method for real-time sensing of cell
monolayer intactness and height. Similar properties can be
monitored by confocal microscopy or atomic force microscopy
(AFM). However, these methods can perform precise single cell
analyses, and they cannot track with the same prescription a large
cell population. In addition, AFM has a poor temporal resolution
[6,7]. In contrast, the infrared waveguide mode spectroscopy
enables label-free monitoring of large cell populations (,106 cells)
with submicron precision in cell height and a time resolution of
seconds. Thus, this method can also be used to study the collective
behavior of cells in the context of tissues and organs, and in
response to various physiological and patho-physiological process-
es, such as epithelial-to-mesenchymal transition [27], the devel-
opment of certain epithelial cancers [28], inflammatory bowel
diseases [29], epithelial cell infection by microbial pathogens [30],
and epithelial tissue injury [31].
An interesting issue arising from our research of the cell layer
waveguiding phenomenon is the spectrum of thermal radiation
that is emitted from warm blooded (,300uK) organisms typically
covered by skin epithelium. Since the epithelium layer can carry
the waveguide modes that appear as dips in the infrared
absorption spectra, we suggest that equivalent features may
appear in the thermal emission spectra of these organisms, whose
emission spectra spans from ,5 to 40 mm. These features could be
informative for diagnosing the thermal characteristics of tissues in
disease states [32–34].
In summary, for the first time we have demonstrated an exciting
biophotonic phenomenon of infrared light waveguiding in live
epithelial cell monolayers. We applied this finding for monitoring
the intactness and thickness of the epithelial cell layers. We believe
that the demonstrated capacity of monitoring these cellular
parameters in real-time, label free and with high sensitivity may
pave the way for waveguide spectroscopy to become an attractive
diagnostic tool in the future.
Materials and Methods
Infrared Optical SetupOur experimental setup is based on the commercial FTIR
spectrometer (Equinox 55, Bruker Inc.) equipped with a home-
made surface-plasmon plug-in. The infrared beam is collimated,
polarized and reflected from the right-angle ZnS prism
[40620 mm2 base (ISP Optics, Inc., Irvington, N.Y, US)] coated
with 18 nm thick gold film (Figure 1A). The reflected beam is
collected by the liquid-nitrogen-cooled MCT (HgCdTe) detector.
In time-dependent measurements, reflectivity of p-polarized beam
at fixed incident angle was normalized to the reflectivity of the s-
polarized beam taken at time zero. Each spectral measurement
takes ,25 sec and represents an average over 8 scans with 8 cm21
resolution.
Data ProcessingThe monolayer cell height was calculated from the TM1
resonant wavelength, using the refractive index of the cell layer
found from the wavelength of the surface plasmon resonance. To
this end we used Fresnel equations for a four-layer assembly (ZnS/
18 nm Au/cell layer/culture medium), to fit the measured
reflectivity spectrum at known angle hinc see Figure S2.
Cell Preparation and CultureMDCK cells were routinely cultured in growth medium (MEM
Earle’s salts supplemented with 5% fetal bovine serum (FBS) and
1% antibiotics), as described [35]. Following three days in culture,
a fully confluent cell monolayer was detached from the dish by
trypsin treatment (0.25% Trypsin/EDTA in Puck’s saline A;
Biological Industries, Israel). Cells were washed with plain growth
medium and resuspended in 10 ml of the same medium. Then,
1.5 ml of the cell suspension was placed on the surface of a gold-
coated prism, previously mounted on a sterile polycarbonate base.
The cells were allowed to adhere to the Au surface for 30 min in
the CO2 incubator (5% CO2, 37uC, 90% humidity). Then, 9 ml of
growth medium were added gently to the cells, and the prism with
cells was further incubated for 3–4 days in the CO2 atmosphere
until a continuous cell monolayer was formed. The prism with
cells was then attached to the flow chamber (Figure 2A), and cells
were maintained under continuous flow (5 ml/min) of the fresh
culture medium supplemented with 10 mM Hepes, pH 7.5. Cell
treatment with media containing different Ca2+ concentrations, or
for 60 min (2Ca2+). The appearance of cell-free areas (wounds) in the Au substrate in response to exposure to low-Ca2+ medium are artificiallycolored in green. The cells that encircle the wounded areas achieve a round shape (white arrowheads). The cell layer was then exposed to the samemedium supplemented with physiological Ca2+ concentrations (+Ca2+), that corresponds to conditions under which the wounds in the cell layer heal.Scale bar: 20 mm. B. Time-resolved measurements of lSP, DRTM and lTM. Initially, the cells were maintained in Ca2+-containing growth medium, andmeasurements were taken continuously for 15 min (blue). Then, low-Ca2+ medium was introduced to the flow chamber for approximately 60 min(2Ca2+; green panel). Thereafter, cells were re-exposed to the Ca2+-containing medium. The dynamic response to cell monolayer wounding (redarrow) and relaxation (green arrow) in low-Ca2+ medium are discussed below and in the text. C. Schematic model for the cell monolayer response tolow-Ca2+ treatment. Upper panel: In the presence of Ca2+, namely, prior to Ca2+ depletion (untreated) or after Ca2+ replenishment (+Ca2+), the cellsform an intact monolayer and maintain tight intercellular cell-cell junctions. These junctions, which are known to be tightly connected to the corticalactin cytoskeleton, produce pulling forces on neighboring cells (indicated by double-headed arrows, see also [24]). Middle panel: the lowering theCa2+ concentration results in the appearance of cell-devoid areas (wounds) in the monolayer. These areas are expanded by pulling forces applied bythe cells in the intact monolayer surrounding the wounded area (red arrows). Lower panel: At later stages and under low Ca2+ conditions, cell-celljunctions are progressively damaged, leading to the relaxation of the intercellular cortical tension. Since cell-substrate adhesion is Ca2+-insensitive[25], the relaxation of intercellular cortical tension allows cell spreading and thereby partial recovery of substrate coverage.doi:10.1371/journal.pone.0048454.g004
Infrared Waveguide Mode in Living Cells
PLOS ONE | www.plosone.org 7 October 2012 | Volume 7 | Issue 10 | e48454
the PI3K specific inhibitor LY294002, or DMSO was applied by
introducing the relevant medium to the flow chamber at a high
speed (200 ml/min) for 15 min, and subsequently at a slower rate
(5 ml/min) for the remaining time.
Ca2+ Depletion and ReplenishmentCell exposure to low Ca2+ concentration was achieved by
exposing the cells to custom-made DMEM/F12 low-Ca2+ medium
[36,37] (Biological Industries, Beit Haemek, Israel) supplemented
with 10 mM Hepes, pH 7.5. Ca2+ replenishment was achieved by
bathing the cells with the same medium supplemented with 2 mM
Ca2+.
PI3K Inhibition with LY294002The PI3K specific inhibitor, LY294002, was purchased from
Calbiochem (Merck KGaA, Darmstadt, Germany) and stored as a
10 mM stock in DMSO at 220uC. Cells were treated with 50 mM
LY, a concentration shown previously to inhibit effectively the
kinase in MDCK cells [15].
Optical MicroscopyOptical time-lapsed imaging of the cells cultured on the gold-
coated prism surface was synchronized with the FTIR scans. The
images were taken through a 0.5 mm thick optical window by a
CMOS camera [Lw 575, Lumenera] connected to the high
magnification optical zoom lens [NAVITAR 12X Zoom] using a
halogen-lamp upright co-axial illumination.
Confocal MicroscopyMDCK cells (,105 cells/ml) stably expressing LifeAct-GFP
were cultured on Glass Bottom Culture dishes (14 mm microwell;
MatTek, Co., MA, USA) and kept in CO2 incubator (5% CO2,
37uC; 95% humidity) for 4 days. Images of live cells were acquired
by an Olympus FV-1000 confocal microscope equipped with an
on-scope incubator (Life Image Services, Basel, Switzerland),
which controls temperature and humidity, and provides an
atmosphere with 5% CO2. Confocal images of MDCK cells
expressing LifeAct-GFP (excitation at 485 nm; emission at
538 nm) were acquired from several locations in the monolayer,
using a 40X/NA = 1.3 immersion objective. The average cell
height for at least 20 cells was calculated using the ImageJ software
[Rasband, W.S., ImageJ, U. S. National Institutes of Health,
Bethesda, Maryland, USA, http://rsb.info.nih.gov/ij/, 1997–
2012], as described in Figure S5.
Supporting Information
Figure S1 Infrared reflectivity spectra from the Au-coated substrate without cells. Angular-resolved reflectivity
spectra from a cell-free Au-coated ZnS prism. A ZnS prism was
coated with an 18 nm thick Au film and covered with cell culture
medium. Measurements were performed at exactly the same
conditions as those in which we studied the excitation of
waveguide mode in living cells, The only resonant feature is the
strong reflectivity minimum (deep blue) arising from the surface
plasmon resonance. Its angular dependence mimics the dispersion
Figure 5. Effects of PI3K inhibition on cell monolayer height. A–D. Confocal images of live MDCK cells that stably express LifeAct-GFP.Cell monolayers were either untreated (a), or treated with LY for 5 hrs(b), or for 18 hrs (c), or treated with LY (+LY) for 18 hrs, then washedwith plain growth medium and incubated with growth medium lackingLY for 6 hrs (2LY) to allow cell recovery (d). The confocal XY sectionsare taken at the level pointed out by arrows in the corresponding XZsections. E. A histogram plot showing Lifeact-GFP fluorescence intensitylevels measured at different Z-sections of untreated and LY-treatedcells. F. The cell monolayer height as determined from the fluorescenceintensity histograms (see Figure S5). The cell height heterogeneity isrepresented by error bars. G. Time-resolved measurements of lSP, DRTM
and lTM. The measurements commenced in plain growth medium(untreated; green). After 30 min, the inhibitor was introduced to theflow chamber for 6 hrs (+LY; blue). Thereafter, the inhibitor was washedout with plain growth medium and the cells were re-exposed to thesame medium for additional 5 hrs (2LY; green). In the controlexperiments, the cells were exposed to the DMSO solvent (dashed line).doi:10.1371/journal.pone.0048454.g005
Infrared Waveguide Mode in Living Cells
PLOS ONE | www.plosone.org 8 October 2012 | Volume 7 | Issue 10 | e48454

of the water refractive index. The results show that waveguide
modes do not appear in the absence of a cell layer.
(TIFF)
Figure S2 Modeling of reflectivity spectrum with Fres-nel quad-layer model. Experimental data of infrared reflectiv-
ity spectrum of an MDCK cell monolayer compared with the
calculated spectrum of a four layer assembly (ZnS/18 nm Au-
film/cell layer/culture medium this is confusing because in your
theoretical background you considered a three-layer assembly).
The following parameters have been used in the Fresnel
simulation: internal incidence angle, hinc = 34.6u, cell layer
thickness h = 5.5 mm. The refractive index of each layer was
determined by an independent measurement [20].
(TIFF)
Figure S3 Waveguide modes in different epithelial cellmonolayers. A–H. Infrared reflectivity spectra from different
cells cultures on an Au-substrate. Both surface plasmon (deep
resonances) and waveguide modes (shallow resonances) are
present, the latter are zoomed in panels B,D,F. The wavelength
of the surface plasmon (SP) and waveguide modes (TM) could be
fine-tuned by changing the incident angle, hinc. The pale red color
corresponds to a larger incident angle. Panels h and g exemplify
the TM and SP resonances at longer wavelengths (l = 3.5–4 mm).
(TIFF)
Figure S4 Evolution of the surface plasmon resonancewavelength and depth resolves different phases in theprocess of MDCK cell monolayer formation. A. Resonant
wavelength of the surface plasmon (lSP, upper panel) and
corresponding refractive index change, Dnd (right y-axis). The
reflectivity at surface plasmon resonance (Rmin, lower panel) is
determined by the losses on SP propagation. At l,2.5 mm the
major contribution to the SP losses comes from the scattering of
the SP wave on cell-medium interfaces, see [18]. B. Rmin as
function of the cell coverage, as calculated from the lSP, resolves
different phases in cellular morphology; I- deposition and
spreading of individual cells (concomitant growth of the cell
coverage and perimeter of cell-covered regions), II- cell-cell
attachment (growth in cell coverage and almost constant cell
perimeter), III- monolayer closure (growth in cell coverage and
decrease of cell perimeter).
(TIFF)
Figure S5 Determination of cell height and its hetero-geneity within a cell monolayer by the quantitativeconfocal imaging. A. Confocal optical sectioning of live MDCK
cells stably expressing LifeAct-GFP. The entire cell volume was
visualized following fluorescent tagging of the actin cytoskeleton
and thin (,0.4 mm) confocal sectioning from below the substrate-
cell interface (z = 20.5 mm), where fluorescent levels were
minimal, up to the cells’ most apex regions where the recorded
fluorescence levels became minimal (z = 13.0 mm). Montage of XY
images taken at 0.5 mm intervals is shown. Bar = 50 mm. B.
Determination of cell height (h). The average fluorescence intensity
of LifeAct-GFP was measured at different z-sections using confocal
microscopy. The background fluorescence level from the substrate
plane (z = 20.5 mm) was subtracted and fluorescence levels were
normalized to the maximum value. Cell height (h) was defined as
the size where fluorescence level is above 20% from the maximum.
The heterogeneity of the cell height (Dh, i.e. intralayer variability)
was taken as a half of width where the fluorescence drops from
80% to 20%. Note that floating or swollen cells which have bulged
out of the cell layer (pointed by the red arrow-heads, plane A.)
were excluded from the fluorescence intensity calculations.
(TIFF)
Author Contributions
Conceived and designed the experiments: VY TM MG. Performed the
experiments: VY TM. Analyzed the data: VY TM MG. Contributed
reagents/materials/analysis tools: VY VL MG BA. Wrote the paper: VY
TM VL MG BA DD. Conceived and supervised the project: BG BA DD.
References
1. Gather MC, Yun SH (2011) Single-cell biological lasers. Nature Photonics 5:
406–410.
2. Franze K, Grosche J, Skatchkov SN, Schinkinger S, Foja C, et al. (2007) Muller
cells are living optical fibers in the vertebrate retina. Proc Natl Acad Sci U S A
104: 8287–8292.
3. Bryant DM, Mostov KE (2008) From cells to organs: building polarized tissue.
Nat Rev Mol Cell Biol 9: 887–901.
4. Wang CC, Jamal L, Janes KA (2011) Normal morphogenesis of epithelial tissues
and progression of epithelial tumors. Wiley Interdiscip Rev Syst Biol Med 4: 51–
78.
5. Conchello JA, Lichtman JW (2005) Optical sectioning microscopy. Nat Methods
2: 920–931.
6. Hoh JH, Schoenenberger CA (1994) Surface morphology and mechanical
properties of MDCK monolayers by atomic force microscopy. J Cell Sci 107 (Pt
5): 1105–1114.
7. Muller DJ, Dufrene YF (2011) Force nanoscopy of living cells. Curr Biol 21:
R212–216.
8. Hall DB, Yeh C (1973) Leaky waves in a heteroepitaxial film. Journal of Applied
Physics 144: 2271–2274.
9. Ulrich R, Prettl W (1973) Planar leaky light-guides and couplers. Applied Physics
A: Materials Science & Processing 1: 55–68.
10. Born M, Wolf E (1999) Principles of Optics: Electromagnetic Theory of
Propagation, Interference and Diffraction of Light: Cambridge University Press.
986 p.
11. Knoll W (1998) Interfaces and thin films as seen by bound electromagnetic
waves. Annual Review of Physical Chemistry 49: 569–638.
12. Raether H (1988) Surface-Plasmons on Smooth and Rough Surfaces and on
Gratings. Springer Tracts in Modern Physics 111: 1–133.
13. Yashunsky V, Zilberstein A, Marciano T, Lirtsman V, Golosovsky M, et al.
(2010) Infrared Surface Plasmon Spectroscopy of Living Cells. AIP Conference
Proceedings 1281: 1617–1621.
14. Yashunsky V, Lirtsman V, Zilbershtein A, Bein A, Schwartz B, et al. (2012)
Surface plasmon-based infrared spectroscopy for cell biosensing. Journal of
Biomedical Optics 17: 081409.
15. Gassama-Diagne A, Yu W, ter Beest M, Martin-Belmonte F, Kierbel A, et al.
(2006) Phosphatidylinositol-3,4,5-trisphosphate regulates the formation of the
basolateral plasma membrane in epithelial cells. Nat Cell Biol 8: 963–970.
16. Jeanes A, Smutny M, Leerberg JM, Yap AS (2009) Phosphatidylinositol 39-
kinase signalling supports cell height in established epithelial monolayers. J Mol
Histol 40: 395–405.
17. Tambe DT, Hardin CC, Angelini TE, Rajendran K, Park CY, et al. (2011)
Collective cell guidance by cooperative intercellular forces. Nat Mater 10: 469–
475.
18. Yashunsky V, Lirtsman V, Golosovsky M, Davidov D, Aroeti B (2010) Real-time
monitoring of epithelial cell-cell and cell-substrate interactions by infrared
surface plasmon spectroscopy. Biophys J 99: 4028–4036.
19. Windt DL (1998) IMD - Software for modeling the optical properties of
multilayer films. Computers in Physics 12: 360–370.
20. Zilbershtein A, Golosovsky M, Lirtsman V, Aroeti B, Davidov D (2012)
Quantitative surface plasmon spectroscopy: Determination of the infrared
optical constants of living cells. Vibrational Spectroscopy 61: 43–49.
21. Yashunsky V, Zilbershtein A, Lirtsman V, Marciano T, Aroeti B, et al. (2012)
Infrared surface plasmon spectroscopy and biosensing. SPIE Conference
Proceedings 8234: 823419–1.
22. Castillo AM, Lagunes R, Urban M, Frixione E, Meza I (1998) Myosin II-actin
interaction in MDCK cells: role in cell shape changes in response to Ca2+variations. J Muscle Res Cell Motil 19: 557–574.
23. Levayer R, Lecuit T (2011) Biomechanical regulation of contractility: spatial
control and dynamics. Trends Cell Biol 22: 61–81.
24. Trepat X, Fredberg JJ (2011) Plithotaxis and emergent dynamics in collective
cellular migration. Trends Cell Biol.
25. Rodriguez-Boulan E, Nelson WJ (1989) Morphogenesis of the polarized
epithelial cell phenotype. Science 245: 718–725.
Infrared Waveguide Mode in Living Cells
PLOS ONE | www.plosone.org 9 October 2012 | Volume 7 | Issue 10 | e48454

26. Zhang J, Betson M, Erasmus J, Zeikos K, Bailly M, et al. (2005) Actin at cell-cell
junctions is composed of two dynamic and functional populations. J Cell Sci 118:
5549–5562.
27. Thiery JP, Sleeman JP (2006) Complex networks orchestrate epithelial-
mesenchymal transitions. Nat Rev Mol Cell Biol 7: 131–142.
28. Polyak K, Weinberg RA (2009) Transitions between epithelial and mesenchymal
states: acquisition of malignant and stem cell traits. Nat Rev Cancer 9: 265–273.
29. Schreiber S, Rosenstiel P, Albrecht M, Hampe J, Krawczak M (2005) Genetics
of Crohn disease, an archetypal inflammatory barrier disease. Nat Rev Genet 6:
376–388.
30. Round JL, Mazmanian SK (2009) The gut microbiota shapes intestinal immune
responses during health and disease. Nat Rev Immunol 9: 313–323.
31. Singer AJ, Berruti L, Thode HC, Jr., McClain SA (2000) Standardized burn
model using a multiparametric histologic analysis of burn depth. Acad Emerg
Med 7: 1–6.
32. Steketee J (1973) Spectral Emissivity of Skin and Pericardium. Physics in
Medicine and Biology 18: 686–694.33. Folberth W, Heim G (1984) Spectral Emissivity Measurements of Human-Skin -
a New Method for the Early Detection of Cancer. Infrared Physics 24: 353–358.
34. Jones BF (1998) A reappraisal of the use of infrared thermal image analysis inmedicine. Ieee Transactions on Medical Imaging 17: 1019–1027.
35. Sason H, Milgrom M, Weiss AM, Melamed-Book N, Balla T, et al. (2009)Enteropathogenic Escherichia coli subverts phosphatidylinositol 4,5-bispho-
sphate and phosphatidylinositol 3,4,5-trisphosphate upon epithelial cell infec-
tion. Mol Biol Cell 20: 544–555.36. Gat U, DasGupta R, Degenstein L, Fuchs E (1998) De Novo hair follicle
morphogenesis and hair tumors in mice expressing a truncated beta-catenin inskin. Cell 95: 605–614.
37. Gilon M, Sher N, Cohen S, Gat U (2008) Transcriptional activation of a subsetof hair keratin genes by the NF-kappaB effector p65/RelA. Differentiation 76:
518–530.
Infrared Waveguide Mode in Living Cells
PLOS ONE | www.plosone.org 10 October 2012 | Volume 7 | Issue 10 | e48454