real property assessment trends in the 03 washington ...cra.gmu.edu/pdfs/cra2014-03_dversel.pdf ·...
TRANSCRIPT
Work
ing P
aper
No.
2014
-03
Real Property Assessment Trends in the
Washington Region, 2005-2014
By
David E. Versel, AICP
Senior Research Associate
George Mason University
Center for Regional Analysis
December 2014
George Mason University Center for Regional Analysis Page 1
Real Property Assessment Trends in the Washington Region, 2005-2014
Working Paper 2014-03
by
David E. Versel, AICP
Abstract
Local governments in the Washington region are highly dependent on revenue from real property taxes.
The national economic recession from 2008 to 2010 led to declines in the property assessments of every
major jurisdiction in the region, and the assessments have yet to recover to pre-recession levels in many
jurisdictions. Nonresidential property assessments have increased since 2009 in the region’s central
jurisdictions, driven mainly by increased valuation from multifamily residential development. However
many suburban areas have struggled to rebuild their commercial assessment bases in the past five years.
This trend is placing additional burdens on residential property owners in these jurisdictions and making
it more difficult for local governments to maintain their public facilities and services.

George Mason University Center for Regional Analysis Page 2
Introduction: the Importance of Real Property Assessments
The ability of local governments to provide quality facilities and services is a critical component of
economic development. The lives of residents and workers are affected on a daily basis by the
transportation, public works, schools, recreation, law enforcement, and other systems of the cities or
counties in which they live or work.
Most jurisdictions in the Washington region rely heavily on the collection of real property taxes in order
to fund their capital and operating needs. Nine of the region’s 13 major jurisdictions1 draw at least half
of their General Fund revenues from real property taxes; this share exceeds 60 percent in Prince William,
Fairfax, and Loudoun counties. The District of Columbia and all Maryland counties assess local income
taxes, which tend to make them less dependent on real property taxes than Virginia jurisdictions; as
such the shares of tax revenues from real property taxes are lowest in the District, Prince George’s
County, and Montgomery County. Even so, all jurisdictions draw at least one-quarter of their revenues
from real property taxes and the three outlying Maryland counties (Calvert, Charles, and Frederick)
derive more than half of their revenues from real property taxes (Figure 1).
Figure 1: Real Property Tax Revenues as Share of Total FY 2015 General Fund Revenues
Source: FY 2015 Budgets for local jurisdictions
Over the past 10 years changes in total real property assessments have followed a similar pattern in
most jurisdictions: strong growth between 2005 and 2009, declines after 2009 as a result of the national
economic recession, and a slow recovery from 2011 to 2014. There have been great differences in how
residential and nonresidential assessments have evolved since 2009, though, with some jurisdictions
struggling to rebuild their nonresidential assessment bases. This trend is placing additional burdens on
residential property owners in these jurisdictions.
1 This paper omits 11 smaller and/or outlying jurisdictions that are part of the Washington Metropolitan Statistical
Area: five independent city governments (Fairfax City, Falls Church, Fredericksburg, Manassas, and Manassas Park)
and six county governments (Clarke, Culpeper, Jefferson, Rappahannock, Spotsylvania, and Warren)

George Mason University Center for Regional Analysis Page 3
This paper examines the trends in residential and nonresidential property assessments among the 13
major jurisdictions displayed in Figure 1.
Total Changes in Assessed Valuations
In 2005 the total assessed value of all real property in the 13 major jurisdictions was $605.9 billion.
Between 2005 and 2009 this increased to $955.4 billion, a growth rate of 57.7 percent. The total
regional assessment then declined 12.3 percent over the next two years before beginning to recover in
2012. As of 2014, the total regional assessment was $911.8 billion, which is still 4.6 percent below the
2009 peak (Table 1).
Table 1: Total Real Property Assessments, All Property Types
Major Jurisdictions in Washington Region, 2005-2014 ($Millions)2
Maximum Value is Shaded
Source: FY 2015 Budgets and FY 2013 CAFRs (DC/VA); State Department of Assessments and Taxation (MD)
Though all 13 jurisdictions experienced at least some decline after 2009, the total assessments have
surpassed 2009 levels in only four jurisdictions: District of Columbia, Alexandria, Arlington, and Loudoun.
The two highest growth rates were in Loudoun and Arlington; in both of these counties the 2014
assessment was more than 15 percent above the 2009 level. Among the other nine jurisdictions, seven
others peaked in 2009 and have yet to recover to those levels. Prince William (2008) and Stafford (2006)
both actually reached their peak values prior to 2009, and have still yet to reach those pre-recession
peaks (Table 1 and Figure 2).
2 Assessment changes in Maryland jurisdictions have a lag time, as properties are assessed on a three-year cycle.
Jurisdiction 2005 2006 2007 2008 2009 2010 2011 2012 2013 2014
District of Columbia $86,887.8 $98,491.3 $124,875.3 $142,958.2 $153,039.6 $150,117.3 $139,287.5 $146,502.0 $151,744.7 $170,596.7
Northern Virginia
Alexandria $26,409.4 $32,126.7 $33,389.0 $34,210.8 $33,087.2 $30,766.1 $31,787.2 $32,954.3 $34,112.4 $35,335.2
Arlington $42,275.4 $50,632.7 $54,292.8 $57,469.5 $57,781.5 $53,985.5 $57,261.8 $61,671.4 $62,891.3 $66,530.0
Fairfax $144,804.7 $178,818.4 $219,405.4 $228,499.2 $229,669.8 $206,808.0 $187,780.1 $193,918.9 $200,263.3 $207,073.1
Fauquier $6,172.3 $12,015.4 $12,568.0 $12,807.7 $12,919.6 $10,186.2 $10,248.7 $10,366.5 $10,435.7 $10,752.0
Loudoun $45,508.7 $61,785.2 $63,550.9 $63,179.8 $56,793.1 $54,298.3 $55,707.1 $57,355.7 $60,036.1 $65,555.4
Prince William $34,140.0 $43,739.8 $57,656.8 $58,291.4 $53,225.7 $39,991.9 $39,256.1 $41,654.4 $46,117.5 $49,892.4
Stafford $9,499.7 $16,293.7 $16,913.2 $16,226.5 $16,313.5 $12,555.6 $12,719.1 $13,002.3 $13,262.2 $14,164.2
Subtotal $308,810.3 $395,412.0 $457,776.2 $470,684.9 $459,790.5 $408,591.6 $394,760.1 $410,923.5 $427,118.5 $449,302.3
Suburban Maryland
Calvert $7,259.6 $8,588.3 $10,262.5 $12,328.4 $13,468.8 $13,296.6 $12,442.1 $11,716.1 $11,340.8 $11,290.8
Charles $10,355.6 $12,201.0 $14,859.1 $17,516.2 $18,848.3 $17,890.5 $16,651.0 $15,762.2 $15,368.0 $15,401.9
Frederick $18,552.3 $21,798.5 $26,111.8 $29,714.1 $31,581.1 $29,357.3 $26,887.3 $25,608.4 $25,431.4 $25,864.1
Montgomery $118,908.9 $141,071.0 $163,916.1 $182,492.3 $182,884.2 $174,840.6 $165,006.1 $159,718.5 $161,320.2 $165,455.7
Prince George's $55,137.1 $65,056.3 $78,095.5 $85,594.5 $95,785.2 $95,710.3 $83,157.7 $76,322.7 $73,059.3 $73,930.7
Subtotal $210,213.5 $248,715.0 $293,245.0 $327,645.5 $342,567.6 $331,095.4 $304,144.2 $289,128.0 $286,519.6 $291,943.2
Region Total $605,911.6 $742,618.3 $875,896.4 $941,288.6 $955,397.6 $889,804.4 $838,191.8 $846,553.4 $865,382.8 $911,842.2
George Mason University Center for Regional Analysis Page 4
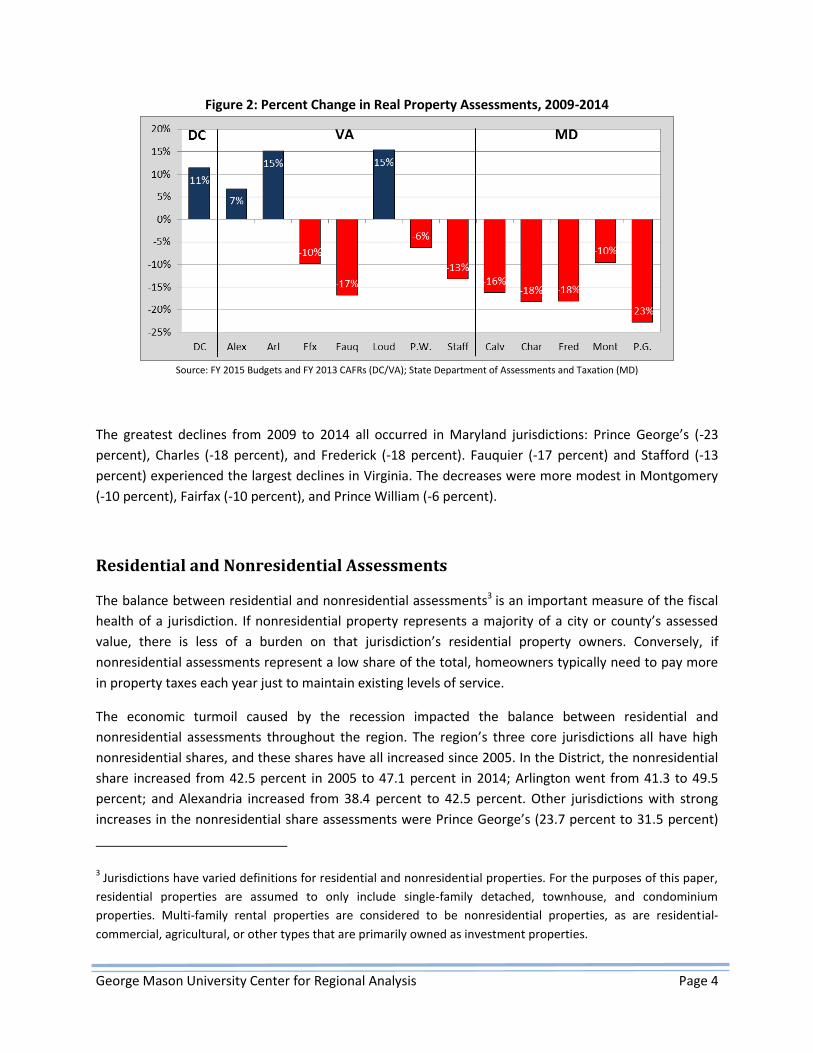
Figure 2: Percent Change in Real Property Assessments, 2009-2014
Source: FY 2015 Budgets and FY 2013 CAFRs (DC/VA); State Department of Assessments and Taxation (MD)
The greatest declines from 2009 to 2014 all occurred in Maryland jurisdictions: Prince George’s (-23
percent), Charles (-18 percent), and Frederick (-18 percent). Fauquier (-17 percent) and Stafford (-13
percent) experienced the largest declines in Virginia. The decreases were more modest in Montgomery
(-10 percent), Fairfax (-10 percent), and Prince William (-6 percent).
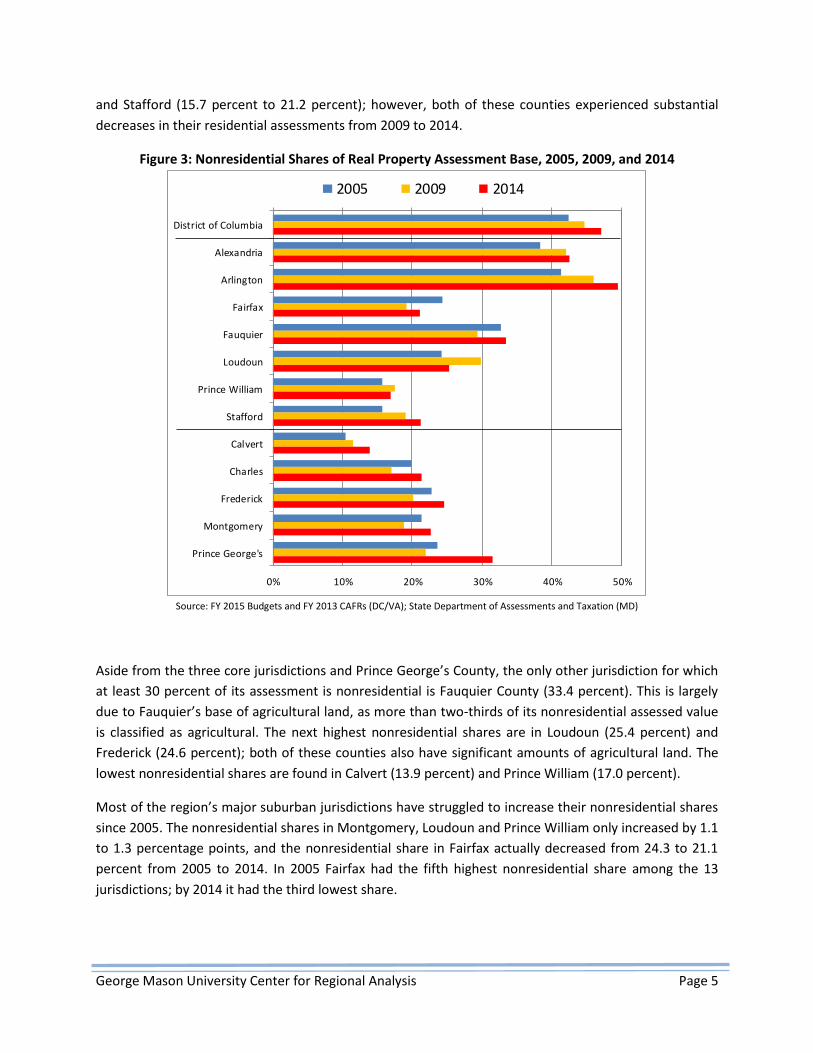
Residential and Nonresidential Assessments
The balance between residential and nonresidential assessments3 is an important measure of the fiscal
health of a jurisdiction. If nonresidential property represents a majority of a city or county’s assessed
value, there is less of a burden on that jurisdiction’s residential property owners. Conversely, if
nonresidential assessments represent a low share of the total, homeowners typically need to pay more
in property taxes each year just to maintain existing levels of service.
The economic turmoil caused by the recession impacted the balance between residential and
nonresidential assessments throughout the region. The region’s three core jurisdictions all have high
nonresidential shares, and these shares have all increased since 2005. In the District, the nonresidential
share increased from 42.5 percent in 2005 to 47.1 percent in 2014; Arlington went from 41.3 to 49.5
percent; and Alexandria increased from 38.4 percent to 42.5 percent. Other jurisdictions with strong
increases in the nonresidential share assessments were Prince George’s (23.7 percent to 31.5 percent)
3 Jurisdictions have varied definitions for residential and nonresidential properties. For the purposes of this paper,
residential properties are assumed to only include single-family detached, townhouse, and condominium
properties. Multi-family rental properties are considered to be nonresidential properties, as are residential-
commercial, agricultural, or other types that are primarily owned as investment properties.
George Mason University Center for Regional Analysis Page 5
and Stafford (15.7 percent to 21.2 percent); however, both of these counties experienced substantial
decreases in their residential assessments from 2009 to 2014.
Figure 3: Nonresidential Shares of Real Property Assessment Base, 2005, 2009, and 2014
Source: FY 2015 Budgets and FY 2013 CAFRs (DC/VA); State Department of Assessments and Taxation (MD)
Aside from the three core jurisdictions and Prince George’s County, the only other jurisdiction for which
at least 30 percent of its assessment is nonresidential is Fauquier County (33.4 percent). This is largely
due to Fauquier’s base of agricultural land, as more than two-thirds of its nonresidential assessed value
is classified as agricultural. The next highest nonresidential shares are in Loudoun (25.4 percent) and
Frederick (24.6 percent); both of these counties also have significant amounts of agricultural land. The
lowest nonresidential shares are found in Calvert (13.9 percent) and Prince William (17.0 percent).
Most of the region’s major suburban jurisdictions have struggled to increase their nonresidential shares
since 2005. The nonresidential shares in Montgomery, Loudoun and Prince William only increased by 1.1
to 1.3 percentage points, and the nonresidential share in Fairfax actually decreased from 24.3 to 21.1
percent from 2005 to 2014. In 2005 Fairfax had the fifth highest nonresidential share among the 13
jurisdictions; by 2014 it had the third lowest share.
0% 10% 20% 30% 40% 50%
District of Columbia
Alexandria
Arlington
Fairfax
Fauquier
Loudoun
Prince William
Stafford
Calvert
Charles
Frederick
Montgomery
Prince George's
2005 2009 2014
George Mason University Center for Regional Analysis Page 6
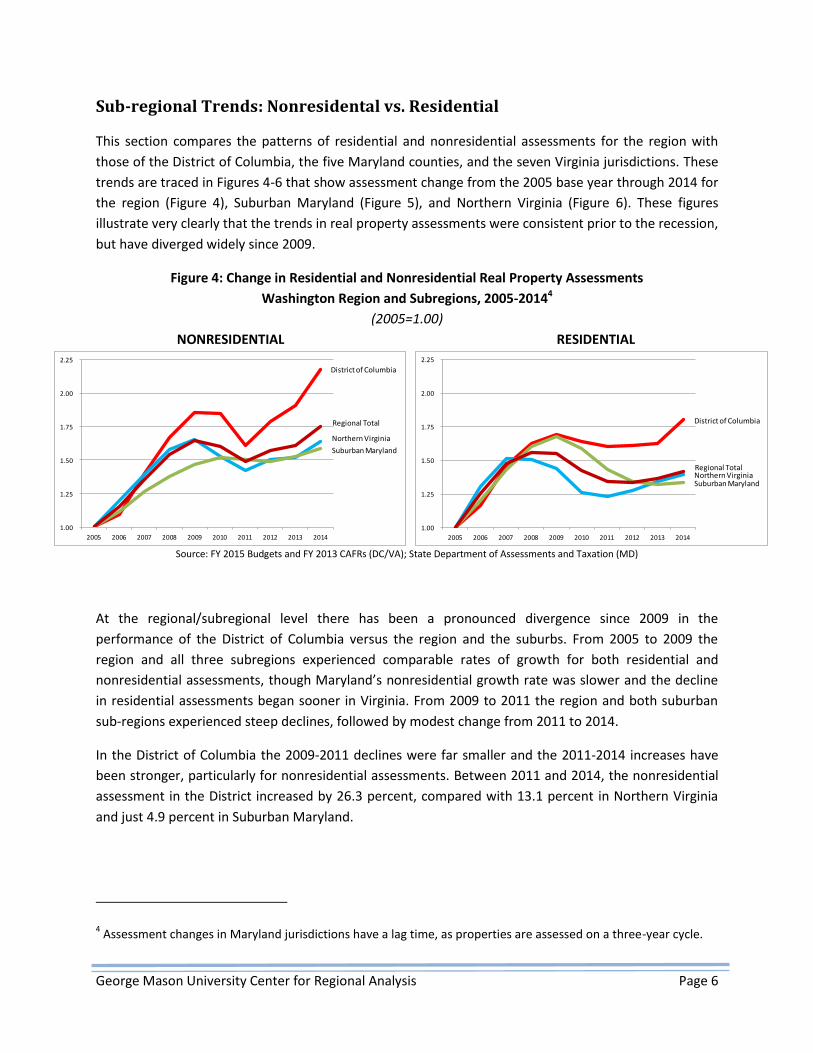
Sub-regional Trends: Nonresidental vs. Residential
This section compares the patterns of residential and nonresidential assessments for the region with
those of the District of Columbia, the five Maryland counties, and the seven Virginia jurisdictions. These
trends are traced in Figures 4-6 that show assessment change from the 2005 base year through 2014 for
the region (Figure 4), Suburban Maryland (Figure 5), and Northern Virginia (Figure 6). These figures
illustrate very clearly that the trends in real property assessments were consistent prior to the recession,
but have diverged widely since 2009.
Figure 4: Change in Residential and Nonresidential Real Property Assessments
Washington Region and Subregions, 2005-20144
(2005=1.00)
NONRESIDENTIAL RESIDENTIAL
Source: FY 2015 Budgets and FY 2013 CAFRs (DC/VA); State Department of Assessments and Taxation (MD)
At the regional/subregional level there has been a pronounced divergence since 2009 in the
performance of the District of Columbia versus the region and the suburbs. From 2005 to 2009 the
region and all three subregions experienced comparable rates of growth for both residential and
nonresidential assessments, though Maryland’s nonresidential growth rate was slower and the decline
in residential assessments began sooner in Virginia. From 2009 to 2011 the region and both suburban
sub-regions experienced steep declines, followed by modest change from 2011 to 2014.
In the District of Columbia the 2009-2011 declines were far smaller and the 2011-2014 increases have
been stronger, particularly for nonresidential assessments. Between 2011 and 2014, the nonresidential
assessment in the District increased by 26.3 percent, compared with 13.1 percent in Northern Virginia
and just 4.9 percent in Suburban Maryland.
4 Assessment changes in Maryland jurisdictions have a lag time, as properties are assessed on a three-year cycle.
1.00
1.25
1.50
1.75
2.00
2.25
2005 2006 2007 2008 2009 2010 2011 2012 2013 2014
District of Columbia
Regional Total
Northern Virginia
Suburban Maryland
1.00
1.25
1.50
1.75
2.00
2.25
2005 2006 2007 2008 2009 2010 2011 2012 2013 2014
District of Columbia
Regional TotalNorthern VirginiaSuburban Maryland
George Mason University Center for Regional Analysis Page 7
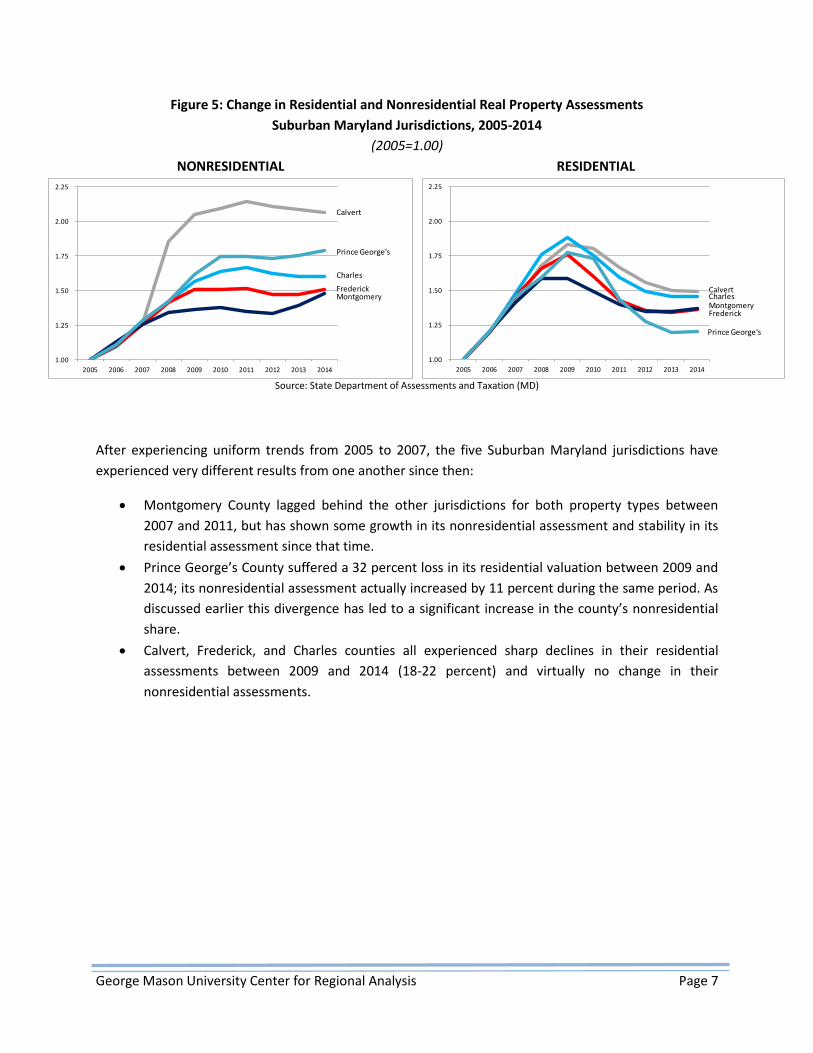
Figure 5: Change in Residential and Nonresidential Real Property Assessments
Suburban Maryland Jurisdictions, 2005-2014
(2005=1.00)
NONRESIDENTIAL RESIDENTIAL
Source: State Department of Assessments and Taxation (MD)
After experiencing uniform trends from 2005 to 2007, the five Suburban Maryland jurisdictions have
experienced very different results from one another since then:
Montgomery County lagged behind the other jurisdictions for both property types between
2007 and 2011, but has shown some growth in its nonresidential assessment and stability in its
residential assessment since that time.
Prince George’s County suffered a 32 percent loss in its residential valuation between 2009 and
2014; its nonresidential assessment actually increased by 11 percent during the same period. As
discussed earlier this divergence has led to a significant increase in the county’s nonresidential
share.
Calvert, Frederick, and Charles counties all experienced sharp declines in their residential
assessments between 2009 and 2014 (18-22 percent) and virtually no change in their
nonresidential assessments.
1.00
1.25
1.50
1.75
2.00
2.25
2005 2006 2007 2008 2009 2010 2011 2012 2013 2014
Calvert
Prince George's
Charles
FrederickMontgomery
1.00
1.25
1.50
1.75
2.00
2.25
2005 2006 2007 2008 2009 2010 2011 2012 2013 2014
Calvert
Prince George's
Charles
FrederickMontgomery
George Mason University Center for Regional Analysis Page 8
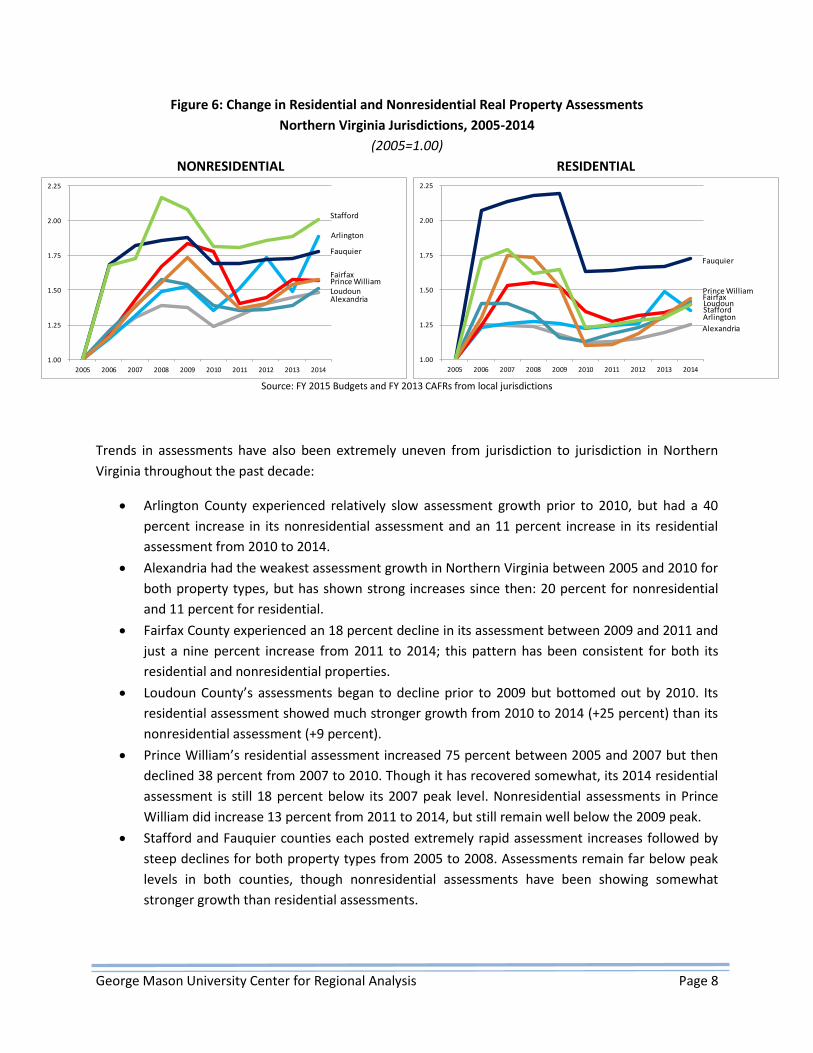
Figure 6: Change in Residential and Nonresidential Real Property Assessments
Northern Virginia Jurisdictions, 2005-2014
(2005=1.00)
NONRESIDENTIAL RESIDENTIAL
Source: FY 2015 Budgets and FY 2013 CAFRs from local jurisdictions
Trends in assessments have also been extremely uneven from jurisdiction to jurisdiction in Northern
Virginia throughout the past decade:
Arlington County experienced relatively slow assessment growth prior to 2010, but had a 40
percent increase in its nonresidential assessment and an 11 percent increase in its residential
assessment from 2010 to 2014.
Alexandria had the weakest assessment growth in Northern Virginia between 2005 and 2010 for
both property types, but has shown strong increases since then: 20 percent for nonresidential
and 11 percent for residential.
Fairfax County experienced an 18 percent decline in its assessment between 2009 and 2011 and
just a nine percent increase from 2011 to 2014; this pattern has been consistent for both its
residential and nonresidential properties.
Loudoun County’s assessments began to decline prior to 2009 but bottomed out by 2010. Its
residential assessment showed much stronger growth from 2010 to 2014 (+25 percent) than its
nonresidential assessment (+9 percent).
Prince William’s residential assessment increased 75 percent between 2005 and 2007 but then
declined 38 percent from 2007 to 2010. Though it has recovered somewhat, its 2014 residential
assessment is still 18 percent below its 2007 peak level. Nonresidential assessments in Prince
William did increase 13 percent from 2011 to 2014, but still remain well below the 2009 peak.
Stafford and Fauquier counties each posted extremely rapid assessment increases followed by
steep declines for both property types from 2005 to 2008. Assessments remain far below peak
levels in both counties, though nonresidential assessments have been showing somewhat
stronger growth than residential assessments.
1.00
1.25
1.50
1.75
2.00
2.25
2005 2006 2007 2008 2009 2010 2011 2012 2013 2014
Stafford
Arlington
Fauquier
FairfaxPrince WilliamLoudounAlexandria
1.00
1.25
1.50
1.75
2.00
2.25
2005 2006 2007 2008 2009 2010 2011 2012 2013 2014
StaffordArlington
Fauquier
FairfaxPrince William
Loudoun
Alexandria

George Mason University Center for Regional Analysis Page 9
The Role of Multifamily Properties
In many of the region’s major jurisdictions the primary contributor to recent growth in the
nonresidential tax base has been multifamily properties. For the six major jurisdictions for which data
were available5 the growth rate of multifamily assessments from 2009 to 2014 was more than double
the rate of growth for other nonresidential properties. Multifamily assessment growth was particularly
strong in Alexandria, Arlington, and Fairfax, which each posted greater than a 40 percent increase.
Multifamily assessments in Loudoun, Montgomery, and Prince George’s counties showed strong growth
as well, with each increasing by at least 17 percent.
In the cases of Alexandria, Fairfax, and Loudoun assessments actually declined for all other types of
nonresidential properties. Montgomery and Prince George’s both experienced modest increases for
other nonresidential properties (7-8 percent). The jurisdiction with the highest growth rate for other
nonresidential properties was Arlington at 19 percent (Figure 7).
Figure 7: Percent Change in Assessed Value by Property Type, 2009-2014
Source: Data from local jurisdictions; GMU Center for Regional Analysis
5 The District of Columbia and several Virginia jurisdictions do not track this information.
George Mason University Center for Regional Analysis Page 10
Key Findings
Real property tax revenues represent the primary source of General Fund revenues raised by local
jurisdictions in the Washington region; the only exceptions are in the District of Columbia and Prince
George’s County.
Prince William, Fairfax, and Loudoun counties are the most heavily dependent on real property
taxes: more than 60 percent of each county’s revenue comes from this source.
Most of the jurisdictions in the region have yet to reach their pre-recession assessment levels. The
only jurisdictions with higher assessments in 2014 than in 2009 are the District of Columbia,
Alexandria, Arlington, and Loudoun.
Real property assessments in 2014 remained at least 10 percent below 2009 levels for all five
jurisdictions in Suburban Maryland: Prince George’s was still 23 percent below its 2009 peak.
From 2005 to 2014 the nonresidential share of total real property assessments increased
significantly in the region’s three core jurisdictions of D.C., Arlington, and Alexandria. All three areas
experienced residential assessment increases, but their nonresidential increases were stronger.
The only other jurisdictions with increases in their nonresidential shares from 2005 to 2014 were
Prince George’s and Stafford, both of which suffered pronounced declines in their residential
assessments after 2009.
Montgomery, Fairfax, Loudoun, and Prince William have all struggled to increase the nonresidential
shares of their total assessments since 2005. The nonresidential share in Fairfax actually decreased
from 2005 to 2014—it was the only jurisdiction to experience such a loss.
The nonresidential assessment in the District of Columbia increased by 26.3 percent between 2011
and 2014. This was double Northern Virginia’s growth rate (13.1 percent) and more than five times
Suburban Maryland’s growth rate (4.9 percent).
Since 2009 most inner-suburban jurisdictions have had strong increases in their nonresidential
assessments coupled with slower growth or declines in their residential assessments: this has held
true in Arlington, Alexandria, Prince George’s, and Montgomery. The exception is Fairfax, where the
both the residential and nonresidential assessments have continued to decline.
The only outlying jurisdiction with an increase in its assessment since 2009 is Loudoun County.
Assessment growth in Loudoun has been entirely due to residential increases—there was no
increase in its nonresidential assessment from 2009 to 2014.
Multifamily assessments have posted strong increases since 2009 in all major jurisdictions that
report these assessments independently, even in areas like Alexandria, Fairfax, and Loudoun where
other types of commercial property assessments have declined.
George Mason University Center for Regional Analysis Page 11
Implications and Outlook
The dependence of most local governments in the Washington region on the collection of real property
taxes creates an imperative for city and county leaders to grow their nonresidential tax bases.
Jurisdictions that are not able to increase the taxable value of their commercial, multifamily, or
industrial land must place a greater burden on homeowners, cut spending on public facilities and
services, or do both.
The current period of economic recovery has produced a clear trend in the Washington region: the core
jurisdictions of the District of Columbia, Arlington, and Alexandria have been able to boost their tax
assessments by posting strong nonresidential assessment growth, while suburban areas have struggled
to keep pace. This trend has played out differently around the region. In Suburban Maryland
nonresidential assessments have actually increased since 2009, but residential assessments are still well
below peak levels. In Fairfax and Prince William Counties nonresidential growth rates remain weak and
overall assessments have yet to reach pre-recession levels. Loudoun County has surpassed its 2009
assessment but growth has been led by residential valuation, driven primarily by the continued
construction of new housing. Outer suburban areas remain far below their pre-recession assessments,
and have experienced negligible increases in their nonresidential assessments.
The driving forces behind these trends can be identified by examining patterns in growth and
development in the region. The regional office market remains weak and the construction pace of
single-family housing has been slow. Recent growth in the region has been primarily led by the
construction of high-density, multi-family rental housing in close-in locations, particularly those in
proximity to Metrorail; this trend has contributed to the assessment increases in the District, Arlington,
and Alexandria, and it has helped Fairfax, Montgomery, and Prince George’s survive the assessment
declines for their other property types.
Looking ahead, the region is expected to experience more of the high-density, transit-oriented
development that has led recent real property assessment growth in many of its jurisdictions. The core
jurisdictions are anticipating continued high-density development around their transit lines. Inner
suburban areas like Montgomery, Prince George’s, and Fairfax have significant capacity for such
development around existing Metro stations, and all three are anticipating expansions of transit in the
next few years. The Silver Line extension will position Loudoun County for more intensive development
than it has at present, though this will be limited to a one portion of the county. Other outer-suburban
areas will likely struggle to build their property tax bases—particularly on the nonresidential side of the
ledger—as they are challenged by public opposition to higher density development.
A broader issue is the current system of tax revenue generation by local governments. While increasing
the nonresidential tax base allows jurisdictions to raise tax revenues without increasing the tax burden
on homeowners, it does not solve the larger problem of tying the fiscal policy of local governments to
fluctuations in the real estate market and the shifting politics of land use and development issues. New
approaches to the generation of local revenues may be needed to help city and county governments
avoid experiencing continued fiscal challenges in the next few years.