real life graphs - mathspanda.com
TRANSCRIPT

www.mathspanda.com
Real life graphs Starter1. (Review of last lesson) Consider these graphs.
State the name and equation which best describes each graph. Choose from:Linear ( )Quadratic or parabola ( )Cubic
Reciprocal
2. Each graph represents one of the following situations:(a) A car moving in congested traffic.(b) A ball rolling along a lane in a bowling alley.(c) An apple thrown vertically in the air.(d) A parachutist after jumping from a stationary hot-air balloon.(e) A lift moving from floor 4 to floor 5.(f) A table tennis ball during a game.Decide which graph matches each situation.
y = m x + cy = a x2 + bx + c
y = a x3 + bx2 + cx + dy =
1x
Page of 1 4
A B C D
FE G H
Time
SpeedA
Time
SpeedC
Time
SpeedB
Time
SpeedD
Time
SpeedE
Time
SpeedF
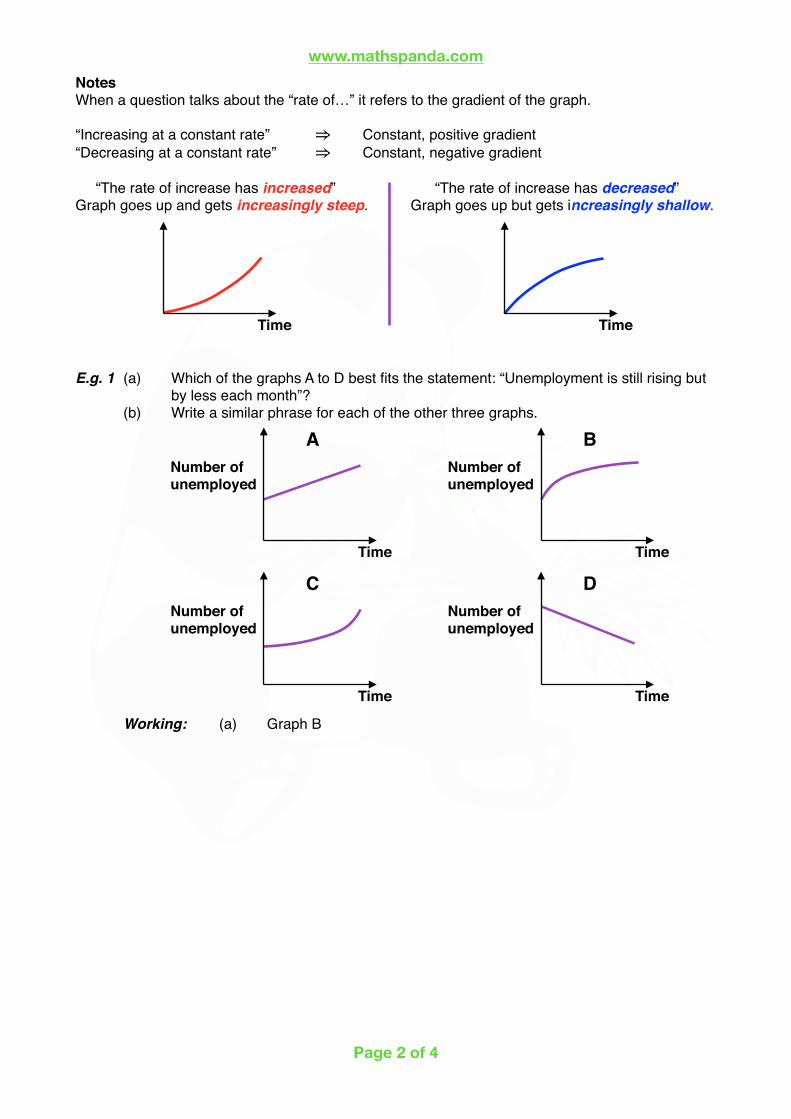
www.mathspanda.comNotesWhen a question talks about the “rate of…” it refers to the gradient of the graph.
“Increasing at a constant rate” Constant, positive gradient“Decreasing at a constant rate” Constant, negative gradient
“The rate of increase has increased” “The rate of increase has decreased”Graph goes up and gets increasingly steep. Graph goes up but gets increasingly shallow.
E.g. 1 (a) Which of the graphs A to D best fits the statement: “Unemployment is still rising but by less each month”?
(b) Write a similar phrase for each of the other three graphs.
Working: (a) Graph B
⇒⇒
Page of 2 4
Time Time
Time
Number of unemployed
A
Time
Number of unemployed
B
Time
Number of unemployed
C
Time
Number of unemployed
D

www.mathspanda.comE.g. 2 Match these five graphs with these five comments.
(a) The cost of North Sea oil has fallen but is levelling off.(b) The volume of exports has risen steadily.(c) The rise in unemployment has slacked off recently.(d) The FTSE 100 index rose sharply last week.(e) The value of the pound (£) has gradually fallen against the US dollar.
Working: (a) Y
E.g. 3 Water is poured at a constant rate into each of the containers A, B and C.
The graphs X, Y and Z show how the water level rises.Decide which graph fits each container.
Video: Real-life graphs - interpreting gradients
Solutions to Starter and E.g.s
Page of 3 4
Time
V
Time
X
Time
W
Time
Z
Time
Y
A B C
Time
XWaterlevel
Time
ZWaterlevel
Time
YWaterlevel

www.mathspanda.comExercise9-1 class textbook: p190 M6.11 Qu 1-2, 4-5, (6-9)A*-G class textbook: p174 E6.4 Qu 1-4, (5-8)9-1 homework book: p68 M6.11 Qu 1-4A*-G homework book: p50 E6.4 Qu 1-4
SummaryWhen a question talks about the “rate of…” it refers to the gradient of the graph.“Increasing at a constant rate” Constant, positive gradient“Decreasing at a constant rate” Constant, negative gradient“The rate of increase has increased” The graph goes up and gets increasingly steep.“The rate of increase has decreased” The graph goes up but gets increasingly shallow.
⇒⇒
⇒⇒
Page of 4 4