real estate investment analysis - · pdf filereal estate investment analysis ... building...
TRANSCRIPT

DECEMBER 4 2007
REAL ESTATE INVESTMENT ANALYSIS
For more information:
Magex Technologies inc.
20 King Ouest Suite 110
Sherbrooke Qc Canada J1H 1N8
1.819.820.2439
PREPARED FOR :
Linda Scott
123 Mountain Road, Seattle
WA, 98052
819-820-2439, 819-434-2439
Marc-André Fontaine
PREPARED BY :

5146 Main St. N.Chicage
Chicago, 98654

Executive Summary5146 Main St. N.
04/12/2007
Authorized License to Marc-André Fontaine.
Income and Expenses
$31,190.86
$19,693.90
$11,496.96
$5,488.48
$16,985.44
Total of Equity (Principal Payment)
Cash Flow (Before Taxes)
Debt Service
Net Operating Income
Cash Flow
Cash Flow + Equity
Vacancy and Credits
Expenses
Gross Op. Income
Cash Flow + Cap. + Appreciation
Appreciation
$34,785.44
$17,800.00
$0.00Increase of incomes: Year 1
Effective Gross Income (EGI)
$53,220.00
$51,623.40
$1,596.60-
$20,432.54
Financial Ratios (according to Acquisition Cost)* (after 1 year)
7.51Effective Gross Rent Multiplier (GRM)
12.43Net Rent Multiplier (NRM)
$64,600.00Average Unit Price
39.58 %Operating Expense Ratio (OER)
83.79 %Loan to Value Ratio (LVR)
1.58Debt Coverage Ratio (DCR)
75.40 %Break Even Ratio
8.05 %Capitalization Rate
27.40 %Internal Rate of Return (year 5)
Annual Appreciation 2.00 %
Cash on Cash Return*
20.17 %Before Equity
29.80 %After Equity (Principal Payment)
After Equity and Appreciation 61.03 %
Acquisition Costs
Land
$380,000.00
$57,000.00
$323,000.00
Total
Building
Acquisition Fees $18,267.50
$398,267.50Total
$390,000.00Market Value
Distribution of the Pot. Gross Income of $53,220.00 (after 1 year)
The red and purple sections represent your portion of the potential incomes of the
building after the first year of operations. This amount belongs to you because the
expenses have been paid as well as the mortgage interests and taxes.
$14,205.42
$31,432.54
$496.96$5,488.48$1,596.60
Income Tax
Income Loss
Cash Flow (after Taxes)
Principal Payment
Operating Expenses + Fees
Mortgage Interest
Down Payment and Financing
$57,000.00Down Payment
5.20 %
60 months
$1,969.39
300 months
$330,267.50Mortgage # 1
Length
Interest Rate
Term
Payment
Calculated as of 01/01/2006Marc-André Fontaine
* Not considering non-financed acq. fees nor fixed expenses

Descriptive Card
Authorized License to Marc-André Fontaine.
04/12/2007
$50,000.00
$300,000.00
$350,000.00
0.00 sq. ft.
0.00 x 0.00
0.00 x 0.00
0.00 sq. ft.
$53,220.00 $20,432.54 $32,787.46
$380,000.00
3
0
No
5146 Main St. N.
98654
Chicage
1985
Residential
Tenant
Public
No
Yes
Yes
No
0 Int. 3 Ext.
1985
Energy Natural Gas
Exterior Construction Brick
Heating Bi-energy
Parking Detached Garage
Site Influence Dead-End
Highway Proximity
School Proximity
6
Year Built
Property Type
Total Units
Nb of Levels Above Ground
Nb of Basement Levels
Zoning Type
Nominal Roll
Registration Division
Lot
Certificate of Localisation
Building Dimensions
Building Area
Lot Dimensions
Lot Area
Municipal Assessment
Land
Building
Total
Owner
Foundation
Frame
Roofing
Windows
Heating Paid By
Floors
Subfloors
Walls
Hot-Water Tank
Laundry Hookup
Fire Protection
Laundry
Parking
Water
Property Details
Property Details
Outdoor Outlets
Pot. Gr. Income Oper. Expenses Net Op. Income
List Price Payment Type Balance
Magex Technologies inc
Contact Agent Information and Appointment
John Smith

Pictures5146 Main St. N.
04/12/2007
Authorized License to Marc-André Fontaine.
09/03/2006
Front View
09/03/2006
Fire place
09/03/2006
Kitchen
09/03/2006
Kitchen 2
Marc-André Fontaine

Leases Terms and Conditions5146 Main St. N.
04/12/2007
Authorized License to Marc-André Fontaine.
Apt Size End of Lease Tenant / Comment Monthly
Rent
Yearly
Included Services
Heating
Ele
ctr
icity
Hot
Wate
r
Wate
r Tax
Laundry
Park
ing
Furn
ished
Half F
urn
ished
Gara
ge
Senio
rity
(m
onth
)
Vacant
Renew
ed L
ease
Occ.
Ow
ner
Rent
Incre
ase
- - x x - - - x1 30/06/2007 0 - - - 2.00 %1 br -- - $720.00 $8,640.00Luke Smith
- - x x - - - x2 30/06/2007 0 - - - 2.00 %1 br -- - $710.00 $8,520.00M. Anderson
- - x x - - - x3 30/06/2007 0 - - - 2.00 %2 br -- - $715.00 $8,580.00F. Wynne
- - x x - - - x4 30/06/2007 0 - - - 2.00 %2 br -- - $730.00 $8,760.00T. Wolfe
- - x x - - - x5 30/06/2007 0 - - - 2.00 %2 br -- - $720.00 $8,640.00W. Doll
- - x x - - - x6 30/06/2007 0 - - - 2.00 %2 br -- - $720.00 $8,640.00K. Thomas
$4,315.00 $51,780.00
Marc-André Fontaine

Financial Analysis5146 Main St. N.
04/12/2007
Authorized License to Marc-André Fontaine.
Income Monthly Annually
$120.00 $1,440.00Garages
$1,430.00 $17,160.002 x 1 br
$2,885.00 $34,620.004 x 2 br
Potential Gross Income (PGI) $53,220.00$4,435.00
Vacancy Rate $1,064.40$88.702.00 %
Bad Debt $532.20$44.351.00 %
Vacancy and Credits % of PGI Monthly Annually
$4,301.95 $51,623.40Effective Gross Income (EGI)
Monthly AnnuallyExpenses % of EGI
$774.35Misc $64.531.50 %
$841.46Electricity $70.121.63 %
$2,245.62Natural Gas $187.134.35 %
$2,426.30Property Management $202.194.70 %
$2,477.92Janitorial Services $206.494.80 %
$4,646.11Insurance $387.189.00 %
$7,020.78Taxes $585.0713.60 %
39.58 % $20,432.54$1,702.71Total of Expenses
Fixed Expenses (Renovations)* Estimated CostDate
Roof 09/03/2008 $10,000.00
Parking Lot 11/03/2007 $4,500.00
Total of Fixed Expenses $14,500.00
* Included in the Financial Forecast only
-
+
$31,190.86
$19,693.90
$11,496.96
$5,488.48
$16,985.44
AnnuallyCash Flow
$17,800.00+
Total of Equity (Principal Payment)
Cash Flow (Before Taxes)
Debt Service
Net Operating Income
Cash Flow + Equity
$34,785.44Cash Flow + Cap. + Appreciation
Appreciation
Marc-André Fontaine

Financial Analysis5146 Main St. N.
04/12/2007
Authorized License to Marc-André Fontaine.
Expenses Distribution
34%Taxes
11%
Natural Gas
4%
Electricity
23%
Insurance
12%Janitorial Services
12%Property Management
4%Misc
Income Distribution
32%
2 x 1 br
65%
4 x 2 br
3%Garages
Incomes, expenses and mortgage interests
$0.00
$10,000.00
$20,000.00
$30,000.00
$40,000.00
$50,000.00
$60,000.00
Effective Gross Income
Operating Expenses
Mortgage Interest
Year 1 Year 2 Year 3 Year 4 Year 5
This diagram helps to illustrate the
available incomes following the
payment of the operating expenses and
the mortgage interests. These incomes
are considered as profit and will serve
in part to pay the income taxes.
Marc-André Fontaine
5146 Main St. N.
04/12/2007
Authorized License to Marc-André Fontaine.
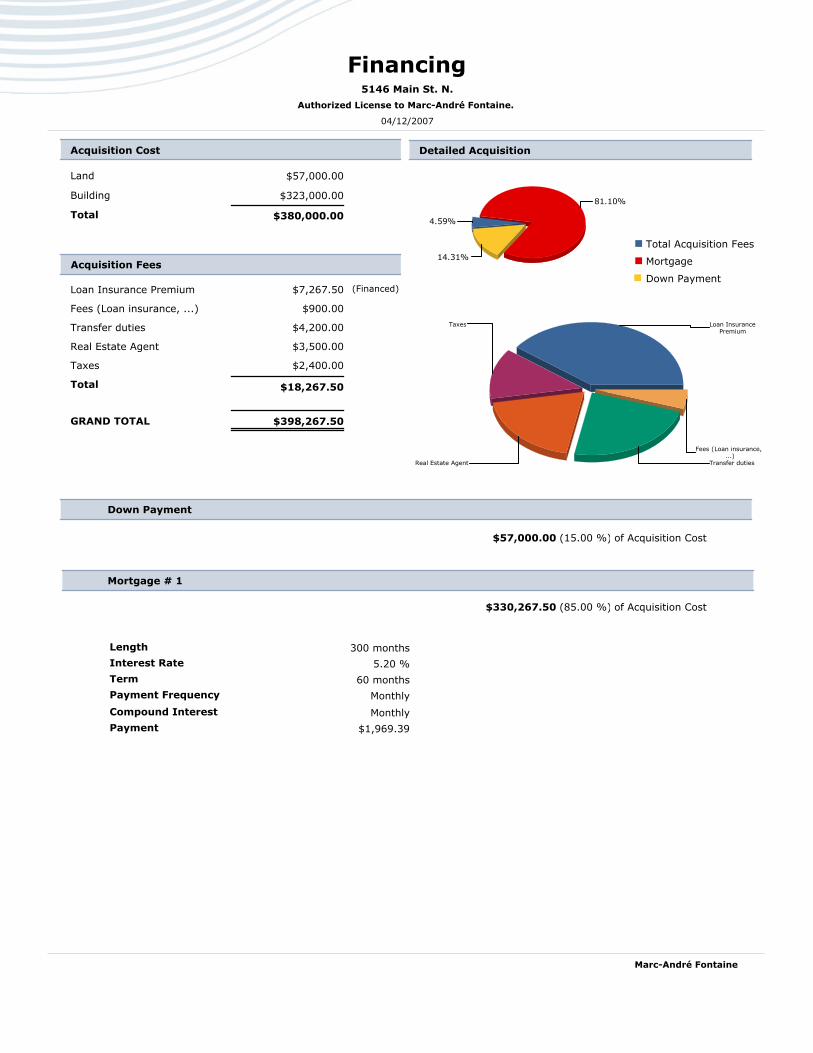
Financing
81.10%
14.31%
4.59%
Loan InsurancePremium
Fees (Loan insurance,...)
Transfer dutiesReal Estate Agent
Taxes
Acquisition Cost
Land
Total
Building
$380,000.00
$57,000.00
$323,000.00
Acquisition Fees
Loan Insurance Premium (Financed)$7,267.50
Fees (Loan insurance, ...) $900.00
Transfer duties $4,200.00
Real Estate Agent $3,500.00
Taxes $2,400.00
Total $18,267.50
$398,267.50GRAND TOTAL
Total Acquisition Fees
Mortgage
Down Payment
Detailed Acquisition
(15.00 %)$57,000.00 of Acquisition Cost
Down Payment
5.20 %
60 months
Monthly
Monthly
$1,969.39
300 months
$330,267.50 (85.00 %)
Term
Payment Frequency
Interest Rate
Length
of Acquisition Cost
Mortgage # 1
Compound Interest
Payment
Marc-André Fontaine

Profitability Analysis5146 Main St. N.
04/12/2007
Authorized License to Marc-André Fontaine.
Financial Ratios (After 1 year)* Acquisition Cost Market Value
$380,000.00 $390,000.00
7.51 7.71Effective Gross Rent Multiplier (GRM)
12.43 12.75Net Rent Multiplier (NRM)
$64,600.00 $66,300.00Average Unit Price
39.58 % %39.58Operating Expense Ratio (OER)
83.79 % %81.64Loan to Value Ratio (LVR)
1.58 1.58Debt Coverage Ratio (DCR)
%75.40 %75.40Break Even Ratio
%8.05 %7.84Capitalization Rate
%27.40 %27.40Internal Rate of Return (year 5)
Cash on Cash Return
%20.17 20.17 %Before Equity
%29.80 %29.80After Equity (Principal Payment)
61.03% %61.03After Equity and Appreciation
Financial Ratios (At Year 0)* Acquisition Cost
Effective Gross Rent Multiplier (GRM) 7.36
Net Rent Multiplier (NRM) 12.18
Average Unit Price $63,333.33
Cash on Cash Return**
-40 .00%
0.00%
40 .00%
80 .00%
120 .00%
160 .00%
200 .00%
10 .50%17 .70%
9.79%
29 .14% 30 .99%41 .73%
73 .38%
97 .41%
141 .07%
186 .88%
0.87% 5.58%
-2.97%
15 .69% 16 .84%
Year 1 Year 2 Year 3 Year 4 Year 5
Cash on Cash Return (Appreciation)
Cash on Cash Return (after Equity)
Cash on Cash Return (before Equity)
This diagram represents the portion of
the initial down payment that goes back
in the investor's pockets throughout the
years. In other words, with this diagram
it is possible to identify the moment
when the investor will have entirely
recovered his down payment by
observing the moment when 100% is
reached.
Marc-André Fontaine
*Not considering non-financed acq. fees nor fixed expenses
**Considering non-financed acquisition fees and fixed expenses.

Ratios Definition5146 Main St. N.
04/12/2007
Authorized License to Marc-André Fontaine.
Definitions and Formulas
This ratio shows how many times the effective gross income represents the
value of the property.
Gross Rent Multiplier (GRM): Value of the property
Effective Gross Income
This ratio shows how many times the net operating income represents the value
of the property.
Net Rent Multiplier (NRM): Value of the property
Net Operating Income
Value of the property
Number of unitsAverage unit price.
Average Unit Price
Operating ExpensesOperating Expense Ratio (OER)
This ratio gives the gross effective income that is used by operating expenses. Gross Effective Income
Mortgage Balance
Value of the property
Loan to Value Ratio (LVR)
This ratio gives the value of the property proportion that comes from external
creditors.
Financing Cost
Net Operating Income
Measures the extent to which net operating income can cover the debt service.
Debt Coverage Ratio (DCR)
Break Even Ratio
This ratio gives the minimal occupancy rate for which expenses are covered by
gross income.
Expenses + Financing Cost
Gross Potential Income
Capitalization Rate
This ratio gives the property yield, including operating expenses (but excluding
the debt service).
Net Operating Income
Value of the property
Cash return on Cash (ConC):
This ratio represents the equity return rate of the owner based on his personal
tax rate if a tax rate has been specified. The mentioned equity return illustrates
the return rate before and after capitalization following the first year of
acquisition. (See financial Forecasts for the following years).
Cash Flow before and after Capitalization
Down Payment
Internal Rate of Return
Discount rate for which the present value of the cash flow is equal to zero.
Homeowner
Rent of Homeowner before Equity:
Occupying owner's rent, considering the cash flow (positive or negative)
generated by the property, before tax.
Cash Flow Before Equity
12 months
Rent -
Rent of Homeowner after Equity:
Occupying owner rent, considering the capitalization and the cash flow generated
by the property (rent before equity, principal payment).
Total of Equity
12 months
Rent Bef. Eq. -

Review5146 Main St. N.
04/12/2007
Authorized License to Marc-André Fontaine.
Acquisition Cost and Financing
Result Margin Value Details
Acquisition Cost Greater than 0 $380,000.0
0
Amount paid for the property acquisition
(after negotiation). This amount does not
include acquisition fees or loan insurance
premium.
Excellent
Mortgage Starting Date - Mortgage #
1
One of the mortgages begins more than
one month after the date of the analysis.Information
Ratios (Accord. to Market Value $390,000.00)
Result Margin Value Details
Debt Service Coverage
Ratio
Greater than 1.20 1.58 Indicates if the financing will be approved
by a financial institution. The higher than
1.20 the ratio is (1.10 for plexes and 1,30
for buildings of 7 units and more), the
more the financing has chances of being
accepted.
Excellent
Loan to Value Ratio (LVR) Between 75 % and
100 %
81.64 % Indicates the percentage of the property’s
cost that is financed by external creditors
(after the first year.)Excellent
Operating Expenses Ratio
(OER)
Between 37 % and 45
%
39.58 % Part of the income used to pay the
expenses. Note: The heating is paid by the
tenantExcellent
Break Even Ratio (BER) Lower than 100 % 75.40 % The property must at least be occupied to
this percentage in order for it to generate
neither profit nor loss.Excellent
Cash on Cash Return
(ConC)
Around 10 % 20.17 % Represents the down payment’s output.
(May be compared to the output of a stock
or a mutual fund investment.)Excellent
Gross Rent Multiplier
(GRM)
Variable 7.71 Indicates the number of years needed for
the gross income to pay off the acquisition
cost.Information
Net Rent Multiplier (NRM) - 12.75 Indicates the amount of years needed for
the net income to pay off the acquisition
cost.Information
Income - Vacancy and Credits annually
Result Margin Value Details
Laundromat Greater than 0 $0.00 No laundry income was specified.
Information
Marc-André Fontaine

Review (Continued)
Operating Expenses
Result Margin Value Details
Maintenance - Repairs Between 4 % and 10
%
0.00 % May vary according to the state of the
property, the age, etc.Bad
Management Between 3 % and 7 % 0.00 % Make sure you enter service charges even
if the property is managed by the owner
himself (the banker will consider approx. 5
%)
Bad
Lawn - Snow Clearing Between 0.5 % and 2
%
0.00 %
Bad
Insurance Between 2 % and 4 % 9.00 %
Warning
Electricity Between 12 % and 23
%
1.63 % Depends on the person in charge of the
payment for the heating expenses (owner
or tenant)Warning
Natural Gas - Property
Management - Misc
Between 1 % and 5 % 10.55 %
Warning
Taxes Between 13 % and 20
%
13.60 %
Excellent
Janitorial Services Between 2 % and 5 % 4.80 %
Excellent
Marc-André Fontaine

Financial Forecast5146 Main St. N.
04/12/2007
Authorized License to Marc-André Fontaine.
From Jan 01, 2006 From Jan 01, 2007 From Jan 01, 2008 From Jan 01, 2009 From Jan 01, 2010
To Dec 31, 2006 To Dec 31, 2007 To Dec 31, 2008 To Dec 31, 2009 To Dec 31, 2010
Incomes and Expenses . . . . .
Potential Gross Income $ 53,220.00 $ 53,766.60 $ 54,841.94 $ 55,938.78 $ 57,057.56
Effective Gross Income $ 51,623.40 $ 52,153.60 $ 53,196.68 $ 54,260.62 $ 55,345.84
Operating Expenses $ 31,432.54 $ 25,341.19 $ 31,258.02 $ 21,683.18 $ 22,116.84
Net Operating Income $ 20,190.86 $ 26,812.41 $ 21,938.66 $ 32,577.44 $ 33,229.00
Debt Service $ 19,693.90 $ 23,632.68 $ 23,632.68 $ 23,632.68 $ 23,632.68
Cash Flow (before Taxes) $ 496.96 $ 3,179.73 $ -1,694.02 $ 8,944.76 $ 9,596.32
Financing . . . . .
Principal Payment $ 5,488.48 $ 6,907.27 $ 7,275.11 $ 7,662.57 $ 8,070.66
Mortgage Interest $ 14,205.42 $ 16,725.41 $ 16,357.57 $ 15,970.11 $ 15,562.02
Mortgage Balance $ 324,779.02 $ 317,871.75 $ 310,596.64 $ 302,934.07 $ 294,863.41
Profitability (Accord. to Market Value) . . . . .
Gross Rent Multiplier (GRM) 7.71 7.78 7.78 7.78 7.78
Net Rent Multiplier (NRM) 19.70 15.13 18.86 12.96 12.96
Operating Expenses Ratio (OER) 60.89 % 48.59 % 58.76 % 39.96 % 39.96 %
Loan to Value Ratio (LVR) 81.64 % 78.34 % 75.05 % 71.76 % 68.48 %
Debt Service Coverage Ratio (DSCR) 1.03 1.13 0.93 1.38 1.41
Break Even Ratio (BER) 96.07 % 91.09 % 100.09 % 81.01 % 80.18 %
Capitalization Rate (Cap Rate) 5.08 % 6.61 % 5.30 % 7.72 % 7.72 %
Market Value of Property per apartment $ 66,300.00 $ 67,626.00 $ 68,978.52 $ 70,358.09 $ 71,765.25
Net current Value of the Cash Flow $ 477.84 $ 2,939.84 $ -1,505.98 $ 7,646.02 $ 7,887.47
Cash on Cash Return (before Eq.) 0.87 % 5.58 % -2.97 % 15.69 % 16.84 %
Cash on Cash Return (after Eq.) 10.50 % 17.70 % 9.79 % 29.14 % 30.99 %
Cash on Cash Return (Appreciation) 41.73 % 73.38 % 97.41 % 141.07 % 186.88 %
Equity (cumulative) . . . . .
Property Value (Annual Appreciation 2.00%) $ 397,800.00 $ 405,756.00 $ 413,871.12 $ 422,148.54 $ 430,591.51
Property Appreciation $ 17,800.00 $ 25,756.00 $ 33,871.12 $ 42,148.54 $ 50,591.51
Principal Payment $ 5,488.48 $ 12,395.75 $ 19,670.86 $ 27,333.43 $ 35,404.09
Cash Flow (before Taxes) $ 496.96 $ 3,676.69 $ 1,982.67 $ 10,927.43 $ 20,523.74
Total Equity $ 23,785.44 $ 41,828.44 $ 55,524.65 $ 80,409.40 $ 106,519.35
Marc-André Fontaine

Financial Forecast
04/12/2007
Authorized License to Marc-André Fontaine.
5146 Main St. N.
Cumulative Equity
(20 ,000 .00 $)
$0.00
$20 ,000 .00
$40 ,000 .00
$60 ,000 .00
$80 ,000 .00
$100 ,000 .00
$120 ,000 .00
Year 1 Year 2 Year 3 Year 4 Year 5
Cash Flow (after Taxes)
Cumulative for the previous years
Down Payment
Principal Payment
Annual Appreciation of the Property
This diagram represents the accumulated
amount throughout the years thanks to the
profit generated by the building, the assets
accumulated by the mortgage
reimbursement and to the increase of the
building's value. In other words, it is possible
to identify the moment when the investor will
have entirely recovered his initial down
payment by observing the moment when the
line, representing the down payment, is
reached.
Equity Progression
(4 ,000 .00 $)
$0.00
$4,000 .00
$8,000 .00
$12 ,000 .00
$16 ,000 .00
$20 ,000 .00
Cash Flow (after Taxes)
Annual Appreciation of the Property
Principal Payment
Year 5Year 4Year 3Year 2Year 1
Cash Flow (before Taxes)
In this diagram, the evolution of the profit
generated by the building by considering the
taxes is illustrated. If the acquisition cost is
inferior to the market value, an amount
higher can be observed for the appreciation
the first year because a profit is earned from
the purchase.
Increase of the building value and the mortgage balance.
$280 ,000 .00
$300 ,000 .00
$320 ,000 .00
$340 ,000 .00
$360 ,000 .00
$380 ,000 .00
$400 ,000 .00
$420 ,000 .00
$440 ,000 .00
Year 5Year 4Year 3Year 2Year 1
Property Value
Mortgage Balance
The space between two lines represents the
amount that truly belongs to the investor
since it is not detained by mortgage
creditors. The building increases in value
each year without additional financing being
necessary.
Marc-André Fontaine

300 months
Monthly
$330,267.50
5.20 %
60 months
Mortgage Details5146 Main St. N.
04/12/2007
Authorized License to Marc-André Fontaine.
Length
Interest Rate
Term
Payment Frequency
Mortgage
Amount
Date Payment Principal Interest Balance Total Interest
$0.00 $0.00 $0.00 $330,267.50 $0.0001/02/2006 0
$1,969.39 $538.23 $1,431.16 $329,729.27 $1,431.1601/03/2006 1
$1,969.39 $540.56 $1,428.83 $329,188.71 $2,859.9901/04/2006 2
$1,969.39 $542.91 $1,426.48 $328,645.80 $4,286.4701/05/2006 3
$1,969.39 $545.26 $1,424.13 $328,100.54 $5,710.6001/06/2006 4
$1,969.39 $547.62 $1,421.77 $327,552.92 $7,132.3701/07/2006 5
$1,969.39 $549.99 $1,419.40 $327,002.93 $8,551.7701/08/2006 6
$1,969.39 $552.38 $1,417.01 $326,450.55 $9,968.7801/09/2006 7
$1,969.39 $554.77 $1,414.62 $325,895.78 $11,383.4001/10/2006 8
$1,969.39 $557.17 $1,412.22 $325,338.61 $12,795.6201/11/2006 9
$1,969.39 $559.59 $1,409.80 $324,779.02 $14,205.4201/12/2006 10
$1,969.39 $562.01 $1,407.38 $324,217.01 $15,612.8001/01/2007 11
$1,969.39 $564.45 $1,404.94 $323,652.56 $17,017.7401/02/2007 12
$1,969.39 $566.90 $1,402.49 $323,085.66 $18,420.2301/03/2007 13
$1,969.39 $569.35 $1,400.04 $322,516.31 $19,820.2701/04/2007 14
$1,969.39 $571.82 $1,397.57 $321,944.49 $21,217.8401/05/2007 15
$1,969.39 $574.30 $1,395.09 $321,370.19 $22,612.9301/06/2007 16
$1,969.39 $576.79 $1,392.60 $320,793.40 $24,005.5301/07/2007 17
$1,969.39 $579.29 $1,390.10 $320,214.11 $25,395.6301/08/2007 18
$1,969.39 $581.80 $1,387.59 $319,632.31 $26,783.2201/09/2007 19
$1,969.39 $584.32 $1,385.07 $319,047.99 $28,168.2901/10/2007 20
$1,969.39 $586.85 $1,382.54 $318,461.14 $29,550.8301/11/2007 21
$1,969.39 $589.39 $1,380.00 $317,871.75 $30,930.8301/12/2007 22
$1,969.39 $591.95 $1,377.44 $317,279.80 $32,308.2701/01/2008 23
$1,969.39 $594.51 $1,374.88 $316,685.29 $33,683.1501/02/2008 24
$1,969.39 $597.09 $1,372.30 $316,088.20 $35,055.4501/03/2008 25
$1,969.39 $599.67 $1,369.72 $315,488.53 $36,425.1701/04/2008 26
$1,969.39 $602.27 $1,367.12 $314,886.26 $37,792.2901/05/2008 27
$1,969.39 $604.88 $1,364.51 $314,281.38 $39,156.8001/06/2008 28
$1,969.39 $607.50 $1,361.89 $313,673.88 $40,518.6901/07/2008 29
$1,969.39 $610.14 $1,359.25 $313,063.74 $41,877.9401/08/2008 30
Marc-André Fontaine

Date Payment Principal Interest Balance Total Interest
$1,969.39 $612.78 $1,356.61 $312,450.96 $43,234.5501/09/2008 31
$1,969.39 $615.44 $1,353.95 $311,835.52 $44,588.5001/10/2008 32
$1,969.39 $618.10 $1,351.29 $311,217.42 $45,939.7901/11/2008 33
$1,969.39 $620.78 $1,348.61 $310,596.64 $47,288.4001/12/2008 34
$1,969.39 $623.47 $1,345.92 $309,973.17 $48,634.3201/01/2009 35
$1,969.39 $626.17 $1,343.22 $309,347.00 $49,977.5401/02/2009 36
$1,969.39 $628.89 $1,340.50 $308,718.11 $51,318.0401/03/2009 37
$1,969.39 $631.61 $1,337.78 $308,086.50 $52,655.8201/04/2009 38
$1,969.39 $634.35 $1,335.04 $307,452.15 $53,990.8601/05/2009 39
$1,969.39 $637.10 $1,332.29 $306,815.05 $55,323.1501/06/2009 40
$1,969.39 $639.86 $1,329.53 $306,175.19 $56,652.6801/07/2009 41
$1,969.39 $642.63 $1,326.76 $305,532.56 $57,979.4401/08/2009 42
$1,969.39 $645.42 $1,323.97 $304,887.14 $59,303.4101/09/2009 43
$1,969.39 $648.21 $1,321.18 $304,238.93 $60,624.5901/10/2009 44
$1,969.39 $651.02 $1,318.37 $303,587.91 $61,942.9601/11/2009 45
$1,969.39 $653.84 $1,315.55 $302,934.07 $63,258.5101/12/2009 46
$1,969.39 $656.68 $1,312.71 $302,277.39 $64,571.2201/01/2010 47
$1,969.39 $659.52 $1,309.87 $301,617.87 $65,881.0901/02/2010 48
$1,969.39 $662.38 $1,307.01 $300,955.49 $67,188.1001/03/2010 49
$1,969.39 $665.25 $1,304.14 $300,290.24 $68,492.2401/04/2010 50
$1,969.39 $668.13 $1,301.26 $299,622.11 $69,793.5001/05/2010 51
$1,969.39 $671.03 $1,298.36 $298,951.08 $71,091.8601/06/2010 52
$1,969.39 $673.94 $1,295.45 $298,277.14 $72,387.3101/07/2010 53
$1,969.39 $676.86 $1,292.53 $297,600.28 $73,679.8401/08/2010 54
$1,969.39 $679.79 $1,289.60 $296,920.49 $74,969.4401/09/2010 55
$1,969.39 $682.73 $1,286.66 $296,237.76 $76,256.1001/10/2010 56
$1,969.39 $685.69 $1,283.70 $295,552.07 $77,539.8001/11/2010 57
$1,969.39 $688.66 $1,280.73 $294,863.41 $78,820.5301/12/2010 58
$1,969.39 $691.65 $1,277.74 $294,171.76 $80,098.2701/01/2011 59
$1,969.39 $694.65 $1,274.74 $293,477.11 $81,373.0101/02/2011 60
$36,790.39Total $81,373.01$118,163.40
Marc-André Fontaine

Sale Price Evaluation5146 Main St. N.
04/12/2007
Authorized License to Marc-André Fontaine.
$411,365.41
Down Payment
(Percentage)
10.00 %
$349,660.59
$2,085.03
$61,704.81
1.25
$6,170.48
300 months
5.20 %
15.00 %
$51,623.40
$20,432.54
$31,190.86
$415,229.07
Debt Service Coverage
Ratio (DSCR)
10.00 %
$363,244.09
$2,166.03
$51,984.98
1.20
$5,198.50
300 months
5.20 %
12.52 %
$51,623.40
$20,432.54
$31,190.86
$427,345.98
Debt Service Coverage
Ratio (DSCR) & Down
Payment (Percentage)
8.11 %
$363,244.09
$2,166.03
$64,101.90
1.20
$5,198.50
300 months
5.20 %
15.00 %
$51,623.40
$20,432.54
$31,190.86
Evaluation
Mortgage
Interest Rate
Length
Net Annual Income
Desired Rate of Return
(Before Taxes and Equity)
Annual Profits
Total Mortgage
Payments
Down Payment
Debt Coverage Ratio
Sale's Price Evaluation
Down Payment (Percentage)
Expenses
Income
Sale's Price Average $417,980.15
Marc-André Fontaine

Resale Yield (year 5)5146 Main St. N.
04/12/2007
Authorized License to Marc-André Fontaine.
$404,830.74
$0.00
$404,830.74
$294,863.41
$109,967.33
$57,000.00
$52,967.33
$24,830.74
$0.00
$24,830.74
$12,415.37
$46,492.42
$58,907.79
$0.00
$52,967.33
$10,326.96
$9,204.75
$19,531.71
34.27 %
-
-
-
+
-
+
$404,830.74
$380,000.00-
$52,967.33
$0.00-
Resale Price
Resale Fees
Net Resale Price
Mortgage Balance
Net Assets at Resale
Down Payment
Increase of Assets (Before Taxes)
Net Resale Price
Acquisition Cost
Capital Gain
Capital Gain Exemption
Capital Gain Balance
Taxable Capital Gain
Recovered Annual Depreciation
Taxable Total
Income Taxes
Assets on Annual Basis
Income Taxes
Increase of Assets (After Taxes)
Assets on Annual Basis
Average of Cash Flow (After Taxes)
Annual Yield
Annual Rate Yield
Net Assets (Before Taxes)
Capital Gain
Tax
Net Assets (After Taxes)
Yield
Taxable portion of Capital Gain of 50.00 %
Brokerage Fees of 0.00 %
Income Tax rate of 0.00 %
$404,830.74
$57,000.00
$24,830.74
$28,136.59
$294,863.41
Income Tax
Mortgage BalanceRecovered Principal
Capital Gain Resale Fees
Down Payment
This diagram illustrates what the estimated resale price will
help to pay. The orange tinted sections (down payment, capital
gain and recaptured capital cost) represent the amount
belonging to the investor if the building is sold after 5 years of
possession.
Marc-André Fontaine
* This report is an indication only and does not take into consideration a capital loss, assuming that the resale price is higher than the acquisition cost.

ComparisonAuthorized License to Marc-André Fontaine.
04/12/2007
Property 1 Property 2
5146 Main St. N. 795 Mountain Road
Chicage Stowe
Scenario Potentiel Potential
Characteristics . .
Total Acquisition Cost $ 380,000.00 $ 286,000.00
Down Payment $ 57,000.00 $ 71,500.00
Nb of Units 6 6
General Condition Good Good
Incomes and Expenses . .
Potential Gross Income $ 53,220.00 $ 33,890.60
Vacancy and Credits $ 1,596.60 $ 1,016.72
Effective Gross Income $ 51,623.40 $ 32,873.88
Operating Expenses $ 20,432.54 $ 12,405.00
Net Operating Income $ 31,190.86 $ 20,468.88
Cash Flow (Before Taxes) $ 11,496.96 $ 3,884.52
Financing . .
Mortgage #1 - -
Mortgage Amount $ 323,000.00 $ 214,500.00
Interest Rate 5.20 % 6.00 %
Term 60 Months 60 Months
Payment $ 1,969.39 $ 1,382.03
Profitability (Accord. to Market Value) . .
Gross Rent Multiplier (GRM) 7.71 9.28
Net Rent Multiplier (NRM) 12.75 14.90
Average Unit Price $ 66,300.00 $ 50,830.00
Operating Expenses Ratio (OER) 39.58 % 37.74 %
Loan to Value Ratio (LVR) 81.64 % 69.08 %
Debt Service Coverage Ratio (DSCR) 1.58 1.23
Break Even Ratio (BER) 75.40 % 85.54 %
Capitalization Rate (Cap Rate) 7.84 % 6.71 %
Internal Rate of Return (IRR) 27.40 % 15.80 %
Cash on Cash Return (before Eq.) 20.17 % 5.43 %
Cash on Cash Return (after Eq.) 29.80 % 10.77 %
Marc-André Fontaine