real estate and infrastructure: the same, but …...real estate and infrastructure: the same, but...
TRANSCRIPT

Real estate and infrastructure: The same, but different
AXA IM – Real Assets, Research & Strategy
March 2017
REAL ASSETS
For use of recipient only - Strictly private and confidential
not for onward distribution. For institutional investors only

• Drivers of real real estate performance
• Governments and the private sector as drivers of infrastructure delivery
• Infrastructure sector activity: cyclical and secular shifts
• Market activity
• Summary
Focus
1

-24%
-12%
0%
12%
24%
36%
-5%
-3%
0%
3%
5%
8%
1996 1997 1999 2001 2003 2005 2007 2009 2011 2013 2015
Source: Macrobond, MSCI (data as at 19 January 2017)
U.S: GDP Growth vs Real Estate
U.S. GDP (% YoY) IPD U.S. Annual All Property Total Returns (% YoY)
-10%
-5%
0%
5%
10%
15%
-8%
-5%
-3%
0%
3%
5%
1996 1997 1999 2001 2003 2005 2007 2009 2011 2013 2015
Source: Macrobond, MSCI (data as at 19 January 2017)
Europe: GDP Growth vs Real Estate
EU 28 GDP (% YoY) IPD Pan European Annual All Property Total Returns (% YoY)
What drives real estate returns?
2
Real estate returns largely driven by economic growth
U.S. GDP
U.S. Real Estate Returns
EU 28 GDP
European Real Estate Returns
GDP vs Real Estate Correlation (2Qtr lag): 0.9
GDP vs Real Estate Correlation (1Qtr lag): 0.9
GDP Real Estate Return GDP Real Estate Return

11%
13%
15%
17%
19%
3%
5%
7%
9%
11%
2004 2006 2008 2010 2012 2014 2016
Source: Macrobond, CBRE (data as at 19 January 2017)
U.S: Tenant Demand Linked to Labour Market
United States Unemployment
US Vacancy Rate
U.S. Unemployment
6%
8%
10%
12%
6%
8%
10%
12%
2004 2006 2008 2010 2012 2014 2016
Source: Macrobond, CBRE (data as at 19 January 2017)
Europe: Tenant Demand Linked to Labour Market
EU 28 Unemployment
Europe Office Vacancy Rate
Relationship between economy and real estate extends to occupier fundamentals
3
Office markets are heavily reliant on labour market trends
EU 28 Unemployment
Europe Office Vacancy Rate
U.S. Office Vacancy Rate
Note: U.S. office vacancies include the entire metro area, whereas European office vacancies only include the real estate market area, as defined by CBRE. As a result the U.S. vacancy rate tends to be systematically higher than the European data
Unemployment Vacancy Rate Unemployment Vacancy Rate

8%
14%
22%
31%
33%
39%
43%
0% 10% 20% 30% 40% 50%
Chicago
Los Angeles
Seattle
Boston
Washington, DC
San Francisco
New York
Major cities outperformed U.S. excluding Top 25(Office 2007-2015, Cumulative Value Change)
Source: CoStar, AXA IM – Real Assets (data as at January 2017)
Urbanisation leads to a focus on global cities, which typically outperformed regions over the last cycle
Note: “Regions” and “National Market” exclude the comparison city, i.e. London vs UK excluding London.
U.S. cities are compared to the U.S. aggregate excluding the Top 25 markets: the cities shown above plus,
Houston, Dallas FW, Philadelphia, San Jose, Orange County, Atlanta, San Diego, Miami, Phoenix, East Bay,
Denver, Northern New Jersey, Austin, Minneapolis, Baltimore, Sacramento, Long Island, Portland OR
4
-9%
-4%
-3%
8%
9%
10%
18%
20%
23%
66%
-20% 0% 20% 40% 60% 80%
Frankfurt vs
Berlin vs
Milan vs
Madrid vs
Stockholm vs
Hamburg vs
Munich vs
Paris vs
Amsterdam vs
London vs
Major cities outperformed national market(Office 2007-2015, Cumulative Value Change)
Source: MSCI, AXA IM – Real Assets (data as at April 2016)
Performance relative to U.S. exc. Top 25 markets
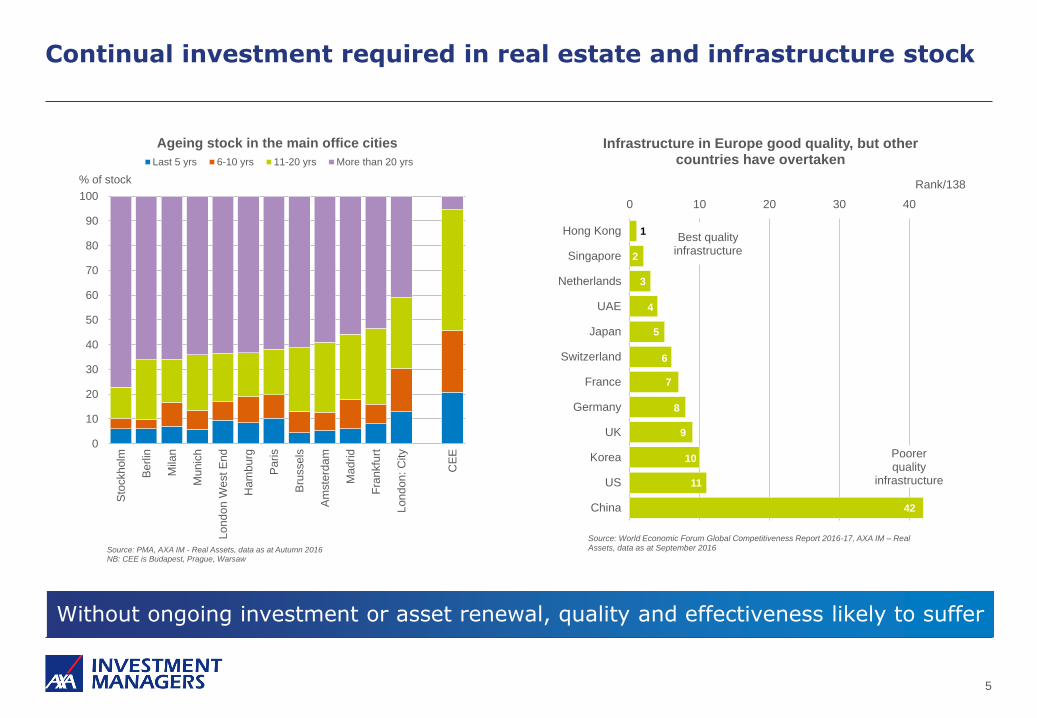
Continual investment required in real estate and infrastructure stock
Without ongoing investment or asset renewal, quality and effectiveness likely to suffer
5
0
10
20
30
40
50
60
70
80
90
100
Sto
ckholm
Berlin
Mila
n
Munic
h
Londo
n W
est E
nd
Ha
mb
urg
Paris
Bru
ssels
Am
ste
rdam
Madrid
Fra
nkfu
rt
London: C
ity
CE
E
% of stock
Source: PMA, AXA IM - Real Assets, data as at Autumn 2016NB: CEE is Budapest, Prague, Warsaw
Ageing stock in the main office cities
Last 5 yrs 6-10 yrs 11-20 yrs More than 20 yrs
1
2
3
4
5
6
7
8
9
10
11
42
0 10 20 30 40
Hong Kong
Singapore
Netherlands
UAE
Japan
Switzerland
France
Germany
UK
Korea
US
China
Source: World Economic Forum Global Competitiveness Report 2016-17, AXA IM – Real Assets, data as at September 2016
Rank/138
Infrastructure in Europe good quality, but other countries have overtaken
Best quality infrastructure
Poorer quality
infrastructure

London
London
Paris
Paris
Berlin
Berlin
Frankfurt
Frankfurt
Munich
Munich
Milan Milan
Madrid
Madrid
Barcelona
Barcelona
Amsterdam
Amsterdam
0
50
100
150
2017 2018 - 2019
Index
Source: PMA, AXA IM – Real Assets, data as at Oct 2016Note: 100 = 1991-2016 average
Relative Office New Supply Pipeline
Development can threaten real estate rental growth, but new supply currently appears in check in most locations
6
Long-Term Average
Much more difficult (but not impossible) to over-supply infrastructure assets
0
1
2
3
4
5
200
8
200
9
201
0
201
1
201
2
201
3
201
4
201
5
201
6
201
7
201
8
201
9
202
0
202
1
m sq/ft
Source: CBRE, AXA IM – Real Assets, data as at February 2017
London City Supply Pipeline
Completions New Let New Unlet 22B Refurb Requires Pre-Let

USD17tn
USD2tn
USD4tn
USD12tn
USD1tn
USD9tn
USD12tn
USD57 trillion of infrastructure investment required out to 2030
Infrastructure investment has been falling in many ‘developed’ countries
Current rate of global investment results in an annual shortfall of USD350bn p.a
Shortfall increases significantly if investment to meet the UN Sustainable Development Goals is included
Developed economies account for 40% of the annual USD3.3tn investment requirement
Significant increase in infrastructure investment needed: Private sector has an important role to play
Increase in global infrastructure spending required to meet future needs
7
Source: McKinsey & Co, Global Insight, AXA IM – Real Assets, data as at June 2016 Data at 2015 prices
ROADS
AIRPORTS
POWER
WATER
PORTS
TELECOM
RAIL

Water: abundant source but limited availability – demand tied to industrial growth in Western economies
Across US and Europe, industrial demand links water use to GDP growth
8
Salt water 97%
Fresh water 3%
Ice and glaciers74.9%
Underground water24.5%
Surface water / other0.6%
Lakes98.7%
Streams and rivers1.3%
0
10
20
30
40
50
60
70
80
90
100
Total water Fresh water Surface water
%
Source: PwC, AXA IM – Real Assets, 2012 data as at October 2016
Water resources: stable and abundant but relatively inaccessible and under pressure
11 10 9
1915 16
19
4 9
11
42.5
55
70
8682
70
42.5
29
0
10
20
30
40
50
60
70
80
90
100
World Africa Asia Oceania US Europe
%
Source: UN Food & Agriculture Organisation, AXA IM – Real Assets, data as at Oct-2016
Industrial demand for water in US and Europe generally outstrips other use
Domestic Industrial Agriculture

Transport: networks must evolve along with shifts in demand
9
New technologies could change the face of transport - investment needs to keep pace
-
0.2
0.4
0.6
0.8
1.0
2005 2006 2007 2008 2009 2010 2011 2012 2013 2014
billion cars
Source: International Organisation of Motor Vehicle Manufacturers, AXA IM – Real Assets, 2014 data as at October 2016
Vehicle fleet in developed countries has seen low or no growth - Asia Pacific the source of
global demand
Europe North America South America
Asia Pacific Middle East Africa
0
20,000
40,000
60,000
80,000
100,000
120,000
1991 1996 2001 2006 2011 2016
Monthly Arrivals
Source: Australian Bureau of Statistics (data as at October 2016)
International Arrivals Into Australia
New Zealand China UK U.S.
China
U.S.
UK
New Zealand
China becoming major tourism source
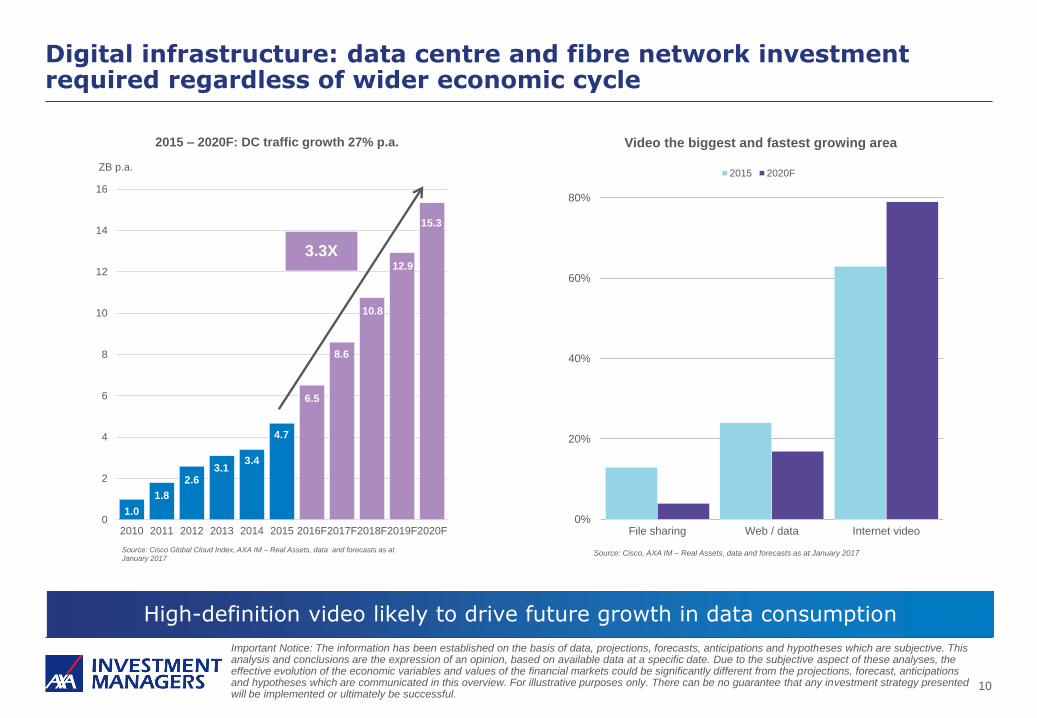
Digital infrastructure: data centre and fibre network investment required regardless of wider economic cycle
10
High-definition video likely to drive future growth in data consumption
1.0
1.8
2.63.1
3.4
4.7
6.5
8.6
10.8
12.9
15.3
0
2
4
6
8
10
12
14
16
2010 2011 2012 2013 2014 2015 2016F2017F2018F2019F2020F
ZB p.a.
Source: Cisco Global Cloud Index, AXA IM – Real Assets, data and forecasts as at January 2017
2015 – 2020F: DC traffic growth 27% p.a.
3.3X
0%
20%
40%
60%
80%
File sharing Web / data Internet video
Source: Cisco, AXA IM – Real Assets, data and forecasts as at January 2017
Video the biggest and fastest growing area
2015 2020F
Important Notice: The information has been established on the basis of data, projections, forecasts, anticipations and hypotheses which are subjective. This analysis and conclusions are the expression of an opinion, based on available data at a specific date. Due to the subjective aspect of these analyses, the effective evolution of the economic variables and values of the financial markets could be significantly different from the projections, forecast, anticipations and hypotheses which are communicated in this overview. For illustrative purposes only. There can be no guarantee that any investment strategy presented will be implemented or ultimately be successful.

Data created by driverless cars globally could reach 2ZB/day – almost equal to the total amount of data centre traffic in the whole of 2012
Assumes driverless reaches 50% of the world’s 1bn total fleet – possibly achieved in 25 years**
Tesla: cars using Autopilot mode have travelled 222m miles***
Google: self-driving car, 2m miles travelled (13 minor accidents – none the fault of the cars***)
Driverless cars: the future
Data generated by driverless cars could dwarf that from other sources
11
* Source: Intel, AXA IM – Real Assets, data as at November 2016 Images: Waymo and Bigstock Photo, as at February 2017, for illustrative purposes only
Driverless car data vs human created data
In 2020, the average driverless car may process 4,000GB of data per day, while the average internet user is expected to process 1.5GB*
1 driverless car = 2,666 internet users
** Based upon IHS and McKinsey forecasts as at 2016 *** Waymo data as at January 2017
Please refer to the important notice on slide10
The above list is illustrative, indicative only and is neither detailed nor exhaustive

Energy generation composition is evolving fast, particularly in Europe, as economies decarbonise
12
Source: WindEurope, AXA IM – Real Assets, data as at February 2017 Source: WindEurope, AXA IM – Real Assets, data as at February 2017
Wind6%
Solar PV0.3%
Natural Gas20%
Coal25%
Nuclear19%
Fuel Oil8%
Large Hydro18%
Other4%
European capacity 2005: 676GW
Wind17%
Solar PV11%
Natural Gas20%
Coal17%
Nuclear13%
Fuel Oil3%
Large Hydro15%
Other4%
European capacity 2016: 918GW

Pressure on government finances a risk for infrastructure: private sector playing its part but more to do
Government finances – debt levels and focus on austerity
Shifts in priorities – lack of appetite for subsidies, switch back towards fossil fuels
Financing costs, given the level of debt used to fund projects
Cyclicality – regulated industries subject to short-term cycles see investment (and jobs) peak and trough
Inability or unwillingness to price construction risk
13
-
1.5
3.0
4.5
0
10
20
30
40
50
2014 2015 2016 YTD 2017
EURbnEURbn
Source: InfraDeals, AXA IM – Real Assets, data as at March 2017
More capital allocated to infrastructure: fund sizes are growing
Capital raised Average fund size (RHS)

Real estate and infrastructure markets staged a sharp increase in transactions post the GFC
The US accounts for the largest share of real estate transactions (2009: 24%, 2016: 51%)
Europe has seen its share of infrastructure transactions fall (2009: 65%, 2016: 35%)
Asia has experienced the largest increase (2009: 12%, 2016: 37%)
Real estate and infrastructure transactions have followed a similar path post the GFC
Europe has seen both its share of real estate and infrastructure transactions fall
14
0
100
200
300
400
0
200
400
600
800
1,000
2007 2008 2009 2010 2011 2012 2013 2014 2015 2016
EURbnEURbn
Source: InfraDeals, RCA, AXA IM – Real Assets, as at March 2017
Global infra transactions followed that for real estate post GFC: market size is smaller
Real Estate Infrastructure (RHS)

Infrastructure investment opportunities are as diverse as those offered by real estate
Infrastructure has more to offer than just long-term income
15
Infrastructure Debt
Real Estate Debt
Brownfield Infrastructure
Greenfield Infrastructure
Source: AXA IM – Real Assets For illustrative purposes only
Core Real Estate
Value-Add Real Estate
Opp. Real Estate
Low Risk/Return High Risk/Return
Example
Renewables Debt,
Airport Debt
Returns: 2-6%
Example
Telecoms Infrastructure,
Airports and Seaports
Returns: 14-20%
Low Risk/Return High Risk/Return
Capital is waiting for these opportunities:
YTD capital raised by unlisted infrastructure funds is already more than half that for than whole of 2016 (EUR24bn vs EUR44bn) Source: InfraDeals (as at March 2017)

Real estate and infrastructure share many common drivers – primarily a link, direct or indirect, to GDP growth but this is not true for all sectors
Real estate and infrastructure benefit from major shifts in underlying demand, be that a move to online retail boosting logistics demand or shifting energy generation composition
Infrastructure is a diverse sector, offering investors more than just long-term income
Both asset classes are experiencing rising demand from global investors, as they diversify and seek greater returns, many aiming to match income to future liabilities
Infrastructure remains a market dominated by government policies, backed by private sector capital and this is unlikely to change in the future
Summary:
16

This material (the “Material”) is solely for the use of the recipient who has received it directly from AXA Investment Managers – Real Assets or any of its affiliates (“AXA IM – Real Assets”) for information and discussion purposes only. It is to be treated strictly confidential. This Material and any information contained herein should not be copied or circulated, in whole or in part, without the prior written consent of AXA IM – Real Assets. This Material does not constitute an offer or solicitation, nor is it the basis for any contract for the purchase or sale of any investment, security or product. It is not for use by retail customers under any circumstances. AXA IM – Real Assets disclaims any and all liability relating to a decision based on or for reliance on this Material.
This Material has not been reviewed, approved or disapproved by any regulatory authority in any jurisdiction. The distribution of this Material in certain jurisdictions may be restricted by law. The recipient represents that it is able to receive this Material without contravention of any applicable legal or regulatory restrictions in the jurisdiction in which it resides or conducts business. AXA IM – Real Assets does not accept any responsibility for ensuring that a recipient complies with applicable laws and regulations. The Material does not constitute, and may not be used for or in connection with, an offer or solicitation by anyone in any jurisdiction in which such offer or solicitation is not authorized or to any person to whom it is unlawful to make such offer or solicitation.
Due to its simplification, this Material is partial and thus the information can be subjective. The information set forth herein does not purport to be complete and is subject to change without notice. This Material does not take into account the recipient’s objectives, financial situation or needs. This Material shall not be deemed to constitute investment advice and/or tax, accounting, regulatory, legal or other advice and it should not be relied upon as the basis for a decision to enter into a transaction or as the basis for an investment decision. The recipient is urged to consult with its own advisers with respect to legal, tax, regulatory, financial, accounting and other matters concerning any investment decision.
Analysis and conclusions express the views of AXA IM – Real Assets and may be subject to change without notice. All information, analysis and conclusions herein present AXA IM – Real Assets’ current knowledge and market estimation at the time of its production. Nevertheless it can come to unintended erroneous statements or presentations and the information may change at any time without previous announcements and/or notices to the recipient of this Material. Thus, a liability or guarantee for the up-to-datedness, correctness and completeness of the allocated information, estimation and opinion cannot be assumed. Information contained herein may vary from previous or future published versions of this Material. Information regarding the background and experience of personnel of AXA IM – Real Assets are provided for information purposes only. Such persons may not necessarily continue to be employed by AXA IM – Real Assets and may not perform or continue to perform services for AXA IM – Real Assets. The reference to league tables and awards are not an indicator of the futures places in league tables or awards. Unless otherwise noted, information provided herein is current as of the date of this Material.
Disclaimer
Part 1/3
17

The data including but not limited to scenarios and investment guidelines set forth in this Material are presented for illustrative purposes only and such data could vary significantly from the final investment policy and/or actual results. Where past performance, past experience and track record information is provided, this is not necessarily representative of future results: performance is not constant over time and the value of investments may fall as well as rise. No representation is made that any results or other figures indicated in this Material will be achieved and that investments will achieve comparable results that targeted returns. Property investments can be illiquid and there is no guarantee that properties can be sold at valuation levels. Investment may be subject to gearing and should be considered higher risk than a similar ungeared investment. Investment returns may be subject to foreign currency exchange risks. Actual results on unrealized investments described herein will depend on, among other factors, future operating results, the value of the assets and market conditions at the time of disposition, legal and contractual restrictions on transfer that may limit the liquidity, any related transactions costs and the timing and manner of sale, all of which may differ materially from the assumptions and circumstances on which the valuations used in the prior performance data contained herein are based.
Some statements and analysis in this Material and some examples provided are based upon or derived from the hypothetical performance of models developed by AXA IM – Real Assets and/or third parties. In particular, in connection with certain investments for which no external pricing information is available, AXA IM – Real Assets will rely on internal pricing models, using certain modeling and data assumptions. Such valuations may vary from valuations performed by other parties for similar types of investments. Models are inherently imperfect and there is no assurance that any returns or other figures indicated in this Material and derived from such models will be achieved. AXA IM – Real Assets expressly disclaims any responsibility for (i) the accuracy of the models or estimates used in deriving the analyses, (ii) any errors or omissions in computing or disseminating the analyses or (iii) any uses to which the analyses are put.
Any hypothetical illustrations, forecasts and estimates contained in this Material are forward looking statements and are based upon assumptions. Hypothetical illustrations are necessarily speculative in nature and it can be expected that some or all of the assumptions underlying the hypothetical illustrations will not materialise or will vary significantly from actual results. Accordingly, the hypothetical illustrations are only an estimate and AXA IM – Real Assets assumes no duty to update any forward looking statement. This Material may also contain historical market data; however, historical market trends are not reliable indicators of future market behaviour.
Disclaimer
Part 2/3
18

Although some information has been provided by AXA IM – Real Assets, the information is based on information furnished by third parties the accuracy and completeness of which has not been verified by AXA IM – Real Assets. All information and data in this Material is established on the accounting information, on market data basis or has been sourced from a number of recognized industry providers. All accounting information, except otherwise specified, is un-audited. While such sources are believed to be reliable and accurate, none of AXA IM – Real Assets or its respective affiliates, directors, officers, employees, partners, members or shareholders assumes any responsibility for the accuracy or completeness of such information. Details of these sources are available upon request. Any pictures, plans, drawings, diagrams or schedules set forth in this Material are provided for information purposes only.
AXA IM – Real Assets makes no representation or warranty (express or implied) of any nature nor is responsible or liable in any way with respect to the truthfulness, completeness or accuracy of any information, projection, representation or warranty (express or implied) in, or omission from, this information.
© 2017 AXA Real Estate Investment Managers and its Affiliated Companies. All rights reserved.
Disclaimer
Part 3/3
19

Performance Measurement of Private Infrastructure
Declan O’Brien, Infrastructure Strategist
25 JANUARY 2017 LGIM REAL ASSETS 1

Agenda
• Mapping the infrastructure universe
• Where are we now? – property vs. infrastructure benchmarking
• Overview of property benchmarking
• The infrastructure journey
• What tools are investors using to benchmark infrastructure
• Challenges/ obstacles to infrastructure benchmarking
• What next?
2

Mapping the infrastructure universe
3
Infra Debt
Infra Equity
Source: CFA, LGIM

Where Are We Now?
5 OCTOBER 2016 4 LGIM REAL ASSETS
INFRASTRUCTURE
10 YEARS AGO! PROPERTY
INFRASTRUCTURE
NOW

Overview of Property Benchmarking
• Investor-led initiative in UK; benchmarking now enshrined
• Well-established industry sector and sub-sector classifications
• Large sample sizes across most sub-sectors allows for “accurate” benchmarking
• Performance vs. peer group linked to remuneration
• Performance typically based on total return, i.e. income return + capital return
• Capital return validated based on quarterly valuation reports
5
Retail Office Industrial
Residential Hotel Other
Standard Retail - South East Standard Retail - Rest of UKShopping Centre Retail WarehouseOffice - City Office - West End & Mid TownOffice - Rest of South East Office - Rest of UKIndustrial - South East Industrial - Rest of UK
6 11 31
Global Property Class Sectors Granular Sub-sectors Standard Industry Segments
Source: IPD

The Infrastructure Journey
• Another equity or riskier bond-like return?
• AIMCo (2012) described infra benchmarking as a
“hodgepodge” of approaches
• First indices suffered from generic aggregation of data
• Useful for asset class education but unsuitable as a measure
of manager/fund performance
• Most recent initiatives are more sophisticated and provide
better data points, but further work needed to match property
6
Survey results describing
infrastructure benchmarking options
Source: EDHECinfra/GIH Survey (Blanc-Brude
et al., 2016)
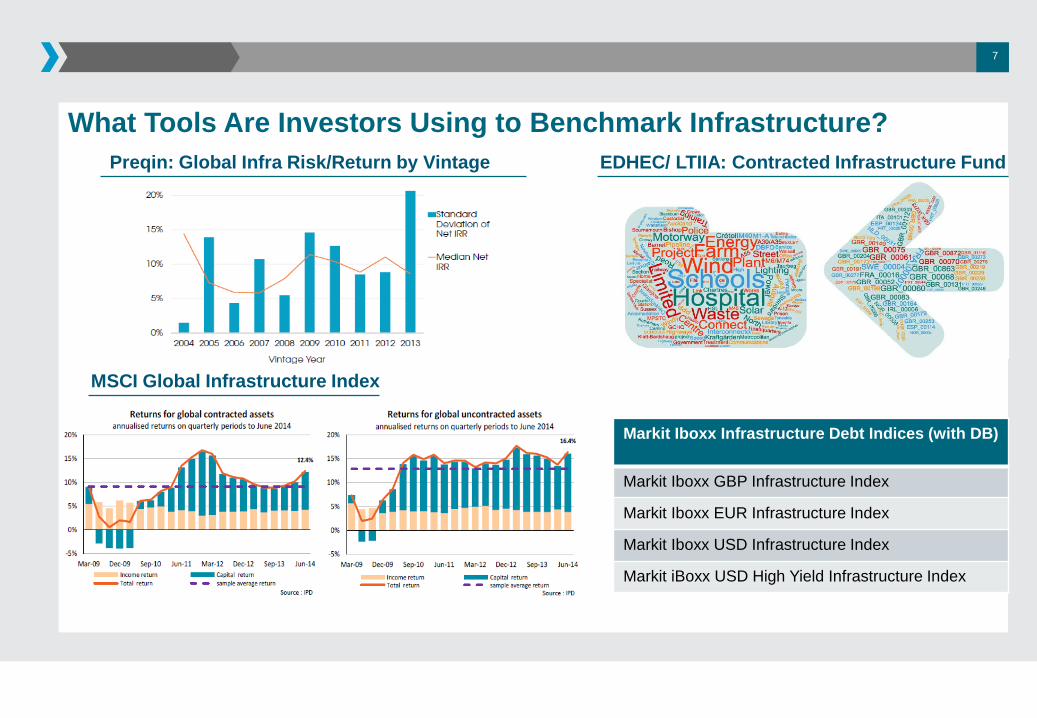
What Tools Are Investors Using to Benchmark Infrastructure?
7
EDHEC/ LTIIA: Contracted Infrastructure Fund
MSCI Global Infrastructure Index
Preqin: Global Infra Risk/Return by Vintage
Markit Iboxx Infrastructure Debt Indices (with DB)
Markit Iboxx GBP Infrastructure Index
Markit Iboxx EUR Infrastructure Index
Markit Iboxx USD Infrastructure Index
Markit iBoxx USD High Yield Infrastructure Index

Major Improvements Driven by Human Intervention…
8
For Now

Challenges/ Obstacles to Infrastructure Benchmarking
• Immature market with small sample sizes
- Perhaps, no benchmark is better than a bad benchmark
• Data collection
- Heterogeneous asset class with wide scope of risk
- Sectors and risk profile need standardised reporting
• Asset valuations
- Few secondary data trading points/ full-cycle assets
- EDHEC survey found that only half of investors trust valuations
• Motivation
- Property investor led; will investors demand the same from infrastructure?
9

What Next?
• Immature market with small sample sizes
• Data collection
• Asset valuations
• Motivation
10
Infra AUM annual growth of 35% since 2011
Already big steps in this area, but further
improvements needed
No obvious path to overcoming valuations
Benchmarking should be easy for concession-based infrastructure, i.e. more focused
on income, less need for valuations
Total return over fund may be most relevant measure for rest of industry
Lack of benchmarking does not seem to be impacting fundraising
However, it will become more important for core infrastructure strategies as IRRs continue to fall
The industry needs to work together to showcase asset class to increase allocations to sector
Source: Preqin

Regulating Infrastructure
landmarks, trends, challenges
Eugene Zhucheko
Executive Director, LTIIA
March 24, 2017

L T I I A / March 2017 2
Why regulation?
Essential Services for Community
Large scale operations
Financial Risk Management

L T I I A / March 2017 3
Sector Regulation
Ensure that private investor earns a
reasonable return
Source: OfWat

L T I I A / March 2017 4
Asset Class Regulation
Solvency II: stipulates risk charge for maintaining reserves by
insurers and pension plans
Source: Deloitte

L T I I A / March 2017 5
Policy Incentives
Subsidies for renewables
Crowding in private capital
TIFIA program (US)
Trump’s plan on tax credits
Juncker plan (Europe)

L T I I A / March 2017 6
Performance data is key to enabling fair regulation

STRICTLY PRIVATE | CONFIDENTIAL
FOR INSTITUTIONAL/WHOLESALE/PROFESSIONAL CLIENTS AND QUALIFIED INVESTORS ONLY – NOT FOR RETAIL USE OR DISTRIBUTION
J.P. Morgan Asset Management – Global Real Assets Omni
Real Assets Portfolio Construction | 24th March 2017
Finding Synergies between Property and Infrastructure Research:
Society of Property Researchers and the Long-Term Infrastructure Investors Association
Bernie McNamara, Head of Global Real Assets Investment Solutions
Pulkit Sharma, CFA, CAIA, Head of Global Portfolio Construction for Real Assets

STRICTLY PRIVATE | CONFIDENTIAL
1 | FOR INSTITUTIONAL/WHOLESALE/PROFESSIONAL CLIENTS AND QUALIFIED INVESTORS ONLY – NOT FOR RETAIL USE OR DISTRIBUTION
Global Real Assets Omni Investment Solutions
Global Real Estate Global Infrastructure
Global Transport Other Real Assets
Part of $95 Billion J.P. Morgan Global
Real Assets business
Platform for working with investors to build
diversified portfolios across real estate
and other real assets strategies
Targeted to investors’ individual needs
and risk/return objectives
Collaborative research and data-sharing
through cross-firm Omni Quantitative
Group
Goal is to bring more science and less art to the real asset portfolio construction process
Bringing the pieces of the real assets puzzle together

STRICTLY PRIVATE | CONFIDENTIAL
2 | FOR INSTITUTIONAL/WHOLESALE/PROFESSIONAL CLIENTS AND QUALIFIED INVESTORS ONLY – NOT FOR RETAIL USE OR DISTRIBUTION
More science, less art: enhanced data, tools and transparency for portfolio construction
Omni Returns Database
– US Core/Core+ RE – NCREIF ODCE
– US VA/Opp RE – NCREIF/Cambridge
– US Real Estate Mezzanine – JPMAM-GRA
– European Core RE – IPD/CBRE/JPMAM-GRA
– European Non-Core RE – IPD/CBRE/JPMAM-GRA
– Asia Core Real Estate – JLL/IPD/JPMAM-GRA
– Asia Non-Core Real Estate – JLL/IPD/JPMAM-GRA
– REITs – FTSE EPRA/NAREIT
– OECD Infrastructure – JPMAM-GRA
– Asian Infrastructure – UBS/JPMAM-GRA
– Global Transport – Clarkson Research/JPMAM-GRA
– Timber and Farmland – NCREIF
– Other real assets
– 20+ years of consistent data for 200+ time series across
styles, sectors and regions
Omni Allocation Modeling Tools
– Proprietary, customized tools for real asset allocations
– Mean variance, risk parity, passive market frameworks
– Inflation sensitivity, non-normal, downside risk models
– Country, currency, and other bespoke models
12%
38%
50%
51%
16%
5%
3%1%
10%
4%
10%
Expected Return 7.4% 8.0% 5.7% 8.0% 8.0%
Historical Volatility 15.2% 8.3% 7.9% 10.2% 8.3%
Equity Correlation 0.98 0.60 0.79 0.58 0.60
CVAR 22% 16% 18% 11% 19%
Probability < CPI 38% 27% 37% 31% 27%
Max Allocation EQUITIES REAL ASSETS FIXED INCOME REAL ASSETS REAL ASSETS
Major Exclusions N/A PE, HEDGE FUNDS N/A EQUITIES, HEDGE FUNDS PE, HEDGE FUNDS
Key ConsiderationsUNDERPERFORMANCE
EQUITY RISKINVESTMENT CAPACITY UNDERPERFORMANCE INVESTMENT CAPACITY INVESTMENT CAPACITY
Public Equity Fixed Income Inflation – Linked Bonds Commodities
REITs Private Equity Hedge Funds Private Real Assets
Current Allocations Mean Variance Risk Parity Non-Normality Inflation Sensitivity
8%
23%
25%8%
6%
4%
15%
11% 12%
38%
50%
24%
26%4%
46%
Omni Portfolio Construction Frameworks
6.0%
8.0%
10.0%
12.0%
14.0%
16.0%
18.0%
20.0%
0.0% 5.0% 10.0% 15.0% 20.0% 25.0% 30.0%
Core Foundation Core Complements Global Diversif iers
Core Foundation
Core Complements
Global Diversifiers
60/40
Notes: RE = Real Estate, NCREIF = National Council of Real Estate investment Fiduciaries, ODCE = Open End Diversified Core Equity, IPD = Investment Property Databank, CBRE = CB Richard Ellis, JLL = Jones Lang LaSalle FTSE = Financial Times Stock Exchange, EPRA = European Public Real Estate Association, NAREIT = National Association of Real Estate Investment Trusts, UBS = Union Bank of Switzerland. For illustrative purposes only.
0903c02a811881fe

STRICTLY PRIVATE | CONFIDENTIAL
3 | FOR INSTITUTIONAL/WHOLESALE/PROFESSIONAL CLIENTS AND QUALIFIED INVESTORS ONLY – NOT FOR RETAIL USE OR DISTRIBUTION
History lesson #1: determining the long-term strategic mix of core vs. non-core within real
assets
Fixed income and equities investment universe by style (core and non-core)
Sources: Morningstar, NCREIF, Kingsley Associates, and IREI. Notes: The passive market allocation is sourced from the 2015 Institutional Real Estate Trends Survey 2015 conducted by the Kingsley Associates and IREI – the survey tracks responses of 86 institutional investors, of which 62 are U.S. tax-exempt institutions. The allocation represents the real estate passive market targets in private market core and non core real estate exclusive of foreign real estate and REITs. Data Source: NCREIF-ODCE, NCREIF-Townsend, JPMAM Global Real Assets Research. Note the risk parity and mean variance frameworks are analyzed on 20 year (1995-2014) annual historical data for consistency purposes. For discussion purposes only.
61% 63%
81% 60 - 80%
39% 37%
19% 20 - 40%
0%
10%
20%
30%
40%
50%
60%
70%
80%
90%
100%
FixedIncome
Equities Passive Market(US Focused
Pensions)
Risk ParityAllocation
Sharpe MaximizingMean Variance
StrategicReal EstateAllocation
Pe
rce
nt
All
oc
ati
on
(%
)
? U.S.
Investment
Grade
Corporate U.S.
Large Cap
Growth
Municipal
Bonds
U.S. Large
Cap Value
Developed
Market
U.S. Large
Cap Blend
International
Large Cap
Treasurys
and TIPS
Diversified
Developed Market
Various asset allocation frameworks point to a
core real estate allocation in the range of 60-80%
Global Real Estate

STRICTLY PRIVATE | CONFIDENTIAL
4 | FOR INSTITUTIONAL/WHOLESALE/PROFESSIONAL CLIENTS AND QUALIFIED INVESTORS ONLY – NOT FOR RETAIL USE OR DISTRIBUTION
History lesson #1: determining the long-term strategic mix of core vs. non-core within real
assets
Fixed income, equities, and real estate investment universe by style (core and non-core)
Sources: Morningstar, NCREIF, Kingsley Associates, and IREI. Notes: The passive market allocation is sourced from the 2015 Institutional Real Estate Trends Survey 2015 conducted by the Kingsley Associates and IREI – the survey tracks responses of 86 institutional investors, of which 62 are U.S. tax-exempt institutions. The allocation represents the real estate passive market targets in private market core and non core real estate exclusive of foreign real estate and REITs. Data Source: NCREIF-ODCE, NCREIF-Townsend, JPMAM Global Real Assets Research. Note the risk parity and mean variance frameworks are analyzed on 20 year (1995-2014) annual historical data for consistency purposes. For discussion purposes only.
61% 63%
81% 60 - 80%
39% 37%
19% 20 - 40%
0%
10%
20%
30%
40%
50%
60%
70%
80%
90%
100%
FixedIncome
Equities Passive Market(US Focused
Pensions)
Risk ParityAllocation
Sharpe MaximizingMean Variance
StrategicReal EstateAllocation
Pe
rce
nt
All
oc
ati
on
(%
)
? U.S.
Investment
Grade
Corporate U.S.
Large Cap
Growth
Municipal
Bonds
U.S. Large
Cap Value
Developed
Market
U.S. Large
Cap Blend
International
Large Cap
Treasurys
and TIPS
Diversified
Developed Market
Various asset allocation frameworks point to a
core real estate allocation in the range of 60-80%
Global Real Estate

STRICTLY PRIVATE | CONFIDENTIAL
5 | FOR INSTITUTIONAL/WHOLESALE/PROFESSIONAL CLIENTS AND QUALIFIED INVESTORS ONLY – NOT FOR RETAIL USE OR DISTRIBUTION
$102 $96 $95
$132 $138
$156
$143 $139
$124
$114
$102
$153 $145
$132 $124
$120
$160 $165
$141
$126
$113 $112
$0
$20
$40
$60
$80
$100
$120
$140
$160
$180
2004 2005 2006 2007 2008 2009 2010 2011 2012 2013 2014
Vintage Year
Closed-end Non-Core (Median)
Open-end Core
History lesson #2: but what about the short-term?
How much money would a $100 investment be worth over the course of an average fund’s life (8 years) if invested in a high-risk
closed-end fund vs. a core fund in any given year?
Sources: Cambridge Associates, NCREIF; as of 2016Q3. Returns are net time weighted returns. The closed-end fund performance is representative of a median manager. The above table is for illustrative and discussion purposes only. Past performance is
not indicative of future results.
Timing risk wrong
Core / Non-Core:
$100 invested in
2005 = $145 / $96
after 8 years
4d03c02a8003411f

STRICTLY PRIVATE | CONFIDENTIAL
6 | FOR INSTITUTIONAL/WHOLESALE/PROFESSIONAL CLIENTS AND QUALIFIED INVESTORS ONLY – NOT FOR RETAIL USE OR DISTRIBUTION
Focus on foundational real asset strategies for scale, stability and long-term exposure
Source: J.P. Morgan Asset Management – Global Real Assets.
GLOBAL DIVERSIFIERS Global diversification and tactical/opportunistic returns
CORE COMPLEMENTS Added diversification and/or enhanced returns
CORE FOUNDATION Stable income with lower volatility,
diversification, plus inflation sensitivity
Developed Markets Core Real Assets
Core/Core+
Real Estate
Core/Core+
Infrastructure
Developed Markets Complementary Real Assets
Emerging Markets
Real Assets EM Real Estate
EM Infrastructure
Global Shipping
Value Added/Opportunistic Real Assets
Global Income-Oriented Transport
Timber Farmland
The Real Assets Solutions Pyramid: the role of different real asset categories
0903c02a810c04f0

STRICTLY PRIVATE | CONFIDENTIAL
7 | FOR INSTITUTIONAL/WHOLESALE/PROFESSIONAL CLIENTS AND QUALIFIED INVESTORS ONLY – NOT FOR RETAIL USE OR DISTRIBUTION
Broader is better: double diversification benefits unique to real assets
Low correlations vs. financial assets and between real asset categories
Sources: Bloomberg, MSCI, Barclays Capital, HFRI, Burgiss Private Equity, NCREIF, IPD, CBRE, Jones Lang LaSalle, Wilshire, Wells Fargo, UBS, Clarksons Shipping Research, and JPMAM-Global Real Assets Research. Europe and Asia data is denominated in local currency. All other data is denominated is in USD. Annual data as of December 2015. Note: Unlevered real estate series were levered to reflect how institutional investors typically access the representative asset classes. Past performance is not indicative of future results. Diversification does not guarantee investment returns and does not eliminate the risk of loss. The above table is for illustrative and discussion purposes only.
High (+1.0) Low (Negative)
Financial
Assets
Other Alts
Global
Real Estate
Other Real
Assets
0903c02a811f81db
1996 - 2015 Global
Equities
Global
Bonds
Private
Equity Hedge Funds
U.S.
Core/Core+
Real Estate
Europe
Core
Real Estate
APAC
Core
Real Estate
OECD
Core/Core+
Infra
Global
Transport
All-Tranche
REITs
Asian
Infra
Global Equities 1.0
Global Bonds 0.0 1.0
Private Equity 0.7 -0.3 1.0
Hedge Funds 0.7 -0.3 0.8 1.0
U.S. Core/Core+ Real Estate 0.2 -0.3 0.4 0.3 1.0
Europe Core Real Estate 0.4 -0.4 0.5 0.4 0.7 1.0
APAC Core Real Estate 0.2 -0.3 0.4 0.3 0.6 0.6 1.0
OECD Core/Core+
Infrastructure 0.0 0.4 -0.1 0.1 0.2 0.1 -0.3 1.0
Global Transport 0.1 0.1 0.0 0.0 0.6 0.3 0.5 0.4 1.0
All-Tranche REITs 0.4 0.1 0.2 0.5 -0.1 0.3 0.1 0.2 0.1 1.0
Asian Infrastructure 0.0 0.1 0.0 0.2 0.2 0.3 0.5 0.3 0.5 0.6 1.0

STRICTLY PRIVATE | CONFIDENTIAL
8 | FOR INSTITUTIONAL/WHOLESALE/PROFESSIONAL CLIENTS AND QUALIFIED INVESTORS ONLY – NOT FOR RETAIL USE OR DISTRIBUTION
Global Core Real Assets Solutions: building the “Agg” of real estate/real assets
For discussion purposes only. 1The target returns are gross returns for illustrative purposes only and are subject to significant limitations. An investor should not expect to achieve actual returns similar to the target returns shown above. Because of the inherent limitations of the target returns, potential investors should not rely on them when making a decision on whether or not to invest in the strategy. Please see the complete Target Return disclosure at the conclusion of the presentation for more information on the risks and limitation of target returns.
Illustrative portfolio
Global Core Solutions
Global Core Real Assets
Global
Real Estate
40 – 60%
Global
Infrastructure
30 – 50%
Global
Transport
10 – 20%
U.S.
Core
Real Estate
40 – 60%
Europe
Core Real Estate
20 – 40%
Asia-Pacific
Core Real Estate
10 – 30%
Global Core Real Estate
8 – 10%
5 – 6%
Diversified
Global
Target Total Return1:
Target Income Return1:
Sector:
Exposure:
7 – 9%
4.5 – 5.5%
Real Estate
Global
0903c02a81ca7a65
Vs. a 60/40 stock/bond portfolio…
2 – 3X more income
200 – 300 bps return premium
20 – 40% lower volatility
Low equity beta and
no duration risk
Better downside resilience and
inflation sensitivity

STRICTLY PRIVATE | CONFIDENTIAL
9 | FOR INSTITUTIONAL/WHOLESALE/PROFESSIONAL CLIENTS AND QUALIFIED INVESTORS ONLY – NOT FOR RETAIL USE OR DISTRIBUTION
Target Return Characteristics
Target Total Return
(Gross)* 5 – 7% 6 – 8% 7 – 9% 8 – 10%
Target Income Return* 1.5 – 2.5% 4 – 5% 4.5 – 5.5% 5 – 6%
Illustrative 20-year analysis using asset class data. Notes: (1) The target returns are derived from J.P. Morgan internal estimates of respective asset class returns. (2) Return per unit of risk is calculated by dividing the 20-year CAGR by the 20-year standard deviation. (3) Volatility is calculated using historical annual 1996-2015 standard deviation of historical returns. (4) The risk-return characteristics are calculated in USD except for Europe real estate, which is calculated in euros, and APAC real estate and OECD Infrastructure, which are calculated in local currency terms. (5) The portfolio attributes stated in the above table are for illustrative purposes only. (6) The portfolios assume annual rebalancing. (7) The max drawdown denotes the maximum historical peak to trough decline in asset values. (8) % of time over CPI + 5% is calculated using 3-year rolling returns using Euro Area CPI from IMF. Sources: Bloomberg, MSCI, Barclays, NCREIF, CBRE, IPD, Jones Lang LaSalle, Clarksons, IMF, and JPMAM Global Real Assets Research. DISCLAIMER: Past performance is not indicative of future results. Diversification does not guarantee investment returns and does not eliminate the risk of loss. J.P. Morgan seeks to achieve the stated objectives, but there can be no guarantee the objectives will be met. For discussion purposes only.
*The target returns are gross returns for illustrative purposes only and are subject to significant limitations. An investor should not expect to achieve actual returns similar to the target returns shown above. Because of the inherent limitations of the target returns, potential investors should not rely on them when making a decision on whether or not to invest in the strategy. Please see the complete Target Return disclosure at the conclusion of the presentation for more information on the risks and limitation of target returns.
Historical Risk/Return Characteristics
Historical Return 6.3% 8.2% 9.1% 9.3%
Historical Volatility 11.7% 15.1% 10.0% 7.5%
Return per unit of Risk 0.5 0.5 0.9 1.2
Max Drawdown -22% -37% -27% -19%
Equity Beta (vs. MSCI World) 0.6 0.4 0.1 0.1
% of Time Over CPI + 5% 61% 67% 72% 78%
vs. GRE
Global Real
Estate Portfolio
Europe
Core
Real Estate
APAC
Core
Real
Estate
Global Real
Assets Portfolio
Global
Infra
Global
Transport
Global
Real Estate
U.S.
Core
Real
Estate
Better diversification, enhanced income and return potential, and increased overall
risk-adjusted returns from diversified real assets allocations
vs. 60/40
0903c02a810c04f0
Global 60/40%
Stock/Bond Portfolio
100% UK
Real Estate Portfolio
60%
Global
Equities
40%
Global
Bonds
100%
UK
Real Estate

STRICTLY PRIVATE | CONFIDENTIAL
10 | FOR INSTITUTIONAL/WHOLESALE/PROFESSIONAL CLIENTS AND QUALIFIED INVESTORS ONLY – NOT FOR RETAIL USE OR DISTRIBUTION
11.7%
15.1%
10.0%
7.5%
0.0%
2.0%
4.0%
6.0%
8.0%
10.0%
12.0%
14.0%
16.0%
60/40Stock/Bond
UKReal Estate
GlobalReal Estate
GlobalReal Assets
Vo
lati
lity
-22%
-37%
-27%
-19%
-40%
-35%
-30%
-25%
-20%
-15%
-10%
-5%
0%
Max D
raw
do
wn
Strategic risk management: significantly lower probability of bad outcomes
UK
Real Estate
Global
Real Estate
Global
Real Assets
-340 170 420
UK
Real Estate
Global
Real Estate
Global
Real Assets
-15% -5% +3%
Volatility Reduction (bps) vs. 60/40
Max Drawdown vs. 60/40 (Worse/Better)
Illustrative 20-year analysis using asset class data. Notes: 60/40 denotes a 60% Global Equities (MSCI World) and 40% Fixed Income (Barclays Aggregate) portfolio. Volatility is calculated using historical consistent time-weighted 20-year (1996-2015) data in order to capture long-term multi-cycle “asset class” behavior and is computed in annual terms to mitigate/minimize the impact of serial correlations inherent in private market returns. Max Drawdown denotes to maximum historical peak to trough decline in asset values. Volatility reduction and drawdown reduction tables have the figures rounded for simplicity purposes with the goal of illustrating directional and not absolute inferences. The portfolios assume annual rebalancing. Sources: Bloomberg, MSCI, Barclays, NCREIF, CBRE, IPD, Jones Lang LaSalle, Clarksons, and JPMAM Global Real Assets Research. DISCLAIMER: Past performance is not indicative of future results. Diversification does not guarantee investment returns and does not eliminate the risk of loss. J.P. Morgan seeks to achieve the stated objectives, but there can be no guarantee the objectives will be met. For discussion purposes only.
Global Real Assets

STRICTLY PRIVATE | CONFIDENTIAL
11 | FOR INSTITUTIONAL/WHOLESALE/PROFESSIONAL CLIENTS AND QUALIFIED INVESTORS ONLY – NOT FOR RETAIL USE OR DISTRIBUTION
Diversified and diversifying: the overall portfolio context
Notes: (1) The return ranges are derived from J.P. Morgan Asset Management – GRA’s internal estimates by the investment teams for each of the respective strategies. (2) The portfolio attributes stated in the above table are estimates within ranges and are for illustration purpose only. (3) Volatility is calculated using historical annual 1996-2015 standard deviation of historical returns. (4) Portfolios assumes annual re-balancing. (5) Data is as of December 2015. Sources: NCREIF, IPD, CBRE, INREV, FTSE/EPRA NAREIT, UBS, Clarkson Research, and JPMAM GRA Research. DISCLAIMER: Past performance is not indicative of future results. Diversification does not guarantee investment returns and does not eliminate the risk of loss. J.P. Morgan seeks to achieve the stated objectives, but there can be no guarantee the objectives will be met. For discussion purpose only. This information is not intended as a recommendation to invest in any particular asset class or strategy or as a promise of future performance. References to future returns are not promises or even estimates of actual returns a client portfolio may achieve. Assumptions, opinions and estimates are provided for illustrative purposes only. They should not be relied upon as recommendations to buy or sell securities. Forecasts of financial market trends that are based on current market conditions constitute our judgment and are subject to change without notice. We believe the information provided here is reliable, but do not warrant its accuracy or completeness. This material has been prepared for information purposes only and is not intended to provide, and should not be relied on for accounting, and legal or tax advice.
Traditional
Portfolio
+ UK Core
Real Estate
+ Global Core
Real Estate
+ Global Core
Real Assets
15% 20% 25%
Return 6.3% 6.5% 6.8% 7.2%
Volatility 11.7% 11.4% 10.3% 9.3%
Return/Volatility 0.54 0.57 0.66 0.77
Drawdown -22% -23% -21% -19%
Equity Beta 0.60 0.59 0.53 0.47
Global
Equities
Global
Bonds
7% 15% 25%

STRICTLY PRIVATE | CONFIDENTIAL
12 | FOR INSTITUTIONAL/WHOLESALE/PROFESSIONAL CLIENTS AND QUALIFIED INVESTORS ONLY – NOT FOR RETAIL USE OR DISTRIBUTION
STRICTLY PRIVATE | CONFIDENTIAL
Appendix
Disclosures

STRICTLY PRIVATE | CONFIDENTIAL
13 | FOR INSTITUTIONAL/WHOLESALE/PROFESSIONAL CLIENTS AND QUALIFIED INVESTORS ONLY – NOT FOR RETAIL USE OR DISTRIBUTION
Risk Factors
The following summarises certain key risk factors, as will be set out, along with other risk factors that pertain to the various real assets strategies detailed/mentioned in this presentation. Prospective investors should carefully consider the
summaries below in conjunction with the risk factors sections of each of the Fund’s Memorandum and relevant Feeder Memorandum and should consult with their own financial, legal and tax advisers before deciding whether to invest in the
Funds or any Feeder Vehicle with respect thereto. Some of the risk factors outlined below may not be applicable to all of the Funds in this presentation. For complete information on the risks associated with a particular Fund or Feeder Entity,
please refer to the Offering Memorandum for that respective Fund.
General: There can be no assurance that any Fund or the GRA – Omni Program will succeed in meeting its investment objective or target return or that there will be any return on capital or of the original capital invested. Investors will only have recourse for any
losses suffered to the assets of the particular Sub-fund in which they invest.
Risks Relating to the Fund’s Investment Objective and Investment Strategy. An Investment in the GRA – Omni Program or any underlying Fund is not a bank deposit, is not insured by the U.S. Federal Deposit Insurance Corporation, and is not the
obligation of, or guaranteed by, JPMIM, JPMorgan Chase Bank, N.A. or any of their affiliates. An Investment in the Fund involves investment risks, including the possible loss of the principal amount invested.
There can be no assurance that a Fund will achieve this Investment Objective. Although the Investment Adviser will endeavor to recommend Investments that are consistent with the Investment Objective, investments in real estate and real estate-related
assets involve an inherently greater risk of loss of capital than various other types of investments, due in large part to the risk factors set forth in this Booklet and in Section V of the Memorandum. Therefore, prospective investors must recognize that,
notwithstanding the Investment Objective, the Fund may be unable to preserve an Investor’s capital through its program of investments in real estate.
Lack of liquidity: Interests in the GRA – Omni Program or any Fund and each Feeder Entity will not be transferable except with the consent of the Management Company, which consent may be withheld in its absolute discretion. Investors may not withdraw
capital from the Fund or any Feeder Entity once they have invested, except by submitting a repurchase request. Repurchase requests will, however, only be met at the absolute discretion of the Management Company. Accordingly, investors in the Fund or a
Feeder Entity will have no right to have their interests repurchased. Investor’s may be required to bear the financial risk of their investment in the Fund or a Feeder Entity for an indefinite period of time. If an investors interest is repurchased or transferred within
the first three years following the acceptance of the investor into the Fund or any Feeder Entity, a Repurchase Fee will be payable. The repurchase feature differs for each Fund.
Leverage: The use of borrowing by a Fund and/or the Feeder Entities may create greater potential for loss as the available assets of the Fund and Feeder Entities may be insufficient to meet repayments and a Fund and Feeder Entities may not be able to
refinance existing borrowing on equal terms or at all.
Distributions: An investor will only receive cash distributions from a Fund or Feeder Entity in which it is invested if it elects to do so. If an investor does not so elect, distributions will be reinvested on its behalf in the Fund or Feeder Entity, as the case may be.
However, tax may still be payable by the investor on such re-invested distributions. Distributable cash flow will be accumulated in relation to any accumulation units issued.
Risks associated with real estate and infrastructure investments: An investment in the GRA – Omni Program or any Fund or a Feeder Entity will be subject to certain risks associated with the ownership of real estate and infrastructure related investments.
These risks include, among others, adverse changes to national or international economic conditions; increase in competition; changes in interest rates, property taxes and other operating expenses; legal fees and expenses incurred to protect the Fund’s
investments; changes in planning laws and other governmental rules and fiscal policies; casualty or condemnation losses; uninsured damages from natural disasters and acts of terrorism and limitations on and variations in rents. These factors could give rise to
fluctuations in occupancy rates, rent schedules or operating expenses. In addition, investments in real estate and infrastructure tend to be long-term and illiquid. The Fund may also invest in real estate and infrastructure related securities and other real estate-
related investments, which will involve risks in addition to those set out above.
Risks to Returns from Real Estate Investments Other than Properties. A Fund may invest in investments other than direct real estate investments. The performance of those investments will be inherently linked to the value of the real estate from which
they derive their inherent value. Accordingly, all of the risks which apply in respect of direct real estate described above and are further be described in that Fund’s Memorandum will, to varying degrees, impact on the value of any other investments the Fund
makes.
Environmental risks: The Funds may become liable for substantial costs arising from remedying environmental problems associated with the properties it holds. The costs of any such remediation may exceed the value of the relevant property and/or the
aggregate assets of the Fund. Environmental problems may also affect the use and operation of such properties.
Currency risk and hedging: The base currency may vary for select Funds; refer to the respective Fund’s Memorandum. Investors may be subject to fluctuations in currency exchange rates. Some Funds may enter into transactions to hedge currency risk.
However, there can be no assurance that such hedging techniques will be successful.
Diversification: A possible limited degree of diversification means the performance of a Fund may be more susceptible to a single economic, political or social event. The GRA – Omni Program does not guarantee diversification protection.
Changes in Tax Regimes: Changes in tax legislation, administrative practices or understandings in any of the countries in which a Fund invests or in which the investor resides, or changes in tax treaties negotiated by those countries, could adversely affect the
returns from that Fund.

STRICTLY PRIVATE | CONFIDENTIAL
14 | FOR INSTITUTIONAL/WHOLESALE/PROFESSIONAL CLIENTS AND QUALIFIED INVESTORS ONLY – NOT FOR RETAIL USE OR DISTRIBUTION
Risk Factors continued
Lack of operating history: A Fund and Feeder Entities, when formed, will have no operating history. The past performance of other investments made by J.P. Morgan Asset Management or its affiliates are not an indication of the future results of an investment
in that Fund or Feeder Entities.
Conflicts of interest: JPMorgan Chase & Co. engages in activities in the normal course of its investment banking, asset management and other businesses that may conflict with the interests of any Fund, the Feeder Entities and/or their respective investors.
Highly Volatile Markets: The prices of securities and commodities contracts and all derivative instruments, including futures and options, can be highly volatile. Price movements of forward, futures and other derivative contracts in which an Underlying
Investment’s assets may be invested are influenced by, among other things, interest rates, changing supply and demand relationships, trade, fiscal, monetary and exchange control programs and policies of governments, and national and international political
and economic events and policies. An Underlying Investment also is subject to the risk of the failure of any exchanges on which its positions trade or of their clearinghouses.
Risks Associated with Investments in Maritime Assets Generally: An investment in the Strategy is subject to certain risks associated with the ownership of maritime assets and the maritime industry in general, including: the burdens of ownership of maritime-
related assets; local, national and international economic conditions; the supply and demand for assets; the financial condition of operators, buyers and sellers of assets; changes in interest rates and the availability of credit which may render the sale or
refinancing of assets difficult or impracticable; changes in environmental laws and regulations, planning laws and other governmental rules and fiscal and monetary policies; environmental claims arising in respect of assets acquired with undisclosed or unknown
defects or problems resulting in environmental liabilities or as to which inadequate reserves have been established; changes in tax rates; changes in energy prices; negative developments in the economy that depress commercial transportation activity;
uninsured casualties; force majeure acts, terrorist and piracy events, under-insured or uninsurable losses; and other factors which are beyond the reasonable control of the Strategy and the Investment Adviser. In addition, as recent experience has
demonstrated, maritime assets are subject to long-term cyclical trends that give rise to significant volatility in values.
Risks of Fund of Funds Structure: Although J.P. Morgan Investment Management will receive information from each Underlying Investment regarding its investment performance and investment strategy, J.P. Morgan Investment Management may have little or
no means of independently verifying this information. An Underlying Investment may use proprietary investment strategies that are not fully disclosed to JPMIM, which may involve risks under some market conditions that are not anticipated by J.P. Morgan
Investment Management . The performance of the Fund and the Master Fund depends on the success of J.P. Morgan Investment Management in selecting Underlying Investments for investment by the Fund and the Master Fund and the allocation and
reallocation of Fund’s and the Master Fund’s assets among those Underlying Investments. Past results of portfolio managers selected by JPMIM are not necessarily indicative of future performance. No assurance can be made that profits will be achieved or
that substantial losses will not be incurred. Investment decisions of the Underlying Investment are made by the portfolio managers independently of each other so that, at any particular time, one Underlying Investment may be purchasing shares of an issuer
whose shares are being sold at the same time by another Underlying Investment.
A Fund or a Master Fund may not be able to withdraw from an investment fund except at certain designated times, limiting the ability of J.P. Morgan Investment Management to withdraw assets from an investment fund that may have poor performance or for
other reasons. Although a Fund and a Master Fund may invest in investment funds managed by affiliated portfolio managers, such managers owe a duty to their respective investment funds, not the Fund and the Master Fund. An affiliated portfolio manager
may not allow the Fund or the Master Fund to withdraw from an Investment Fund if it determines that a withdrawal would not be in the best interests of the investment fund. Certain investment vehicles will have the right to automatically redeem part of the
Fund’s or the Master Fund’s interest in such investment vehicles in the event that the Fund’s or the Master Fund’s interest exceeds a specified percentage. Such redemptions may occur without notice.
Absence of Regulatory Oversight: A Fund is not registered as an investment company under the U.S. Investment Company Act of 1940, as amended (the “Investment Company Act”), in reliance upon an exemption available to privately offered investment
companies and, accordingly, the provisions of the Investment Company Act (which, among other things, require investment companies to have a majority of disinterested directors, provide limitations on leverage, limit transactions between investment
companies and their affiliates and regulate the relationship between the Adviser and the investment company) are not applicable.
Legal, Tax and Regulatory Risks: Legal, tax and regulatory changes could occur during the term of a Fund and the Master Fund which may adversely affect a Fund or Master Fund. For example, the regulatory and tax environment for derivative instruments is
evolving, and changes in the regulation or taxation of derivative instruments may adversely affect the value of derivative instruments held by the Master Fund and the ability of the Master Fund to pursue its trading strategies. Similarly, the regulatory
environment for highly leveraged investors is evolving, and changes in the direct or indirect regulation of highly leveraged investors may adversely affect the ability of a Fund or the Master Fund to pursue its trading strategies. During any period in which the
assets of the Master Fund are considered “plan assets” subject to the fiduciary provisions of ERISA, the Adviser will be cons idered to be an ERISA fiduciary with respect to those assets. These fiduciary requirements may cause the Adviser to take actions, or to
decline to take actions, consistent with its fiduciary duties under ERISA which may not be in the equal best interest of all the Investors. In particular, the Adviser may be required to take actions that are not in the interest of non-Benefit Plan investors or to
refrain from actions that are in the interest of non-Benefit Plan Investors. During any period in which the assets of the Master Fund do not include “plan assets” subject to the fiduciary provisions of ERISA, the Adviser will not be considered an ERISA fiduciary
with respect to such assets or be obliged to observe the fiduciary requirements of ERISA or the prohibited transaction rules of ERISA or the Code.
No offer: This presentation is being communicated solely for the purposes of ascertaining levels of interest for the GRA – Omni Program or a particular Fund and Feeder Entities. Accordingly, this presentation is not, and should not be construed as an offer to
accept investment in the Fund or Feeder Entities. The GRA – Omni Program is not a fund or investment strategy, but an investment and administrative platform that can provide diversified access to multiple Global Real Assets strategies in a one stop portfolio
solution.

STRICTLY PRIVATE | CONFIDENTIAL
15 | FOR INSTITUTIONAL/WHOLESALE/PROFESSIONAL CLIENTS AND QUALIFIED INVESTORS ONLY – NOT FOR RETAIL USE OR DISTRIBUTION
Important Disclaimers
NOT FOR RETAIL DISTRIBUTION: This communication has been prepared exclusively for institutional/wholesale/professional clients and qualified investors only as defined by local laws and regulations.
This is a promotional document and is intended to report solely on investment strategies and opportunities identified by J.P.Morgan Asset Management and as such the views contained herein are not to be taken as an advice or recommendation to buy or sell
any investment or interest thereto. This document is confidential and intended only for the person or entity to which it has been provided. Reliance upon information in this material is at the sole discretion of the reader. The material was prepared without regard
to specific objectives, financial situation or needs of any particular receiver. Any research in this document has been obtained and may have been acted upon by J.P. Morgan Asset Management for its own purpose. The results of such research are being made
available as additional information and do not necessarily reflect the views of J.P.Morgan Asset Management. Any forecasts, figures, opinions, statements of financial market trends or investment techniques and strategies expressed are those of JPMorgan
Asset Management, unless otherwise stated, as of the date of issuance. They are considered to be reliable at the time of writing, but no warranty as to the accuracy, and reliability or completeness in respect of any error or omission is accepted. They may be
subject to change without reference or notification to you.
Any investment decision should be based solely on the basis of any applicable local offering documents such as the Prospectus, annual report, semi-annual report, private placement or offering memorandum. For further information, any questions and for
copies of the offering material you can contact your usual J.P. Morgan Asset Management representative. Both past performance and yield may not be a reliable guide to future performance. There is no guarantee that any forecast will come to past.
Any reproduction, retransmission, dissemination or other unauthorised use of this document or the information contained herein by any person or entity without the express prior written consent of J.P. Morgan Asset Management is strictly prohibited.
J.P.Morgan Asset Management and/or any of its affiliates and employees may hold positions or act as a market maker in the financial instruments of any issuer discussed herein or act as the underwriter, placement agent or lender to such issuer. The
investments and strategies discussed herein may not be suitable for all investors and may not be authorized or its offering may be restricted in your jurisdiction, it is the responsibility of every reader to satisfy himself as to the full observance of the laws and
regulations of the relevant jurisdictions. Prior to any application investors are advised to take all necessary legal, regulatory and tax advice on the consequences of an investment in the product(s).
Securities products, if presented in the U.S., are offered by J.P. Morgan Institutional Investments, Inc., member FINRA/SIPC.
J.P. Morgan Asset Management is the brand for the asset management business of JPMorgan Chase & Co. and its affiliates worldwide. This communication is issued by the following entities: in the United Kingdom by JPMorgan Asset Management (UK)
Limited, which is authorized and regulated by the Financial Conduct Authority(FCA); in other EU jurisdictions by JPMorgan Asset Management (Europe) S.à r.l.; in Switzerland by J.P. Morgan (Suisse) SA, which is regulated by the Swiss Financial Market
Supervisory Authority FINMA; in Hong Kong by JF Asset Management Limited, or JPMorgan Funds (Asia) Limited, or JPMorgan Asset Management Real Assets (Asia) Limited; in Singapore by JPMorgan Asset Management (Singapore) Limited or JPMorgan
Asset Management Real Assets (Singapore) Pte Ltd; Australia by JPMorgan Asset Management (Australia) Limited; in Taiwan by JPMorgan Asset Management (Taiwan) Limited; in Brazil by Banco J.P. Morgan S.A., which is regulated by The Brazilian
Securities and Exchange Commission (CVM) and Brazilian Central Bank (Bacen); and in Canada by JPMorgan Asset Management (Canada) Inc., which is a registered Portfolio Manager and Exempt Market Dealer in all Canadian provinces and territories
except the Yukon and is also registered as an Investment Fund Manager in British Columbia, Ontario, Quebec and Newfoundland and Labrador. This communication is issued in the United States by J.P. Morgan Investment Management Inc., which is
regulated by the Securities and Exchange Commission.
© 2017 JPMorgan Chase & Co. All rights reserved.