real effects of the sovereign debt crisis in europe...
TRANSCRIPT
REAL EFFECTS OF THE SOVEREIGN DEBT CRISIS IN
EUROPE: EVIDENCE FROM SYNDICATED LOANS∗
Viral V. Acharya
Tim Eisert
Christian Eufinger
Christian Hirsch
May 12, 2015
In this paper, we explore the impact of the European Sovereign Debt Crisis and the resulting credit crunch on the
corporate policies of firms. Existing theory suggests that sovereign crises can affect the real economy in complex ways
based on the nature of the interaction between bank and sovereign health. We show that banks’ exposures to impaired
sovereign debt and risk-shifting behavior of undercapitalized banks are of first-order importance for explaining the
negative real effects suffered by European firms, while moral suasion by governments to buy more domestic sovereign
debt does not seem to have played a major role. In particular, we present firm-level evidence showing that the lending
contraction at banks affected by the crisis depresses the investment, job creation, and sales growth of firms with
significant business relationships to these banks. These firms increase their precautionary motives to save cash out
of free cash flows and rely more on cash holdings than bank lines of credit for their liquidity management during
the crisis, a typical behavior of financially constrained firms. Our estimates suggest that the credit crunch explains
between one fifth and one half of the overall negative real effects in the sample.
JEL Codes: G01, G21, G28, E44.
∗The authors appreciate helpful comments from Bo Becker, Matteo Crosignani, Giovanni Dell’Ariccia, Daniela Fabbri, RainerHaselmann, Jhangkai Huang, Yi Huang, Vasso Ioannidou, Victoria Ivashina, Augustin Landier, Tatyana Marchuk, StevenOngena, Marco Pagano, Sjoerd van Bekkum, and Annette Vissing-Jorgensen. Furthermore, we thank conference participants atthe EFA Meeting 2014, the CSEF conference on “Bank Performance, Financial Stability and the Real Economy”, the RELTIFCEPR Meeting Oxford 2015, the International Conference on “Financial Market Reform and Regulation”, and the TsinghuaFinance Workshop 2014, as well as seminar participants at Berkeley, NYU, Columbia, Duke, Amherst, Temple, Zurich, IESE,the European Central Bank, CUNY, Mainz, and Konstanz. Eisert is grateful for financial support by the German NationalScientific Foundation and the Erasmus Research Institute of Management. Hirsch gratefully acknowledges support from theResearch Center SAFE, funded by the State of Hessen initiative for research Loewe. Eufinger gratefully acknowledges thefinancial support of the Public-Private Sector Research Center of the IESE Business School, University of Navarra, Spain. WordCount: 16,274 (with notes). Corresponding author: Viral V. Acharya, Phone: +1-212-998-0354, Fax: +1-212-995-4256, Email:[email protected], Leonard N. Stern School of Business, 44 West 4th Street, Suite 9-84, New York, NY 10012.
I. Introduction
Starting in 2009, countries on the periphery of the eurozone drifted into a severe sovereign debt crisis
as concerns about the deterioration of credit quality made it increasingly difficult for the affected countries
to refinance and service existing debt. Since the deterioration in the sovereigns’ creditworthiness fed back
into the financial sector (Acharya, Drechsler and Schnabl, 2014; Acharya and Steffen, 2014), lending to the
private sector contracted substantially in Greece, Ireland, Italy, Portugal, and Spain (the GIIPS countries).
For example, in Ireland, Spain, and Portugal, the overall lending volume of newly issued loans fell by 82%,
66%, and 45% over the 2008-2013 period, respectively.1 This contraction in loan supply led to a sharp
increase in the uncertainty for borrowing firms as to whether they would be able to access bank funding in
the future. As Pietro Fattorini, the owner and manager of a 23-year old Italian company, puts it: “It’s like
starting to drive on the motorway without knowing if you’ll find gas stations on the way.”2
This statement suggests that the contraction in bank lending negatively affected the corporate policies
of borrowing firms and thus might have been one important contributor to the severity of the European
Sovereign Debt Crisis. However, there is still no conclusive evidence as to (i) how important the bank
lending channel was for the severity of the crisis as opposed to the overall macroeconomic shock; (ii) whether
the credit crunch had any real effects for the borrowing firms in Europe since firms facing a withdrawal of
credit from one financing source might have been able to get funding from a different source (Adrian, Paolo
and Shin, 2013; Becker and Ivashina, 2014a); and (iii) what actually caused the decline in bank lending.
Against this background, our paper makes two important contributions to the literature. First, we
show that the decline in bank lending during the European Sovereign Debt Crisis was indeed an important
contributor to the severity of the crisis. In particular, we present firm-level evidence that the loan supply
contraction of banks affected by the sovereign debt crisis made firms with a higher dependence on these
banks financially constrained. These firms display an increased precautionary motive to save cash out of
free cash flow relative to unaffected firms, and also rely more on cash holdings relative to lines of credit for
liquidity management. As a result of the limited access to bank financing, we show that firms encountered
strong negative real outcomes; their investments, employment growth, and sales growth became depressed.
Using data on the geographical breakdown of firms’ subsidiary revenues, we provide detailed evidence that
the negative real effects are indeed significantly worsened by a bank lending shock, in addition to a pure
macroeconomic shock. Our estimates suggest that the credit crunch explains between one fifth and one half
of the overall negative real effects in the sample.
Second, to the best of our knowledge, we are the first to explore the possibly complex set of channels
1. “SMEs in peripheral Eurozone face far steeper borrowing rates” by Patrick Jenkins, Financial Times, October 10, 20132. “Italian Banks’ Woes Hurt Small Firms” by Giovanni Legorano, Wall Street Journal, December 1, 2013
1

through which the European sovereign debt crisis caused a reduction in bank lending, as well as the associated
negative real effects for borrowing firms. We document that the negative real effects of the European Sovereign
Debt Crisis that can be attributed to the bank lending channel are primarily associated with (i) banks from
GIIPS countries facing increased risk of losses on their significant domestic sovereign bondholdings, and (ii)
the resulting incentive of undercapitalized banks from GIIPS countries to engage in risk-shifting behavior by
buying even more domestic sovereign bonds, thereby crowding out corporate lending.
Our sample is based on loan information data obtained from Thomson Reuters LPC’s DealScan, which
provides extensive coverage of bank-firm relationships throughout Europe. We augment this dataset by hand-
matching firm-specific information from Bureau van Dijk’s Amadeus database and bank-specific information
from various sources. The sample includes firms from all European countries that were severely affected by
the sovereign debt crisis (the GIIPS countries) and firms incorporated in Germany, France, and the United
Kingdom (the non-GIIPS countries) which are the countries with the largest number of syndicated loans
among the European countries that were not significantly affected by the sovereign debt crisis. Our sample
period covers the years 2006 until 2012.
Our dataset provides three key advantages for studying the economic impact of the sovereign debt crisis
and the resulting lending supply contraction on European firms. First, the fact that the sample is pan-
European and includes a geographical breakdown of the firms’ subsidiary revenues enables us to more precisely
disentangle the adverse effects on the real economy caused by the macroeconomic demand and the bank credit
supply shock. To this end, we focus on firms that are not exposed to a macroeconomic demand shock, yet
are affected by a bank credit supply shock (e.g., a German firm without significant business in Spain but
with a lending relationship with a Spanish bank affected by the crisis). Second, our sample enables us to rule
out the possibility that a reduction in bank lending by domestic banks is substituted by bank credit from
foreign financial institutions. Third, and most importantly, the bank-specific information together with data
on bank-firm relationships allows us to determine which channels drive the contraction in bank lending, and
thus cause the negative real effects for borrowing firms.
There are at least three potential channels through which the sovereign debt crisis might have affected
bank lending and, in turn, the corporate policies of borrowing firms: one passive and two active. The
passive channel is the hit on a bank’s balance sheet. The active channels are risk-shifting and moral suasion.
The passive channel suggests that the dramatic increase in risk of GIIPS sovereign debt directly translates
into losses for banks due to their large sovereign bondholdings, as shown by the recent European Banking
Authority’s (EBA’s) EU-wide stress tests and capital exercises. To cope with these losses, banks had to
deleverage and thus might have reduced lending to the private sector (e.g., Bocola, 2013).
In the first active channel, the risk-shifting motive arises since weakly-capitalized banks from GIIPS
2
countries might have had an incentive to increase their risky domestic sovereign bondholdings even further
because of the high correlation with their other revenue sources (Diamond and Rajan, 2011; Crosignani,
2014). While banks are protected by limited liability in the case of a sovereign default, these bonds offer a
relatively high return in the good state of the world when the sovereign is not in default. In addition, eurozone
regulators consider these bonds to be risk-free (i.e., attach zero risk weights) and thus banks do not need to
hold any capital against potential losses on eurozone government bonds. This risk-shifting mechanism might
have led to a crowding-out of lending to the private sector and thus might have negatively impacted the real
economy. In the second active channel, according to the moral suasion motive, a government might have
explicitly or implicitly pressured domestic banks to increase their domestic sovereign bondholdings in case it
found it difficult to refinance its debt (e.g., Becker and Ivashina, 2014b), which also might have crowded out
lending to the real sector.
To assess whether the sovereign debt crisis affected the real economy in Europe through the bank lending
channel, we start by taking into account all potential bank lending channels (i.e., balance sheet hit, risk-
shifting, and moral suasion) by using a bank’s country of incorporation as a proxy for how affected the bank
was by the crisis. Using a difference-in-differences framework, our results document that during the sovereign
debt crisis, firms with a high dependence on banks incorporated in a GIIPS country (in the following called
GIIPS banks) exhibit behavior that is typical for financially constrained firms. That is, they have lower
leverage, demonstrate a significantly positive propensity to save cash out of their cash flows, and rely more
on cash holdings relative to bank lines of credit for their liquidity management. These results are not observed
for firms that are not dependent on GIIPS banks, nor for highly GIIPS bank-dependent firms in the period
prior to the sovereign debt crisis.
We then explore how these financially constrained firms adjusted their corporate policies. We find that
firms that had significant business relationships with GIIPS banks decreased investment more, and expe-
rienced less job creation and sales growth compared to firms that were less dependent on GIIPS banks.
These results are robust to controlling for unobserved, time-constant firm heterogeneity, time trends, and
time-varying firm characteristics. Results continue to hold if we include country-year fixed effects to capture
unobserved heterogeneity in country-specific macroeconomic shocks. Furthermore, we can rule out that our
results are driven by how firms and banks formed business relationships in the pre-crisis period. In particular,
we find that there is no correlation between a firm’s dependence on banks affected by the sovereign debt crisis
and its quality. Furthermore, there are no significant pre-crisis differences between GIIPS and non-GIIPS
banks that could explain our results. Lastly, we can rule out that syndicates that include GIIPS banks are
of lower quality in the pre-crisis period.
To control for shocks to a firm’s domestic market, as well as to take into account its foreign business
3

activities, we collect information on the revenues of all foreign and domestic subsidiaries of the borrowing firms
in our sample. This allows us to even more accurately disentangle the macroeconomic and the bank lending
shocks. Our results continue to hold if we restrict the sample to non-GIIPS firms that only have subsidiaries
in European Union countries that were not affected by the crisis.3 This finding confirms that indeed the bank
lending channel is an important contributor to the negative real effects for European borrowing firms during
the sovereign debt crisis. In addition, this result shows that even European firms that were not directly
affected by the crisis had to face indirect consequences if they had strong ties to banks that were affected
by the sovereign debt crisis. This finding thus highlights that the extensive cross-border lending in Europe
amplifies the shock transmission across the eurozone.
Furthermore, we show that for our sample of GIIPS firms, all results continue to hold if we restrict the
analysis to firms that have a substantial part of their revenues generated by non-GIIPS subsidiaries.4 Since
these firms have a larger part of their business in non-GIIPS countries, it is plausible to assume that they
faced a lower overall macroeconomic shock compared to firms that operate primarily in affected countries.
We use a partial equilibrium analysis to quantify the importance of the credit supply shock. By estimating
the counterfactual real outcome if a firm had a lower exposure to affected banks, we can get an estimate
of the magnitude of the real effects that were caused by the loan supply disruptions of GIIPS banks. Our
results suggest that in the case of GIIPS firms, between one third and one half of the overall negative real
effects in our sample can be attributed to banks’ lending behavior. For non-GIIPS firms we can explain
between one fifth to one third of the aggregate reduction in the real outcome variables. Not surprisingly,
we can explain less of the overall evolution for non-GIIPS firms since a substantial number of borrowers in
non-GIIPS countries have no exposure to GIIPS banks.
After highlighting the importance of the bank lending channel for the real effects for borrowing firms,
we specifically test the importance of the supply factors of bank lending and follow Sufi (2007) by splitting
our sample into listed and non-listed firms. The underlying assumption is that non-listed firms have fewer
alternative sources of funding and, in case bank-related loan supply factors played a role during the crisis,
the non-listed firms should have been much more affected than listed firms, which may have other sources
of funding available. Our results show that non-listed firms are indeed negatively affected by the sovereign
debt crisis. We do not find any evidence that listed firms had significantly negative real effects during the
crisis. Moreover, we show that banking relationships are in general sticky and that mostly non-listed firms
are unable to switch their bank. This finding again confirms that bank lending supply played a major role
in causing the real effects for borrowing firms.
3. For example, a German company without significant business activity in GIIPS or non-EU countries.4. For example, a Spanish company with a German subsidiary that generates a significant fraction of the company’s total
returns.
4
Furthermore, to even more precisely isolate a potential loan demand shock from a loan supply shock and
to test what actually causes the contraction in bank lending, we adapt the methodology first utilized by
Khwaja and Mian (2008), which exploits multiple bank-firm relationships. However, since syndicated loans
usually have relatively long maturities and we do not observe changes within the same loan over time (e.g.,
credit line drawdowns), a large number of observations in our sample have no significant year-to-year change
in the bank-firm lending relationships. Therefore, we have to resort to aggregating firms into clusters to
generate enough time-series heterogeneity in bank lending, which then allows us to control for observed and
unobserved firm characteristics that are shared by firms in the same cluster. In particular, we form firm
clusters based on (i) the country of incorporation, (ii) the industry, and (iii) the firm rating. The results
confirm that European borrowing firms that had lending relationships with banks that were significantly
affected by the sovereign debt crisis suffered a severe loan supply shock.
To provide evidence on what actually caused the contraction in bank lending and ultimately the negative
real effects for borrowing firms, we then determine for each bank in our sample to which degree it is “affected”
by the sovereign debt crisis. Affected is defined, in line with the three potential channels through which the
European Sovereign Debt Crisis might have affected bank lending, as having an above median exposure to
sovereign risk (balance sheet hit), a below median capitalization or rating (risk-shifting), or an above median
influence of governments (moral suasion). To collect evidence for the hit on the balance sheet channel, we use
data from the EBA’s EU-wide stress tests and capital exercises and calculate each bank’s risk exposure to
the sovereign debt crisis. Furthermore, we obtain information about the banks’ health from SNL Financial
(leverage) and Bloomberg (ratings) to analyze whether GIIPS banks with low capital buffers engaged in
risk-shifting by buying additional domestic sovereign debt and cutting corporate lending. Finally, we use
data about government interventions, government bank ownership, and government board seats to measure
the influence of governments on their domestic banks and test whether real effects can also be attributed to
the moral suasion channel.
Using the modified version of the Khwaja and Mian (2008) estimator, our results show that banks with
larger sovereign risk in their portfolios reduce lending and increase spreads in the crisis period more than
banks with lower sovereign risk exposure. Furthermore, the findings show that weakly-capitalized GIIPS
banks cut their lending to the real sector and increase spreads more than well-capitalized GIIPS banks,
irrespective of whether risk-shifting incentives are proxied with leverage or rating. With regard to the moral
suasion channel, none of the three proxies indicates that moral suasion influenced bank lending during the
sovereign debt crisis.
Given this evidence on the importance of the different channels on bank lending, we then check whether
these channels also play an important role in causing the real effects for borrowing firms. For each firm
5
in our sample, we determine how dependent the firm is on affected banks, where affected is again defined
according to the three possible channels. In line with our bank lending regressions, our results confirm that
the negative real effects of the sovereign debt crisis, which can be attributed to the bank lending channel, are
mainly caused by the hit on banks’ balance sheets resulting from their large holdings of impaired sovereign
debt and their incentive to engage in risk-shifting behavior by buying risky sovereign bonds. Moral suasion,
on the other hand, does not seem to significantly impact the corporate policy of firms in our sample period.
In summary, we shed light on the complex interaction between bank and sovereign health and its impact
on the real economy. In particular, we show that there are significant spillovers from periphery sovereigns to
the local real economy, as well as cross-border spillovers to firms in non-GIIPS countries that are transmitted
through the bank lending channel. Therefore, we document that, while the eurozone greatly benefits its
members by deepening the degree of financial integration, the extensive cross-border bank lending also
facilitates the transmission of shocks across the eurozone when the banking sector experiences an aggregate
shock such as the periphery sovereign crisis and remains undercapitalized.
II. Related Literature
In general, our paper contributes to the literature on how shocks on banks’ liquidity or solvency are
transmitted to the real economy. Starting with Bernanke (1983), several researchers have taken on this
theme.5
In particular, our paper adds to the literature on the consequences of the European Sovereign Debt Crisis
on bank lending. Existing theory suggests that sovereign crises can affect the real economy in complex ways
based on the nature of the interaction between bank and sovereign health. According to Acharya, Drechsler
and Schnabl (2014), distress in the financial sector might induce governments to bailout weak banks, which,
in turn, increases sovereign credit risk. An increase in sovereign risk, however, lowers the value of both
government guarantees and the banks’ bondholdings, thereby again weakening the financial sector. Bocola
(2013) shows that higher sovereign risk not only tightens the banks’ funding constraints, but also raises the
risks associated with lending to the corporate sector, both leading to a decrease in credit supply to firms.
Farhi and Tirole (2014) allow for both sovereign debt forgiveness and financial sector bailouts. With this
setup, the authors show that banks might have an incentive to engage in collective risk-shifting by buying
domestic bonds, which might not be prohibited by their domestic governments if there is a possibility of
sovereign debt forgiveness. Uhlig (2013) shows that governments in risky countries have an incentive to allow
their banks to load up on domestic sovereign debt if these bonds can be used for repurchase agreements with
5. For a comprehensive overview over the “natural experiment” literature on shocks that induce variation in the cross-sectionof credit availability, see Chodorow-Reich (2014).
6
a common central bank.
Regarding the empirical evidence, De Marco (2014) and Popov and Van Horen (2015) find that after the
outbreak of the European Sovereign Debt Crisis, non-GIIPS European banks that had significant exposures to
GIIPS sovereign bonds reduced lending to the real economy and increased loan rates more than non-exposed
banks. Similar to our study, De Marco (2014) and Popov and Van Horen (2015) also use data on syndicated
lending. Bofondi, Carpinelli and Sette (2013) confirm this finding using bank-firm matches from the Bank
of Italy’s Credit Register data. Finally, Becker and Ivashina (2014b) conclude that banks shifting from firm
lending to increasing their domestic sovereign bondholdings is aggravated by the moral suasion of European
governments. These studies, however, do not analyze the consequences of the contraction in bank lending
during the sovereign debt crisis for the real economy.
Most importantly, our paper adds to the natural experiment literature on the real effects of bank lending
supply shocks at the firm-level, which is a challenging task as it requires data on bank-firm relationships,
as well as firm-level information. Therefore, there have only been very few papers addressing this research
question. Regarding the recent 2007-2009 financial crisis, Chodorow-Reich (2014) uses the DealScan database
and employment data from the U.S. Bureau of Labor Statistics Longitudinal Database to show that firms that
had pre-crisis relationships with banks that struggled during the crisis reduced employment more than firms
that had relationships with healthier lenders. Similarly, Bentolila et al. (2013) match employment data from
the Iberian Balance sheet Analysis System and loan information obtained from the Bank of Spain’s Central
Credit Register to document that during the recent financial crisis, Spanish firms that had relationships
with banks that obtained government assistance recorded a larger job destruction than firms that were only
exposed to healthy banks. Finally, Cingano, Manaresi and Sette (2013) use the Bank of Italy’s Credit Register
database to provide evidence that firms which borrowed from banks with a higher exposure to the interbank
market experienced a larger drop in investment and employment levels in the aftermath of the recent financial
crisis.
However, the impact of sovereign debt crisis on bank lending is much more complex compared to the bank
lending supply shock caused by the recent financial crisis, which mainly impaired the banks’ financial health.
As shown by the theoretical literature, aside from its impact on bank health, a sovereign debt crisis might
additionally lead to a crowding-out of corporate lending as it creates incentives for banks to increase their
risky domestic sovereign bondholdings. Moreover, governments might feel the need to pressure domestic
banks to buy even more domestic sovereign debt, which might also crowd out corporate lending. To our
knowledge, our paper and a concurrent paper by Balduzzi, Brancati and Schiantarelli (2014) are the only
papers that investigate the real effects of the European Sovereign Debt Crisis. Using survey data on micro
and small Italian firms, Balduzzi, Brancati and Schiantarelli (2014) exploit the shocks caused by the recent
7
financial crisis and the European Sovereign Debt Crisis to Italian banks’ funding costs.6 They find that firms
that are connected to banks with a higher CDS spread invest less, hire fewer workers, and reduce the growth
of bank borrowing. However, Balduzzi, Brancati and Schiantarelli (2014) focus solely on the impact of the
sovereign debt crisis on market-based measures of banks health and, in turn, the effect of the impaired bank
health on the corporate policies of borrowing firms. Therefore, our paper is the only one that sheds light on
the question of how the sovereign debt crisis actually caused a contraction in bank lending and the resulting
real effects for borrowing firms. In particular, we are the first to document that the negative real effects of
the sovereign debt crisis are due to both risk-shifting behavior and a reduction in bank health from exposures
to impaired sovereign debt.
III. Data and Descriptive Statistics
In this section, we describe our dataset. We also provide descriptive statistics related to the corporate
policies and firm characteristics of the firms in our sample.
III.A. Data
We use a novel hand-matched dataset that contains bank-firm relationships in Europe, along with detailed
firm and bank-specific information. Information about bank-firm relationships are taken from Thomson
Reuters LPC’s DealScan, which provides a comprehensive coverage of the European syndicated loan market.
In contrast to the United States, bank financing is the key funding source for firms in our sample since only
very few bonds are issued in Europe (Standard & Poor’s, 2010). We collect information on syndicated loans
to non-financial firms from all GIIPS countries. In addition, to be better able to disentangle the macro
and bank lending supply shock, we include firms incorporated in Germany, France, and U.K. (non-GIIPS
countries), which are the countries with the largest number of syndicated loans among the European countries
that were not significantly affected by the sovereign debt crisis. Consistent with the literature (e.g., Sufi,
2007), all loans are aggregated to a bank’s parent company. Our sample period covers the pre-crisis years
starting in 2006 and ending in 2012, such that we have a symmetric time window around the beginning of
the European Sovereign Debt Crisis.
We augment the data on bank-firm relationships with firm-level accounting data taken from Bureau van
Dijk’s Amadeus database. This database contains information about 19 million public and private companies
from 34 countries, including all EU countries. DealScan and Amadeus do not share a common identifier. To
6. In contrast, we use data from syndicated loans, which is mainly used by large corporations. Therefore, our estimates serveas a lower bound for the adverse effects of a bank credit supply shock, since this effect is supposedly even more pronounced forsmaller firms given their inability to substitute bank financing with other funding sources.
8

merge the information in these databases, we hand-match firms to the DealScan database. Amadeus groups
firms into different size categories ranging from “Small” to “Very Large”. Perhaps not surprisingly, firms in
the intersection of Amadeus and DealScan are either classified as “Large” or “Very Large”. For firms to be
classified as large, they have to satisfy at least one of the following criteria: operating revenue of at least 10
million Euro, total assets of at least 20 million Euro, at least 150 employees, or the firm has to be publicly
listed. The respective criteria for very large companies are: at least 100 million Euro operating revenue, at
least 200 million Euro total assets, or at least 1000 employees. Furthermore, we hand-match our sample to
the Capital IQ database to obtain detailed data on the whole debt structure for a subsample of our firms
including detailed information on total outstanding and undrawn credit lines.
In addition, we augment the dataset with bank-level information from various sources. We get data about
the sovereign debt holdings of European banks from the EBA’s EU-wide stress tests and capital exercises.
Furthermore, we obtain information about the banks’ health from SNL Financial (leverage) and Bloomberg
(ratings). To get data about governmental influence on European banks, we obtain data about government
interventions compiled from information disclosed on the official EU state-aid websites.7 Finally, we compile
government bank ownership data from Bankscope, and extract the fraction of directors affiliated with the
respective government from the BoardEx database. The exact definitions of all variables are summarized in
Table I.
III.B. Descriptive Statistics of Firms’ Corporate Policies and Characteristics
To measure a firm’s dependency on GIIPS banks in a given year, we determine the fraction of the firm’s
total outstanding syndicated loans that is provided by GIIPS lead arrangers. Therefore, the GIIPS Bank
Dependence of firm i in country j in year t is defined as:
GIIPS Bank Dependenceijt =
∑l∈Lijt
%GIIPS Lead Arranger in Syndicatelijt · Loan Amount lijt
Total Loan Amount ijt,(1)
where Lijt are all of the firm’s loans outstanding at time t. Our choice to measure GIIPS Bank Dependence
based on lead arrangers is motivated by the central role that these banks play in originating and monitoring a
syndicated loan (Ivashina, 2009).8 Therefore, when a lead arranger either chooses or is forced to cut back its
lending activities, we expect this to significantly impact the borrowing firm. We follow Ivashina (2009) and
identify the lead arranger according to definitions provided by Standard & Poor’s, which for the European
loan market are stated in Standard & Poor’s Guide to the European loan market (2010). Therefore, we
7. The data can be obtained from: http://ec.europa.eu/competition/elojade/isef/index.cfm?clear=1&policy_area_id=3.
8. As a robustness check, we alternatively measure the GIIPS Bank Dependence of a firm as the fraction of total syndicatedloans outstanding that is provided by banks in the syndicate that are incorporated in a GIIPS country. Our main results arequalitatively the same for this measure.
9

classify a bank as a lead arranger if its role is either “mandated lead arranger” or “bookrunner”.
In Panel A of Table II, we show the differences in evolution of the corporate policies of firms across groups
of high (above sample median) and low (below sample median) GIIPS Bank Dependence. The evolution of
corporate policies of the sample of firms with high GIIPS Bank Dependence during the sovereign debt crisis is
more negative than for firms with lower GIIPS Bank Dependence. Firms with a high GIIPS Bank Dependence
have significantly less employment growth, invest less, and experience lower sales growth compared to the
firms with a low GIIPS Bank Dependence. These results are consistent with the notion that the sovereign
debt crisis impacted the real economy through the bank lending channel.
Panel B of Table II presents descriptive statistics for the firm-level control variables, split into firms with
high and low GIIPS Bank Dependence and into crisis and pre-crisis periods. Firms with high GIIPS Bank
Dependence tend to be larger, have more tangible assets, a higher leverage, and lower interest coverage ratios.
To test these observed differences more formally, we follow Imbens and Wooldridge (2009) and report the
normalized difference of the two subsamples that are defined as the averages by treatment status, scaled by
the square root of the sum of the variances, as a scale-free measure of the difference in distributions. This
measure avoids the mechanical increase in sample size, that one typically observes when reporting t-statistics.
Imbens and Wooldridge (2009) suggest as a rule of thumb that the normalized difference should not exceed
an absolute value of one quarter. As can be seen in Panel B of Table II, none of the differences reaches this
threshold, suggesting that firms in the two groups are comparable along observable dimensions.
IV. Financial and Real Effects of the Sovereign Debt Crisis
IV.A. Methodology
Our objective is to examine the association between a bank’s exposure to the sovereign debt crisis and the
resulting corporate policy of its borrowing firms. We expect that firms with stronger lending relationships to
banks affected by the sovereign debt crisis are more financially constrained and thus behave differently both
in terms of financial and real decisions compared to less affected firms.
We start with broadly assessing whether the sovereign debt crisis affected the real economy through the
bank lending channel. To capture all channels through which banks were affected, we use a bank’s country
of incorporation as a proxy for its exposure to the sovereign debt crisis. There are at least three reasons
for this choice. First, banks’ bond portfolios are generally biased towards domestic sovereign bondholdings,
implying that there is a strong positive relation between a bank’s country of incorporation and its exposure
to the sovereign debt of that country (hit on balance sheet). Second, GIIPS banks have an incentive to buy
additional risky domestic debt (risk-shifting) and, third, GIIPS governments potentially pressure domestic
10
banks to increase their domestic sovereign bondholdings (moral suasion).
For the analysis, we divide banks into two groups. The first group consists of banks headquartered in
GIIPS countries given that these countries are most affected by the European Sovereign Debt Crisis. As
a control group, we choose banks from Germany, France, and the U.K., which are the countries with the
largest number of syndicated loans among the European countries that were not significantly affected by the
sovereign debt crisis. In Section V, we provide more detailed evidence on which of the possible channels are
causing the real effects.
We divide our sample into two periods: one before the sovereign debt crisis (2006-2008 for Greece, 2006-
2009 for all other countries) and one during sovereign debt crisis (2009-2012 for Greece, 2010-2012 for all
other countries).9 This yields a symmetric time window around the beginning of the European Sovereign
Debt Crisis. We construct an indicator variable, Crisis, which is equal to one if the financial information
reported in Amadeus falls in the respective crisis period.
In Panels A-C in Figure I, we plot the time series of the average employment growth rates, the investment
levels, and sales growth rates, respectively, for firms with a high and low GIIPS Bank Dependence, which is
defined in equation (1). In line with the univariate results in Panel A of Table II, the evidence shows that
a higher GIIPS Bank Dependence leads to larger negative real effects during the crisis period. For example,
employment growth rates for borrowing firms with a high GIIPS Bank Dependence decrease during the crisis
period while employment rates for firms with a lower GIIPS Bank Dependence show an increase. Similar
results can be found for the other dependent variables.
To provide multivariate evidence for the results presented in Figure I, we estimate the following panel
regressions for firm i in country j. The unit of observation is a firm-year and the dependent variables are a
firm’s employment growth rate, sales growth rate, investment level, and net debt, respectively:10
yijt+1 = α+ β1 ·GIIPS Bank Dependenceij,min{t,tlj}
+ β2 ·GIIPS Bank Dependenceij,min{t,tlj} · Crisisjt
+ γ ·Xijt + Firmij + Year t+1 + uit+1.(2)
where tlj refers to the last pre-crisis year (2008 for Greece, 2009 for other countries). Note that we keep
the GIIPS Bank Dependence constant at its pre-sovereign debt crisis level for each crisis year to address the
concern that firms with bad performance during the crisis lost the opportunity to get funding from non-
9. In 2009, Greek bond yields started to diverge from the yields of other eurozone members and the Greek 5-year sovereignCDS spread escalated from 100 basis points in May 2009 to 250 points by the end of the year. During 2010 investors also startedto lose confidence in Italy, Ireland, Portugal, and Spain. For these countries, the CDS spreads more than doubled betweenMarch and May 2010.
10. Since roughly 90% of our observations have no information on R&D expenses in Amadeus, we cannot investigate theimpact of GIIPS bank dependence on R&D
11
GIIPS banks and thus could only rely on GIIPS banks.11 Otherwise, our results could be biased since badly
performing firms then have a higher GIIPS Bank Dependence due to the lack of alternative funding sources,
and we could not attribute the effects we find to the credit crunch.
To investigate whether borrowing firms with significant business relationships to GIIPS banks became
financially constrained during the sovereign debt crisis, we follow Almeida, Campello and Weisbach (2004)
who show that firms that expect to be financially constrained in the future respond by saving more cash
out of their cash flow today, whereas financially unconstrained firms have no significant link between their
cash flow and the change in cash holdings. For the cash flow sensitivity of cash, we employ the following
specification:
∆Cashijt+1 = α+ β1 ·GIIPS Bank Dependenceij,min{t,tlj} + β2 · Crisisjt · Cash Flow ijt
+ β3 ·GIIPS Bank Dependenceij,min{t,tlj} · Crisisjt
+ β4 ·GIIPS Bank Dependenceij,min{t,tlj} · Cash Flow ijt
+ β5 ·GIIPS Bank Dependenceij,min{t,tlj} · Crisisjt · Cash Flow ijt
+ β6 · Cash Flow ijt + γ ·Xijt + Firmij + Year t+1 + uit+1.(3)
Our key variables of interest are the firms’ GIIPS Bank Dependence during the crisis period (β2 in equation
(2)) and the firms’ cash flow sensitivity of cash during the crisis period (β5 in equation (3)), respectively. If
firms were adversely affected by the sovereign debt crisis through the bank lending channel, then we expect
β2 in equation (2) to be negative. Moreover, if firms with a high GIIPS Bank Dependence become financially
constrained during the sovereign debt crisis, we expect that they save more cash out of their generated cash
flows to build up a liquidity buffer against the possibility of not being able to obtain additional funding in
the future, that is, we expect β5 in equation (3) to be positive.
We employ several control variables to capture confounding factors. In the baseline specification, we
include firm fixed effects to capture unobserved time-invariant firm heterogeneity and year fixed effects to
control for systematic shocks that affect all firms in a given year. Moreover, we include firm-level control
variables to capture other determinants of firms’ corporate policies. These include firm size, leverage, net
worth, the fraction of tangible assets, the interest coverage ratio, and the ratio of EBITDA to total assets.
GIIPS countries went through a severe recession starting in 2010 (2009 in the case of Greece) while non-
GIIPS countries were significantly less affected by economic downturns. To address concerns that our results
are driven by different aggregate demand fluctuations in our sample countries, we consider an alternative
specification where we add interactions between year and country fixed effects to capture any unobserved
11. As indicated by the term min{t, tlj}
12
country-specific macroeconomic shocks. This allows us to also capture time-varying country-specific shocks
to the credit demand of borrowing firms. We thus estimate the following regression model:
yijt+1 = α+ β1 ·GIIPS Bank Dependenceij,min{t,tlj}
+ β2 ·GIIPS Bank Dependenceij,min{t,tlj} · Crisisjt
+ γ ·Xijt + Firmij + Countryj ·Year t+1 + uit+1,(4)
where yijt+1 as before represents a firm’s employment growth rate, sales growth rate, investment level, and
net debt. For the cash flow sensitivity of cash we estimate:
∆Cashijt+1 = α+ β1 ·GIIPS Bank Dependenceij,min{t,tlj} + β2 · Crisisjt · Cash Flow ijt
+ β3 ·GIIPS Bank Dependenceij,min{t,tlj} · Crisisjt
+ β4 ·GIIPS Bank Dependenceij,min{t,tlj} · Cash Flow ijt
+ β5 ·GIIPS Bank Dependenceij,min{t,tlj} · Crisisjt · Cash Flow ijt
+ β6 · Cash Flow ijt + γ ·Xijt + Firmij + Countryj ·Year t+1 + uit+1.(5)
In the following, we report results for both specifications for the entire sample of firms.12
IV.B. Financial Outcomes
We start by analyzing how GIIPS Bank Dependence is affecting firms’ financial decisions. Results are pre-
sented in Table III. Column (1) provides results for net debt ((current + non-current liabilities - cash)/total
assets). The coefficient of the interaction of GIIPS Bank Dependence with the Crisis dummy (β2 in equa-
tion (2)) is negative, indicating that during the sovereign debt crisis, firms with higher exposure to GIIPS
banks reduced external debt financing more than other firms. A one standard deviation higher GIIPS Bank
Dependence during the crisis period leads to a reduction in net debt of between 2.0 and 2.3 percentage
points.13
Column (2) of Table III presents results for the degree to which firms save cash out of their cash flow. The
coefficient of the triple interaction of GIIPS Bank Dependence with cash flow and the Crisis dummy (β5 in
equation (3)) is statistically significant at the 1% level. This positive coefficient implies that a higher GIIPS
Bank Dependence induces firms to save more cash out of their cash flow for precautionary reasons. Note that
there is no significant relation between the GIIPS Bank Dependence of a borrowing firm and its propensity to
12. Estimating regressions (2)-(5) with one year lagged GIIPS Bank Dependence for the entire sample periods leaves all resultsqualitatively unchanged.
13. Results are qualitatively similar if we use the leverage ratio instead of net debt as the dependent variable.
13

save cash out of its cash flow in the pre-crisis period. Furthermore, firms in general do not show the typical
behavior of financially constrained firms during the crisis, as can be seen from the insignificant interaction
term of cash flow with the crisis dummy. Taken together, these results indicate that firms with a high GIIPS
Bank Dependence become financially constrained during the crisis. Based on the estimates in Column (2), a
one standard deviation higher GIIPS Bank Dependence of borrowing firms during the crisis implies that these
firms save 3.5 cents more per euro of cash flow. This compares well to the magnitudes found by Almeida,
Campello and Weisbach (2004), who show that financially constrained firms save on average 5-6 cents per
dollar of cash flow, while financially unconstrained firms have no significant relation between cash flow and
the change in cash holdings. To absorb country-specific macroeconomic shocks, we include country-year fixed
effects in our regression model. Results for this alternative specification are presented in columns (3) and (4)
of Table III. All results continue to hold.
Acharya et al. (2014) show that firms with higher liquidity risk are more likely to use cash rather than
bank credit lines for liquidity management because the cost of credit lines increases with liquidity risk. This
is due to the fact that banks retain the right to revoke access to liquidity precisely in states where the firms
need liquidity due to, for example, a liquidity shortfall because of negative cash flows. Since banks themselves
faced a substantial liquidity shock during the sovereign debt crisis, we expect that firms with a high GIIPS
Bank Dependence could lose access to their bank credit lines either because the credit lines are not prolonged
or cut off. These firms should thus increasingly rely on cash rather than on lines of credit to manage their
liquidity.
To test this implication, we follow Acharya et al. (2014) and hand-match our sample to the Capital IQ
database. This enables us to obtain data on the whole debt structure for a subsample of our firms including
detailed information on total outstanding and undrawn credit lines. We construct two measures for the
liquidity composition of borrowing firms from these data. First, we consider the fraction of the total amount
of outstanding credit lines over the sum of the amount of total outstanding credit line and cash. Second, we
construct a measure that captures the fraction of undrawn credit lines (i.e., the amount of a firm’s credit
line that is still available and can be drawn in case of liquidity needs) over undrawn credit lines and cash. In
Panels A and B of Figure II, we plot the time series of the average total and undrawn credit lines. We show
that there is a clear change in firm liquidity management during the sovereign debt crisis. Column (5) of
Table III reports results for a firm’s overall credit line, whereas column (6) reports results for the undrawn
credit lines. Across both specifications, we find that firms with a higher GIIPS Bank Dependence are less
able to rely on secure funding from lines of credit.14
To summarize, our results on the firms’ financial policy indicate that firms with a high GIIPS Bank
14. Given the smaller number of observations in this analysis, we cannot use it in our various sample splits.
14
Dependence show the typical pattern of financially constrained firms during the sovereign debt crisis. They
rely more on cash holdings for their liquidity management because the possibility of getting liquidity from
their bank lines of credit becomes more uncertain. Hence, if firms became financially constrained during
the sovereign debt crisis due to the lending behavior of their main banks, then these firms should also have
responded by adjusting their real activities.
IV.C. Real Outcomes
We next examine how the sovereign debt crisis impacted the corporate policies of firms. We estimate panel
regressions (see equation (2)) where yijt+1 measures employment growth (∆ log Employment), investment
(CAPX /Tangible Assets), or sales growth (∆ log Sales), respectively.15 Table IV presents the results.
Columns (1)-(3) show that firms with a high GIIPS Bank Dependence had a significantly lower employment
growth rate, cut investment by more, and experienced a larger sales growth reduction than firms that were
less dependent on GIIPS banks. Columns (4)-(6) show that these results are robust to including interactions
of country and year fixed effects. Based on the specifications in columns (4)-(6), a one standard deviation
higher GIIPS Bank Dependence of borrowing firms during the sovereign debt crisis leads to a 2.0 percentage
point reduction in employment growth, a 3.8 percentage point decrease in capital expenditures, and a 2.8
percentage point decrease in sales growth.16
IV.C.1 Controlling for Firms’ Business Exposure to the Sovereign Debt Crisis
Perhaps our biggest challenge is the concern that a firm’s dependency on GIIPS and non-GIIPS banks
might be determined by whether this firm has business in the respective countries. If this is the case, we
would potentially overestimate the negative real effects that can be attributed to the bank lending channel
since including country-year fixed effects does not rule out that our results are driven by the possibility that
a firm’s business exposure to affected countries impacts both, its GIIPS Bank Dependence and the negative
real effects.
To address this concern, we collect information on all foreign and domestic subsidiaries of the borrowing
firms in our sample, along with information about the revenues generated by their subsidiaries. We use
this information to determine each firm’s geographical revenue distribution. Ideally, we would also like to
control for the export/import dependence of our firms and their subsidiaries to specific countries. These
data, however, are only available for a very small subsample of our firms in Amadeus, rendering it impossible
15. Amadeus does not report capital expenditures. We construct a proxy for investments using the following procedure:Fixed Assetst+1−Fixed Assetst+Depreciation
Fixed Assetst. We set CAPX to 0 if negative.
16. In unreported results we find that there is no significant change in the return on assets, suggesting that the observedreduction in investment is not driven by firms cutting back on inefficient investment.
15
to also control for export/import dependence.
In a first step, we restrict the sample to non-GIIPS firms without subsidiaries in a GIIPS or any other
non-EU country (e.g., a German firm without subsidiaries), thereby narrowing the sample to firms that are
not directly affected by the macroeconomic shock in the periphery of the eurozone or any other part of the
world. This subsample of firms allows us to better disentangle the shock that comes from the lending behavior
of banks and the resulting funding uncertainty of firms from the overall macroeconomic shock.
In Panels A-C in Figure III, we plot the time series of the average employment growth rates, the investment
levels, and sales growth rates, respectively, of the firms in this subsample. Similar to Panels A-C in Figure
I, Panels A-C in Figure III show that for non-GIIPS firms without GIIPS subsidiaries, a higher GIIPS Bank
Dependence leads to larger negative real effects during the crisis period.
Panel A of Table V provides multivariate results for the evidence presented in Figure III. As the table
shows, all results continue to hold, confirming that the decline in lending of banks, which are adversely
affected by the sovereign debt crisis, have negative real effects for borrowing firms. Looking at Panel B
of Table V, we find weaker effects for non-GIIPS firms with GIIPS subsidiaries (e.g., a German firm with
subsidiaries in Italy and Spain), indicating that these firms are hit by the macroeconomic shock and that the
bank lending supply shock is thus only of second-order importance.
In a second step, we restrict our sample to GIIPS firms with an above median fraction of their revenue
generated by non-GIIPS subsidiaries (e.g., a Spanish firm that has a significant fraction of its revenues
generated by a German subsidiary). For these firms, it is plausible to assume that they have a relatively
smaller macroeconomic shock compared to firms with more business in the eurozone periphery countries.
Panels A-C of Figure IV show that firms with higher dependence on GIIPS banks have to incur larger
negative real effects. In line with this evidence, Panel C of Table V shows that all results continue to hold
for the subsample of GIIPS firms with a high fraction of their revenue generated by foreign non-GIIPS
subsidiaries. Looking at Panel D of Table V, we again find weaker effects for GIIPS firms with a majority
of their business in GIIPS countries (e.g., a Spanish firm without subsidiaries), although the difference is in
most cases not statistically significant. For these firms, it seems plausible that the country-year fixed effects
absorb the dominating macro shock and that the bank lending channel is again only a second-order effect if
firms are hit very hard by the crisis.
As a robustness check, we rerun our main regressions from Tables III and IV, using all firms for which
information on subsidiaries is available and include year fixed effects interacted with fixed effects that account
for the region where the firm is primarily conducting its business activities. More precisely, we construct two
pairs of interaction fixed effects: GIIPS business-year fixed effects and non-GIIPS business year fixed effects.
GIIPS business-year fixed effects are included in the regression for all GIIPS firms, along with all non-GIIPS
16

firms with subsidiaries in GIIPS countries. Similarly, non-GIIPS business-year fixed effects are included in
the regression for all non-GIIPS firms, along with all GIIPS firms that have an above median fraction of
their revenues generated by non-GIIPS subsidiaries. This allows us to capture the macroeconomic shocks in
the country of incorporation, as well as the shocks for business regions outside the firm’s country. All results
continue to hold using this alternative specification (see Table VI).
Taken together, the findings show that even firms without significant business exposure to countries that
were severely hit by the sovereign debt crisis incurred negative real effects if they had strong ties to GIIPS
banks before the crisis. Therefore, the contraction in bank lending indeed aggravated the negative impact of
the sovereign debt crisis on the real economy.
IV.C.2 Aggregate Effects
With some additional assumptions, we can use the firm-level results for the different subsamples from Table
V to inform the debate regarding the aggregate effects of the loan supply shock of the European Sovereign
Debt Crisis. Before we detail our procedure, it is important to emphasize that the analysis performed in this
section is a partial equilibrium analysis, that is, we assume that the overall real effect equals the sum of the
real effects at the firm level. This strategy to estimate aggregate effects is similar in spirit to the procedure
used in Chodorow-Reich (2014). In what follows, we explain our strategy to estimate aggregate effects using
employment growth rates as an example. We perform the same analysis for investment and sales growth
rates.
We start by defining the counterfactual employment growth rate of Firmij if it had a one standard
deviation lower GIIPS Bank Dependence as
yijt = yijt − β1 ·GIIPS Bank Dependenceij,min{t,tlj} · σGIIPSBankDependence
− β2 ·GIIPS Bank Dependenceij,min{t,tlj} · Crisisjt · σGIIPSBankDependence,(6)
where yijt denotes the fitted value from the respective regression. We set the counterfactual GIIPS Bank
Dependence equal to zero if it becomes negative. In the case of employment, we then use the counterfactual
employment growth rate to calculate the counterfactual employment level Empijt and similarly the fitted
value employment level Empijt. The total losses due to the bank lending shock during the crisis period are
then given by
Total Losses =∑ijt
[Empijt − Empijt].(7)
17
The fraction of the sample net employment change during the crisis that is caused by banks’ lending behavior
is then given by
∑ijt [Empijt − Empijt]∑
ijt[Empijt−1 − Empijt].(8)
In reporting our results, we focus on the two subsamples of firms, where we are best able to disentangle
the macroeconomic shock from the bank lending shock. Looking at the results for GIIPS firms with a high
fraction of revenue generated by non-GIIPS subsidiaries first, we find that overall employment fell by 5%
during the European Sovereign Debt Crisis period. Our effect accounts for 50% of this decline, that is, firms
would have cut employment by 50% less, had they borrowed from syndicates with a one standard deviation
lower fraction of GIIPS lead arrangers. Similarly, investment fell by 13% of which 52% can be explained by
banks’ lending behavior. For the evolution of sales, we find an overall decrease of 3.6% over the European
Sovereign Debt Crisis period of which we can explain 33%.
Considering the sample of non-GIIPS firms without subsidiaries in GIIPS or other non-EU countries, we
find that overall employment decreased by 1.6% during the European Sovereign Debt Crisis period. We can
attribute 20% of this decline to the bank lending supply shock. Similarly, investment fell by 2% of which
we can explain 33% with a contraction in bank lending. Finally, sales decreased by 2% and we are able to
explain 19% of this reduction in sales by the loan supply shock.
There are two things to note about these magnitudes. First, perhaps not surprisingly, the reduction
in employment, investment, and sales was smaller in non-GIIPS countries, which were less affected by the
European Sovereign Debt Crisis, than in GIIPS countries. Second, we can explain less of the overall reduction
in employment, investment, and sales in non-GIIPS countries. The main reason for this is that a considerable
number of non-GIIPS firms without subsidiaries in GIIPS or other non-EU countries have zero exposure to
GIIPS banks, implying that for them yijt equals yijt. Put differently, for a substantial number of non-GIIPS
firms in this subsample there are no loan supply disruptions caused by GIIPS banks implying, overall, that
we can explain less of the overall macroeconomic evolution.
IV.C.3 Matching of Firms and Banks
To ensure that the negative real effects for borrowing firms are actually caused by the shock of the
European Sovereign Debt Crisis on GIIPS banks, we have to rule out three alternative explanations for our
results that are related to how firms and banks formed business relationships in the pre-crisis period.
First, there could be an endogenous matching of firms and banks in the pre-crisis period that is driven
by firm quality. If low quality firms were more likely to enter into business relationships with GIIPS banks
18
before the European Sovereign Debt Crisis, our results could be driven by the fact that these firms are less
resilient against the shock of the crisis. If this would be the case, a firm’s GIIPS Bank Dependence would
be negatively correlated with a firm’s quality and we would wrongly attribute the negative real effects to the
bank lending channel although they are, at least partly, driven by an endogenous matching of low quality
firms and GIIPS banks in the pre-crisis period. In Panel B of Table II, we presents descriptive statistics for all
control variables, split into high and low GIIPS Bank Dependence firms for the pre-crisis period. The results
in Panel B of Table II show that firms do not differ across GIIPS Bank Dependence. This also holds for the
subsidiary subsamples (see Panels C and D of Table II). The correlation between GIIPS Bank Dependence
and the firm control variables is in general very low as well. Therefore, we can rule out that the results are
driven by an endogenous matching of low quality firms and GIIPS banks.
Second, our results could also be driven by the possibility that GIIPS banks were already less healthy
than non-GIIPS banks in the pre-crisis period. This would not have necessarily affected firms borrowing
from GIIPS bank in the pre-crisis period. However, a lower bank health might have made GIIPS banks less
resilient against the crisis. In this case, our results would not solely be driven by the negative impact of the
European Sovereign Debt Crisis on banks, but, in addition, by the fact that GIIPS banks were less able to
cope with the consequences of the crisis. To address this possibility, Panel E of Table II presents descriptive
statistics for various bank quality measures, split into GIIPS and non-GIIPS banks in the pre-crisis period.
We can draw two general conclusions from the descriptive statistics in Panel E of Table II. First, GIIPS and
non-GIIPS banks differ ex-ante along observable dimensions. GIIPS banks are smaller, have a considerably
higher equity ratio, and less impaired loans to equity compared to non-GIIPS banks, while the Tier 1 ratio
seems to be comparable across the two subgroups of banks. To more formally test the difference between the
two subsamples, we report the normalized difference below the table. This test reveals significant differences
in the two subsamples with respect to size and the equity to assets ratio, while impaired loans to assets and
the Tier 1 ratio are not significantly different. Therefore, we can reject the possibility that the results are
driven by a lower pre-crisis quality and, in turn, lower crisis resilience of GIIPS banks as, if anything, GIIPS
banks seem to be of better quality before the crisis.
Third, we have to rule out the possibility that the results are driven by ex-ante differences in the quality of
the loan syndicates. If, for some reason, better non-GIIPS banks have avoided entering into loan syndicates
with GIIPS banks, GIIPS banks would have been left with ex-ante worse non-GIIPS banks. For example,
despite the fact that firms with high and low GIIPS Bank Dependence do not differ, there could be ex-
ante information asymmetries between non-GIIPS banks and firms regarding the resilience of GIIPS banks
against a future crisis. Hence, in contrast to borrowing firms, better non-GIIPS banks might have foreseen
the consequences of the European Sovereign Debt Crisis for GIIPS banks. This would imply that syndicates
19
with GIIPS lead arrangers would be of lower quality to begin with, which could drive our results. To address
this concern, we divide non-GIIPS banks into two groups: banks with an above median fraction of deals
with GIIPS banks and those with a below median fraction of deals with GIIPS banks. Comparing these two
groups of banks, we find that they do not differ in terms of capital ratios and that non-GIIPS banks that
are issuing a high fraction of loans with GIIPS banks have a lower fraction of impaired loans (see Panel F of
Table II). Hence, our results do not seem to be driven by an ex-ante lower quality of syndicates that include
GIIPS banks.
IV.C.4 Supply Factors of Bank Lending
To specifically test the importance of supply factors for bank lending, we follow Sufi (2007) in that we use
our entire sample and split it into listed and non-listed firms. The underlying assumption is that non-listed
firms have fewer alternative sources of funding, since they are not able to raise additional public equity or
issue bonds, implying that these firms are more bank-dependent. Moreover, there is less publicly available
information for non-listed firms, requiring more monitoring and information collection on the banks’ side.
Overall, in case bank-related loan supply factors play a role during the crisis, non-listed firms should thus be
much more affected than listed firms, which have potentially other sources of funding available. Indeed Becker
and Ivashina (2014b) show that very large firms with access to alternative funding sources (e.g., bonds) are
able to substitute the lack of funding from banks.
Panel A of Table VII presents the results for the subsample of listed firms, whereas results for non-listed
firms are presented in Panel B of Table VII. As can be seen from the table, our results continue to hold
for non-listed firms; however, we do not find any evidence that listed firms show the typical behavior of a
financially constrained firm or that they have significantly negative real effects during the crisis period. In
line with the argument of Becker and Ivashina (2014b), listed firms thus seem to be able to substitute the
lack of bank financing with other funding sources, whereas non-listed firms cannot easily alter their funding
sources.
Furthermore, larger and public firms should also find it easier than smaller and private firms to borrow
from other banks than their previous relationship lender. Therefore, we investigate in greater detail the
evolution of bank relationships during the crisis period. Previous work (e.g., Chodorow-Reich (2014)) doc-
uments that bank relationships in the syndicated loan market are sticky, suggesting that most firms do not
switch banks. Indeed, we find in our sample as well that for 80% of firms the GIIPS Bank Dependence does
not change throughout the sample period. As expected, mostly listed firms with better access to alternative
funding sources and thus potentially higher bargaining power are able to switch banks. In contrast, 70%
of firms with constant bank relationships are non-listed firms. Panel C of Table VII shows that all results
20
continue to hold for the subsample of firms that do not switch banks, whereas we do not find significant
effects for firms that switch banks.17 Firms that switch banks only differ in size and whether they are public
or not from firms that do not switch banks. Along all other observable dimensions they are similar. This
finding again confirms that the bank lending supply shock that occurred during the European Sovereign Debt
Crisis played a major role in causing the real effects for borrowing firms.
Therefore, two important contributions of this study are: (i) we document the existence of strong spillovers
from high-spread euro area sovereigns to the local real economy through the bank lending channel and (ii)
we show that there are significant cross-border spillovers from the sovereign debt crisis in GIIPS countries
to firms in non-GIIPS countries that are also transmitted through the bank lending channel. Therefore,
while the euro greatly benefits its members by deepening the degree of financial integration, the extensive
cross-border bank lending has facilitated the transmission of shocks across the eurozone.
V. Active and Passive Transmission Channels
In this section, we shed more light on how sovereign credit risk translated into the contraction of lending
by banks incorporated in GIIPS countries and the resulting financial and real effects of borrowing firms
during the sovereign debt crisis.
There are at least three potential channels through which banks might have been affected by the sovereign
debt crisis: one passive and two active. The passive channel works through the dramatic increase in credit
risk of GIIPS sovereign debt during the sovereign debt crisis. Recent data published by the EBA show that
banks generally had large direct holdings of domestic government debt. Therefore, the increase in risk of
GIIPS sovereign debt directly translated into losses that weakened the asset side of GIIPS banks’ balance
sheets and as a result made these banks riskier (Acharya and Steffen, 2014). This can lead to losses for the
banks via three channels: (i) banks sell government bonds realizing a loss (ii) bonds are in the trading book
and therefore marked to market (iii) bonds are pledged to ECB which makes margin calls in case the value
of the collateral falls. To cope with these losses, GIIPS banks might have deleveraged and reduced lending
to the private sector (e.g., Chodorow-Reich, 2014; Bocola, 2013). We call this the “hit on balance sheet
channel”. This effect is amplified by the significant withdrawal of wholesale funding by U.S. money market
funds (Ivashina, Scharfstein and Stein, 2015).
The two active channels are the risk-shifting channel and the moral suasion channel. The risk-shifting
motive arises since, as default risk of GIIPS countries increases, highly levered GIIPS banks have an incentive
to increase their domestic sovereign bondholdings (Diamond and Rajan, 2011; Crosignani, 2014). This is due
17. Results available upon request.
21
to the fact that these bonds are correlated with the banks’ other sources of revenue and offer a comparatively
high return in the good state of the world when the sovereign is not in default, while the banks are protected
by limited liability in the case of a sovereign default. In addition, regulators consider that these bonds are
risk-free (i.e., attach zero risk weights); thus, banks do not need to hold any capital against potential losses on
government bonds. This risk-shifting mechanism might have led to a crowding-out of lending to the private
sector during the sovereign debt crisis.
Furthermore, a crowding-out of corporate lending might have been also caused by moral suasion (see
Becker and Ivashina, 2014b). As the sovereign debt crisis peaked, governments in GIIPS countries faced
severe problems in refinancing their debt. In these cases, governments may turn to their domestic banks
and force them to purchase domestic sovereign debt. Note that both active channels are consistent with
an increase in domestic sovereign bondholdings over the crisis period, which makes their disentanglement
particularly challenging.
V.A. Loan Level Outcomes
To investigate the importance of these three channels for the contraction of lending supply by banks in
our sample period, we compare, in a cross-sectional setting, lending before to lending during the sovereign
debt crisis. To control for loan demand and other observed and unobserved changes in borrowing firm charac-
teristics, we apply the Khwaja and Mian (2008) estimator, which exploits multiple bank-firm relationships to
isolate demand from supply effects. While we observe a large number of firms borrowing from multiple banks,
we face some constraints in data availability, that render it unfeasible to use the original setup of Khwaja
and Mian (2008). First, in contrast to their approach, our dataset contains information only at the time of
the origination of the loan, which does not allow us to observe changes over time for a particular loan (e.g.,
on credit line drawdowns). Second, the syndicated loans in our sample generally have long maturities. Taken
together, these two facts imply that a large number of observations in our sample experience no significant
year-to-year change in bank-firm lending relationships. This requires us to modify the Khwaja and Mian
(2008) estimator and aggregate firms into clusters to generate enough time-series bank lending heterogeneity
to meaningfully apply the estimator to our data.
To this end, we form firm clusters based on the following three criteria, which capture important drivers of
loan demand, as well as the quality of firms in our sample: (1) the country of incorporation; (2) the industry;
and (3) the firm rating. The main reason for aggregating firms based on the first two criteria is that firms
in a particular industry in a particular country probably share a lot of firm characteristics and were thus
likely affected in a similar way by macroeconomic developments during our sample period. Our motivation
behind forming clusters based on credit quality follows from theoretical research in which credit quality is
22
an important source of variation driving a firm’s loan demand (e.g., Diamond, 1991). To aggregate firms
into clusters, we assign ratings estimated from interest coverage ratio medians for firms by rating category
provided by Standard & Poor’s.18 This approach exploits the fact that our measure of credit quality which is
based on accounting information is monotone across credit categories (Standard & Poor’s, 2006). We follow
Standard & Poor’s and assign ratings on the basis of the three-year median interest coverage ratio of each
firm, where the median is calculated from the period preceding the sovereign debt crisis. This approach thus
allows us to control for any observed and unobserved characteristics that are shared by firms in the same
cluster and that might influence loan outcomes.
Panel A of Table VIII presents results for lending volume. The unit of observation in this regression is
a bank-year-firm cluster. The dependent variable accordingly represents the annual change in loan volume
provided by a given bank to a given cluster of firms. In column (1), we use a bank’s country of incorporation
as proxy for how affected a bank is by the crisis. Note, that this proxy summarizes all possible channels
that may affect the lending behavior of banks to the real sector. The coefficient is negative and statistically
significant, which is consistent with the interpretation that GIIPS banks significantly decreased their lending
volume to the real sector during the sovereign debt crisis. This finding supports the results presented in the
previous section that the financial and real effects of the firms during the sovereign debt crisis are indeed
associated with a reduction in bank lending.
To get a better idea of how strongly a bank is affected by the risk of its domestic sovereign portfolio, we
construct a similar measure as in Popov and Van Horen (2015), and measure the dependency on domestic
sovereign risk of bank b in year t as follows:
Domestic Sovereign Debt Risk bt =Domestic Sov. Bondholdingsbt ·Domestic Sov. CDS t
Total Assetsbt.(9)
Given that the sovereign bondholdings are multiplied with the respective CDS spreads, this measure accounts
for the amount of domestic sovereign bondholdings of the respective bank, as well as for the risk associated
with these holdings. We classify a bank as affected if its CDS-weighted holdings of domestic sovereign debt
are above the sample median.
The coefficient of the sovereign risk dummy variables interacted with the crisis dummy variable in column
(2) of Panel A of Table VIII is negative and significant, indicating that banks with larger sovereign risk in
their portfolios reduced lending during the crisis by a larger fraction than banks with lower sovereign risk
exposure.19 This result demonstrates that the risk associated with the sovereign bondholdings and thus the
18. Note that only a small fraction of all firms in our sample have a rating from one of the rating agencies.19. Note that for most banks, the majority of their sovereign bondholdings are domestic, which is why the coefficients for the
domestic and GIIPS sovereign risk exposure measures are very similar in magnitude. For brevity, we only report the results forthe domestic sovereign risk exposure measures.
23
losses incurred due to the sovereign debt crisis indeed play an important role for the lending behavior of
banks.
The risk-shifting and moral suasion hypotheses posit that GIIPS banks increased their domestic bond-
holding during the sovereign debt crisis, which led to a crowding-out of corporate lending. Therefore, to
determine whether this is indeed the case, we plot in Figure V the evolution of GIIPS (Panel A) and domes-
tic (Panel B) sovereign debt exposure over time for banks incorporated in non-GIIPS countries (left part of
graph) and GIIPS countries (right part of graph). The blue solid line shows the evolution of the sum of the
respective banks’ sovereign bondholdings scaled by the sum of banks’ total assets at the end of the respective
year. The red dashed line shows the sum of sovereign bondholdings multiplied by the sovereign’s CDS spread
as a fraction of the sum of total assets.
Figure V shows that most of the GIIPS sovereign bondholdings held by GIIPS banks are domestic,
implying a very high correlation between measures of bank affectedness based on overall GIIPS sovereign
bondholdings and domestic sovereign bondholdings. In addition, consistent with the results in column (2)
of Panel A of Table VIII, Figure V indicates that the riskiness of GIIPS sovereign bondholdings spiked in
the crisis period, which severely affected the health of GIIPS banks due to their large domestic sovereign
bondholdings. Furthermore, Panel A of Figure V shows that, while non-GIIPS banks slightly decreased
their GIIPS sovereign debt exposure between 2009 and 2011, GIIPS banks kept their GIIPS sovereign debt
holdings constant. Regarding the domestic sovereign debt holdings, Panel B of Figure V documents that
both GIIPS and non-GIIPS banks hold their domestic sovereign exposure constant. Hence, this preliminary
evidence contradicts the risk-shifting and moral suasion hypotheses.
However, even though GIIPS banks on average have not significantly increased their domestic sovereign
bondholdings, as shown in Panel B of Figure V, we cannot rule out that the risk-shifting channel and the
moral suasion channel played an important role for banks’ lending behavior and the resulting real effects
of borrowing firms. The fact that, on average, the domestic sovereign bondholdings of GIIPS banks do not
change is also consistent with distressed banks (i.e., those with high risk-shifting incentives) increasing their
holdings, while other banks decrease their domestic sovereign bondholdings. Similarly, only those GIIPS
banks that are very dependent on their governments might be pressured to increase their domestic sovereign
bondholdings, while less dependent banks might not.
To investigate these possibilities, we analyze the respective subsets of GIIPS banks separately. We start
with the risk-shifting channel and plot the evolution of the domestic sovereign debt exposure over time sep-
arately for well-capitalized (low leverage) and weakly-capitalized (high leverage) GIIPS banks. We consider
a GIIPS bank to be weakly-capitalized if its ratio between total equity to total assets (obtained from SNL
Financial) at the end of 2009 is below the sample median. As can be seen from Panel A of Figure VI,
24
weakly-capitalized GIIPS banks increased their holdings of domestic sovereign debt significantly by roughly
4 percentage points of total assets. This indicates that risk-shifting might have played a role for the cutback
in lending of highly leveraged banks.
To test the robustness of this finding, we use the banks’ rating before the sovereign debt crisis (i.e., at the
end of 2009) as an alternative measure of bank health. To determine the rating cutoff, we follow Drechsler et
al. (2014) and use the ratings (obtained from Bloomberg) from the main rating agencies (Moody’s, Standard
& Poor’s, and Fitch). We then assign a numerical value to each rating: 1 for AAA, 2 for AA+, and so on.
We then compute the median rating for each bank. This rating measure has the advantage that it is based
on assessments by market participants, rather than on accounting-based measures. In Panel B of Figure
VI, we plot the evolution of the domestic sovereign debt exposure for high-rated GIIPS banks (left part of
graph) and low-rated GIIPS banks (right part of graph), where we consider a GIIPS bank to be low-rated if
its median rating is below the A+ threshold. Results remain qualitatively unchanged, which again supports
the risk-shifting hypothesis.
Given this evidence, we more formally test whether the reduction in bank lending is also driven by
risk-shifting incentives, that is, whether weakly-capitalized GIIPS banks, which increased their domestic
sovereign bondholdings during the sovereign debt crisis, also decreased their corporate lending. The results
are presented in columns (3) and (4) in Panel A in Table VIII. We find that weakly-capitalized GIIPS banks
cut their lending to the real sector more than well-capitalized GIIPS banks, irrespective of how we proxy for
risk-shifting incentives. These results indicate that the active increase in domestic sovereign bondholdings,
shown in Figures VI results in a crowding-out of lending to the private sector for weakly-capitalized GIIPS
banks.
Finally, we examine whether the moral suasion channel affects bank lending during the sovereign debt
crisis. We use three proxies for the degree to which banks are prone to moral suasion of their sovereigns. First,
following Acharya and Steffen (2014), we use data about government interventions compiled from information
disclosed on the official EU state-aid websites to classify banks into intervened and non-intervened banks.20
The idea is that intervened banks are more prone to moral suasion as the influence of governments on these
banks is arguably larger than for non-intervened banks. We classify banks as affected if a bank received
some form of financial aid by the government. Second, we follow Iannotta, Nocera and Sironi (2013) and
compile government bank ownership data from Bankscope. As shown in De Marco and Macchiavelli (2014),
government ownership seems to have an influence on banks’ domestic sovereign bondholdings as banks with a
high government ownership share hold, in general, significant more domestic sovereign debt compared to other
20. The data can be obtained from: http://ec.europa.eu/competition/elojade/isef/index.cfm?clear=1&policy_area_id=3.
25

banks. We construct an indicator variable “High Fraction of Government Ownership”, which is equal to 1 if
the share owned by the government for a given bank in a certain year is above the median of the distribution.
Lastly, government control over banks can also be measured by government board representation. We follow
Becker and Ivashina (2014b) and extract the fraction of directors affiliated with the government from the
BoardEx database. For our empirical analysis, we construct an indicator variable equal to 1 if the fraction
of affiliated directors exceeds the median fraction of government affiliated directors.
Columns (5) to (7) of Table VIII present the results for our three proxies for moral suasion. The point
estimates of the three proxies for moral suasion interacted with the crisis indicator variable are not significantly
different from zero. For example, the interaction of the intervened GIIPS bank variable with the crisis
indicator variable is zero in magnitude and not statistically significant. Overall, moral suasion does not
appear to play a role for the banks’ lending decisions in our sample period.
Panel B of Table VIII shows the robustness of our results when we use the change in the spread of newly
issued loans instead of the change in volume as the dependent variable. We find qualitatively similar results
here.
We draw two main conclusions from the results in Table VIII. First, our evidence indicates that the balance
sheet hit caused by the increase in sovereign risk and the risk-shifting channel are of first-order importance
regarding the effect of the sovereign debt crisis on bank lending behavior. Second, we do not find evidence
that moral suasion plays a crucial role for banks’ lending decisions. We note that GIIPS banks might have
engaged in even greater risk-shifting and/or might have been forced by their governments to buy domestic
debt after the end of our sample period, that is, after 2012. Furthermore, GIIPS governments might not
have faced the need to pressure banks into buying more domestic sovereign debt since the weakly-capitalized
banks did so anyway due to their risk-shifting incentives.
V.B. Financial and Real Outcomes
We now examine which of the three channels contributed to the financial and real effects of borrowing
firms. We rerun our main panel regressions from equations (4) and (5). We construct several variables at the
firm-year level, reflecting how much credit comes from affected banks in a given year, where we distinguish
between affected and non-affected banks using the same proxies as in Table VIII. This leads to the following
measure for firm i in country j in year t:
Affected Bank Dependenceijt =
∑l∈Lijt
%Affected Banks in Syndicatelijt · Loan Amount lijt
Total Loan Amount ijt,(10)
26
where as before Lijt are all of the firm’s loans outstanding at time t. We begin by reporting results for the
passive bank lending channel, that is, whether the increase in sovereign risk that forced banks to deleverage
and thus decrease their corporate lending, affected borrowing firms by making them financially constrained.
The results are presented in Table IX. In Panel A, the affected indicator variable is equal to one if a bank’s
GIIPS sovereign portfolio credit risk exposure is above the sample median. In Panel B, the domestic sovereign
portfolio credit risk exposure is used to distinguish between affected and non-affected banks. The interaction
term of affected bank indicator and the Crisis variable is negative and significant for all dependent variables.
Therefore, Panels A and B show that the hit on the affected banks’ balance sheets results in negative financial
and real effects for firms that have a lending relationship with these banks.
Next, we examine whether the active bank lending channels, that is, the risk-shifting and the moral
suasion channel, led to real effects for borrowing firms. Table X reports results for the real effects if we
construct our affected bank dependence variable using GIIPS banks’ leverage (Panel A) or rating (Panel B),
respectively. The results for both bank health proxies indicate that the real effects are much stronger for
firms that have a lending relationship with a GIIPS bank that is weakly-capitalized and thus not able to cope
with losses caused by the sovereign debt crisis. These banks engage in risk-shifting by increasing their risky
domestic sovereign bondholdings and thus decrease bank lending even more compared to well-capitalized
GIIPS banks that could better manage the losses incurred during the sovereign debt crisis.
Finally, the results for the moral suasion proxy are presented in Table XI. We find that moral suasion
does not appear to impact the corporate policies of borrowing firms. Neither government interventions, nor
government board seats or government ownership have any explanatory power in the cross section. This is
consistent with the fact that moral suasion does not significantly impact the lending behavior of banks in
our sample.
VI. Conclusion
In this paper, we show that the European Sovereign Debt Crisis and the resulting credit crunch in the
eurozone periphery caused significant negative real effects for borrowing firms in Europe. We find that firms
that had a pre-crisis business relationship with banks that suffered from the sovereign debt crisis became
financially constrained during the crisis. As a result, these firms had lower employment growth rates, lower
levels of investment, and lower sales growth rates. This holds true for both GIIPS and non-GIIPS firms.
Moreover, we shed light on the question of how the European Sovereign Debt Crisis actually caused a
contraction in bank lending and the resulting real effects for borrowing firms. We document that the negative
real effects that can be attributed to the bank lending channel are primarily associated with (i) banks from
27

GIIPS countries facing losses on their significant domestic sovereign bondholdings, and (ii) the resulting
incentives of undercapitalized banks from GIIPS countries to engage in risk-shifting behavior by buying even
more risky domestic sovereign bonds, thereby crowding out corporate lending.
We are thus the first to provide cross-country evidence that negative spillovers from the sovereign to
the banking sector were also transmitted into the real economy throughout Europe as well as the first to
analyze how this transmission worked. We show that the high interdependence of bank and sovereign health
is one important contributor to the severe economic downturn in the southern European countries during the
sovereign debt crisis. The findings help to understand the unfolding of the European Sovereign Debt Crisis
and yield important insights on how to design a more stable European financial system.
New York University, CEPR, and NBER
Erasmus University Rotterdam
IESE Business School
Goethe University Frankfurt and SAFE
28

References
Acharya, Viral V., Heitor Almeida, Filippo Ippolito, and Ander Perez, “Credit Lines as Monitored Liquidity
Insurance: Theory and Evidence,” Journal of Financial Economics, 112 (2014), 287-319.
Acharya, Viral V., Itamar Drechsler, and Philipp Schnabl, “A Pyrrhic Victory? Bank Bailouts and Sovereign
Credit Risk,” Journal of Finance, 69 (2014), 2689-2739.
Acharya, Viral V., and Sascha Steffen, “The Greatest Carry Trade Ever? Understanding Eurozone Bank Risks,”
Journal of Financial Economics, 115 (2014), 215-236.
Adrian, Tobias, Paolo Colla, and Hyun Song Shin, “Which Financial Frictions? Parsing the Evidence from the
Financial Crisis of 2007-09,” in NBER Macroeconomics Annual 2012, Daron Acemoglu, Jonathan Parker,
and Michael Woodford, ed. (Chicago: University of Chicago Press, 2013).
Almeida, Heitor, Murillo Campello, and Michael S. Weisbach, “The Cash Flow Sensitivity of Cash,” Journal of
Finance, 59 (2004), 1777-1804.
Balduzzi, Pierluigi, Emanuele Brancati, and Fabio Schiantarelli, “Financial Markets, Banks’ Cost of Funding,
and Firms’ Decisions: Lessons from Two Crises,” Working Paper, 2014.
Becker, Bo, and Victoria Ivashina, “Cyclicality of Credit Supply: Firm Level Evidence,”Journal of Monetary
Economics, 62 (2014a), 76-93.
Becker, Bo, and Victoria Ivashina, “Financial Repression in the European Sovereign Debt Crisis,” Working
Paper, 2014b.
Bentolila, Samuel, Marcel Jansen, Gabriel Jimenez, and Sonia Ruano, “When Credit Dries Up: Job Losses in
the Great Recession,” CESifo Working Paper, 2013.
Bernanke, Ben, “Nonmonetary Effects of the Financial Crisis in the Propagation of the Great Depression,”
American Economic Review, 73 (1983), 257-276.
Bocola, Luigi, “The Pass-Through of Sovereign Risk,” Working Paper, 2013.
Bofondi, Marcello, Luisa Carpinelli, and Enrico Sette, “Credit Supply during a Sovereign Debt Crisis,” Bank of
Italy Temi di Discussione Working Paper, 2013.
Chodorow-Reich, Gabriel, “The Employment Effects of Credit Market Disruptions: Firm-Level Evidence from
the 2008-09 Financial Crisis,” Quarterly Journal of Economics, 129 (2014), 1-59.
Cingano, Federico, Francesco Manaresi, and Enrico Sette, “Does Credit Crunch Investments Down? New Evi-
dence on the Real Effects of the Bank-Lending Channel,” Working Paper, 2013.
Crosignani, Matteo, “Why are Banks not Recapitalized during Crises?,” Working Paper, 2014.
De Marco, Filippo, “Bank Lending and the Sovereign Debt Crisis,” Working Paper, 2014.
29

De Marco, Filippo, and Marco Macchiavelli, “The Political Origin of Home Bias: The Case of Europe,” Working
Paper, 2014.
Diamond, Douglas W., “Monitoring and Reputation: The Choice between Bank Loans and Directly Placed
Debt,” Journal of Political Economy, 99 (1991), 689-721.
Diamond, Douglas W., and Raghuram G. Rajan, “Fear of Fire Sales, Illiquidity Seeking, and Credit Freezes,”
Quarterly Journal of Economics, 126 (2011), 557-591.
Drechsler, Itamar, Thomas Drechsel, David Marques-Ibanez, and Philipp Schnabl, “Who Borrows from the
Lender of Last Resort?,” Journal of Finance, forthcoming, 2015.
Farhi, Emmanuel, and Jean Tirole, “Deadly Embrace: Sovereign and Financial Balance Sheets Doom Loops,”
Working Paper, 2014.
Iannotta, Giuliano, Giacomo Nocera, and Andrea Sironi,“The Impact of Government Ownership on Bank
Risk,”Journal of Financial Intermediation, 22 (2013), 152-176.
Imbens, Guido M., and Jeffrey M. Wooldridge, “Recent Developments in the Econometrics of Program Evalua-
tion,” Journal of Economic Literature, 47 (2009), 5-86.
Ivashina, Victoria, “Asymmetric Information Effects on Loan Spreads,” Journal of Financial Economics 92
(2009), 300-319.
Ivashina, Victoria, David Scharfstein, and Jeremy Stein “Dollar Funding and the Lending Behavior of Global
Banks,” Quarterly Journal of Economics, forthcoming, 2015.
Khwaja, Asim Ijaz, and Atif Mian “Tracing the Impact of Bank Liquidity Shocks: Evidence from an Emerging
Market,” American Economic Review, 98 (2008), 1413-1442.
Popov, Alexander and Neeltje Van Horen, “Exporting Sovereign Stress: Evidence from Syndicated Bank Lending
during the Euro Area Sovereign Debt Crisis,” Review of Finance, forthcoming, 2015.
Standard&Poor’s, “Corporate Ratings Criteria,” (New York, NY: The McGraw-Hill Companies, Inc.,2006).
Standard&Poor’s, “A Guide To The European Loan Market,” (New York, NY: The McGraw-Hill Companies,
Inc.,2010).
Sufi, Amir, “Information Asymmetry and Financing Arrangements: Evidence from Syndicated Loans,” Journal
of Finance 62 (2007), 629-668.
Uhlig, Harald, “Sovereign Default Risk and Banks in a Monetary Union,” German Economic Review, 15 (2013),
23-41.
30

TABLE I: Variable Definitions
Dependent Variables (all winsorized at the 5% level)
Variable Definition
Net Debt Current + Non-Current Liabilities - CashTotal Assets
∆Cash Casht+1−Casht
Total Assetst
Employment Growth ln(Employmentt+1)− ln(Employmentt)
CAPXFixed Assetst+1−Fixed Assetst+Depreciation
Fixed Assetst, set to 0 if negative
Sales Growth ln(Salest+1)− ln(Salest)
Key Explanatory Variables
Variable Definition
Crisis Indicator variable equal to one for the period of the sovereign debt crisis (starting in 2009
for Greece, in 2010 for all other countries)
GIIPS Bank Dependenceijt
∑l∈Lijt
%GIIPS Lead Arranger in Syndicate lijt·Loan Amount lijt
Total Loan Amount ijt
Affected Bank Dependenceijt
∑l∈Lijt
%Affected Banks in Syndicate lijt·Loan Amount lijt
Total Loan Amount ijt
Affected Bank Measures
Variable Definition
CDS Weighted GIIPS Sov. Bondholdings Banks with an above median ratio of∑
k Sov. Bondholdingskt·CDSkt
Total Assetst, for all k ∈ GIIPS
CDS Weighted Domestic Sov. Bondholdings Banks with an above median ratio ofDomestic Sov. Bondholdingst·Domestic Sov. CDS t
Total Assetst
High Leverage Banks with a below median ratio ofTotal EquityTotal Assets
Low Rating Banks with a rating of A+ or worse
Gov. Intervention Banks that received government support during the sovereign debt crisis
High Fraction Gov. Own. Banks with an above median fraction of government ownership
High Fraction Gov. Board Banks with an above median fraction of government affiliated directors on the board
Control Variables (all winsorized at the 5% level)
Variable Definition
ln(Assets) Natural logarithm of total assets
LeverageTotal Assets-Total Equity
Total Assets
Net WorthTotal shareholder funds&Liabilities - Current&Non-Current Liabilities - Cash
Total Assets
Tangibility Fixed AssetsTotal Assets
Interest Coverage Ratio EBITInterest Expense
EBITDA/Assets EBITDATotal Assets
Cash FlowCash flow
Total Assets
31
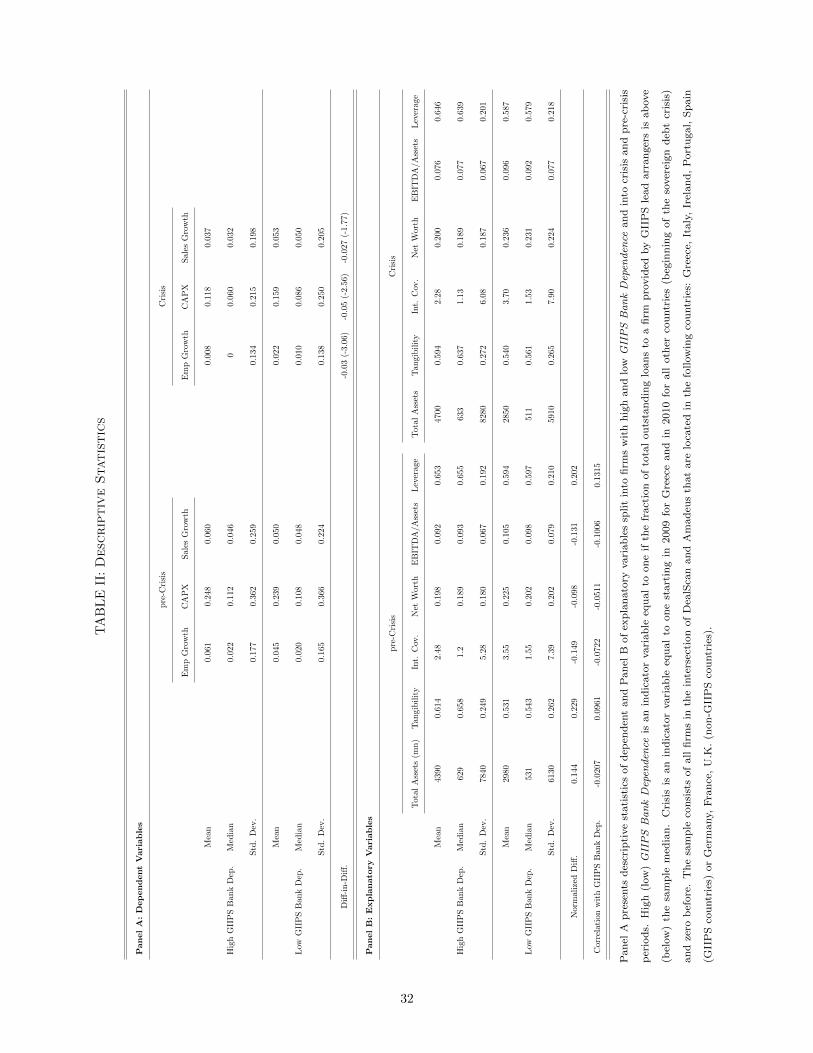
TA
BL
EII
:Desc
riptiveStatistics
Pan
el
A:
Dep
en
dent
Vari
ab
les
pre
-Cri
sis
Cri
sis
Em
pG
row
thC
AP
XSal
esG
row
thE
mp
Gro
wth
CA
PX
Sale
sG
row
th
Mea
n0.
061
0.248
0.06
00.0
080.
118
0.0
37
Hig
hG
IIP
SB
ank
Dep
.M
edia
n0.
022
0.11
20.0
460
0.060
0.03
2
Std
.D
ev.
0.1
77
0.36
20.
259
0.1
340.
215
0.1
98
Mea
n0.
045
0.239
0.05
00.0
220.
159
0.0
53
Low
GII
PS
Ban
kD
ep.
Med
ian
0.02
00.1
08
0.0
480.
010
0.08
60.
050
Std
.D
ev.
0.1
65
0.36
60.
224
0.1
380.
250
0.2
05
Diff
-in-D
iff.
-0.0
3(-
3.06
)-0
.05
(-2.
56)
-0.0
27(-
1.77
)
Pan
el
B:
Exp
lan
ato
ryV
ari
ab
les
pre
-Cri
sis
Cri
sis
Tot
alA
sset
s(m
n)
Tangi
bilit
yIn
t.C
ov.
Net
Wor
thE
BIT
DA
/Ass
ets
Lev
erag
eT
otal
Ass
ets
Tan
gib
ilit
yIn
t.C
ov.
Net
Wor
thE
BIT
DA
/A
sset
sL
ever
age
Mea
n43
900.6
14
2.4
80.
198
0.092
0.65
347
000.5
942.
280.
200
0.076
0.6
46
Hig
hG
IIP
SB
ank
Dep
.M
edia
n62
90.
658
1.2
0.189
0.09
30.6
5563
30.
637
1.13
0.1
890.
077
0.6
39
Std
.D
ev.
7840
0.2
495.2
80.
180
0.0
670.
192
8280
0.27
26.
080.1
870.
067
0.2
01
Mea
n29
800.5
31
3.5
50.
225
0.105
0.59
428
500.5
403.
700.
236
0.096
0.5
87
Low
GII
PS
Ban
kD
ep.
Med
ian
531
0.543
1.55
0.20
20.
098
0.59
751
10.
561
1.53
0.2
310.
092
0.5
79
Std
.D
ev.
6130
0.2
627.3
90.
202
0.0
790.
210
5910
0.26
57.
900.2
240.
077
0.2
18
Nor
mal
ized
Diff
.0.
144
0.2
29
-0.1
49-0
.098
-0.1
310.
202
Cor
rela
tion
wit
hG
IIP
SB
ank
Dep
.-0
.020
70.0
961
-0.0
722
-0.0
511
-0.1
006
0.13
15
Pan
elA
pre
sents
des
crip
tive
stati
stic
sof
dep
end
ent
an
dP
an
elB
of
exp
lan
ato
ryvari
ab
les
split
into
firm
sw
ith
hig
han
dlo
wGIIPSBankDepen
den
cean
din
tocr
isis
an
dp
re-c
risi
s
per
iod
s.H
igh
(low
)GIIPS
BankDepen
den
ceis
an
ind
icato
rvari
ab
leeq
ual
toon
eif
the
fract
ion
of
tota
lou
tsta
nd
ing
loan
sto
afi
rmp
rovid
edby
GII
PS
lead
arr
an
ger
sis
ab
ove
(bel
ow
)th
esa
mp
lem
edia
n.
Cri
sis
isan
ind
icato
rvari
ab
leeq
ual
toon
est
art
ing
in2009
for
Gre
ece
an
din
2010
for
all
oth
erco
untr
ies
(beg
inn
ing
of
the
sover
eign
deb
tcr
isis
)
an
dze
rob
efore
.T
he
sam
ple
con
sist
sof
all
firm
sin
the
inte
rsec
tion
of
Dea
lSca
nan
dA
mad
eus
that
are
loca
ted
inth
efo
llow
ing
cou
ntr
ies:
Gre
ece,
Italy
,Ir
elan
d,
Port
ugal,
Sp
ain
(GII
PS
cou
ntr
ies)
or
Ger
many,
Fra
nce
,U
.K.
(non
-GII
PS
cou
ntr
ies)
.
32
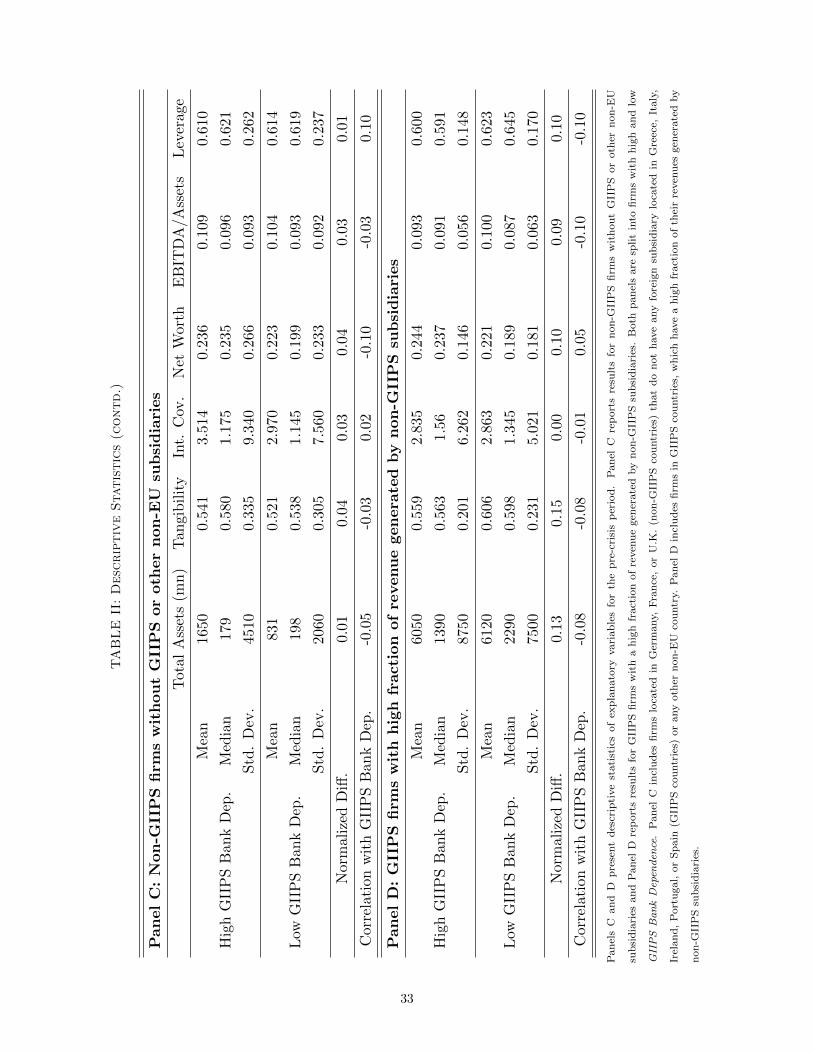
TABLE
II:Desc
riptiveStatistics(c
ontd.)
Pan
el
C:
Non
-GII
PS
firm
sw
ith
ou
tG
IIP
Sor
oth
er
non
-EU
sub
sid
iari
es
Tot
alA
sset
s(m
n)
Tan
gibilit
yIn
t.C
ov.
Net
Wor
thE
BIT
DA
/Ass
ets
Lev
erag
e
Mea
n16
50
0.5
41
3.5
14
0.2
360.
109
0.610
Hig
hG
IIP
SB
ank
Dep
.M
edia
n17
90.5
80
1.1
750.2
35
0.0
96
0.6
21
Std
.D
ev.
4510
0.335
9.340
0.2
66
0.0
930.2
62
Mea
n831
0.521
2.970
0.2
23
0.104
0.614
Low
GII
PS
Ban
kD
ep.
Med
ian
198
0.5
38
1.1
45
0.199
0.0
93
0.6
19
Std
.D
ev.
2060
0.305
7.560
0.2
33
0.0
920.2
37
Nor
mal
ized
Diff
.0.0
10.0
40.0
30.
04
0.03
0.01
Cor
rela
tion
wit
hG
IIP
SB
ank
Dep
.-0
.05
-0.0
30.
02
-0.1
0-0
.03
0.1
0
Pan
el
D:
GII
PS
firm
sw
ith
hig
hfr
acti
on
of
revenu
egen
era
ted
by
non
-GII
PS
sub
sid
iari
es
Mea
n60
50
0.5
59
2.8
35
0.2
440.
093
0.600
Hig
hG
IIP
SB
ank
Dep
.M
edia
n1390
0.5
63
1.56
0.2
37
0.0
91
0.5
91
Std
.D
ev.
8750
0.201
6.262
0.1
46
0.0
560.1
48
Mea
n61
20
0.6
06
2.8
63
0.2
210.
100
0.623
Low
GII
PS
Ban
kD
ep.
Med
ian
229
00.5
98
1.3
45
0.1
89
0.0
87
0.6
45
Std
.D
ev.
7500
0.231
5.021
0.1
81
0.0
630.1
70
Nor
mal
ized
Diff
.0.1
30.1
50.0
00.
10
0.09
0.10
Cor
rela
tion
wit
hG
IIP
SB
ank
Dep
.-0
.08
-0.0
8-0
.01
0.0
5-0
.10
-0.1
0
Pan
els
Can
dD
pre
sent
des
crip
tive
stati
stic
sof
exp
lan
ato
ryvari
ab
les
for
the
pre
-cri
sis
per
iod
.P
an
elC
rep
ort
sre
sult
sfo
rn
on
-GII
PS
firm
sw
ith
ou
tG
IIP
Sor
oth
ern
on
-EU
sub
sid
iari
esan
dP
an
elD
rep
ort
sre
sult
sfo
rG
IIP
Sfi
rms
wit
ha
hig
hfr
act
ion
of
reven
ue
gen
erate
dby
non
-GII
PS
sub
sid
iari
es.
Both
pan
els
are
split
into
firm
sw
ith
hig
han
dlo
w
GIIPS
BankDepen
den
ce.
Pan
elC
incl
ud
esfi
rms
loca
ted
inG
erm
any,
Fra
nce
,or
U.K
.(n
on
-GII
PS
cou
ntr
ies)
that
do
not
have
any
fore
ign
sub
sid
iary
loca
ted
inG
reec
e,It
aly
,
Irel
an
d,
Port
ugal,
or
Sp
ain
(GII
PS
cou
ntr
ies)
or
any
oth
ern
on
-EU
cou
ntr
y.P
an
elD
incl
ud
esfi
rms
inG
IIP
Sco
untr
ies,
wh
ich
have
ah
igh
fract
ion
of
thei
rre
ven
ues
gen
erate
dby
non
-GII
PS
sub
sid
iari
es.
33
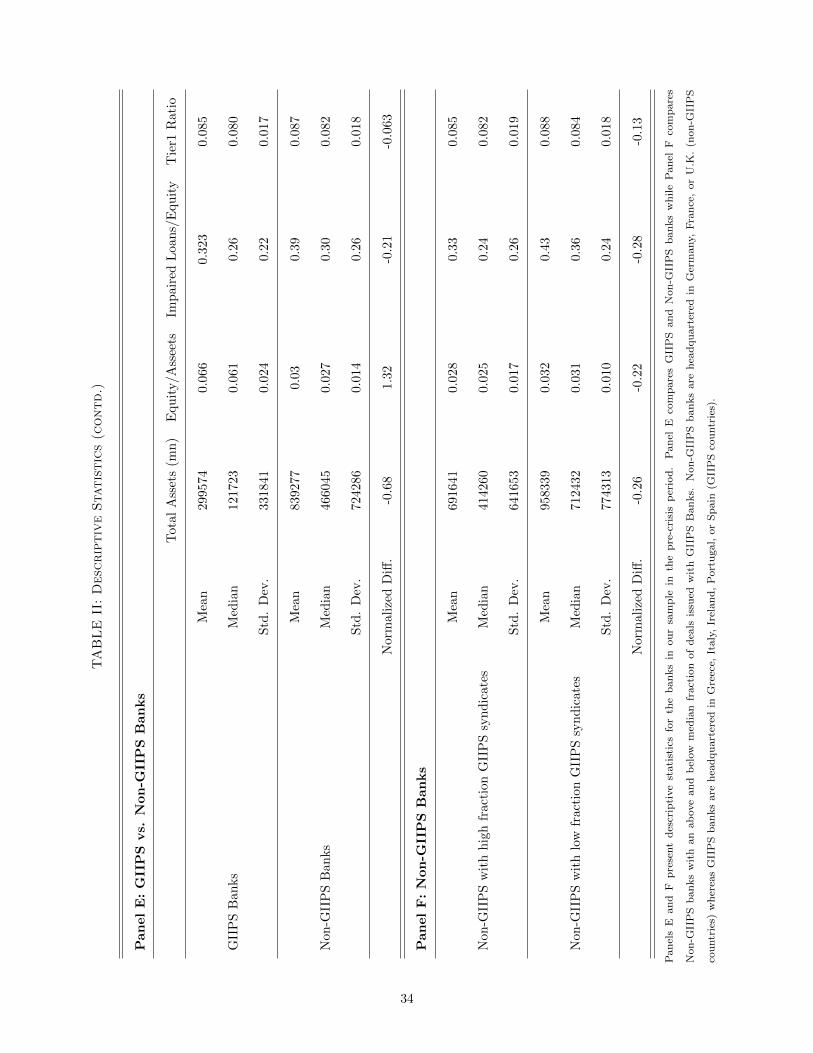
TABLE
II:Desc
riptiveStatistics(c
ontd.)
Pan
el
E:
GII
PS
vs.
Non
-GII
PS
Ban
ks
Tota
lA
sset
s(m
n)
Equit
y/A
ssee
tsIm
pair
edL
oans/
Equit
yT
ier1
Rati
o
Mea
n299574
0.0
66
0.3
23
0.0
85
GII
PS
Ban
ks
Med
ian
121723
0.0
61
0.2
60.0
80
Std
.D
ev.
331841
0.0
24
0.2
20.0
17
Mea
n839277
0.0
30.3
90.0
87
Non
-GII
PS
Ban
ks
Med
ian
466045
0.0
27
0.3
00.0
82
Std
.D
ev.
724286
0.0
14
0.2
60.0
18
Norm
ali
zed
Diff
.-0
.68
1.3
2-0
.21
-0.0
63
Pan
el
F:
Non
-GII
PS
Ban
ks
Mea
n691641
0.0
28
0.3
30.0
85
Non
-GII
PS
wit
hhig
hfr
acti
onG
IIP
Ssy
nd
icat
esM
edia
n414260
0.0
25
0.2
40.0
82
Std
.D
ev.
641653
0.0
17
0.2
60.0
19
Mea
n958339
0.0
32
0.4
30.0
88
Non
-GII
PS
wit
hlo
wfr
acti
onG
IIP
Ssy
ndic
ates
Med
ian
712432
0.0
31
0.3
60.0
84
Std
.D
ev.
774313
0.0
10
0.2
40.0
18
Norm
ali
zed
Diff
.-0
.26
-0.2
2-0
.28
-0.1
3
Pan
els
Ean
dF
pre
sent
des
crip
tive
stati
stic
sfo
rth
eb
an
ks
inou
rsa
mp
lein
the
pre
-cri
sis
per
iod
.P
an
elE
com
pare
sG
IIP
San
dN
on
-GII
PS
ban
ks
wh
ile
Pan
elF
com
pare
s
Non
-GII
PS
banks
wit
han
ab
ove
an
db
elow
med
ian
fract
ion
of
dea
lsis
sued
wit
hG
IIP
SB
an
ks.
Non
-GII
PS
ban
ks
are
hea
dqu
art
ered
inG
erm
any,
Fra
nce
,or
U.K
.(n
on
-GII
PS
cou
ntr
ies)
wh
erea
sG
IIP
Sb
an
ks
are
hea
dqu
art
ered
inG
reec
e,It
aly
,Ir
elan
d,
Port
ugal,
or
Sp
ain
(GII
PS
cou
ntr
ies)
.
34
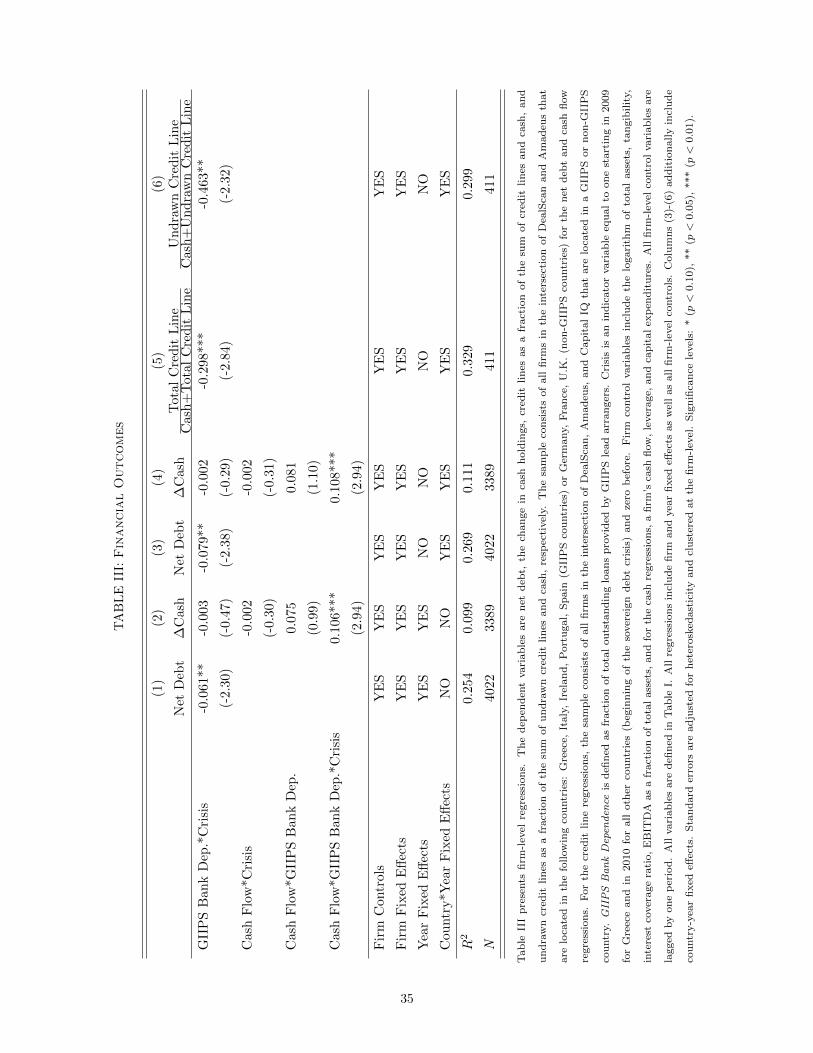
TA
BL
EII
I:FinancialOutcomes
(1)
(2)
(3)
(4)
(5)
(6)
Net
Deb
t∆
Cash
Net
Deb
t∆
Cash
Tota
lC
red
itL
ine
Cash
+T
ota
lC
red
itL
ine
Un
dra
wn
Cre
dit
Lin
eC
ash
+U
nd
raw
nC
red
itL
ine
GII
PS
Ban
kD
ep.*
Cri
sis
-0.0
61*
*-0
.003
-0.0
79**
-0.0
02
-0.2
98**
*-0
.463**
(-2.
30)
(-0.4
7)(-
2.3
8)
(-0.2
9)(-
2.8
4)
(-2.3
2)
Cas
hF
low
*Cri
sis
-0.0
02-0
.002
(-0.3
0)
(-0.
31)
Cash
Flo
w*G
IIP
SB
ank
Dep
.0.0
75
0.0
81
(0.9
9)
(1.1
0)
Cash
Flo
w*G
IIP
SB
ank
Dep
.*C
risi
s0.
106
***
0.108
***
(2.9
4)
(2.9
4)
Fir
mC
ontr
ols
YE
SY
ES
YE
SY
ES
YE
SY
ES
Fir
mF
ixed
Eff
ects
YE
SY
ES
YE
SY
ES
YE
SY
ES
Yea
rF
ixed
Eff
ects
YE
SY
ES
NO
NO
NO
NO
Cou
ntr
y*Y
ear
Fix
edE
ffec
tsN
ON
OY
ES
YE
SY
ES
YE
S
R2
0.25
40.0
99
0.2
69
0.1
11
0.3
29
0.2
99
N40
22
3389
402
2338
9411
411
Tab
leII
Ip
rese
nts
firm
-lev
elre
gre
ssio
ns.
Th
ed
epen
den
tvari
ab
les
are
net
deb
t,th
ech
an
ge
inca
shh
old
ings,
cred
itlin
esas
afr
act
ion
of
the
sum
of
cred
itlin
esan
dca
sh,
an
d
un
dra
wn
cred
itlin
esas
afr
act
ion
of
the
sum
of
un
dra
wn
cred
itlin
esan
dca
sh,
resp
ecti
vel
y.T
he
sam
ple
con
sist
sof
all
firm
sin
the
inte
rsec
tion
of
Dea
lSca
nan
dA
mad
eus
that
are
loca
ted
inth
efo
llow
ing
cou
ntr
ies:
Gre
ece,
Italy
,Ir
elan
d,
Port
ugal,
Sp
ain
(GII
PS
cou
ntr
ies)
or
Ger
many,
Fra
nce
,U
.K.
(non
-GII
PS
cou
ntr
ies)
for
the
net
deb
tan
dca
shfl
ow
regre
ssio
ns.
For
the
cred
itlin
ere
gre
ssio
ns,
the
sam
ple
con
sist
sof
all
firm
sin
the
inte
rsec
tion
of
Dea
lSca
n,
Am
ad
eus,
an
dC
ap
ital
IQth
at
are
loca
ted
ina
GII
PS
or
non
-GII
PS
cou
ntr
y.GIIPSBankDepen
den
ceis
defi
ned
as
fract
ion
of
tota
lou
tsta
nd
ing
loan
sp
rovid
edby
GII
PS
lead
arr
an
ger
s.C
risi
sis
an
ind
icato
rvari
ab
leeq
ual
toon
est
art
ing
in2009
for
Gre
ece
an
din
2010
for
all
oth
erco
untr
ies
(beg
inn
ing
of
the
sover
eign
deb
tcr
isis
)an
dze
rob
efore
.F
irm
contr
ol
vari
ab
les
incl
ud
eth
elo
gari
thm
of
tota
lass
ets,
tan
gib
ilit
y,
inte
rest
cover
age
rati
o,
EB
ITD
Aas
afr
act
ion
of
tota
lass
ets,
an
dfo
rth
eca
shre
gre
ssio
ns,
afi
rm’s
cash
flow
,le
ver
age,
an
dca
pit
al
exp
end
itu
res.
All
firm
-lev
elco
ntr
ol
vari
ab
les
are
lagged
by
on
ep
erio
d.
All
vari
ab
les
are
defi
ned
inT
ab
leI.
All
regre
ssio
ns
incl
ud
efi
rman
dyea
rfi
xed
effec
tsas
wel
las
all
firm
-lev
elco
ntr
ols
.C
olu
mn
s(3
)-(6
)ad
dit
ion
ally
incl
ud
e
cou
ntr
y-y
ear
fixed
effec
ts.
Sta
nd
ard
erro
rsare
ad
just
edfo
rh
eter
osk
edast
icit
yan
dcl
ust
ered
at
the
firm
-lev
el.
Sig
nifi
can
cele
vel
s:*
(p<
0.1
0),
**
(p<
0.0
5),
***
(p<
0.0
1).
35

TA
BL
EIV
:Realoutcomes
(1)
(2)
(3)
(4)
(5)
(6)
Em
pG
row
thC
AP
XSale
sG
row
thE
mp
Gro
wth
CA
PX
Sale
sG
row
th
GII
PS
Ban
kD
ep.
0.04
1-0
.047
-0.0
14
0.0
30
-0.0
63
0.0
05
(0.7
3)
(-0.3
2)
(-0.1
3)
(0.4
9)
(-0.4
0)
(0.0
5)
GII
PS
Ban
kD
ep.*
Cri
sis
-0.0
62*
**-0
.101***
-0.0
59**
-0.0
59***
-0.1
17***
-0.0
86**
(-3.
99)
(-3.7
4)
(-2.5
2)
(-2.8
3)
(-3.0
3)
(-2.4
8)
Fir
mC
ontr
ols
YE
SY
ES
YE
SY
ES
YE
SY
ES
Fir
mF
ixed
Eff
ects
YE
SY
ES
YE
SY
ES
YE
SY
ES
Yea
rF
ixed
Eff
ects
YE
SY
ES
YE
SN
ON
ON
O
Cou
ntr
y-Y
ear
Fix
edE
ffec
tsN
ON
ON
OY
ES
YE
SY
ES
R2
0.081
0.3
02
0.1
73
0.1
00
0.3
10
0.1
96
N34
01
3912
3816
3401
3912
3816
Tab
leIV
pre
sents
firm
-lev
elre
gre
ssio
ns.
Th
ed
epen
den
tvari
ab
les
are
emp
loym
ent
gro
wth
,in
ves
tmen
ts,
an
dsa
les
gro
wth
,re
spec
tivel
y.T
he
sam
ple
con
sist
sof
all
firm
sin
the
inte
rsec
tion
of
Dea
lSca
nan
dA
mad
eus
that
are
loca
ted
inth
efo
llow
ing
cou
ntr
ies:
Gre
ece,
Italy
,Ir
elan
d,
Port
ugal,
Sp
ain
(GII
PS
cou
ntr
ies)
or
Ger
many,
Fra
nce
,U
.K.
(non
-GII
PS
cou
ntr
ies)
.GIIPSBankDepen
den
ceis
defi
ned
as
fract
ion
of
tota
lou
tsta
nd
ing
loan
sp
rovid
edby
GII
PS
lead
arr
an
ger
s.C
risi
sis
an
ind
icato
rvari
ab
leeq
ual
toon
est
art
ing
in2009
for
Gre
ece
an
din
2010
for
all
oth
erco
untr
ies
(beg
inn
ing
of
the
sover
eign
deb
tcr
isis
)an
dze
rob
efore
.F
irm
contr
ol
vari
ab
les
incl
ud
eth
elo
gari
thm
of
tota
lass
ets,
lever
age,
net
wort
h,
tan
gib
ilit
y,in
tere
stco
ver
age
rati
o,
an
dE
BIT
DA
as
afr
act
ion
of
tota
lass
ets.
All
firm
-lev
elco
ntr
ol
vari
ab
les
are
lagged
by
on
ep
erio
d.
All
vari
ab
les
are
defi
ned
inT
ab
leI.
All
regre
ssio
ns
incl
ud
efi
rman
dyea
rfi
xed
effec
ts,
as
wel
las
all
firm
-lev
elco
ntr
ols
.C
olu
mn
s(4
)-(6
)ad
dit
ion
ally
incl
ud
eco
untr
y*yea
rfi
xed
effec
ts.
Sta
nd
ard
erro
rsare
ad
just
ed
for
het
erosk
edast
icit
yan
dcl
ust
ered
at
the
firm
-lev
el.
Sig
nifi
can
cele
vel
s:*
(p<
0.1
0),
**
(p<
0.0
5),
***
(p<
0.0
1).
36

TABLE V: Subsidiaries
Panel A: Non-GIIPS firms without GIIPS or other non-EU subsidiaries
(1) (2) (3) (4) (5)
Emp Growth CAPX Sales Growth Net Debt ∆ Cash
GIIPS Bank Dep.*Crisis -0.557*** -0.611*** -0.862*** -0.564* 0.029**(-7.77) (-4.43) (-4.70) (-1.71) (2.12)
Cash Flow*GIIPS Bank Dep.*Crisis 0.330***(8.85)
R2 0.118 0.330 0.192 0.251 0.133N 809 1024 999 1090 868
Panel B: Non-GIIPS firms with GIIPS subsidiaries
GIIPS Bank Dep.*Crisis -0.126** -0.002 -0.094 -0.018 -0.094**(-2.10) (-0.02) (-0.88) (-0.29) (-2.06)
Cash Flow*GIIPS Bank Dep.*Crisis 0.880**(2.21)
R2 0.084 0.369 0.191 0.297 0.124N 1118 1238 1238 1252 1115
T -Test for Diff. Interaction 2.75 3.02 2.07 1.84 1.50
Panel C: GIIPS firms with high fraction of revenue generated by non-GIIPS subsidiaries
GIIPS Bank Dep.*Crisis -0.135** -0.319*** -0.154** -0.170** -0.008(-2.30) (-3.12) (-2.59) (-2.44) (-0.54)
Cash Flow*GIIPS Bank Dep.*Crisis 0.152**(2.51)
R2 0.204 0.291 0.357 0.328 0.273N 304 343 342 350 310
Panel D: GIIPS firms with low fraction of revenue generated by non-GIIPS subsidiaries
GIIPS Bank Dep.*Crisis -0.042 -0.075 -0.047 -0.061* -0.007(-1.46) (-1.48) (-0.94) (-1.66) (-0.61)
Cash Flow*GIIPS Bank Dep.*Crisis 0.155**(2.48)
R2 0.172 0.374 0.263 0.394 0.154N 727 820 766 836 677
T-Test for Diff. Interaction 1.52 2.07 0.66 1.26 0.24
Table V presents firm-level regressions. The dependent variables are employment growth, investments, sales growth, net debt,
and change in cash holdings, respectively. The sample consists of firms in the intersection of DealScan and Amadeus. Panel
A includes firms located in Germany, France, or U.K. (non-GIIPS countries) that do not have any foreign subsidiary located
in Greece, Italy, Ireland, Portugal, or Spain (GIIPS countries) or any other non-EU country. Panel B includes firms located in
a non-GIIPS country that have at least one foreign GIIPS subsidiary. Panel C includes firms in GIIPS countries that have a
high fraction fraction of their revenues generated by non-GIIPS subsidiaries. Panel D includes firms located in a GIIPS country
that have a low fraction of their revenue generated by non-GIIPS subsidiaries. GIIPS Bank Dependence is defined as fraction
of total outstanding loans provided by GIIPS lead arrangers. Crisis is an indicator variable equal to one starting in 2009 for
Greece and in 2010 for all other countries (beginning of the sovereign debt crisis) and zero before. Firm control variables include
the logarithm of total assets, leverage, net worth, tangibility, interest coverage ratio, and EBITDA as a fraction of total assets.
All firm-level control variables are lagged by one period. All variables are defined in Table I. All regressions include firm, and
country-year fixed effects, as well as all firm-level controls. Standard errors are adjusted for heteroskedasticity and clustered at
the firm-level. Significance levels: * (p < 0.10), ** (p < 0.05), *** (p < 0.01).
37

TABLE VI: Business Region Exposure
(1) (2) (3) (4) (5)
Emp Growth CAPX Sales Growth Net Debt ∆ Cash
GIIPS Bank Dep.*Crisis -0.066*** -0.132*** -0.101*** -0.109*** -0.004
(-2.84) (-3.14) (-2.65) (-2.94) (-0.49)
Cash Flow*Crisis -0.006
(-0.89)
Cash Flow*GIIPS Bank Dep.*Crisis 0.117***
(3.06)
R2 0.104 0.319 0.205 0.278 0.112
N 2958 3425 3345 3528 2970
Firm Fixed Effects YES YES YES YES YES
Business Region-Year Fixed Effects YES YES YES YES YES
Firm-Level Controls YES YES YES YES YES
Table VI presents firm-level regressions. The dependent variables are employment growth, investments, sales growth, net debt,
and change in cash holdings, respectively. The sample consists of all firms in the intersection of DealScan and Amadeus that
are incorporated in the following countries: Greece, Italy, Ireland, Portugal, Spain (GIIPS countries) or Germany, France,
U.K. (non-GIIPS countries). GIIPS Bank Dependence is defined as fraction of total outstanding loans provided by GIIPS lead
arrangers. Crisis is an indicator variable equal to one starting in 2009 for Greece and in 2010 for all other countries (beginning
of the sovereign debt crisis) and zero before. Firm control variables include the logarithm of total assets, leverage, net worth,
tangibility, interest coverage ratio, and EBITDA as a fraction of total assets. All firm-level control variables are lagged by one
period. All variables are defined in Table I. All regressions include firm and business region-year fixed effects, as well as all
firm-level controls. Business region fixed effects are defined via data on subsidiary revenues. GIIPS firms and non-GIIPS firms
with GIIPS subsidiaries are classified as having exposure to the GIIPS countries. Non-GIIPS firms and GIIPS firms with a
high fraction of revenues generated by non-GIIPS subsidiaries are classified as being exposed to non-GIIPS countries. Standard
errors are adjusted for heteroskedasticity and clustered at the firm-level. Significance levels: * (p < 0.10), ** (p < 0.05), ***
(p < 0.01).
38

TABLE VII: Listed vs. Non-Listed Firms
Panel A: Listed Firms
(1) (2) (3) (4) (5)
Emp Growth CAPX Sales Growth Net Debt ∆ Cash
GIIPS Bank Dep.*Crisis -0.037 -0.071 -0.091 -0.034 -0.001
(-0.88) (-1.01) (-1.38) (-0.89) (-0.03)
Cash Flow*GIIPS Bank Dep.*Crisis 0.012
(0.27)
R2 0.338 0.492 0.401 0.480 0.288
N 1530 1576 1560 1597 1442
Panel B: Non-Listed Firms
GIIPS Bank Dep.*Crisis -0.059** -0.135*** -0.082* -0.068* 0.001
(-2.27) (-2.66) (-1.72) (-1.86) (0.12)
Cash Flow*GIIPS Bank Dep.*Crisis 0.122**
(2.39)
R2 0.241 0.433 0.316 0.392 0.233
N 1871 2336 2256 2425 1947
Panel C: Firms with constant GIIPS Bank Dependence
GIIPS Bank Dep.*Crisis -0.056** -0.120*** -0.098** -0.086*** 0.000
(-2.35) (-2.62) (-2.52) (-2.72) (0.05)
Cash Flow*GIIPS Bank Dep.*Crisis 0.098**
(2.46)
R2 0.111 0.320 0.196 0.281 0.114
N 2310 2740 2672 2827 2414
Panel D: Switcher vs. Non-Switcher
Listed Non-Listed Cum.
Switcher 61.17% 38.83% 100%
Non-Switcher 29.29% 70.71% 100%
Table VII presents firm-level regressions. The dependent variables are employment growth, investments, sales growth, net
debt, and change in cash holdings, respectively. The sample consists of all firms in the intersection of DealScan and Amadeus
and located in the following countries: Greece, Italy, Ireland, Portugal, Spain (GIIPS countries) or Germany, France, U.K.
(non-GIIPS countries). Panel A includes firms that are publicly listed while Panel B firms that are not publicly listed. Panel
C includes firms that have a constant GIIPS Bank Dependence throughout the sample period. Finally, Panel D reports the
fraction of firms with constant GIIPS Bank Dependence (non-switcher) in the listed and non-listed subsamples. GIIPS Bank
Dependence is defined as fraction of total outstanding loans provided by GIIPS lead arrangers. Crisis is an indicator variable
equal to one starting in 2009 for Greece and in 2010 for all other countries (beginning of the sovereign debt crisis) and zero
before. Firm control variables include the logarithm of total assets, leverage, net worth, tangibility, interest coverage ratio, and
EBITDA as a fraction of total assets. All firm-level control variables are lagged by one period. All variables are defined in Table
I. All regressions include firm and country-year fixed effects, as well as all firm-level controls. Standard errors are adjusted for
heteroskedasticity and clustered at the firm-level. Significance levels: * (p < 0.10), ** (p < 0.05), *** (p < 0.01).
39
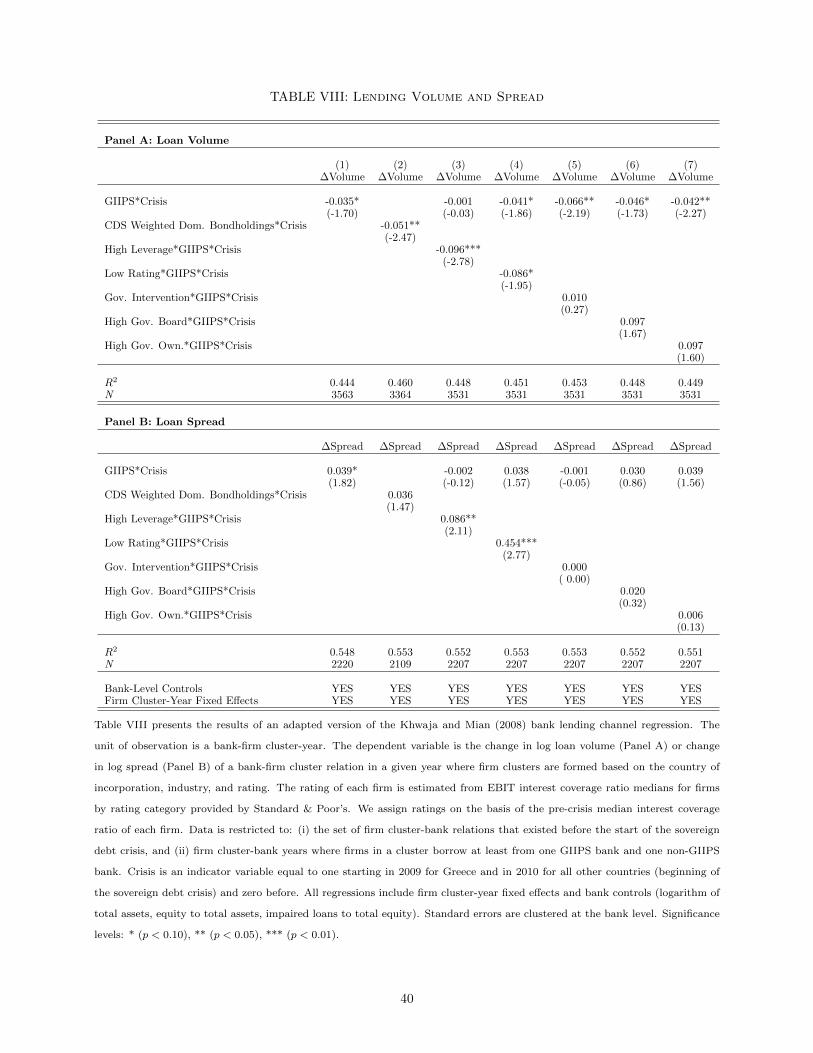
TABLE VIII: Lending Volume and Spread
Panel A: Loan Volume
(1) (2) (3) (4) (5) (6) (7)∆Volume ∆Volume ∆Volume ∆Volume ∆Volume ∆Volume ∆Volume
GIIPS*Crisis -0.035* -0.001 -0.041* -0.066** -0.046* -0.042**(-1.70) (-0.03) (-1.86) (-2.19) (-1.73) (-2.27)
CDS Weighted Dom. Bondholdings*Crisis -0.051**(-2.47)
High Leverage*GIIPS*Crisis -0.096***(-2.78)
Low Rating*GIIPS*Crisis -0.086*(-1.95)
Gov. Intervention*GIIPS*Crisis 0.010(0.27)
High Gov. Board*GIIPS*Crisis 0.097(1.67)
High Gov. Own.*GIIPS*Crisis 0.097(1.60)
R2 0.444 0.460 0.448 0.451 0.453 0.448 0.449N 3563 3364 3531 3531 3531 3531 3531
Panel B: Loan Spread
∆Spread ∆Spread ∆Spread ∆Spread ∆Spread ∆Spread ∆Spread
GIIPS*Crisis 0.039* -0.002 0.038 -0.001 0.030 0.039(1.82) (-0.12) (1.57) (-0.05) (0.86) (1.56)
CDS Weighted Dom. Bondholdings*Crisis 0.036(1.47)
High Leverage*GIIPS*Crisis 0.086**(2.11)
Low Rating*GIIPS*Crisis 0.454***(2.77)
Gov. Intervention*GIIPS*Crisis 0.000( 0.00)
High Gov. Board*GIIPS*Crisis 0.020(0.32)
High Gov. Own.*GIIPS*Crisis 0.006(0.13)
R2 0.548 0.553 0.552 0.553 0.553 0.552 0.551N 2220 2109 2207 2207 2207 2207 2207
Bank-Level Controls YES YES YES YES YES YES YESFirm Cluster-Year Fixed Effects YES YES YES YES YES YES YES
Table VIII presents the results of an adapted version of the Khwaja and Mian (2008) bank lending channel regression. The
unit of observation is a bank-firm cluster-year. The dependent variable is the change in log loan volume (Panel A) or change
in log spread (Panel B) of a bank-firm cluster relation in a given year where firm clusters are formed based on the country of
incorporation, industry, and rating. The rating of each firm is estimated from EBIT interest coverage ratio medians for firms
by rating category provided by Standard & Poor’s. We assign ratings on the basis of the pre-crisis median interest coverage
ratio of each firm. Data is restricted to: (i) the set of firm cluster-bank relations that existed before the start of the sovereign
debt crisis, and (ii) firm cluster-bank years where firms in a cluster borrow at least from one GIIPS bank and one non-GIIPS
bank. Crisis is an indicator variable equal to one starting in 2009 for Greece and in 2010 for all other countries (beginning of
the sovereign debt crisis) and zero before. All regressions include firm cluster-year fixed effects and bank controls (logarithm of
total assets, equity to total assets, impaired loans to total equity). Standard errors are clustered at the bank level. Significance
levels: * (p < 0.10), ** (p < 0.05), *** (p < 0.01).
40

TA
BL
EIX
:PassiveChannel:Hit
onbalancesh
eet
Pan
el
A:
Ris
kof
GII
PS
sovere
ign
bon
dh
old
ings
(1)
(2)
(3)
(4)
(5)
Em
pG
row
thC
AP
XS
ale
sG
row
thN
etD
ebt
∆C
ash
CD
SW
eigh
ted
GII
PS
Sov
.B
ond
hol
din
gs*C
risi
s-0
.063***
-0.0
97**
-0.0
95***
-0.0
71**
-0.0
08
(-2.7
0)
(-2.4
0)
(-2.8
1)
(-2.3
5)
(-0.8
3)
CD
SW
eigh
ted
GII
PS
Sov
.B
ond
hol
din
gs*C
risi
s*C
ash
Flo
w0.1
37**
(2.5
0)
R2
0.1
00
0.3
11
0.2
10
0.2
63
0.1
24
N3206
3683
3593
3790
3187
Pan
el
B:
Ris
kof
dom
est
icso
vere
ign
bon
dh
old
ings
Em
pG
row
thC
AP
XS
ale
sG
row
thN
etD
ebt
∆C
ash
CD
SW
eigh
ted
Dom
esti
cS
ov.
Bon
dh
old
ings
*Cri
sis
-0.0
60***
-0.0
85**
-0.0
99***
-0.0
67**
-0.0
08
(-2.6
0)
(-2.1
0)
(-2.8
4)
(-2.2
3)
(-0.8
0)
CD
SW
eigh
ted
Dom
esti
cS
ov.
Bon
dh
old
ings
*Cash
Flo
w*C
risi
s0.1
33**
(2.4
9)
R2
0.1
00
0.3
11
0.2
10
0.2
62
0.1
24
N3206
3683
3593
3790
3187
Tab
leIX
pre
sents
firm
-lev
elre
gre
ssio
ns.
Th
ed
epen
den
tvari
ab
les
are
emp
loym
ent
gro
wth
,in
ves
tmen
ts,
sale
sgro
wth
,n
etd
ebt,
an
dth
ech
an
ge
inca
shh
old
ings,
resp
ecti
vel
y.T
he
sam
ple
con
sist
sof
all
firm
sin
the
inte
rsec
tion
of
Dea
lSca
nan
dA
mad
eus
that
are
loca
ted
inth
efo
llow
ing
cou
ntr
ies:
Gre
ece,
Italy
,Ir
elan
d,
Port
ugal,
Sp
ain
(GII
PS
cou
ntr
ies)
or
Ger
many,
Fra
nce
,U
.K.
(non
-GII
PS
cou
ntr
ies)
,w
hic
hh
ave
ale
nd
ing
rela
tion
ship
toa
ban
kth
at
was
part
of
the
EB
Ast
ress
test
s.CDS
Weigh
tedGIIPS
Sov.
Bondholdings
(Pan
elA
)an
dCDS
Weigh
tedDomesticSov.
Bondholdings
(Pan
elB
)m
easu
reth
efr
act
ion
of
aff
ecte
dle
ad
arr
an
ger
sb
ase
don
the
risk
-ad
just
edG
IIP
San
dd
om
esti
cso
ver
eign
bon
dh
old
ings
of
ban
ks
ina
firm
’ssy
nd
icate
,re
spec
tivel
y.Crisis
isan
ind
icato
rvari
ab
leeq
ual
toon
est
art
ing
in2009
for
Gre
ece
an
din
2010
for
all
oth
erco
untr
ies
(beg
inn
ing
of
the
sover
eign
deb
tcr
isis
)an
dze
rob
efore
.F
irm
contr
ol
vari
ab
les
incl
ud
eth
elo
gari
thm
of
tota
lass
ets,
lever
age,
net
wort
h,
tan
gib
ilit
y,in
tere
stco
ver
age
rati
o,
an
dE
BIT
DA
as
a
fract
ion
of
tota
lass
ets.
All
firm
-lev
elco
ntr
ol
vari
ab
les
are
lagged
by
on
ep
erio
d.
All
vari
ab
les
are
defi
ned
inT
ab
leI.
All
regre
ssio
ns
incl
ud
efi
rman
dco
untr
y-y
ear
fixed
effec
ts,
as
wel
las
all
firm
-lev
elco
ntr
ols
.S
tan
dard
erro
rsare
ad
just
edfo
rh
eter
osk
edast
icit
yan
dcl
ust
ered
at
the
firm
-lev
el.
Sig
nifi
can
cele
vel
s:*
(p<
0.1
0),
**
(p<
0.0
5),
***
(p<
0.0
1).
41
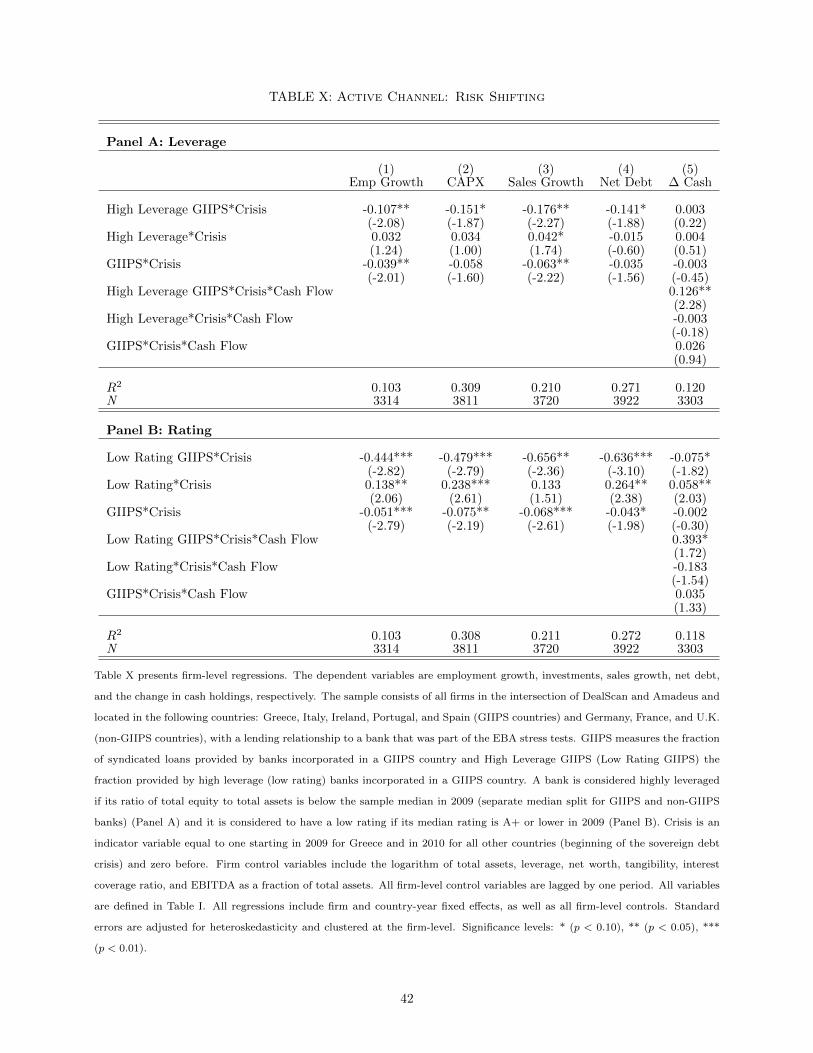
TABLE X: Active Channel: Risk Shifting
Panel A: Leverage
(1) (2) (3) (4) (5)Emp Growth CAPX Sales Growth Net Debt ∆ Cash
High Leverage GIIPS*Crisis -0.107** -0.151* -0.176** -0.141* 0.003(-2.08) (-1.87) (-2.27) (-1.88) (0.22)
High Leverage*Crisis 0.032 0.034 0.042* -0.015 0.004(1.24) (1.00) (1.74) (-0.60) (0.51)
GIIPS*Crisis -0.039** -0.058 -0.063** -0.035 -0.003(-2.01) (-1.60) (-2.22) (-1.56) (-0.45)
High Leverage GIIPS*Crisis*Cash Flow 0.126**(2.28)
High Leverage*Crisis*Cash Flow -0.003(-0.18)
GIIPS*Crisis*Cash Flow 0.026(0.94)
R2 0.103 0.309 0.210 0.271 0.120N 3314 3811 3720 3922 3303
Panel B: Rating
Low Rating GIIPS*Crisis -0.444*** -0.479*** -0.656** -0.636*** -0.075*(-2.82) (-2.79) (-2.36) (-3.10) (-1.82)
Low Rating*Crisis 0.138** 0.238*** 0.133 0.264** 0.058**(2.06) (2.61) (1.51) (2.38) (2.03)
GIIPS*Crisis -0.051*** -0.075** -0.068*** -0.043* -0.002(-2.79) (-2.19) (-2.61) (-1.98) (-0.30)
Low Rating GIIPS*Crisis*Cash Flow 0.393*(1.72)
Low Rating*Crisis*Cash Flow -0.183(-1.54)
GIIPS*Crisis*Cash Flow 0.035(1.33)
R2 0.103 0.308 0.211 0.272 0.118N 3314 3811 3720 3922 3303
Table X presents firm-level regressions. The dependent variables are employment growth, investments, sales growth, net debt,
and the change in cash holdings, respectively. The sample consists of all firms in the intersection of DealScan and Amadeus and
located in the following countries: Greece, Italy, Ireland, Portugal, and Spain (GIIPS countries) and Germany, France, and U.K.
(non-GIIPS countries), with a lending relationship to a bank that was part of the EBA stress tests. GIIPS measures the fraction
of syndicated loans provided by banks incorporated in a GIIPS country and High Leverage GIIPS (Low Rating GIIPS) the
fraction provided by high leverage (low rating) banks incorporated in a GIIPS country. A bank is considered highly leveraged
if its ratio of total equity to total assets is below the sample median in 2009 (separate median split for GIIPS and non-GIIPS
banks) (Panel A) and it is considered to have a low rating if its median rating is A+ or lower in 2009 (Panel B). Crisis is an
indicator variable equal to one starting in 2009 for Greece and in 2010 for all other countries (beginning of the sovereign debt
crisis) and zero before. Firm control variables include the logarithm of total assets, leverage, net worth, tangibility, interest
coverage ratio, and EBITDA as a fraction of total assets. All firm-level control variables are lagged by one period. All variables
are defined in Table I. All regressions include firm and country-year fixed effects, as well as all firm-level controls. Standard
errors are adjusted for heteroskedasticity and clustered at the firm-level. Significance levels: * (p < 0.10), ** (p < 0.05), ***
(p < 0.01).
42
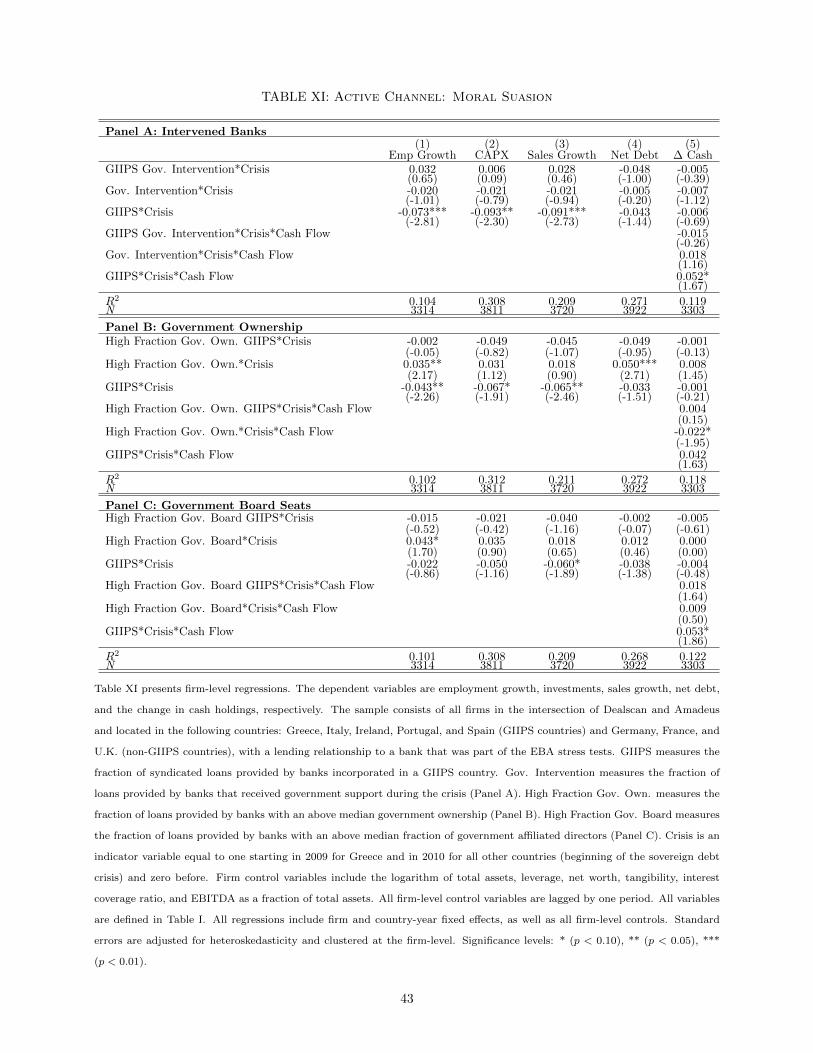
TABLE XI: Active Channel: Moral Suasion
Panel A: Intervened Banks(1) (2) (3) (4) (5)
Emp Growth CAPX Sales Growth Net Debt ∆ CashGIIPS Gov. Intervention*Crisis 0.032 0.006 0.028 -0.048 -0.005
(0.65) (0.09) (0.46) (-1.00) (-0.39)Gov. Intervention*Crisis -0.020 -0.021 -0.021 -0.005 -0.007
(-1.01) (-0.79) (-0.94) (-0.20) (-1.12)GIIPS*Crisis -0.073*** -0.093** -0.091*** -0.043 -0.006
(-2.81) (-2.30) (-2.73) (-1.44) (-0.69)GIIPS Gov. Intervention*Crisis*Cash Flow -0.015
(-0.26)Gov. Intervention*Crisis*Cash Flow 0.018
(1.16)GIIPS*Crisis*Cash Flow 0.052*
(1.67)
R2 0.104 0.308 0.209 0.271 0.119N 3314 3811 3720 3922 3303
Panel B: Government OwnershipHigh Fraction Gov. Own. GIIPS*Crisis -0.002 -0.049 -0.045 -0.049 -0.001
(-0.05) (-0.82) (-1.07) (-0.95) (-0.13)High Fraction Gov. Own.*Crisis 0.035** 0.031 0.018 0.050*** 0.008
(2.17) (1.12) (0.90) (2.71) (1.45)GIIPS*Crisis -0.043** -0.067* -0.065** -0.033 -0.001
(-2.26) (-1.91) (-2.46) (-1.51) (-0.21)High Fraction Gov. Own. GIIPS*Crisis*Cash Flow 0.004
(0.15)High Fraction Gov. Own.*Crisis*Cash Flow -0.022*
(-1.95)GIIPS*Crisis*Cash Flow 0.042
(1.63)
R2 0.102 0.312 0.211 0.272 0.118N 3314 3811 3720 3922 3303
Panel C: Government Board SeatsHigh Fraction Gov. Board GIIPS*Crisis -0.015 -0.021 -0.040 -0.002 -0.005
(-0.52) (-0.42) (-1.16) (-0.07) (-0.61)High Fraction Gov. Board*Crisis 0.043* 0.035 0.018 0.012 0.000
(1.70) (0.90) (0.65) (0.46) (0.00)GIIPS*Crisis -0.022 -0.050 -0.060* -0.038 -0.004
(-0.86) (-1.16) (-1.89) (-1.38) (-0.48)High Fraction Gov. Board GIIPS*Crisis*Cash Flow 0.018
(1.64)High Fraction Gov. Board*Crisis*Cash Flow 0.009
(0.50)GIIPS*Crisis*Cash Flow 0.053*
(1.86)
R2 0.101 0.308 0.209 0.268 0.122N 3314 3811 3720 3922 3303
Table XI presents firm-level regressions. The dependent variables are employment growth, investments, sales growth, net debt,
and the change in cash holdings, respectively. The sample consists of all firms in the intersection of Dealscan and Amadeus
and located in the following countries: Greece, Italy, Ireland, Portugal, and Spain (GIIPS countries) and Germany, France, and
U.K. (non-GIIPS countries), with a lending relationship to a bank that was part of the EBA stress tests. GIIPS measures the
fraction of syndicated loans provided by banks incorporated in a GIIPS country. Gov. Intervention measures the fraction of
loans provided by banks that received government support during the crisis (Panel A). High Fraction Gov. Own. measures the
fraction of loans provided by banks with an above median government ownership (Panel B). High Fraction Gov. Board measures
the fraction of loans provided by banks with an above median fraction of government affiliated directors (Panel C). Crisis is an
indicator variable equal to one starting in 2009 for Greece and in 2010 for all other countries (beginning of the sovereign debt
crisis) and zero before. Firm control variables include the logarithm of total assets, leverage, net worth, tangibility, interest
coverage ratio, and EBITDA as a fraction of total assets. All firm-level control variables are lagged by one period. All variables
are defined in Table I. All regressions include firm and country-year fixed effects, as well as all firm-level controls. Standard
errors are adjusted for heteroskedasticity and clustered at the firm-level. Significance levels: * (p < 0.10), ** (p < 0.05), ***
(p < 0.01).
43
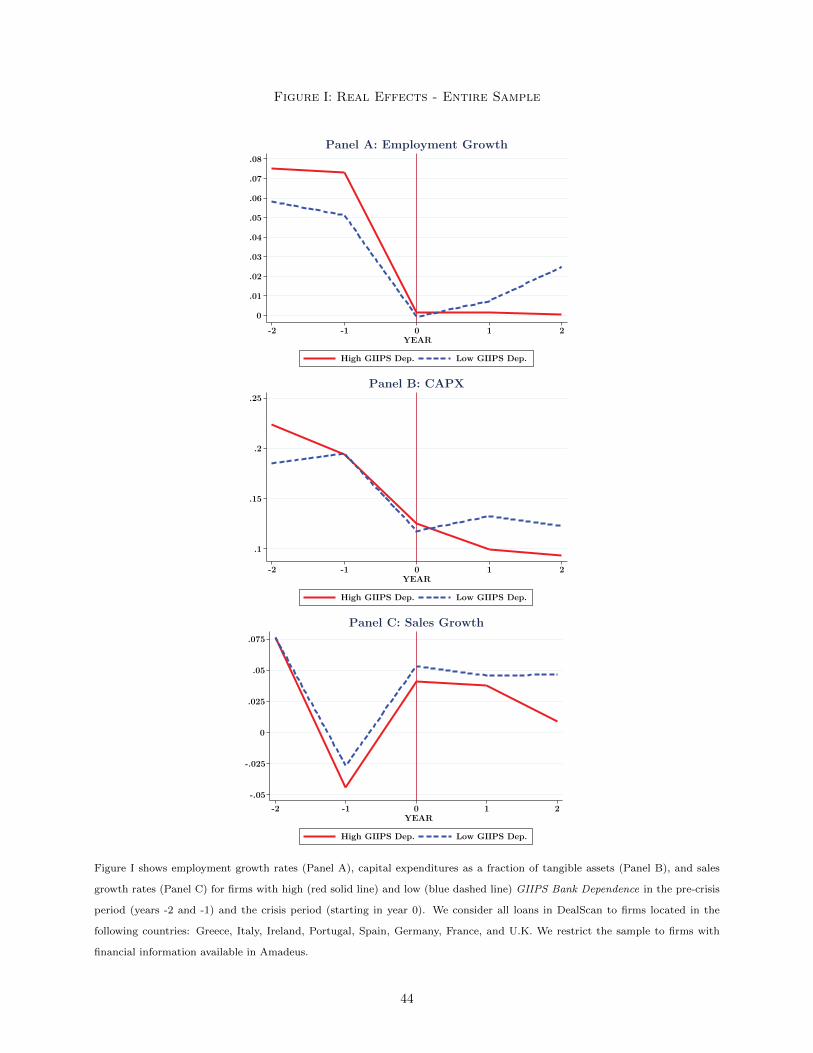
Figure I: Real Effects - Entire Sample
0
.01
.02
.03
.04
.05
.06
.07
.08
-2 -1 0 1 2YEAR
High GIIPS Dep. Low GIIPS Dep.
Panel A: Employment Growth
.1
.15
.2
.25
-2 -1 0 1 2YEAR
High GIIPS Dep. Low GIIPS Dep.
Panel B: CAPX
-.05
-.025
0
.025
.05
.075
-2 -1 0 1 2YEAR
High GIIPS Dep. Low GIIPS Dep.
Panel C: Sales Growth
Figure I shows employment growth rates (Panel A), capital expenditures as a fraction of tangible assets (Panel B), and sales
growth rates (Panel C) for firms with high (red solid line) and low (blue dashed line) GIIPS Bank Dependence in the pre-crisis
period (years -2 and -1) and the crisis period (starting in year 0). We consider all loans in DealScan to firms located in the
following countries: Greece, Italy, Ireland, Portugal, Spain, Germany, France, and U.K. We restrict the sample to firms with
financial information available in Amadeus.
44

Figure II: Liquidity Management - Entire Sample
.5
.55
.6
.65
.7
.75
-2 -1 0 1 2YEAR
High GIIPS Dep. Low GIIPS Dep.
Panel A: Total Credit Line/(Total Credit Line+Cash)
.4
.45
.5
.55
.6
.65
-2 -1 0 1 2YEAR
High GIIPS Dep. Low GIIPS Dep.
Panel B: Undrawn Credit Line/(Undrawn Credit Line+Cash)
Figure II shows firms’ total outstanding credit lines as a fraction of their credit lines plus cash holdings (Panel A) and firms’
undrawn credit lines as a fraction of their undrawn credit lines plus cash holdings (Panel B) for firms with high (red solid line)
and low (blue dashed line) GIIPS Bank Dependence in the pre-crisis period (years -2 and -1) and the crisis period (starting
in year 0). We consider all loans to firms located in the following countries: Greece, Italy, Ireland, Portugal, Spain, Germany,
France, and U.K. We restrict the sample to firms in the intersection of DealScan, Amadeus, and Capital IQ.
45
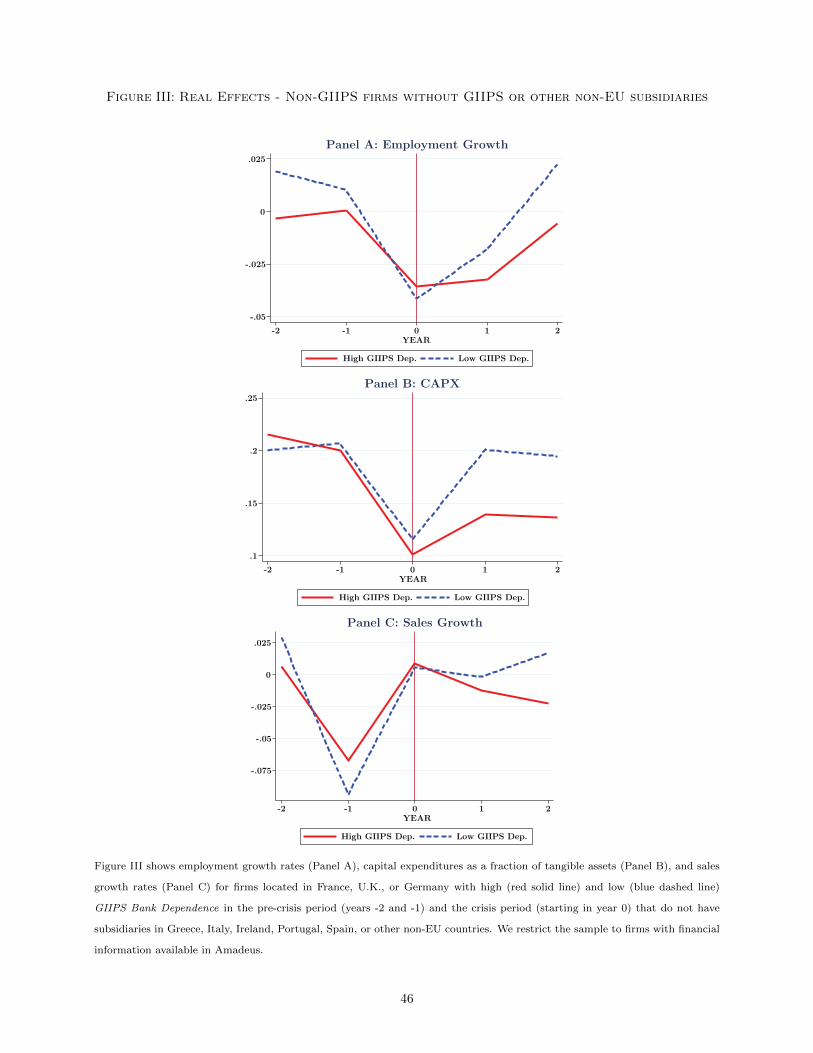
Figure III: Real Effects - Non-GIIPS firms without GIIPS or other non-EU subsidiaries
-.05
-.025
0
.025
-2 -1 0 1 2YEAR
High GIIPS Dep. Low GIIPS Dep.
Panel A: Employment Growth
.1
.15
.2
.25
-2 -1 0 1 2YEAR
High GIIPS Dep. Low GIIPS Dep.
Panel B: CAPX
-.075
-.05
-.025
0
.025
-2 -1 0 1 2YEAR
High GIIPS Dep. Low GIIPS Dep.
Panel C: Sales Growth
Figure III shows employment growth rates (Panel A), capital expenditures as a fraction of tangible assets (Panel B), and sales
growth rates (Panel C) for firms located in France, U.K., or Germany with high (red solid line) and low (blue dashed line)
GIIPS Bank Dependence in the pre-crisis period (years -2 and -1) and the crisis period (starting in year 0) that do not have
subsidiaries in Greece, Italy, Ireland, Portugal, Spain, or other non-EU countries. We restrict the sample to firms with financial
information available in Amadeus.
46
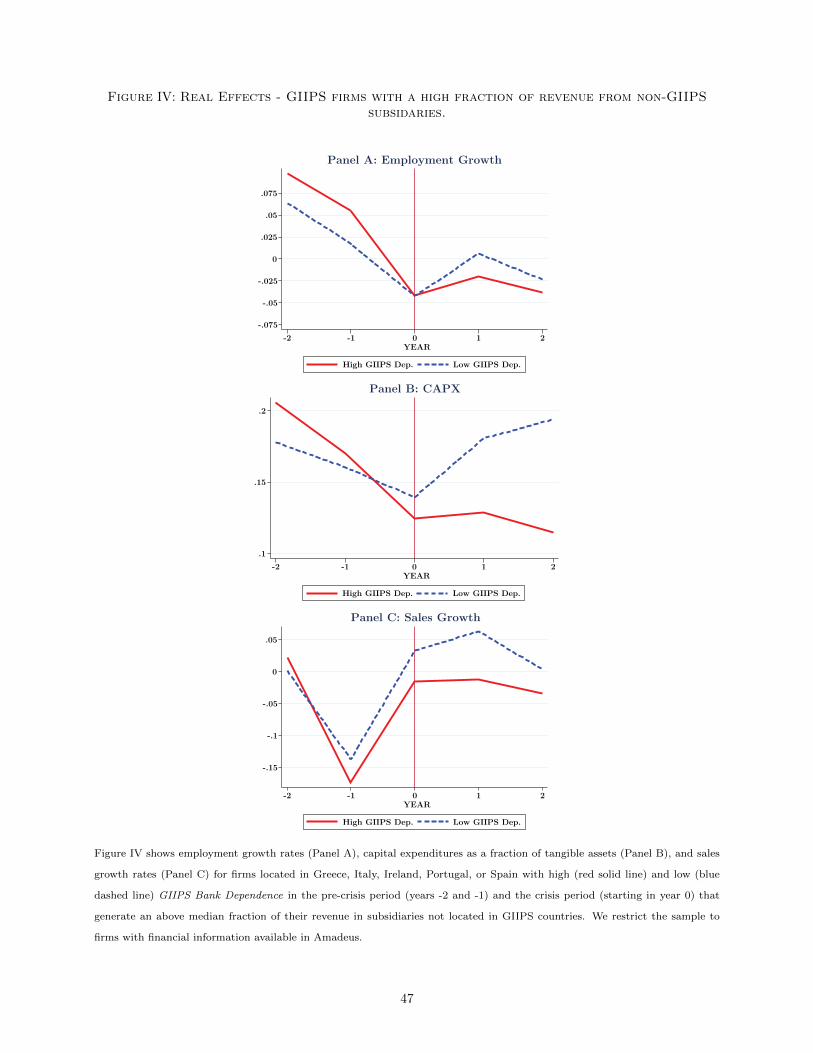
Figure IV: Real Effects - GIIPS firms with a high fraction of revenue from non-GIIPSsubsidaries.
-.075
-.05
-.025
0
.025
.05
.075
-2 -1 0 1 2YEAR
High GIIPS Dep. Low GIIPS Dep.
Panel A: Employment Growth
.1
.15
.2
-2 -1 0 1 2YEAR
High GIIPS Dep. Low GIIPS Dep.
Panel B: CAPX
-.15
-.1
-.05
0
.05
-2 -1 0 1 2YEAR
High GIIPS Dep. Low GIIPS Dep.
Panel C: Sales Growth
Figure IV shows employment growth rates (Panel A), capital expenditures as a fraction of tangible assets (Panel B), and sales
growth rates (Panel C) for firms located in Greece, Italy, Ireland, Portugal, or Spain with high (red solid line) and low (blue
dashed line) GIIPS Bank Dependence in the pre-crisis period (years -2 and -1) and the crisis period (starting in year 0) that
generate an above median fraction of their revenue in subsidiaries not located in GIIPS countries. We restrict the sample to
firms with financial information available in Amadeus.
47
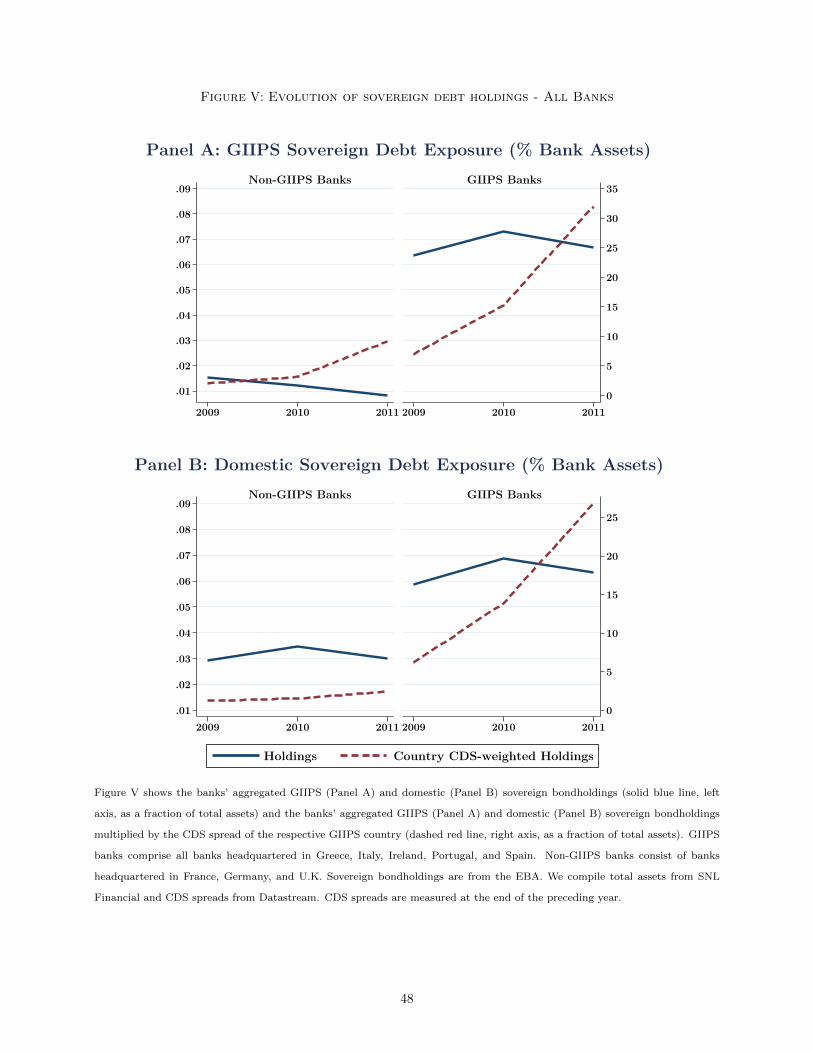
Figure V: Evolution of sovereign debt holdings - All Banks
0
5
10
15
20
25
30
35
.01
.02
.03
.04
.05
.06
.07
.08
.09
2009 2010 2011 2009 2010 2011
Non-GIIPS Banks GIIPS Banks
Panel A: GIIPS Sovereign Debt Exposure (% Bank Assets)
0
5
10
15
20
25
.01
.02
.03
.04
.05
.06
.07
.08
.09
2009 2010 2011 2009 2010 2011
Non-GIIPS Banks GIIPS Banks
Holdings Country CDS-weighted Holdings
Panel B: Domestic Sovereign Debt Exposure (% Bank Assets)
Figure V shows the banks’ aggregated GIIPS (Panel A) and domestic (Panel B) sovereign bondholdings (solid blue line, left
axis, as a fraction of total assets) and the banks’ aggregated GIIPS (Panel A) and domestic (Panel B) sovereign bondholdings
multiplied by the CDS spread of the respective GIIPS country (dashed red line, right axis, as a fraction of total assets). GIIPS
banks comprise all banks headquartered in Greece, Italy, Ireland, Portugal, and Spain. Non-GIIPS banks consist of banks
headquartered in France, Germany, and U.K. Sovereign bondholdings are from the EBA. We compile total assets from SNL
Financial and CDS spreads from Datastream. CDS spreads are measured at the end of the preceding year.
48
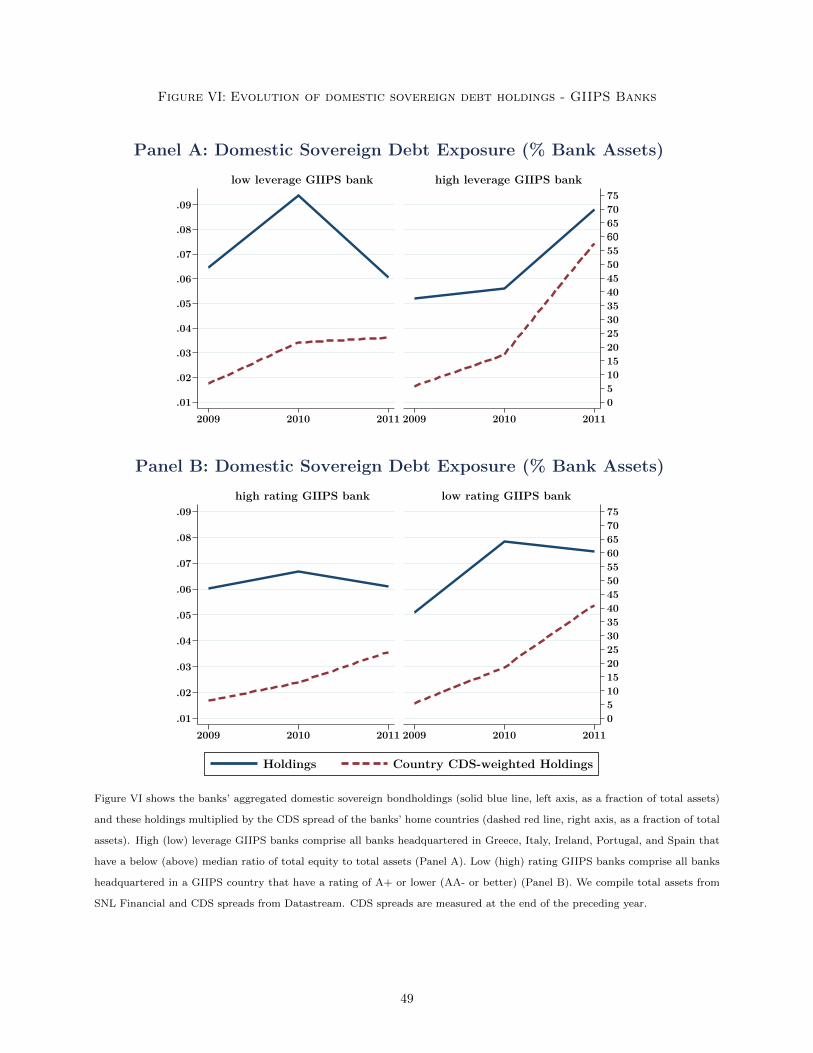
Figure VI: Evolution of domestic sovereign debt holdings - GIIPS Banks
051015202530354045505560657075
.01
.02
.03
.04
.05
.06
.07
.08
.09
2009 2010 2011 2009 2010 2011
low leverage GIIPS bank high leverage GIIPS bank
Panel A: Domestic Sovereign Debt Exposure (% Bank Assets)
051015202530354045505560657075
.01
.02
.03
.04
.05
.06
.07
.08
.09
2009 2010 2011 2009 2010 2011
high rating GIIPS bank low rating GIIPS bank
Holdings Country CDS-weighted Holdings
Panel B: Domestic Sovereign Debt Exposure (% Bank Assets)
Figure VI shows the banks’ aggregated domestic sovereign bondholdings (solid blue line, left axis, as a fraction of total assets)
and these holdings multiplied by the CDS spread of the banks’ home countries (dashed red line, right axis, as a fraction of total
assets). High (low) leverage GIIPS banks comprise all banks headquartered in Greece, Italy, Ireland, Portugal, and Spain that
have a below (above) median ratio of total equity to total assets (Panel A). Low (high) rating GIIPS banks comprise all banks
headquartered in a GIIPS country that have a rating of A+ or lower (AA- or better) (Panel B). We compile total assets from
SNL Financial and CDS spreads from Datastream. CDS spreads are measured at the end of the preceding year.
49