ready reckoner - post budget 2020revenue ready reckoner income earners by income tax and usc rates...
TRANSCRIPT

Ready Reckoner - Post Budget 2020
This Version: October 2019
Ready Reckoners are provided for the following taxes and duties:
Pages 2-11
Deposit Interest Retention Tax (DIRT) Page 12
Life Assurance Exit Tax (LAET) Page 13
Capital Gains Tax (CGT) Page 14
Capital Acquisition Tax (CAT) Pages 15-18
Stamp Duty Page 19
Excise Pages 20-25
Value Added Tax (VAT) Pages 26
Local Property Tax (LPT) Page 27
Please note that the costings provided in this Ready Reckoner are estimates and should be treated as such.
Unless otherwise indicated, costings assume no behavioural change.
In the case of large relative changes to tax rates or allowances, the cost or yield may not be directly in line with estimates shown.
Every reasonable effort has been made to ensure that the information provided is as accurate and clear as possible.
Revenue's Statistics webpage: http://www.revenue.ie/en/corporate/information-about-revenue/statistics/index.aspx
Email: [email protected]
Income Tax & Universal Social Charge
1
Revenue Ready Reckoner
Income Tax & Universal Social Charge
The Income Tax & Universal Social Charge (USC) Ready Reckoner covers the following:
Page 3
Page 4
Page 5
Cost of increasing Income Tax credits Page 6
Cost of widening of Income Tax standard rate bands Page 7
Cost of increasing USC rate bands Page 8
Cost of increasing Income Tax exemption limits Page 9
Cost of Indexation Page 10
Changes to Income Tax relief on pensions Page 11
These following costs / yields are based on 2020 estimates from the Revenue tax forecasting model using latest actual data for the year
2017, adjusted as necessary for income, self-employment and employment trends in the interim.
Increases and decreases to Income Tax and USC rates
Income earners by Income Tax and USC rates in 2020
Income earners by gross income range in 2020
2
Revenue Ready Reckoner
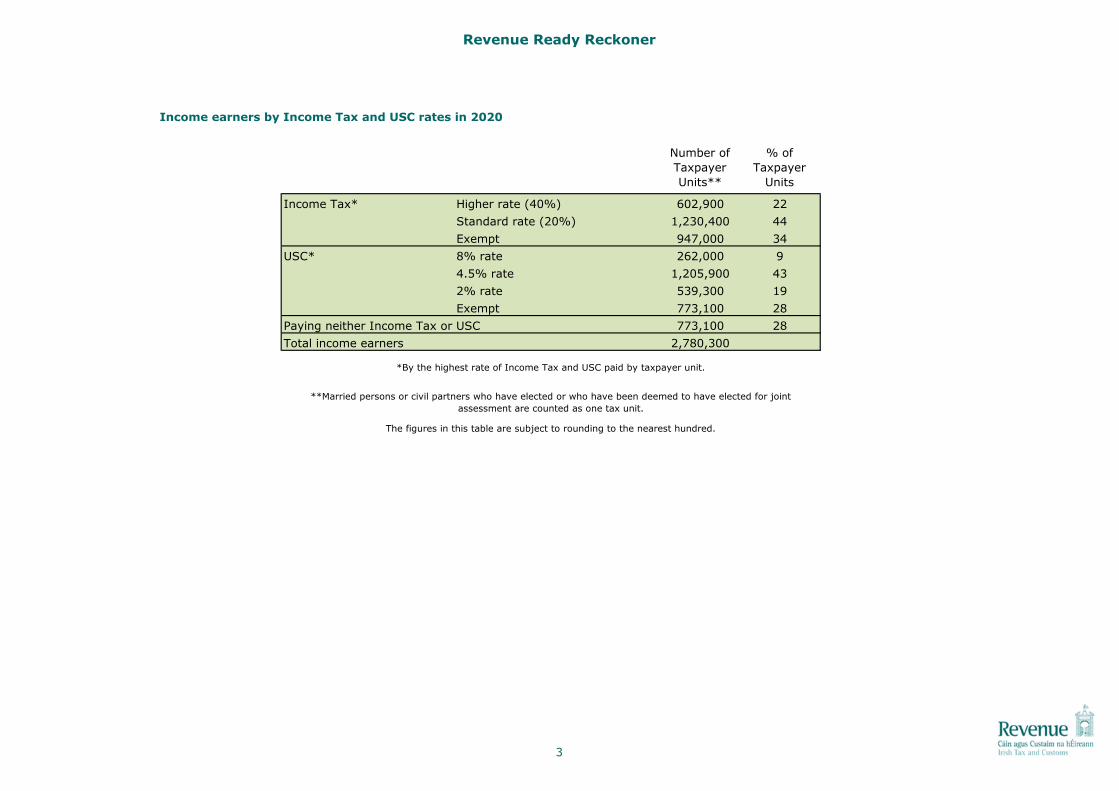
Income earners by Income Tax and USC rates in 2020
Income Tax* Higher rate (40%) 602,900 22
Standard rate (20%) 1,230,400 44
Exempt 947,000 34
USC* 8% rate 262,000 9
4.5% rate 1,205,900 43
2% rate 539,300 19
Exempt 773,100 28
Paying neither Income Tax or USC 773,100 28
Total income earners 2,780,300
*By the highest rate of Income Tax and USC paid by taxpayer unit.
The figures in this table are subject to rounding to the nearest hundred.
Number of
Taxpayer
Units**
**Married persons or civil partners who have elected or who have been deemed to have elected for joint
assessment are counted as one tax unit.
% of
Taxpayer
Units
3
Revenue Ready Reckoner
€ Million € Million
Income Tax/USC
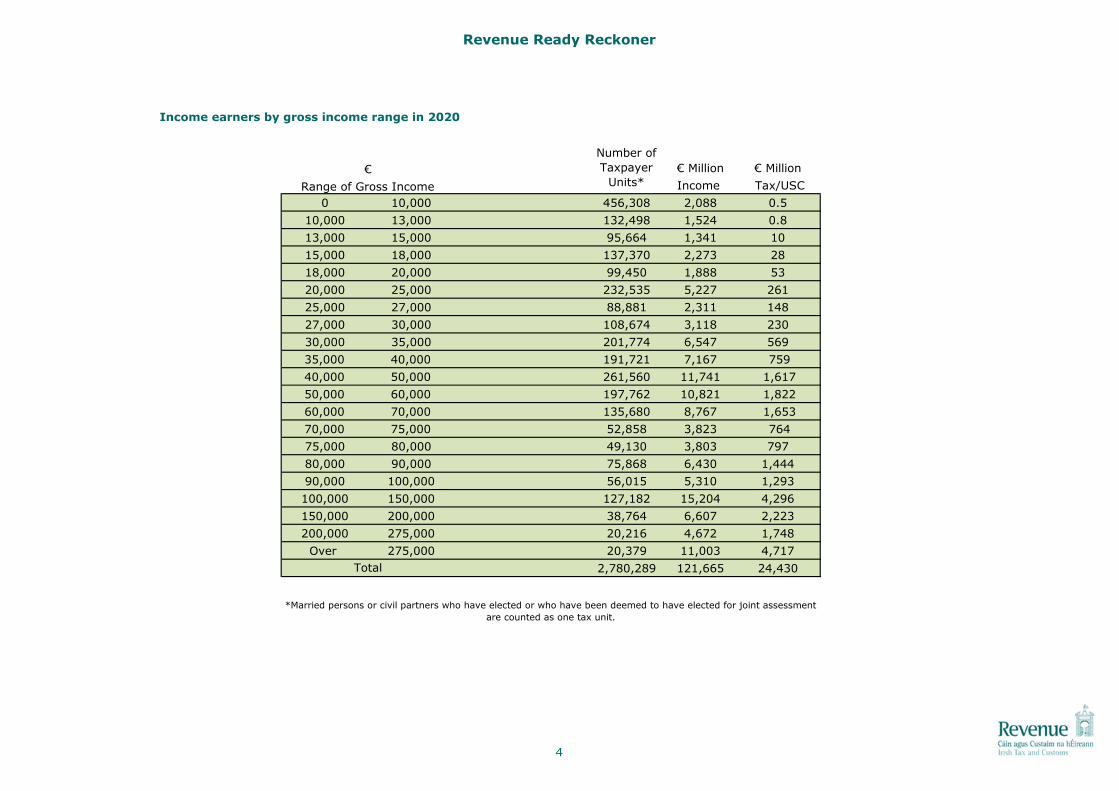
0 10,000 456,308 2,088 0.5
10,000 13,000 132,498 1,524 0.8
13,000 15,000 95,664 1,341 10
15,000 18,000 137,370 2,273 28
18,000 20,000 99,450 1,888 53
20,000 25,000 232,535 5,227 261
25,000 27,000 88,881 2,311 148
27,000 30,000 108,674 3,118 230
30,000 35,000 201,774 6,547 569
35,000 40,000 191,721 7,167 759
40,000 50,000 261,560 11,741 1,617
50,000 60,000 197,762 10,821 1,822
60,000 70,000 135,680 8,767 1,653
70,000 75,000 52,858 3,823 764
75,000 80,000 49,130 3,803 797
80,000 90,000 75,868 6,430 1,444
90,000 100,000 56,015 5,310 1,293
100,000 150,000 127,182 15,204 4,296
150,000 200,000 38,764 6,607 2,223
200,000 275,000 20,216 4,672 1,748
Over 275,000 20,379 11,003 4,717
2,780,289 121,665 24,430
Number of
Taxpayer
Units*€
Total
Income earners by gross income range in 2020
*Married persons or civil partners who have elected or who have been deemed to have elected for joint assessment
are counted as one tax unit.
Range of Gross Income
4
Revenue Ready Reckoner
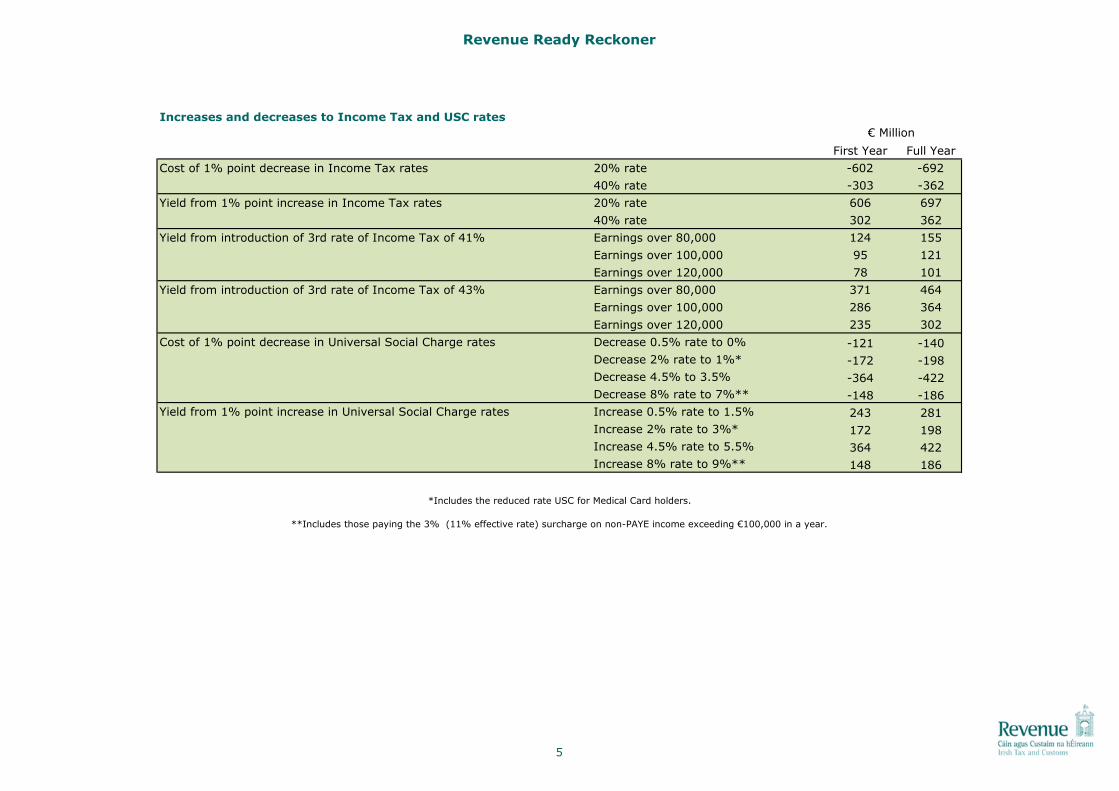
Increases and decreases to Income Tax and USC rates
First Year Full Year
Cost of 1% point decrease in Income Tax rates 20% rate -602 -692
40% rate -303 -362
Yield from 1% point increase in Income Tax rates 20% rate 606 697
40% rate 302 362
Yield from introduction of 3rd rate of Income Tax of 41% Earnings over 80,000 124 155
Earnings over 100,000 95 121
Earnings over 120,000 78 101
Yield from introduction of 3rd rate of Income Tax of 43% Earnings over 80,000 371 464
Earnings over 100,000 286 364
Earnings over 120,000 235 302
Cost of 1% point decrease in Universal Social Charge rates Decrease 0.5% rate to 0% -121 -140
Decrease 2% rate to 1%* -172 -198
Decrease 4.5% to 3.5% -364 -422
Decrease 8% rate to 7%** -148 -186
Yield from 1% point increase in Universal Social Charge rates Increase 0.5% rate to 1.5% 243 281
Increase 2% rate to 3%* 172 198
Increase 4.5% rate to 5.5% 364 422
Increase 8% rate to 9%** 148 186
*Includes the reduced rate USC for Medical Card holders.
**Includes those paying the 3% (11% effective rate) surcharge on non-PAYE income exceeding €100,000 in a year.
€ Million
5
Revenue Ready Reckoner
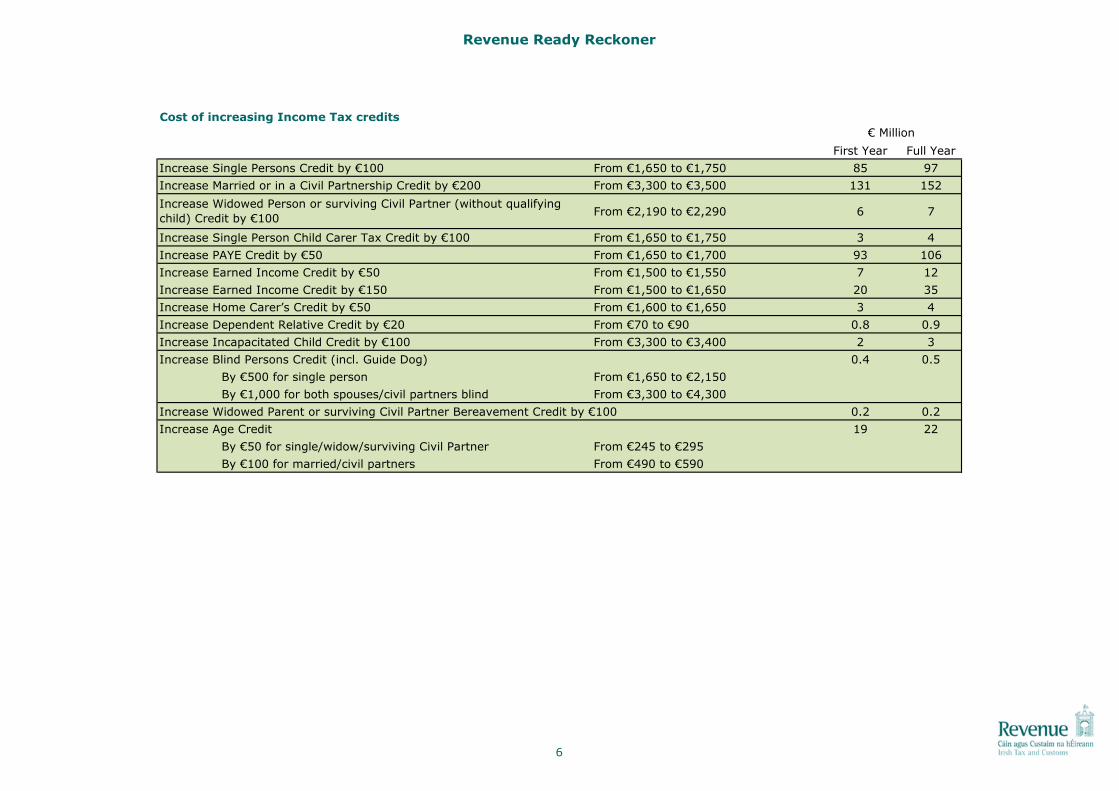
Cost of increasing Income Tax credits
First Year Full Year
Increase Single Persons Credit by €100 From €1,650 to €1,750 85 97
Increase Married or in a Civil Partnership Credit by €200 From €3,300 to €3,500 131 152
From €2,190 to €2,290 6 7
Increase Single Person Child Carer Tax Credit by €100 From €1,650 to €1,750 3 4
Increase PAYE Credit by €50 From €1,650 to €1,700 93 106
Increase Earned Income Credit by €50 From €1,500 to €1,550 7 12
Increase Earned Income Credit by €150 From €1,500 to €1,650 20 35
Increase Home Carer’s Credit by €50 From €1,600 to €1,650 3 4
Increase Dependent Relative Credit by €20 From €70 to €90 0.8 0.9
Increase Incapacitated Child Credit by €100 From €3,300 to €3,400 2 3
Increase Blind Persons Credit (incl. Guide Dog) 0.4 0.5
By €500 for single person From €1,650 to €2,150
By €1,000 for both spouses/civil partners blind From €3,300 to €4,300
Increase Widowed Parent or surviving Civil Partner Bereavement Credit by €100 0.2 0.2
Increase Age Credit 19 22
By €50 for single/widow/surviving Civil Partner From €245 to €295
By €100 for married/civil partners From €490 to €590
Increase Widowed Person or surviving Civil Partner (without qualifying
child) Credit by €100
€ Million
6
Revenue Ready Reckoner
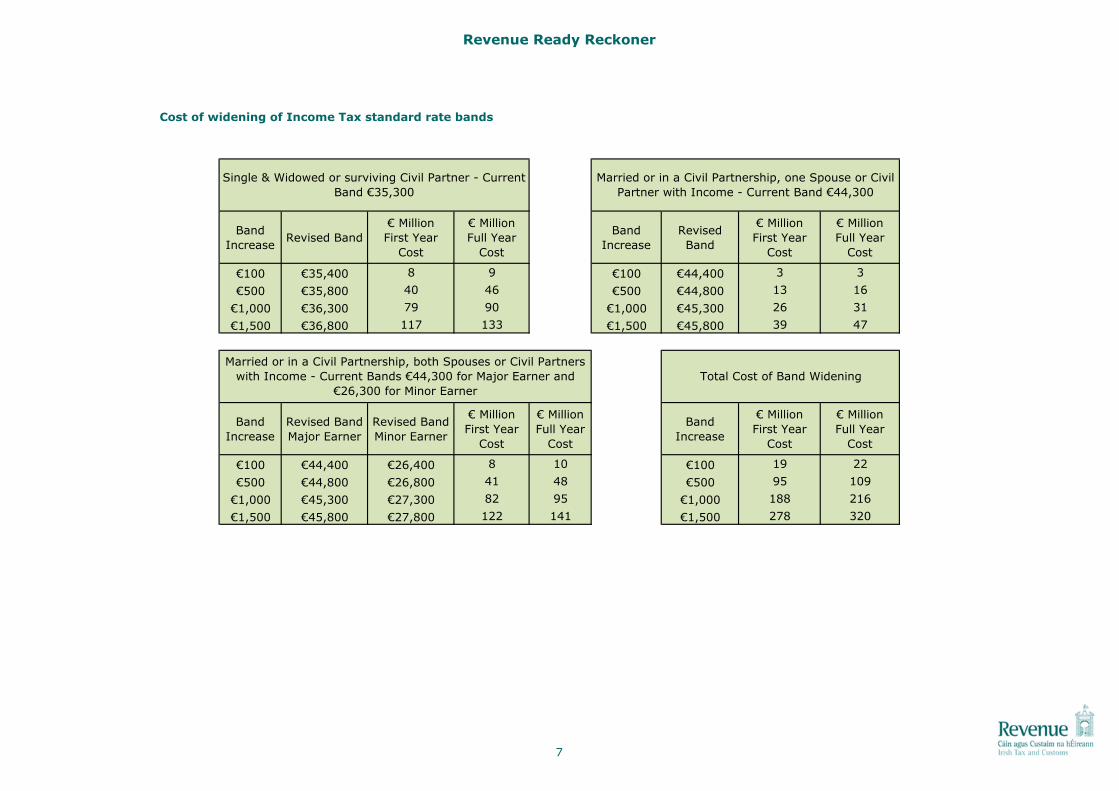
Cost of widening of Income Tax standard rate bands
Band
IncreaseRevised Band
€ Million
First Year
Cost
€ Million
Full Year
Cost
Band
Increase
Revised
Band
€ Million
First Year
Cost
€ Million
Full Year
Cost
€100 €35,400 8 9 €100 €44,400 3 3
€500 €35,800 40 46 €500 €44,800 13 16
€1,000 €36,300 79 90 €1,000 €45,300 26 31
€1,500 €36,800 117 133 €1,500 €45,800 39 47
Band
Increase
Revised Band
Major Earner
Revised Band
Minor Earner
€ Million
First Year
Cost
€ Million
Full Year
Cost
Band
Increase
€ Million
First Year
Cost
€ Million
Full Year
Cost
€100 €44,400 €26,400 8 10 €100 19 22
€500 €44,800 €26,800 41 48 €500 95 109
€1,000 €45,300 €27,300 82 95 €1,000 188 216
€1,500 €45,800 €27,800 122 141 €1,500 278 320
Single & Widowed or surviving Civil Partner - Current
Band €35,300
Total Cost of Band Widening
Married or in a Civil Partnership, both Spouses or Civil Partners
with Income - Current Bands €44,300 for Major Earner and
€26,300 for Minor Earner
Married or in a Civil Partnership, one Spouse or Civil
Partner with Income - Current Band €44,300
7

Revenue Ready Reckoner
Cost of increasing USC rate bands
First Year Full Year
Income under €13,000 is exempt Increase by €100 to €13,100 0.4 0.5
Increase by €500 to €13,500 2 3
Increase by €1,000 to €14,000 5 5
Increase by €1,500 to €14,500 7 8
First €12,012 is charged at 0.5% * Increase by €100 to €12,112 4 4
Increase by €500 to €12,512 16 18
Increase by €1,000 to €13,012 30 35
Increase by €1,500 to €13,512 46 53
From €12,013 to €19,874 is charged at 2% * Increase by €100 to €12,113 and €19,974 7 8
Increase by €500 to €12,513 and €20,374 34 39
Increase by €1,000 to €13,013 and €20,874 67 77
Increase by €1,500 to €13,513 and €21,374 100 116
From €19,874 to €70,044 is charged at 4.5% * Increase by €100 to €19,974 and €70,144 5 6
Increase by €500 to €20,374 and €70,544 23 27
Increase by €1,000 to €20,874 and €71,044 45 53
Increase by €1,500 to €21,374 and €71,544 68 79
Above €70,045 is charged at 8%* Increase by €500 to €70,544 5 5
Increase by €1,000 to €71,044 9 10
Increase by €2,000 to €72,044 17 20
Increase by €5,000 to €75,044 41 49
*The €13,000 exemption threshold remains unchanged for the USC rate band increases.
€ Million
8
Revenue Ready Reckoner
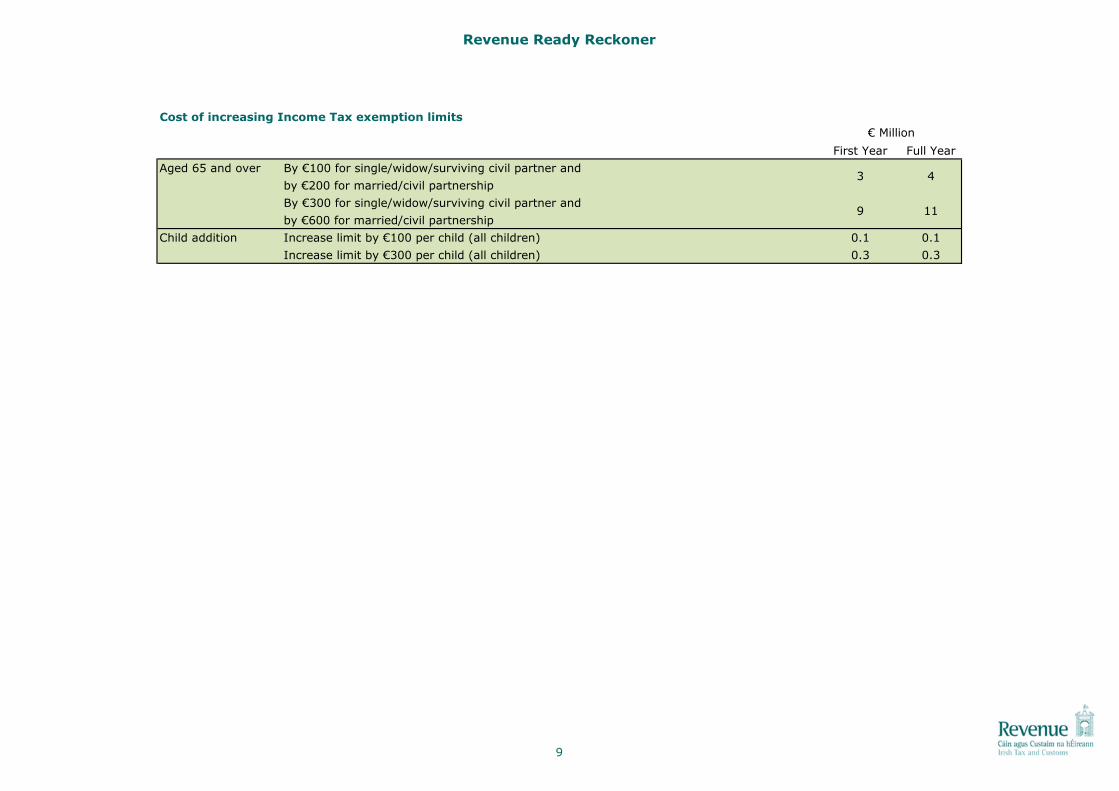
Cost of increasing Income Tax exemption limits
First Year Full Year
Aged 65 and over By €100 for single/widow/surviving civil partner and
by €200 for married/civil partnership
By €300 for single/widow/surviving civil partner and
by €600 for married/civil partnership
Child addition Increase limit by €100 per child (all children) 0.1 0.1
Increase limit by €300 per child (all children) 0.3 0.3
€ Million
4
9 11
3
9
Revenue Ready Reckoner
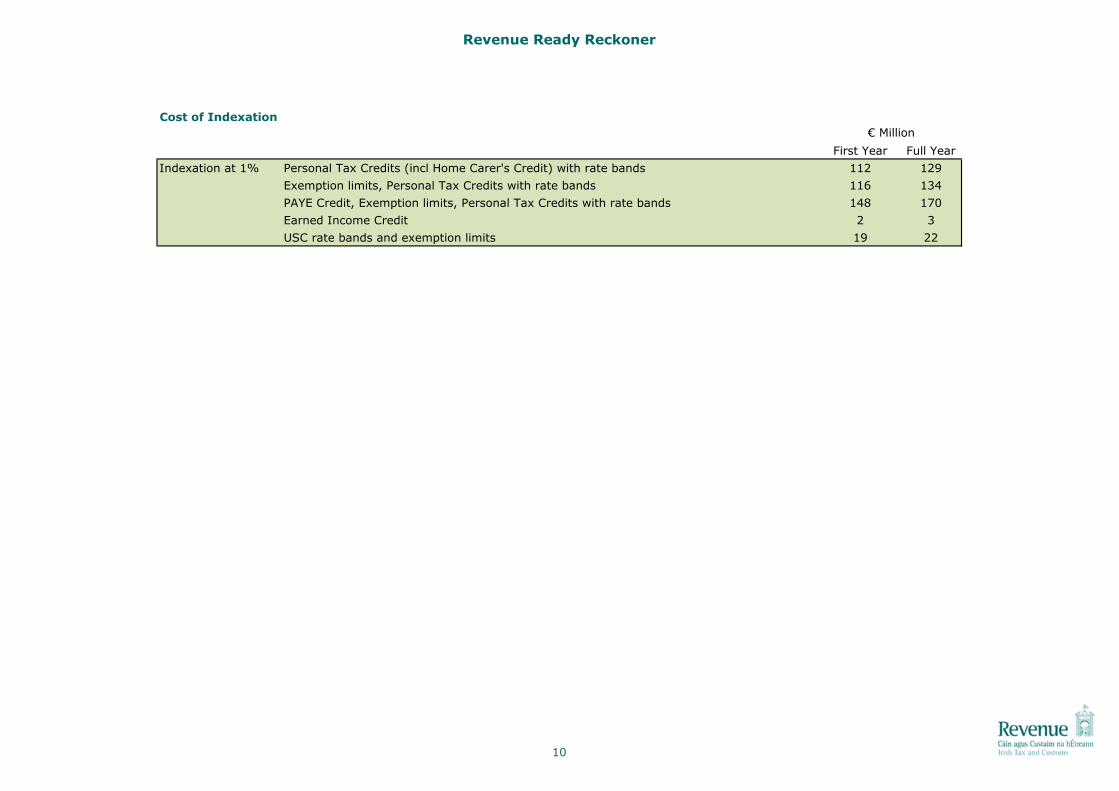
Cost of Indexation
First Year Full Year
Indexation at 1% Personal Tax Credits (incl Home Carer's Credit) with rate bands 112 129
Exemption limits, Personal Tax Credits with rate bands 116 134
PAYE Credit, Exemption limits, Personal Tax Credits with rate bands 148 170
Earned Income Credit 2 3
USC rate bands and exemption limits 19 22
€ Million
10
Revenue Ready Reckoner
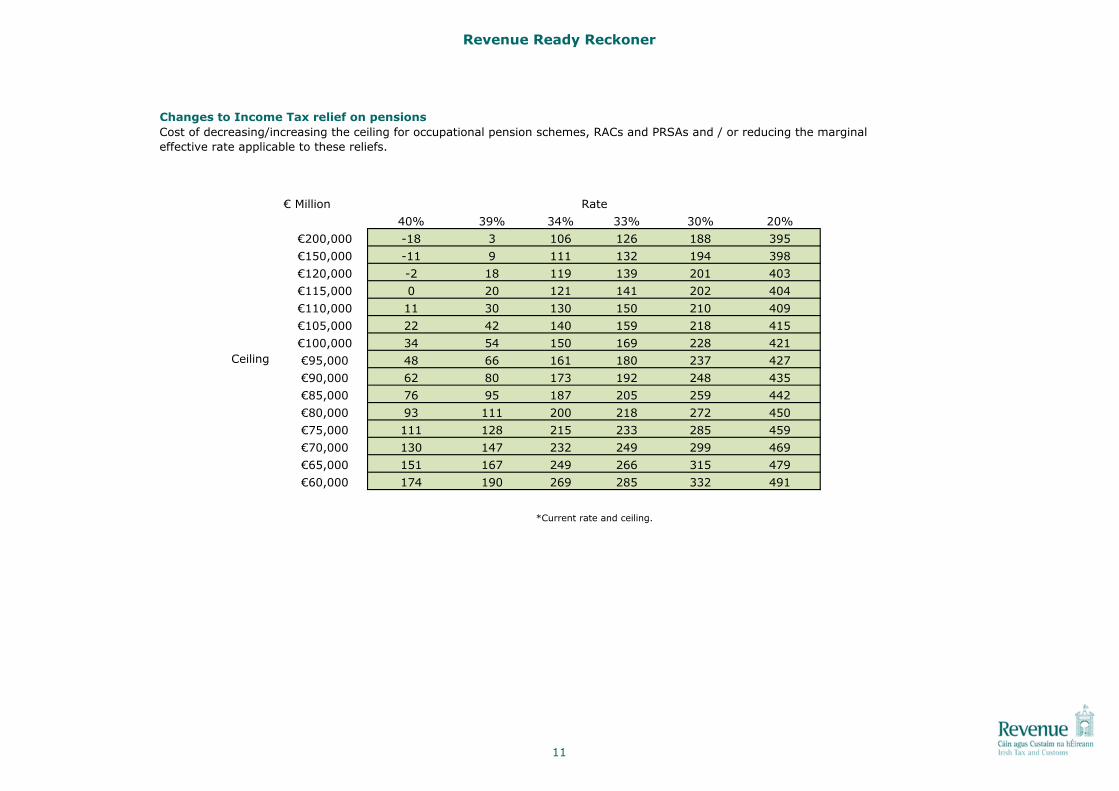
Changes to Income Tax relief on pensions
€ Million
40% 39% 34% 33% 30% 20%
€200,000 -18 3 106 126 188 395
€150,000 -11 9 111 132 194 398
€120,000 -2 18 119 139 201 403
€115,000 0 20 121 141 202 404
€110,000 11 30 130 150 210 409
€105,000 22 42 140 159 218 415
€100,000 34 54 150 169 228 421
€95,000 48 66 161 180 237 427
€90,000 62 80 173 192 248 435
€85,000 76 95 187 205 259 442
€80,000 93 111 200 218 272 450
€75,000 111 128 215 233 285 459
€70,000 130 147 232 249 299 469
€65,000 151 167 249 266 315 479
€60,000 174 190 269 285 332 491
*Current rate and ceiling.
Rate
Ceiling
Cost of decreasing/increasing the ceiling for occupational pension schemes, RACs and PRSAs and / or reducing the marginal
effective rate applicable to these reliefs.
11
Revenue Ready Reckoner
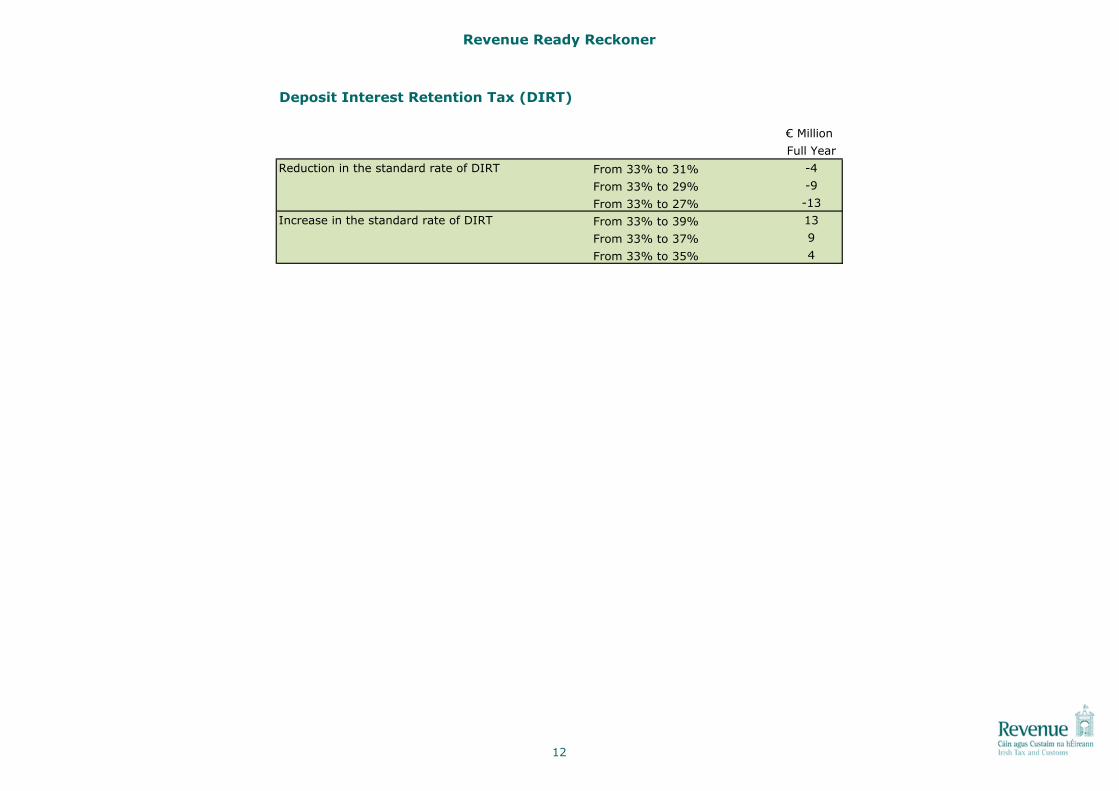
Deposit Interest Retention Tax (DIRT)
€ Million
Full Year
Reduction in the standard rate of DIRT From 33% to 31% -4
From 33% to 29% -9
From 33% to 27% -13
Increase in the standard rate of DIRT From 33% to 39% 13
From 33% to 37% 9
From 33% to 35% 4
12
Revenue Ready Reckoner
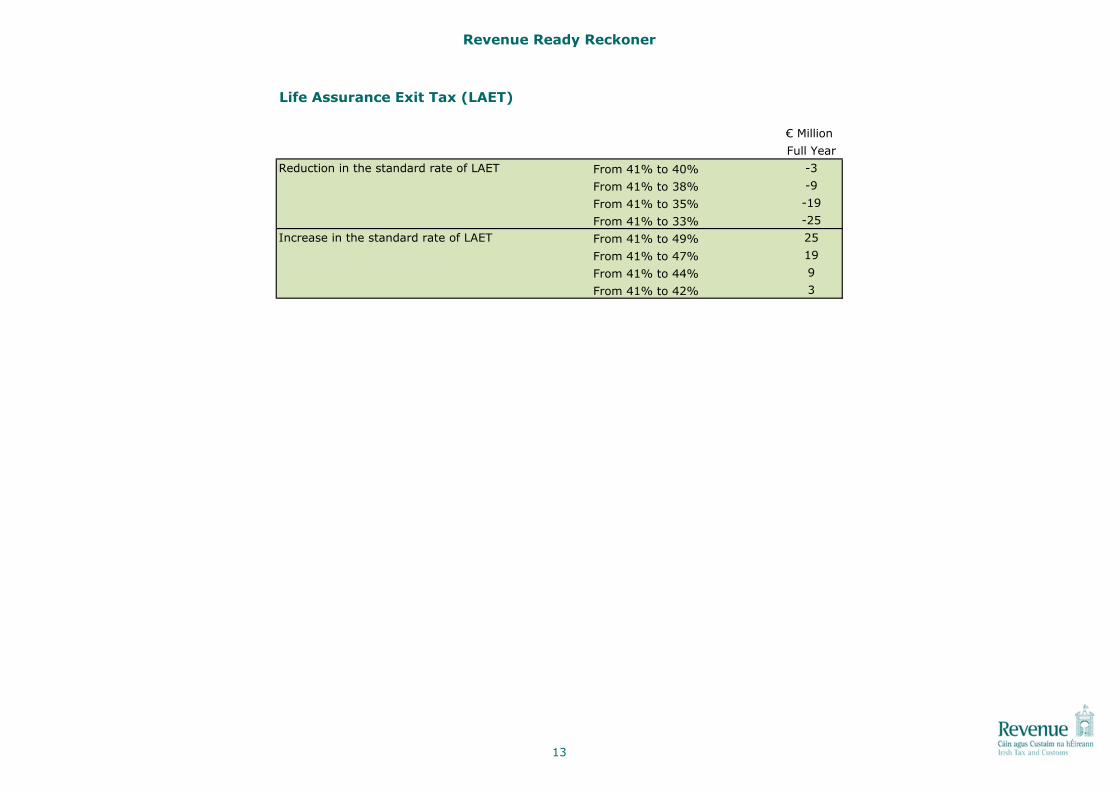
Life Assurance Exit Tax (LAET)
€ Million
Full Year
Reduction in the standard rate of LAET From 41% to 40% -3
From 41% to 38% -9
From 41% to 35% -19
From 41% to 33% -25
Increase in the standard rate of LAET From 41% to 49% 25
From 41% to 47% 19
From 41% to 44% 9
From 41% to 42% 3
13
Revenue Ready Reckoner
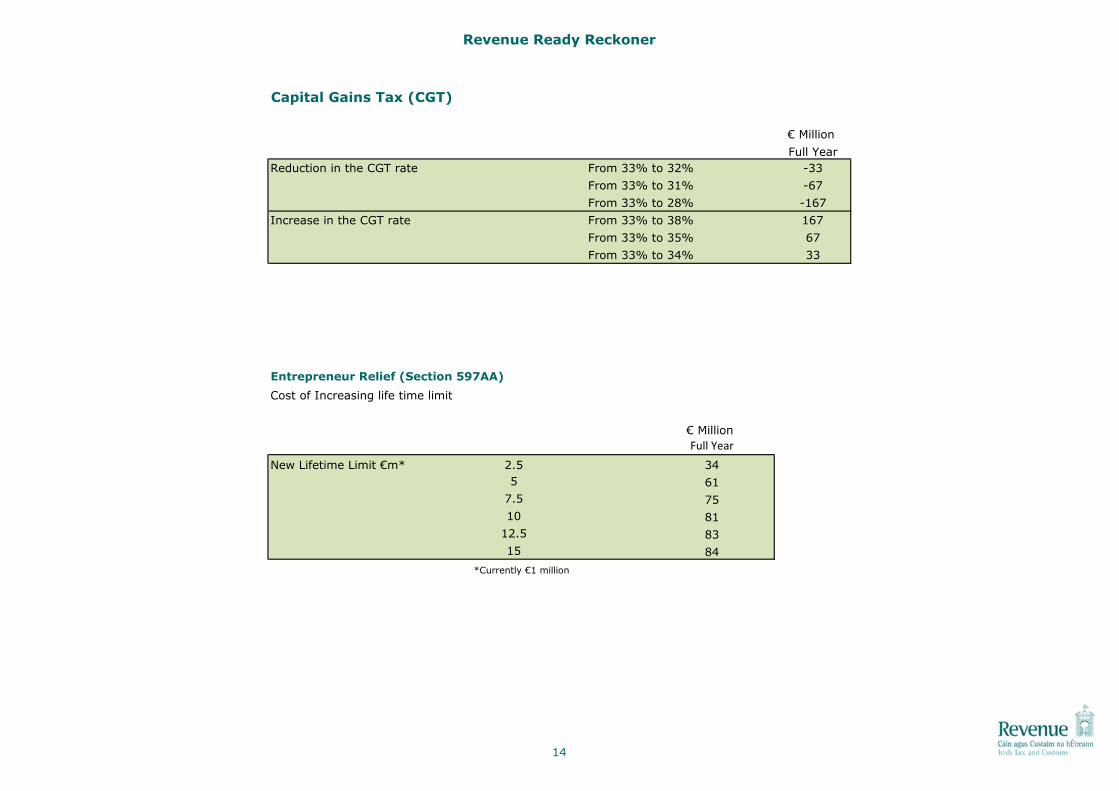
Capital Gains Tax (CGT)
€ Million
Full Year
Reduction in the CGT rate From 33% to 32% -33
From 33% to 31% -67
From 33% to 28% -167
Increase in the CGT rate From 33% to 38% 167
From 33% to 35% 67
From 33% to 34% 33
Entrepreneur Relief (Section 597AA)
Cost of Increasing life time limit
New Lifetime Limit €m* 2.5
5
7.5
10
12.5
15
*Currently €1 million
€ Million
84
75
81
83
Full Year
34
61
14
Revenue Ready Reckoner
Capital Acquisitions Tax (CAT)
The CAT Ready Reckoner covers the following:
Page 16
Page 17-18
Changes in CAT Rates, Thresholds or Reliefs
Simultaneous Change in CAT Rate and Thresholds
15
Revenue Ready Reckoner
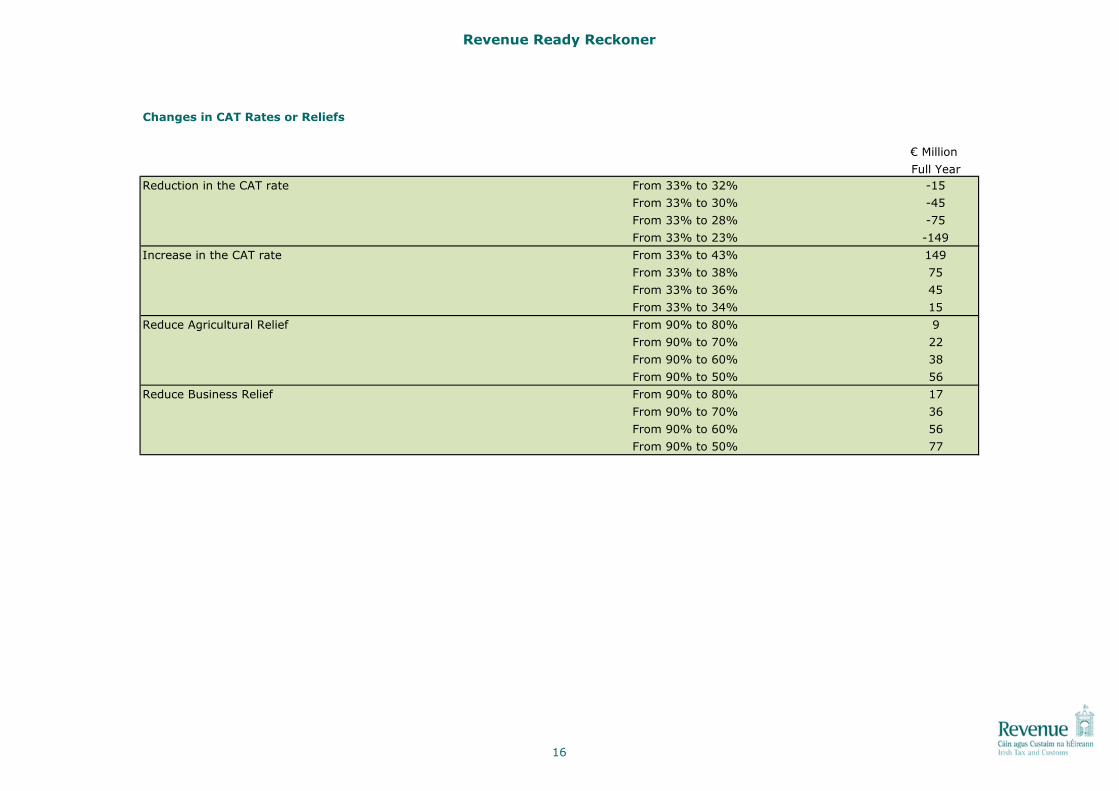
Changes in CAT Rates or Reliefs
€ Million
Full Year
Reduction in the CAT rate From 33% to 32% -15
From 33% to 30% -45
From 33% to 28% -75
From 33% to 23% -149
Increase in the CAT rate From 33% to 43% 149
From 33% to 38% 75
From 33% to 36% 45
From 33% to 34% 15
Reduce Agricultural Relief From 90% to 80% 9
From 90% to 70% 22
From 90% to 60% 38
From 90% to 50% 56
Reduce Business Relief From 90% to 80% 17
From 90% to 70% 36
From 90% to 60% 56
From 90% to 50% 77
16
Revenue Ready Reckoner
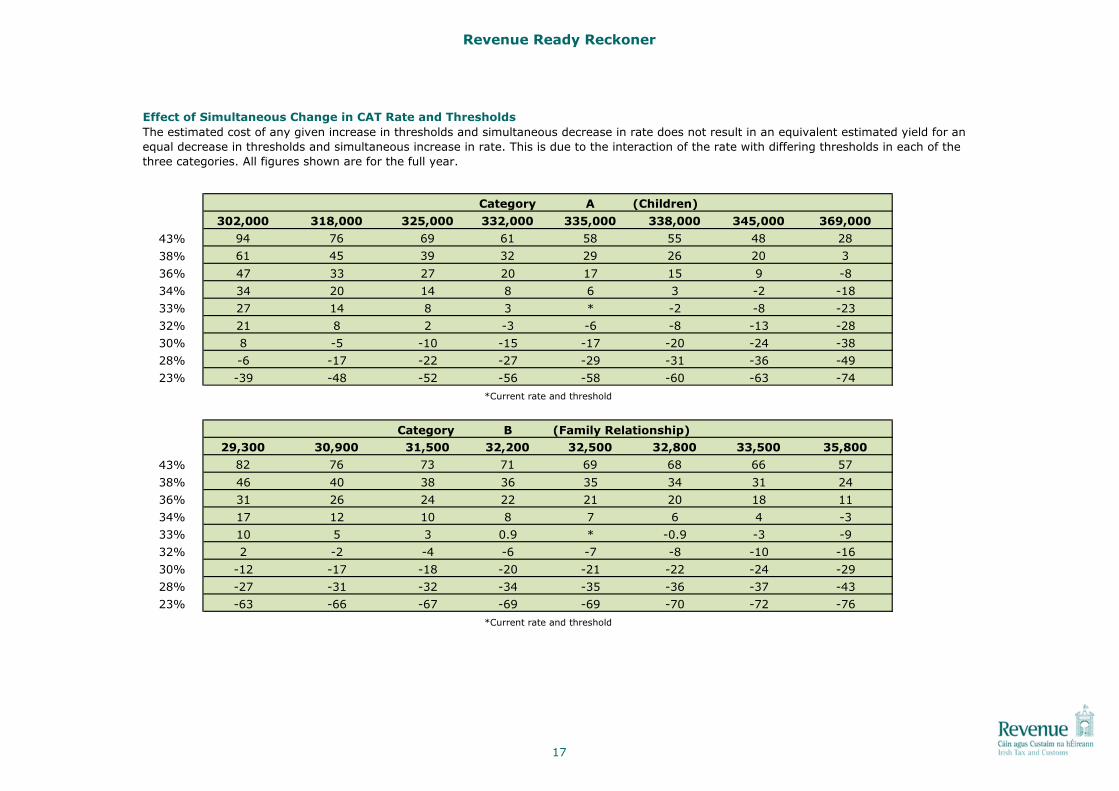
Effect of Simultaneous Change in CAT Rate and Thresholds
Category A (Children)
302,000 318,000 325,000 332,000 335,000 338,000 345,000 369,000
43% 94 76 69 61 58 55 48 28
38% 61 45 39 32 29 26 20 3
36% 47 33 27 20 17 15 9 -8
34% 34 20 14 8 6 3 -2 -18
33% 27 14 8 3 * -2 -8 -23
32% 21 8 2 -3 -6 -8 -13 -28
30% 8 -5 -10 -15 -17 -20 -24 -38
28% -6 -17 -22 -27 -29 -31 -36 -49
23% -39 -48 -52 -56 -58 -60 -63 -74
Category B (Family Relationship)
29,300 30,900 31,500 32,200 32,500 32,800 33,500 35,800
43% 82 76 73 71 69 68 66 57
38% 46 40 38 36 35 34 31 24
36% 31 26 24 22 21 20 18 11
34% 17 12 10 8 7 6 4 -3
33% 10 5 3 0.9 * -0.9 -3 -9
32% 2 -2 -4 -6 -7 -8 -10 -16
30% -12 -17 -18 -20 -21 -22 -24 -29
28% -27 -31 -32 -34 -35 -36 -37 -43
23% -63 -66 -67 -69 -69 -70 -72 -76
The estimated cost of any given increase in thresholds and simultaneous decrease in rate does not result in an equivalent estimated yield for an
equal decrease in thresholds and simultaneous increase in rate. This is due to the interaction of the rate with differing thresholds in each of the
three categories. All figures shown are for the full year.
*Current rate and threshold
*Current rate and threshold
17
Revenue Ready Reckoner
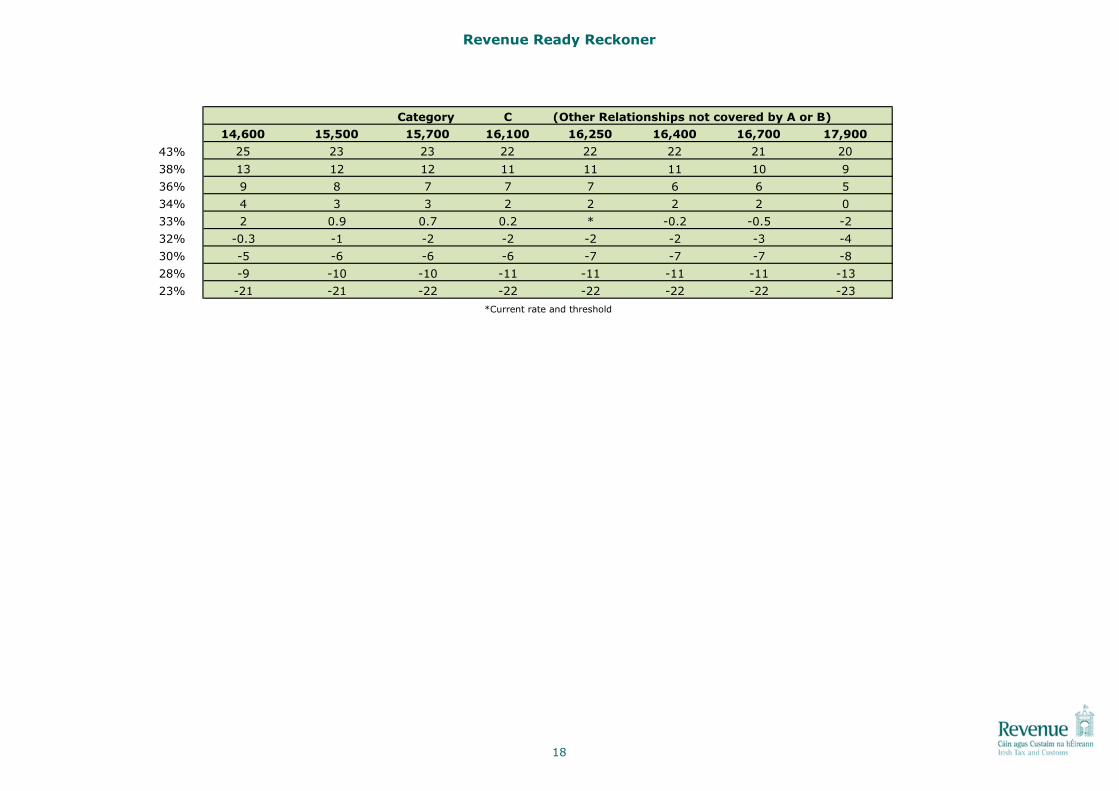
Category C (Other Relationships not covered by A or B)
14,600 15,500 15,700 16,100 16,250 16,400 16,700 17,900
43% 25 23 23 22 22 22 21 20
38% 13 12 12 11 11 11 10 9
36% 9 8 7 7 7 6 6 5
34% 4 3 3 2 2 2 2 0
33% 2 0.9 0.7 0.2 * -0.2 -0.5 -2
32% -0.3 -1 -2 -2 -2 -2 -3 -4
30% -5 -6 -6 -6 -7 -7 -7 -8
28% -9 -10 -10 -11 -11 -11 -11 -13
23% -21 -21 -22 -22 -22 -22 -22 -23
*Current rate and threshold
18
Revenue Ready Reckoner
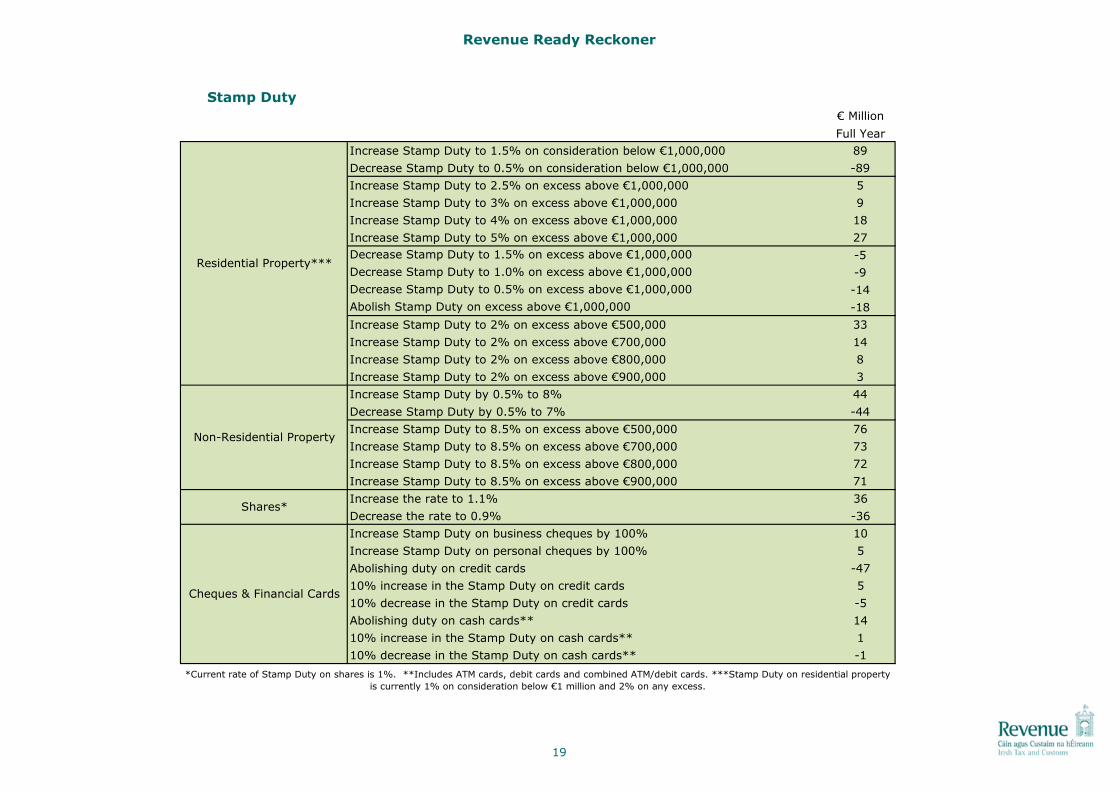
Stamp Duty
€ Million
Full Year
Increase Stamp Duty to 1.5% on consideration below €1,000,000 89
Decrease Stamp Duty to 0.5% on consideration below €1,000,000 -89
Increase Stamp Duty to 2.5% on excess above €1,000,000 5
Increase Stamp Duty to 3% on excess above €1,000,000 9
Increase Stamp Duty to 4% on excess above €1,000,000 18
Increase Stamp Duty to 5% on excess above €1,000,000 27
-5
-9
-14
-18
Increase Stamp Duty to 2% on excess above €500,000 33
Increase Stamp Duty to 2% on excess above €700,000 14
Increase Stamp Duty to 2% on excess above €800,000 8
Increase Stamp Duty to 2% on excess above €900,000 3
Increase Stamp Duty by 0.5% to 8% 44
Decrease Stamp Duty by 0.5% to 7% -44
Increase Stamp Duty to 8.5% on excess above €500,000 76
Increase Stamp Duty to 8.5% on excess above €700,000 73
Increase Stamp Duty to 8.5% on excess above €800,000 72
Increase Stamp Duty to 8.5% on excess above €900,000 71
Increase the rate to 1.1% 36
Decrease the rate to 0.9% -36
Increase Stamp Duty on business cheques by 100% 10
Increase Stamp Duty on personal cheques by 100% 5
Abolishing duty on credit cards -47
10% increase in the Stamp Duty on credit cards 5
10% decrease in the Stamp Duty on credit cards -5
Abolishing duty on cash cards** 14
10% increase in the Stamp Duty on cash cards** 1
10% decrease in the Stamp Duty on cash cards** -1
Cheques & Financial Cards
*Current rate of Stamp Duty on shares is 1%. **Includes ATM cards, debit cards and combined ATM/debit cards. ***Stamp Duty on residential property
is currently 1% on consideration below €1 million and 2% on any excess.
Non-Residential Property
Decrease Stamp Duty to 1.5% on excess above €1,000,000
Decrease Stamp Duty to 1.0% on excess above €1,000,000
Decrease Stamp Duty to 0.5% on excess above €1,000,000
Abolish Stamp Duty on excess above €1,000,000
Residential Property***
Shares*
19
Revenue Ready Reckoner
Excise
The Excise Ready Reckoner covers the following:
Mineral Oil Tax Page 21
Carbon Tax Page 22
Alcohol Products Tax Page 23
Tobacco Products Tax Page 24
Betting Duty Page 25
20
Revenue Ready Reckoner
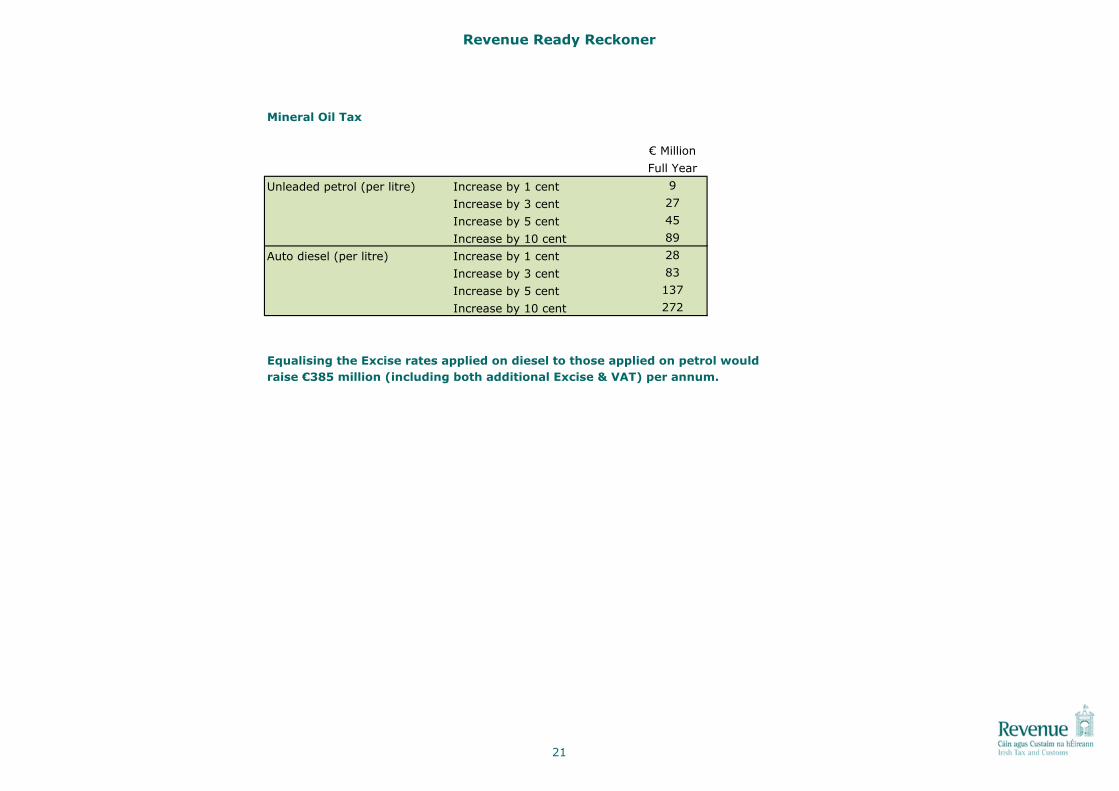
Mineral Oil Tax
€ Million
Full Year
Unleaded petrol (per litre) Increase by 1 cent 9
Increase by 3 cent 27
Increase by 5 cent 45
Increase by 10 cent 89
Auto diesel (per litre) Increase by 1 cent 28
Increase by 3 cent 83
Increase by 5 cent 137
Increase by 10 cent 272
Equalising the Excise rates applied on diesel to those applied on petrol would
raise €385 million (including both additional Excise & VAT) per annum.
21
Revenue Ready Reckoner
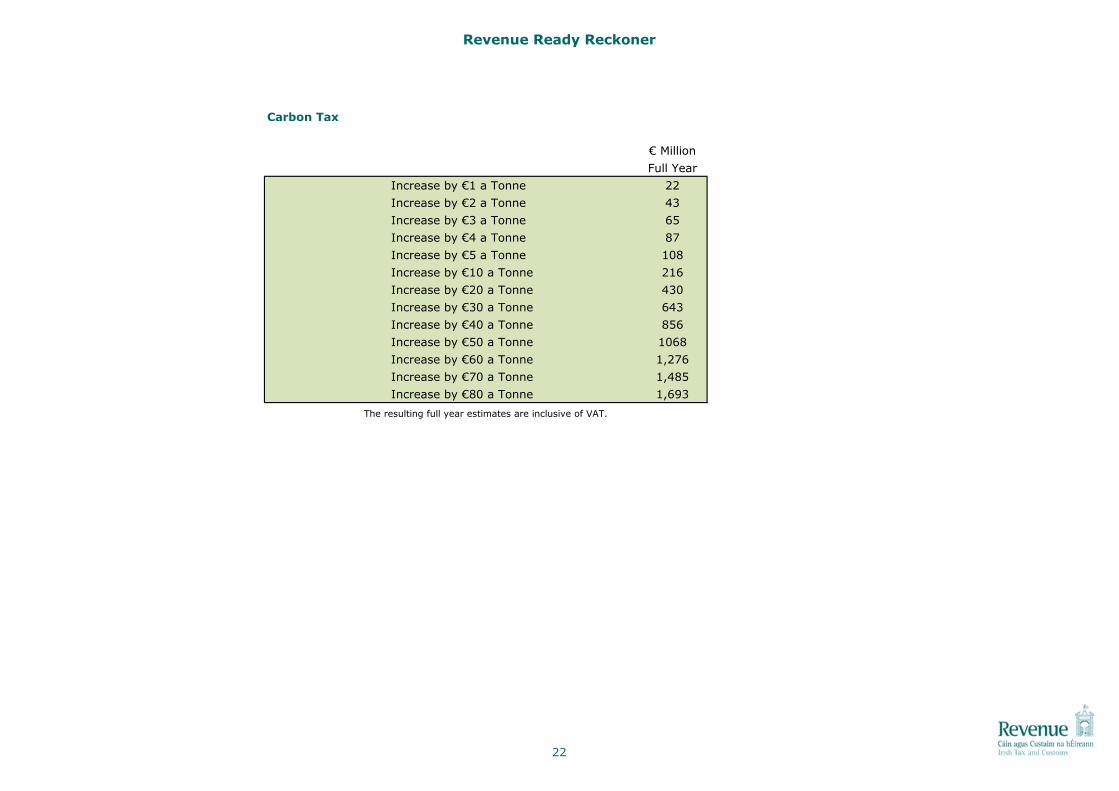
Carbon Tax
€ Million
Full Year
Increase by €1 a Tonne 22
Increase by €2 a Tonne 43
Increase by €3 a Tonne 65
Increase by €4 a Tonne 87
Increase by €5 a Tonne 108
Increase by €10 a Tonne 216
Increase by €20 a Tonne 430
Increase by €30 a Tonne 643
Increase by €40 a Tonne 856
Increase by €50 a Tonne 1068
Increase by €60 a Tonne 1,276
Increase by €70 a Tonne 1,485
Increase by €80 a Tonne 1,693
The resulting full year estimates are inclusive of VAT.
22
Revenue Ready Reckoner
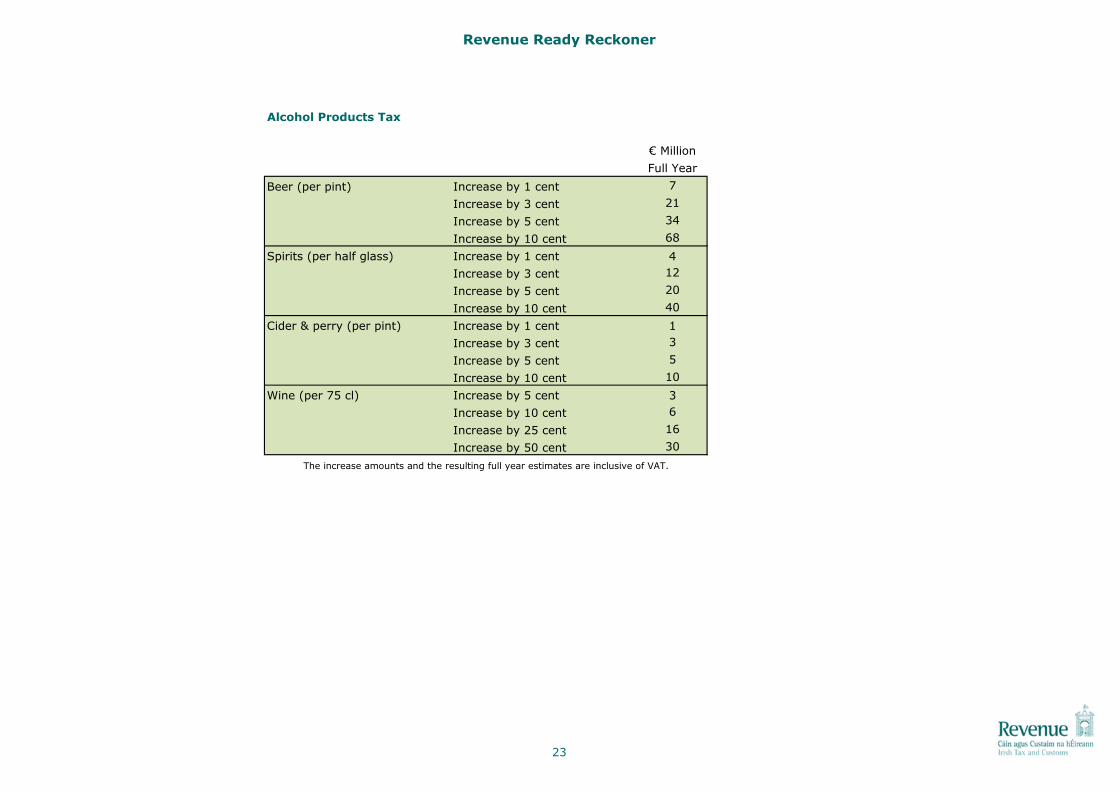
Alcohol Products Tax
€ Million
Full Year
Beer (per pint) Increase by 1 cent 7
Increase by 3 cent 21
Increase by 5 cent 34
Increase by 10 cent 68
Spirits (per half glass) Increase by 1 cent 4
Increase by 3 cent 12
Increase by 5 cent 20
Increase by 10 cent 40
Cider & perry (per pint) Increase by 1 cent 1
Increase by 3 cent 3
Increase by 5 cent 5
Increase by 10 cent 10
Wine (per 75 cl) Increase by 5 cent 3
Increase by 10 cent 6
Increase by 25 cent 16
Increase by 50 cent 30
The increase amounts and the resulting full year estimates are inclusive of VAT.
23
Revenue Ready Reckoner
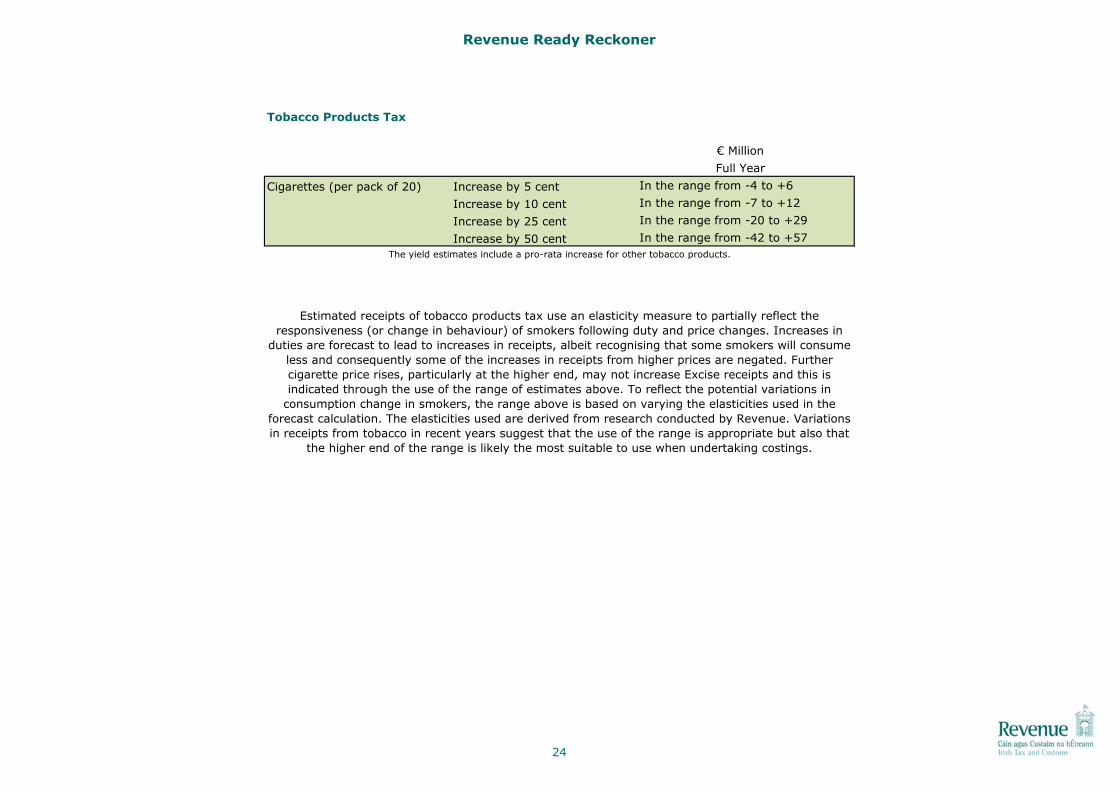
Tobacco Products Tax
€ Million
Full Year
Cigarettes (per pack of 20) Increase by 5 cent In the range from -4 to +6
Increase by 10 cent In the range from -7 to +12
Increase by 25 cent In the range from -20 to +29
Increase by 50 cent In the range from -42 to +57
Estimated receipts of tobacco products tax use an elasticity measure to partially reflect the
responsiveness (or change in behaviour) of smokers following duty and price changes. Increases in
duties are forecast to lead to increases in receipts, albeit recognising that some smokers will consume
less and consequently some of the increases in receipts from higher prices are negated. Further
cigarette price rises, particularly at the higher end, may not increase Excise receipts and this is
indicated through the use of the range of estimates above. To reflect the potential variations in
consumption change in smokers, the range above is based on varying the elasticities used in the
forecast calculation. The elasticities used are derived from research conducted by Revenue. Variations
in receipts from tobacco in recent years suggest that the use of the range is appropriate but also that
the higher end of the range is likely the most suitable to use when undertaking costings.
The yield estimates include a pro-rata increase for other tobacco products.
24
Revenue Ready Reckoner
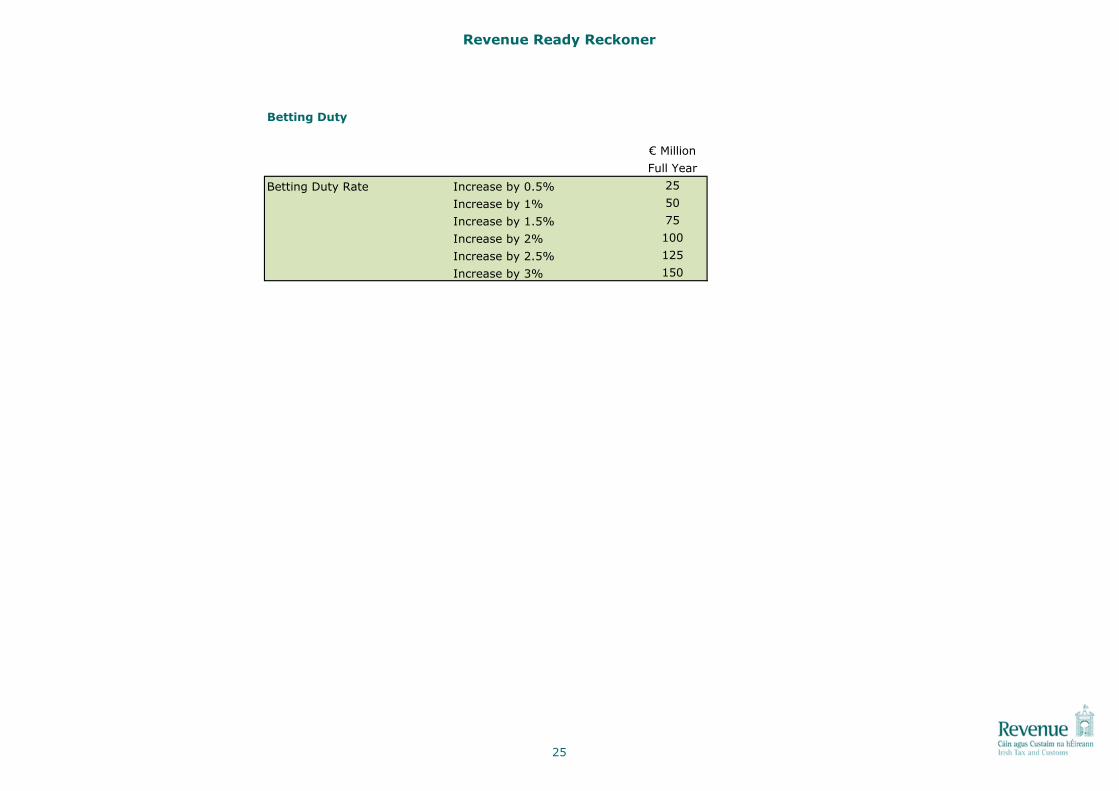
Betting Duty
€ Million
Full Year
Increase by 0.5% 25
Increase by 1% 50
Increase by 1.5% 75
Increase by 2% 100
Increase by 2.5% 125
Increase by 3% 150
Betting Duty Rate
25
Revenue Ready Reckoner
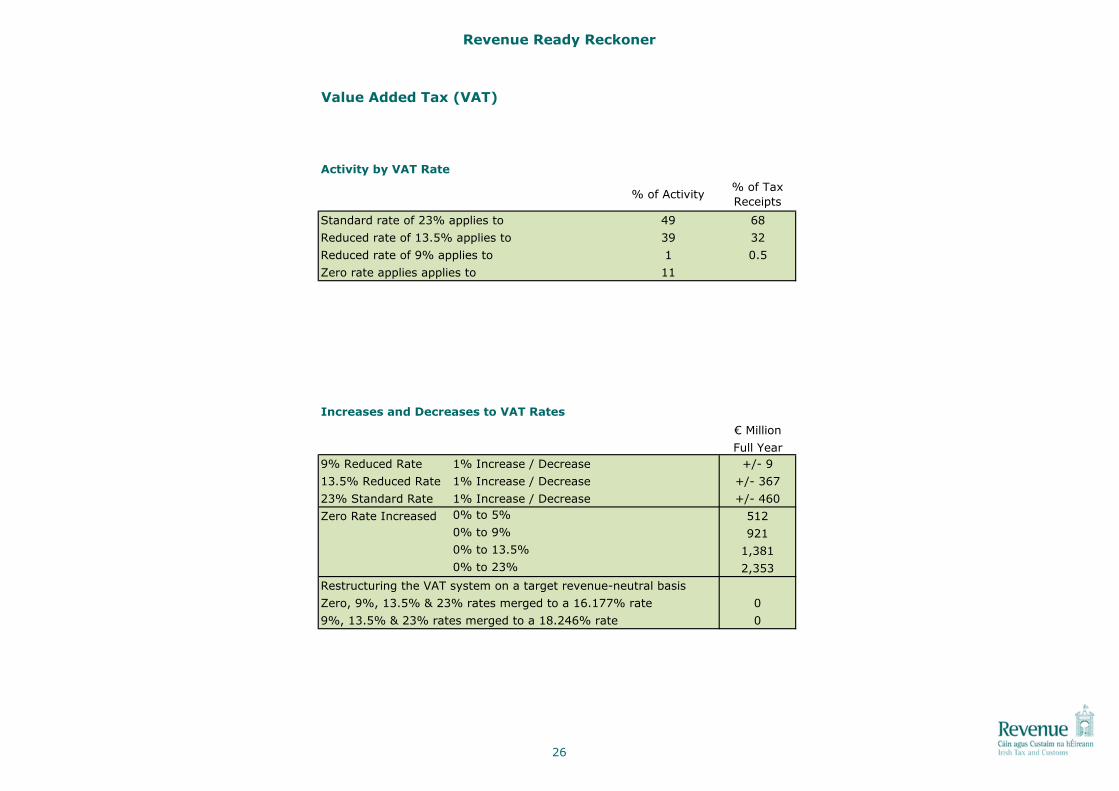
Value Added Tax (VAT)
Activity by VAT Rate
% of Activity% of Tax
Receipts
Standard rate of 23% applies to 49 68
Reduced rate of 13.5% applies to 39 32
Reduced rate of 9% applies to 1 0.5
Zero rate applies applies to 11
Increases and Decreases to VAT Rates
€ Million
Full Year
9% Reduced Rate 1% Increase / Decrease +/- 9
13.5% Reduced Rate 1% Increase / Decrease +/- 367
23% Standard Rate 1% Increase / Decrease +/- 460
Zero Rate Increased 0% to 5% 512
0% to 9% 921
0% to 13.5% 1,381
0% to 23% 2,353
Restructuring the VAT system on a target revenue-neutral basis
Zero, 9%, 13.5% & 23% rates merged to a 16.177% rate 0
9%, 13.5% & 23% rates merged to a 18.246% rate 0
26
Revenue Ready Reckoner
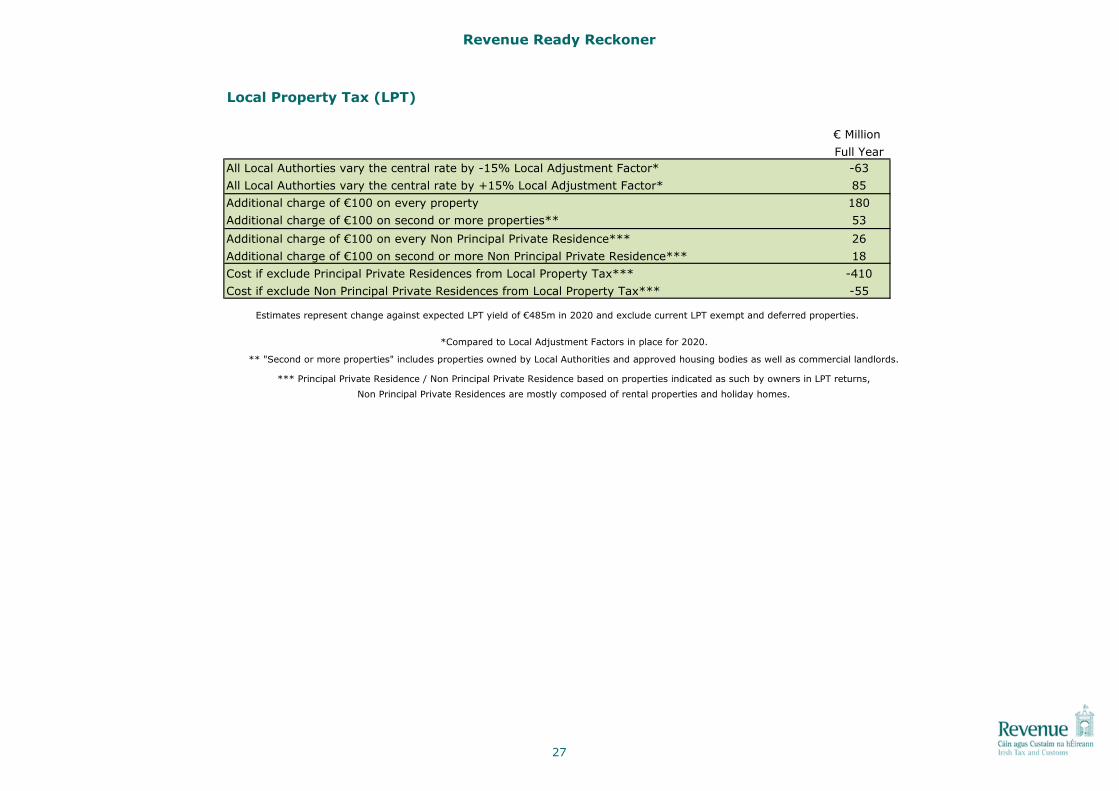
Local Property Tax (LPT)
€ Million
Full Year
All Local Authorties vary the central rate by -15% Local Adjustment Factor* -63All Local Authorties vary the central rate by +15% Local Adjustment Factor* 85Additional charge of €100 on every property 180
Additional charge of €100 on second or more properties** 53
Additional charge of €100 on every Non Principal Private Residence*** 26
Additional charge of €100 on second or more Non Principal Private Residence*** 18
Cost if exclude Principal Private Residences from Local Property Tax*** -410
Cost if exclude Non Principal Private Residences from Local Property Tax*** -55
*Compared to Local Adjustment Factors in place for 2020.
** "Second or more properties" includes properties owned by Local Authorities and approved housing bodies as well as commercial landlords.
*** Principal Private Residence / Non Principal Private Residence based on properties indicated as such by owners in LPT returns,
Non Principal Private Residences are mostly composed of rental properties and holiday homes.
Estimates represent change against expected LPT yield of €485m in 2020 and exclude current LPT exempt and deferred properties.
27