readout electronics & daq
DESCRIPTION
Readout Electronics & DAQ. Introduction DAQ Spreadsheet VLSB_DAQ Sheet Initialisation Bias control Cryo control Data taking VLPC Cassette Characterisation Process G4MICE Applications Status Station 5 Test Software required Hardware Required Conclusions. Introduction. - PowerPoint PPT PresentationTRANSCRIPT
1M. Ellis - MICE Tracker Meeting - 12th February 2007
Readout Electronics & DAQ
Introduction DAQ Spreadsheet
VLSB_DAQ Sheet Initialisation Bias control Cryo control Data taking
VLPC Cassette Characterisation
Process G4MICE Applications Status
Station 5 Test Software required Hardware Required
Conclusions
2M. Ellis - MICE Tracker Meeting - 12th February 2007
Introduction
Talk will discuss readout and analysis tools for Tracker 5 QA and VLPC characterisation, this is not the same as firmware and software for final MICE tracker!
I should have spent this weekend writing documentation, so have tried to use writing this talk as a start to documenting the new software.
Reminder about readout system: One MICE cryostat with one or two cassettes. Currently can read out 2 AFE IIt boards synchronised via a
patch cable and firmware from Kwame. LED Pulser used for VLPC characterisation Spreadsheet provides 3 triggering modes, one useful for
LED and cosmic data, the other for radioactive source data.
Data is produced in a plain text format, save a factor of 10 by zipping.
G4MICE can read data and 2 applications currently written to analyse it (3rd in preparation).

3M. Ellis - MICE Tracker Meeting - 12th February 2007
DAQ Spreadsheet
Excel spreadsheet with Visual Basic code to send commands to the 1553 and VLSB modules via a BIT3 driver (Bob Angstadt, FNAL).
Most AFEIIT operations involve sending lists of commands which are found on different tabs of the sheet.
To make control easier for non-expert users, I’ve put all the functions together on one sheet with some Visual Basic to set the parameters automatically.
VLSB_DAQ sheet can initialise up to 16 AFEIIt boards (FPGA programming and TRIP register setup) as well as control VLPC bias voltage, set temperature control and initiate temperature monitoring as well as take data with the VLSB.
Should not be too difficult to incorporate VB code to drive the stage that will house the source for the station QA work.

4M. Ellis - MICE Tracker Meeting - 12th February 2007
VLSB_DAQ Sheet

5M. Ellis - MICE Tracker Meeting - 12th February 2007
Initialisation
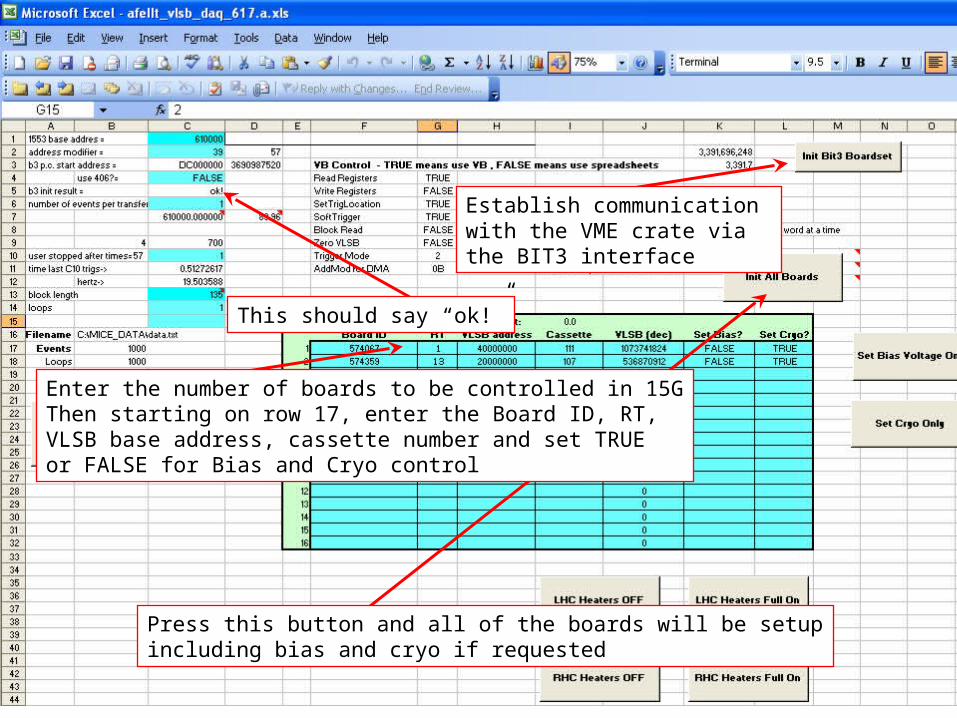
The process to initialise the boards starts by establishing communication with the VME crate via the BIT3.
Then the boards details are entered in the coloured region of the sheet.
Each board should have the correct board ID (written on a sticker on the side of the board near the handle), the correct RT (0 = LHB on LHC, 1 = RHB on RHC, 12 = LHB on RHC, 13 = RHB on RHC)
The cassette number can be found on the cassette just above where it emerges from the cryostat.
The VLSB base address in hex should be entered and will be converted to decimal by the spreadsheet.
The last two booleans control whether or not the VLPC bias should be turned on and whether the temperature control should be initiated.
At D0, with 2 boards, this process takes about 3 minutes and 15 seconds.
6M. Ellis - MICE Tracker Meeting - 12th February 2007
Establish communication with the VME crate viathe BIT3 interface
This should say “ok!”
Press this button and all of the boards will be setupincluding bias and cryo if requested
Enter the number of boards to be controlled in 15GThen starting on row 17, enter the Board ID, RT, VLSB base address, cassette number and set TRUEor FALSE for Bias and Cryo control

7M. Ellis - MICE Tracker Meeting - 12th February 2007
Bias Control
Once the correct voltage has been determined for each cassette (see later in this talk), the spreadsheet will have these values saved.
The sheet also has the calibration information for every MICE board (12 at the moment, information will be added as more boards become available).
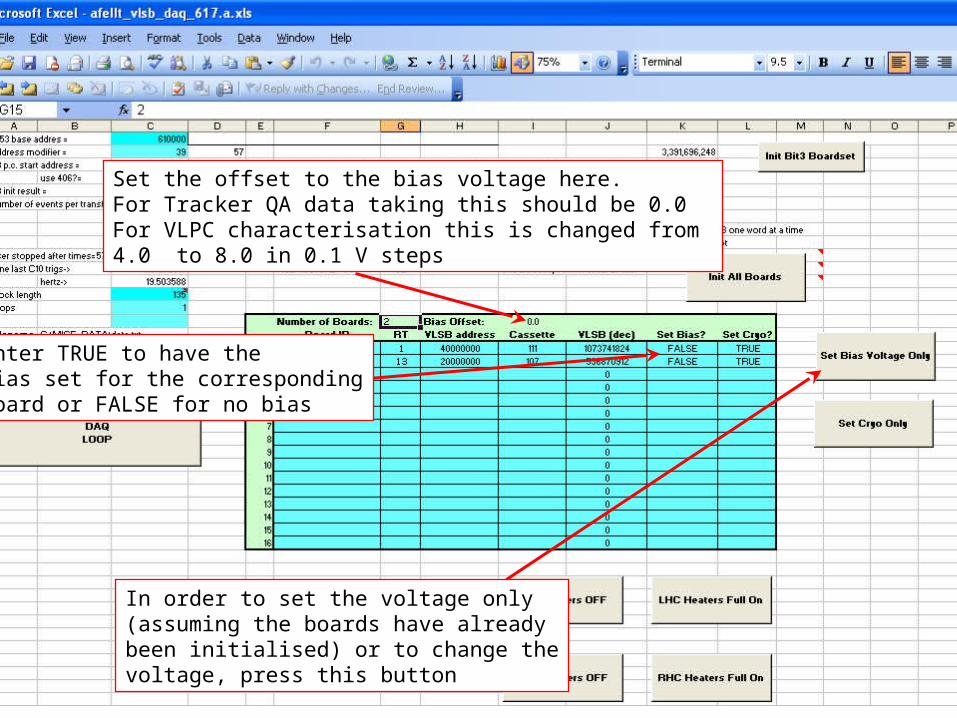
In order to do bias scans, the cell I15 allows a global offset to be selected by the user.
For Station QA, this should be left at 0.0 For bias scans, this is changed from 4.0 – 8.0 in 0.1V
steps. The voltage can be set (or changed) by pressing the
“Set Bias Voltage Only” button. If the Set Bias? column is set to TRUE for each board
and there is no need to change the bias, then the “Init All Boards” will set the voltages correctly, so there is no need to use the “Set Bias Voltage Only” button.
8M. Ellis - MICE Tracker Meeting - 12th February 2007
Set the offset to the bias voltage here.For Tracker QA data taking this should be 0.0For VLPC characterisation this is changed from 4.0 to 8.0 in 0.1 V steps
Enter TRUE to have the bias set for the correspondingboard or FALSE for no bias
In order to set the voltage only (assuming the boards have already been initialised) or to change thevoltage, press this button

9M. Ellis - MICE Tracker Meeting - 12th February 2007
Cryo Control
In a similar manner as for the bias, there are sheets to setup the VLPC cassette temperature control.
A database of the known cassettes and AFEIIt boards allows the R(9K) values and board calibrations to be converted into a setpoint.
As for the bias, a TRUE or FALSE can be entered to initiate control on a board by board basis.
Even if TRUE is set for a left hand board, nothing will be done.
There are four buttons that can be used to set the heaters on a cassette to be off or on full. These are used for testing the production cryostats.
Clicking on the Monitor Temp button will change to the monitoring sheet and start logging the cassette temperatures.
10M. Ellis - MICE Tracker Meeting - 12th February 2007
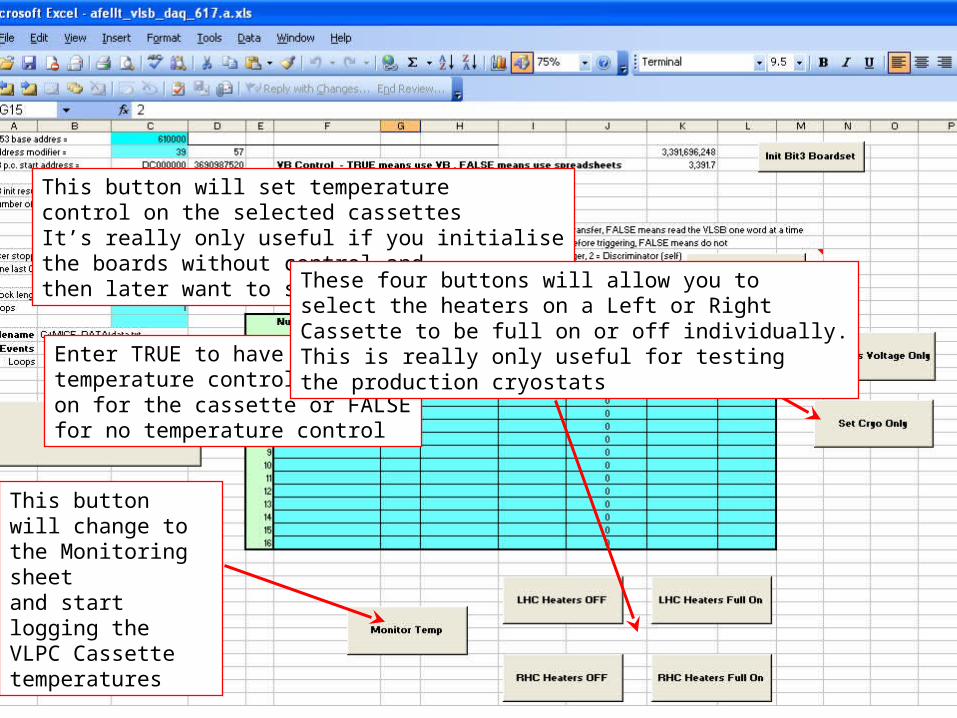
Enter TRUE to have the temperature control switchedon for the cassette or FALSEfor no temperature control
This button will set temperaturecontrol on the selected cassettesIt’s really only useful if you initialisethe boards without control andthen later want to start itThese four buttons will allow you to
select the heaters on a Left or RightCassette to be full on or off individually.This is really only useful for testingthe production cryostats
This button will change to the Monitoring sheetand start logging the VLPC Cassette temperatures

11M. Ellis - MICE Tracker Meeting - 12th February 2007
Temperature Monitoring
During normal operation of a cassette, we do not have temperature monitoring running on the AFEIIt board as this produces too high a load on the PIC for stable data taking.
We can, however send 1553 commands to readout the current temperature being monitored by the feedback loop on the board as well as the heater current for each of the 8 modules on a cassette.
The TMonitor sheet will read the temperature and heater currents for both cassettes and plot a graph of these versus time.
The recorded values are converted into a temperature in Kelvin and the heater values into percentage of total power (1.5W per cassette for all 8 heaters on).
Note that for temperatures away from 9 Kelvin, the calibration becomes less reliable.
To stop monitoring, press the “End” key on the keyboard.

12M. Ellis - MICE Tracker Meeting - 12th February 2007
Set Points for the Left Cassette
Processed Values for the Left Cassette
Heater Currents for the Left Cassette0 = Off, 255 = Full on
Processed Values for the Right Cassette converted to Kelvin
Mean Cassette Temperature for Left and Right Cassettes
RMS of Cassette Temperatures for Left and Right Cassettes
% Power on Cassette Heaters
Left Cassette Temperatures are in Red
Right Cassette Temperatures are in Green

13M. Ellis - MICE Tracker Meeting - 12th February 2007
Data Taking
Once the AFE boards have been initialised and the bias voltage and temperature control set, it is possible to take data with the VLSBs.
The output filename is selected in cell B16. The number of events is selected in cell B17. The trigger mode is set in cell G10:
0 = External trigger. This is used for LED and cosmic ray data.
1 = Software trigger. This is only used for debugging purposes.
2 = Self trigger. With the correct synchronisation cable, this will cause the two boards to readout every time at least one of them has a discriminator fire. This will be used for the Station QA.
Once the “VLSB DAQ LOOP” button is pressed the number of events requested will be taken.
To stop the data taking early, press the “End” key.
14M. Ellis - MICE Tracker Meeting - 12th February 2007
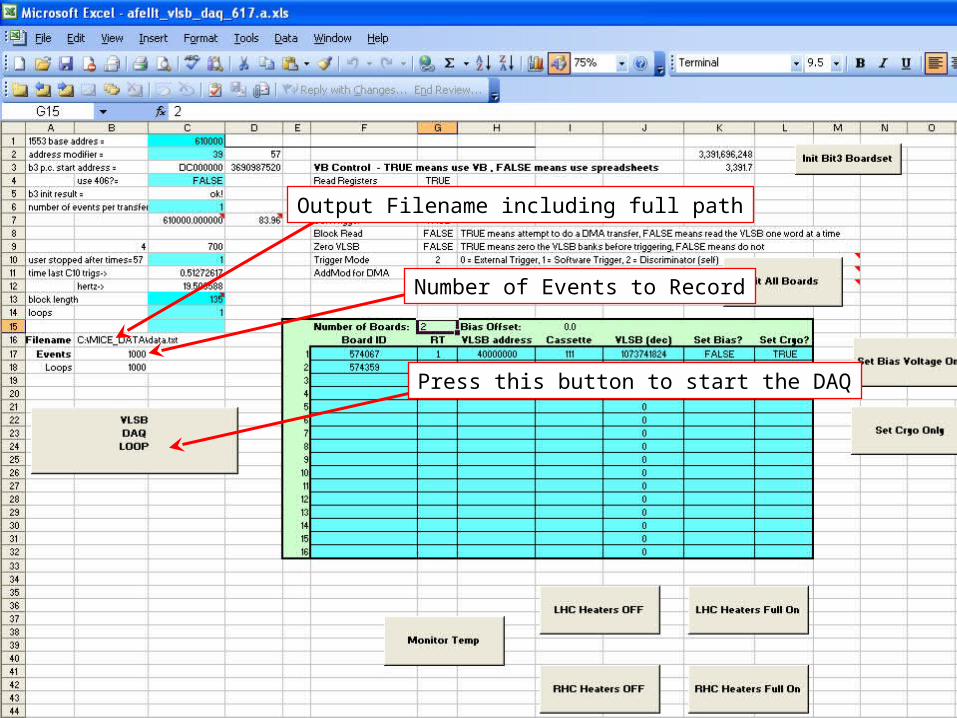
Output Filename including full path
Number of Events to Record
Press this button to start the DAQ
15M. Ellis - MICE Tracker Meeting - 12th February 2007
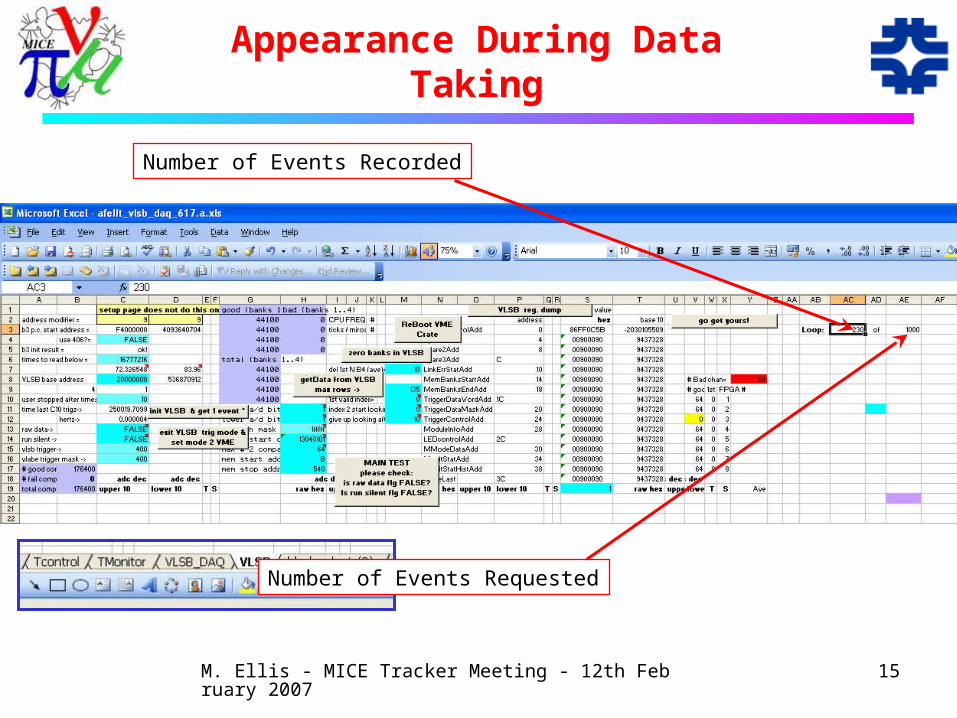
Appearance During Data Taking
Number of Events Recorded
Number of Events Requested
16M. Ellis - MICE Tracker Meeting - 12th February 2007
DAQ Spreadsheet
Can be found on the web here: http://www.mice.iit.edu/modules/tracker/VLSB/
Current version is “a” (i.e. 10).
Version 9 had a bug that was only discovered and fixed last week that meant it was only reading out one of the two VLSBs and writing that data twice.
This has been fixed in version a.

17M. Ellis - MICE Tracker Meeting - 12th February 2007
VLPC Cassette Characterisation
In order to understand if Cassette 112 will be useful for MICE we have taken data with the LED pulser and are in the middle of analysing it.
Data is taken at 41 voltage settings (4.0V – 8.0V in 0.1 V steps) with the LED on and off.
A G4MICE application (VlpcCassettes/ReadData) is used to read this data and produce a ROOT file with one histogram per channel.
Another G4MICE application (VlpcCassettes/Calibration) reads in a pair of ROOT files (LED on and off) for a given voltage and fits the single or multi peak distributions and extracts the pedestal, gain, mean number of photons and pedestal width.
A third application (under development) will be used to produce summary plots of gain, QE, etc as a function of bias and to determine the number of dead and broken down channels as a function of bias in order to optimise the bias on a module by module basis.

18M. Ellis - MICE Tracker Meeting - 12th February 2007
Peak Fitter
The Calibration application uses the ROOT TSpectrum class to find peaks in the histograms.
The positions and heights of the peaks are used to seed a special function that was developed by Yury Pogorel for fitting the distributions in D0.
Some example plots follow to show what the distributions and fits look like for:
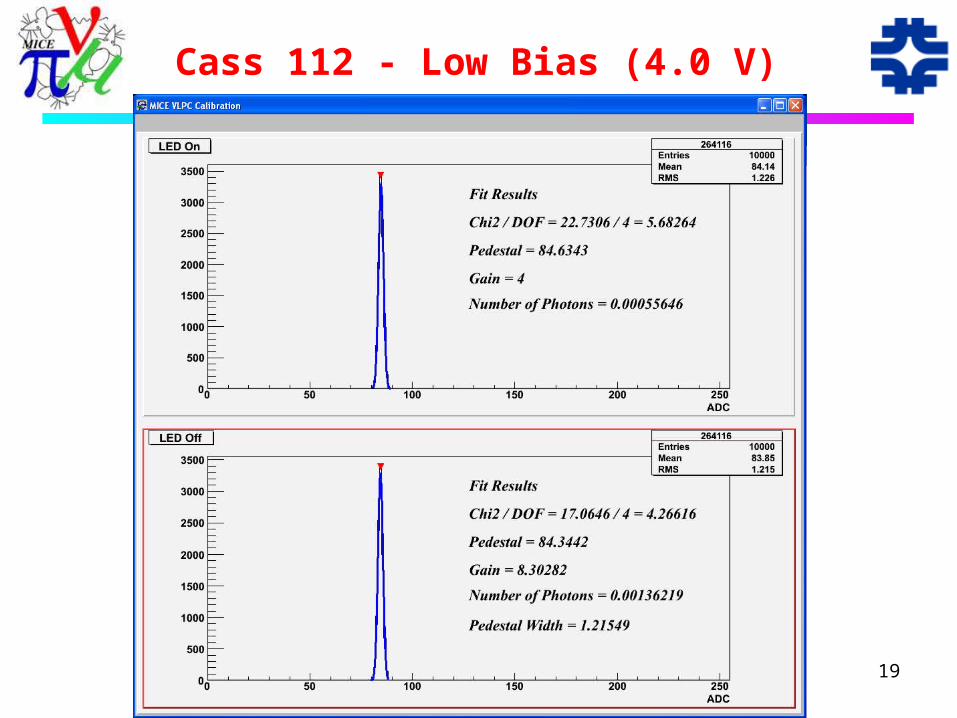
Low bias, voltage too low for the VLPCs to operate and only a pedestal is seen in both LED on and off data.
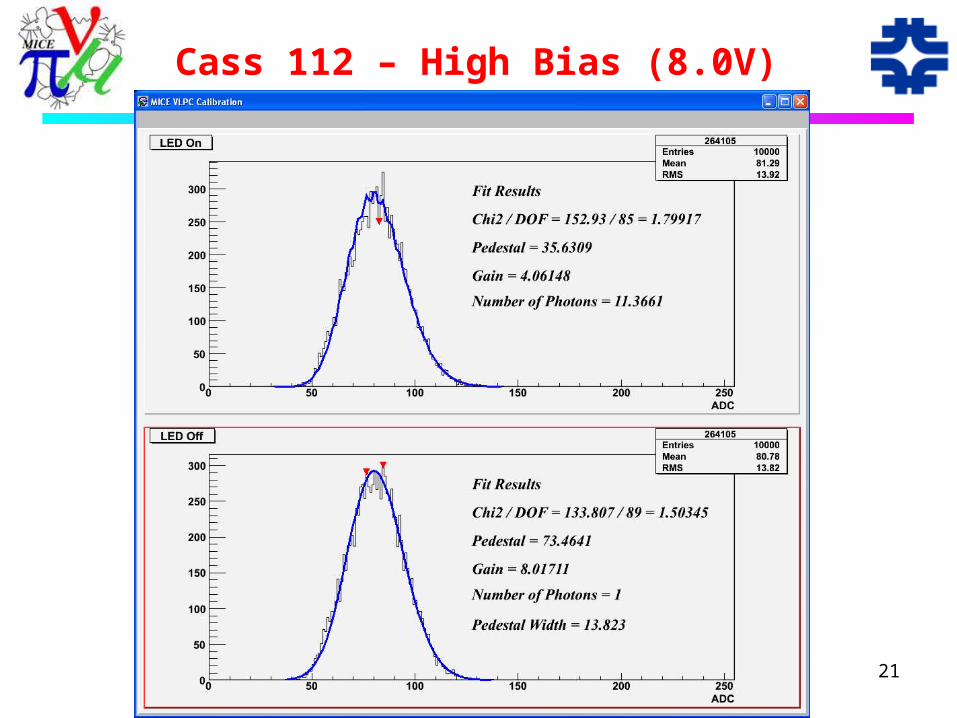
High bias, voltage too high for correct operation and the VLPCs are breaking down. This is sometimes seen in just the LED on data, or when the voltage is even higher, both the LED on and LED off data.
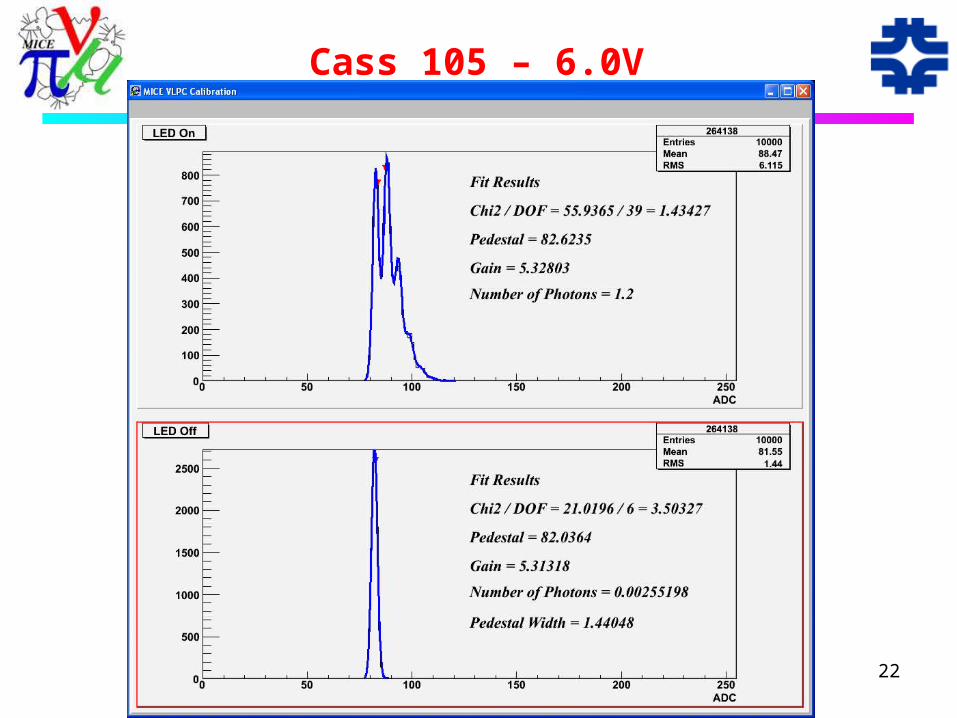
Normal operating voltage, where a multi peak spectrum can be fitted.
19M. Ellis - MICE Tracker Meeting - 12th February 2007
Cass 112 - Low Bias (4.0 V)

20M. Ellis - MICE Tracker Meeting - 12th February 2007
Cass 112 – High Bias (8.0V)
21M. Ellis - MICE Tracker Meeting - 12th February 2007
Cass 112 – High Bias (8.0V)
22M. Ellis - MICE Tracker Meeting - 12th February 2007
Cass 105 – 6.0V

23M. Ellis - MICE Tracker Meeting - 12th February 2007
Cass 112 – 6.0V

24M. Ellis - MICE Tracker Meeting - 12th February 2007
Applications
VlpcCassettes/ReadData: ./ReadData cards.in <input file1> <inputfile2> ...
<inputfileN> Produces a file adcs.root Histogram ID = BBBMCC where BBB is the board number
without the leading digits 574, M is the MCM number (1-8) and CC is the channel number (1-64).
VlpcCassettes/Calibration: ./Calibration –ledon <ledon.root> -ledoff <ledoff.root> [-
noplot] [-bias <voltage>] If –noplot is included then no plots will be shown. If –bias and a number are passed then the output
information will include the voltage, otherwise it will be listed as 0.
I’m currently trying to get ROOT to write out a postscript file. Once this works, the –ps option will cause this to happen.

25M. Ellis - MICE Tracker Meeting - 12th February 2007
Demonstration
<< show demonstration here if time permits >>>
26M. Ellis - MICE Tracker Meeting - 12th February 2007
Analysis
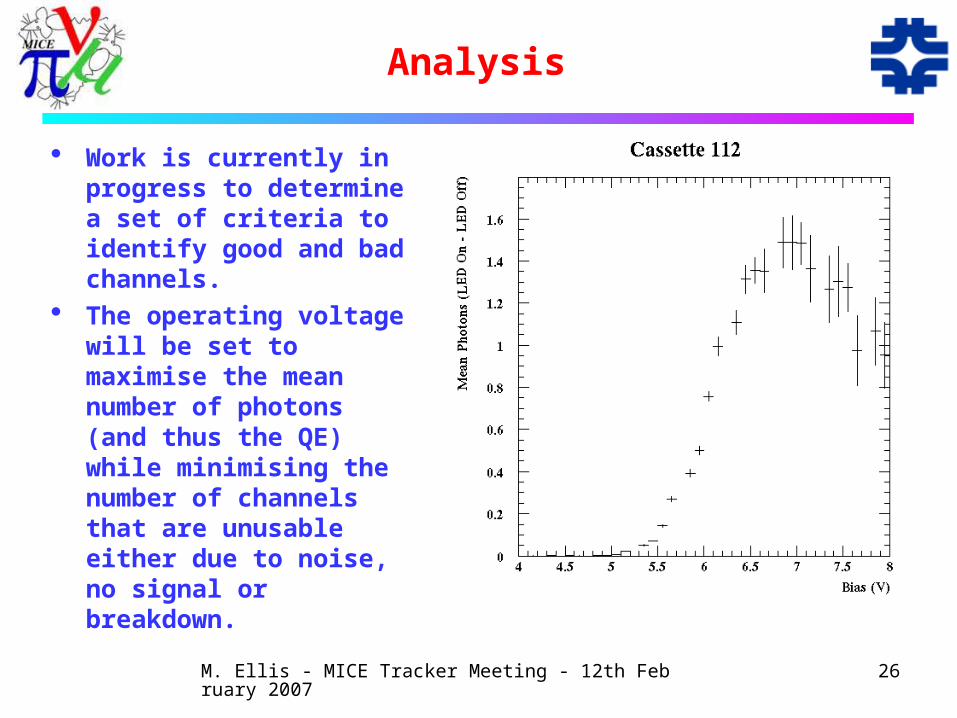
Work is currently in progress to determine a set of criteria to identify good and bad channels.
The operating voltage will be set to maximise the mean number of photons (and thus the QE) while minimising the number of channels that are unusable either due to noise, no signal or breakdown.

27M. Ellis - MICE Tracker Meeting - 12th February 2007
Station 5 Test
Requirements for Station 5 test: DAQ Spreadsheet Calibration information for chosen cassette and AFE boards Cryostat, cassette, 2 AFEIIt boards, waveguides, station,
gas system, pumps, AFE power supply, VME crate, 1553, 2 VLSBs, DG2020, etc...
For the tracker QA this list is almost identical, except as we will not be using an external trigger there will be no need for the DG2020.
The DAQ spreadsheet should now be ready for Station 5 and the Station QA.
I took some data on Friday that should confirm that the bug with reading out multiple VLSBs is fixed and just need to get a spare couple of minutes to analyse it.
The following slides will indicate what else is still missing.
28M. Ellis - MICE Tracker Meeting - 12th February 2007
Software Required
For whichever cassettes is put in the prototype cassette, we will want to perform the MICE characterisation process on it.
The data taking for this will take one day and the analysis probably a further day or two assuming nothing odd is found.
The third application for this analysis is not yet ready, but will be written soon.
Once the correct bias values are determined, the spreadsheet will be updated with these values in the database.
The only other missing piece of software will be whatever application is required in G4MICE to perform the analysis of the data. This should be a relatively quick job to write, copying from existing applications and could serve as a good path into G4MICE for a new user...
29M. Ellis - MICE Tracker Meeting - 12th February 2007
Hardware Required
The first production cryostat was cooled down last week and we looked at the cassette temperatures on Friday.
Russ is working on this one and in parallel the next one is being finished.
Over the coming few months, the existing AFE and cryo infrastructure will be needed for the cryostat testing and cassette characterisation.
If the Station 5 test is to be conducted in the UK, then a complete second set of hardware capable of operating on UK mains will need to be setup.
This is currently in progress, but not complete.

30M. Ellis - MICE Tracker Meeting - 12th February 2007
Conclusions
The software tools for the VLPC cassette characterisation are almost complete.
A first working version of the Excel DAQ spreadsheet capable of reading out multiple VLSBs synchronised with a patch cable and internally or externally triggered is now on the web.
A first look at Cassette 112 indicates that it is producing good data, however further analysis (of both halves!) will be required to understand the performance of the different types of VLPC in the cassette and decide whether or not it will perform well enough to be used in MICE.
There is still a fair bit of hardware that needs to be set up and tested before it will be possible to run two VLPC systems in parallel.