venture capital report - dow jones & company · 2019-07-11 · venture capital report venture...
TRANSCRIPT

V E N T U R E C A P I T A L R E P O R T
Venture Capital Report Europe | 2Q | 2019
V E N T U R E C A P I T A L R E P O R T
VENTURE CAPITAL REPORT
The following report presents Dow Jones VentureSource’s quarterly findings for European venture capital fundraising, investment, valuation,
and liquidity. The included charts and graphs offer a comprehensive view of the trends currently affecting the venture capital market.
Highlights for 2Q 2019 include:
• European companies set a new record for equity investment, with €9.29 billion raised in 802 rounds of financing.
• Despite the issues surrounding Brexit, the UK continued to take the lion’s share of startup investment, VC fundraising, and liquidity events.
• VC fundraising enjoyed the best quarter in three years, more than doubling from 1Q.
• While the M&A market appeared relatively stable, IPOs had another anemic quarter.
2
V E N T U R E C A P I T A L R E P O R T
RECORD-BREAKING QUARTER FOR EUROPEAN STARTUPS AS INVESTORS JOIN GOLD RUSH
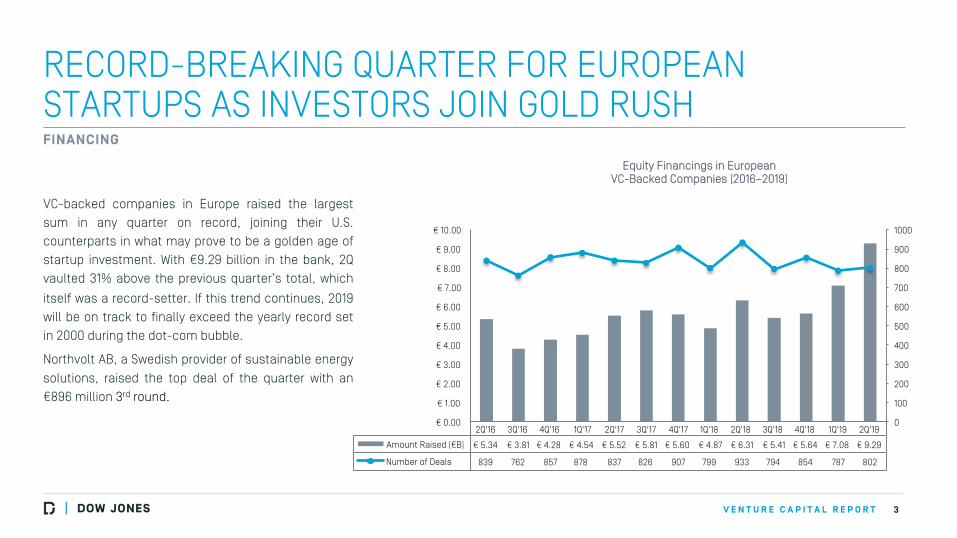
VC-backed companies in Europe raised the largest
sum in any quarter on record, joining their U.S.
counterparts in what may prove to be a golden age of
startup investment. With €9.29 billion in the bank, 2Q
vaulted 31% above the previous quarter’s total, which
itself was a record-setter. If this trend continues, 2019
will be on track to finally exceed the yearly record set
in 2000 during the dot-com bubble.
Northvolt AB, a Swedish provider of sustainable energy
solutions, raised the top deal of the quarter with an
€896 million 3rd round.
3
FINANCING Equity Financings in European
VC-Backed Companies (2016–2019)
2Q'16 3Q'16 4Q'16 1Q'17 2Q'17 3Q'17 4Q'17 1Q'18 2Q'18 3Q'18 4Q'18 1Q'19 2Q'19
Amount Raised (€B) € 5.34 € 3.81 € 4.28 € 4.54 € 5.52 € 5.81 € 5.60 € 4.87 € 6.31 € 5.41 € 5.64 € 7.08 € 9.29
Number of Deals 839 762 857 878 837 826 907 799 933 794 854 787 802
0
100
200
300
400
500
600
700
800
900
1000
€ 0.00
€ 1.00
€ 2.00
€ 3.00
€ 4.00
€ 5.00
€ 6.00
€ 7.00
€ 8.00
€ 9.00
€ 10.00
V E N T U R E C A P I T A L R E P O R T
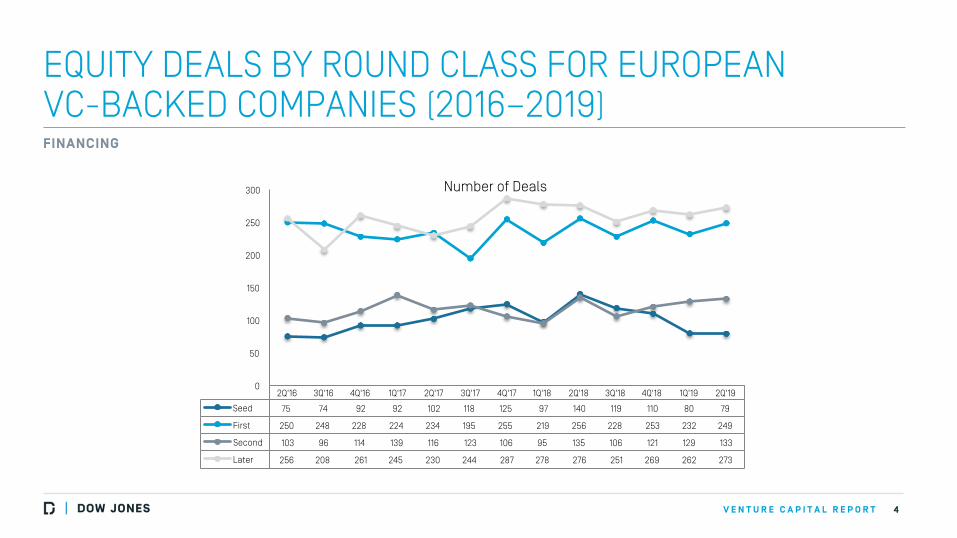
EQUITY DEALS BY ROUND CLASS FOR EUROPEAN VC-BACKED COMPANIES (2016–2019)
4
FINANCING
2Q'16 3Q'16 4Q'16 1Q'17 2Q'17 3Q'17 4Q'17 1Q'18 2Q'18 3Q'18 4Q'18 1Q'19 2Q'19
Seed 75 74 92 92 102 118 125 97 140 119 110 80 79
First 250 248 228 224 234 195 255 219 256 228 253 232 249
Second 103 96 114 139 116 123 106 95 135 106 121 129 133
Later 256 208 261 245 230 244 287 278 276 251 269 262 273
0
50
100
150
200
250
300 Number of Deals
V E N T U R E C A P I T A L R E P O R T
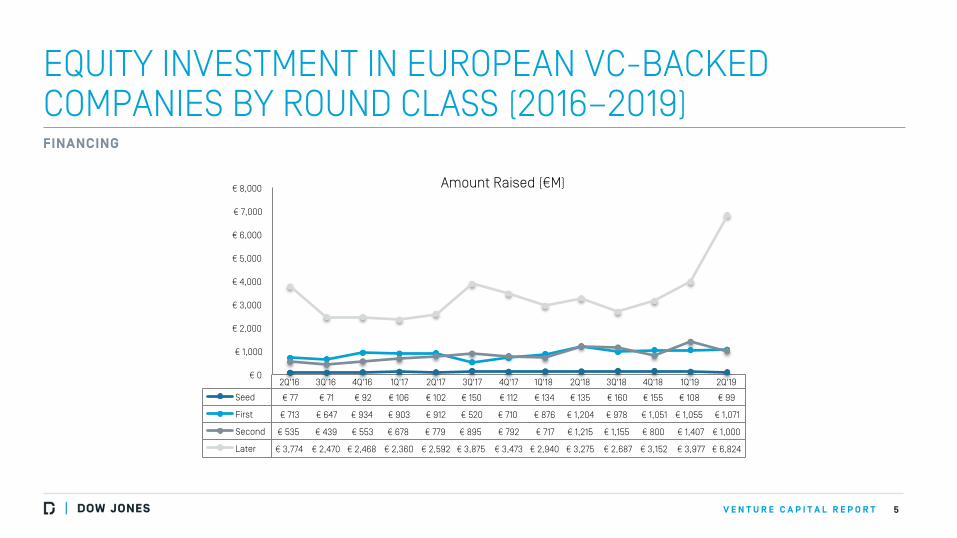
EQUITY INVESTMENT IN EUROPEAN VC-BACKED COMPANIES BY ROUND CLASS (2016–2019)
5
FINANCING
2Q'16 3Q'16 4Q'16 1Q'17 2Q'17 3Q'17 4Q'17 1Q'18 2Q'18 3Q'18 4Q'18 1Q'19 2Q'19
Seed € 77 € 71 € 92 € 106 € 102 € 150 € 112 € 134 € 135 € 160 € 155 € 108 € 99
First € 713 € 647 € 934 € 903 € 912 € 520 € 710 € 876 € 1,204 € 978 € 1,051 € 1,055 € 1,071
Second € 535 € 439 € 553 € 678 € 779 € 895 € 792 € 717 € 1,215 € 1,155 € 800 € 1,407 € 1,000
Later € 3,774 € 2,470 € 2,468 € 2,360 € 2,592 € 3,875 € 3,473 € 2,940 € 3,275 € 2,687 € 3,152 € 3,977 € 6,824
€ 0
€ 1,000
€ 2,000
€ 3,000
€ 4,000
€ 5,000
€ 6,000
€ 7,000
€ 8,000 Amount Raised (€M)

V E N T U R E C A P I T A L R E P O R T
EQUITY FINANCINGS IN EUROPEAN VC-BACKED COMPANIES, MEDIAN DEAL SIZE (2016–2019)
6
FINANCING
2Q'16 3Q'16 4Q'16 1Q'17 2Q'17 3Q'17 4Q'17 1Q'18 2Q'18 3Q'18 4Q'18 1Q'19 2Q'19
Median Equity Deal Size (€M) € 1.41 € 1.57 € 1.73 € 2.00 € 1.65 € 2.00 € 1.58 € 1.80 € 2.50 € 2.50 € 2.00 € 2.67 € 2.60
€ 0.00
€ 0.50
€ 1.00
€ 1.50
€ 2.00
€ 2.50
€ 3.00 Median Equity Deal Size [€M]
V E N T U R E C A P I T A L R E P O R T
EQUITY INVESTMENT IN EUROPEAN VC-BACKED COMPANIES BY INDUSTRY GROUP (2Q 2019)
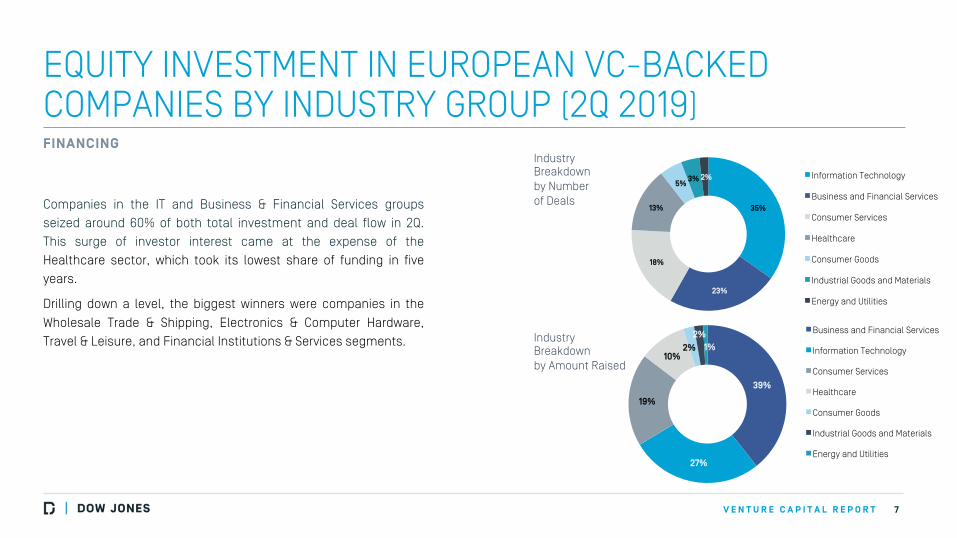
Companies in the IT and Business & Financial Services groups
seized around 60% of both total investment and deal flow in 2Q.
This surge of investor interest came at the expense of the
Healthcare sector, which took its lowest share of funding in five
years.
Drilling down a level, the biggest winners were companies in the
Wholesale Trade & Shipping, Electronics & Computer Hardware,
Travel & Leisure, and Financial Institutions & Services segments.
7
FINANCING Industry Breakdown by Number of Deals
Industry Breakdown by Amount Raised
35%
23%
18%
13%
5% 3% 2% Information Technology
Business and Financial Services
Consumer Services
Healthcare
Consumer Goods
Industrial Goods and Materials
Energy and Utilities
39%
27%
19%
10% 2%
2% 1%
Business and Financial Services
Information Technology
Consumer Services
Healthcare
Consumer Goods
Industrial Goods and Materials
Energy and Utilities
V E N T U R E C A P I T A L R E P O R T
TOP EUROPEAN EQUITY DEALS (2Q 2019)
8
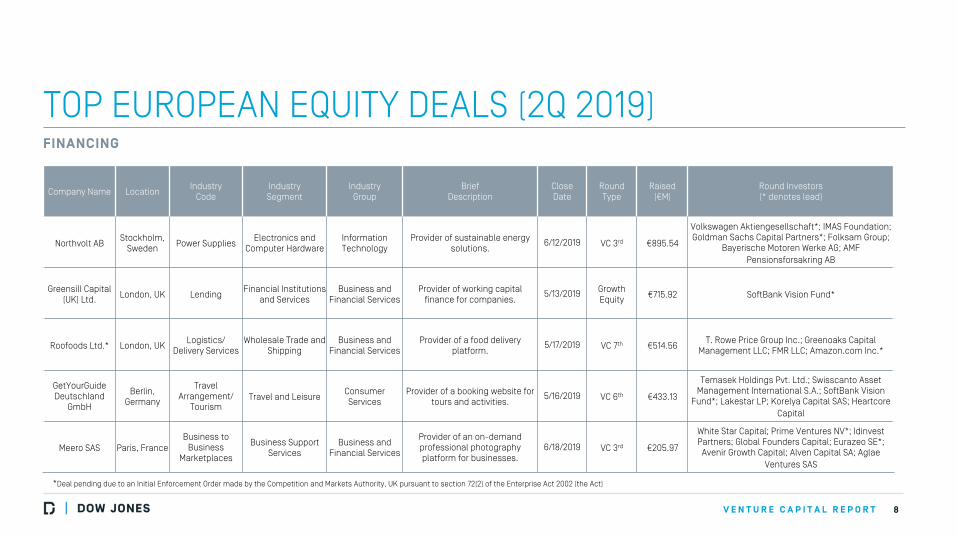
Company Name Location Industry
Code Industry Segment
Industry Group
Brief Description
Close Date
Round Type
Raised (€M)
Round Investors (* denotes lead)
Northvolt AB Stockholm,
Sweden Power Supplies
Electronics and Computer Hardware
Information Technology
Provider of sustainable energy solutions.
6/12/2019 VC 3rd €895.54
Volkswagen Aktiengesellschaft*; IMAS Foundation; Goldman Sachs Capital Partners*; Folksam Group;
Bayerische Motoren Werke AG; AMF Pensionsforsakring AB
Greensill Capital (UK) Ltd.
London, UK Lending Financial Institutions
and Services Business and
Financial Services Provider of working capital
finance for companies. 5/13/2019 Growth
Equity €715.92 SoftBank Vision Fund*
Roofoods Ltd.* London, UK Logistics/
Delivery Services Wholesale Trade and
Shipping Business and
Financial Services Provider of a food delivery
platform. 5/17/2019 VC 7th €514.56
T. Rowe Price Group Inc.; Greenoaks Capital Management LLC; FMR LLC; Amazon.com Inc.*
GetYourGuide Deutschland
GmbH
Berlin, Germany
Travel Arrangement/
Tourism Travel and Leisure
Consumer Services
Provider of a booking website for tours and activities.
5/16/2019 VC 6th €433.13
Temasek Holdings Pvt. Ltd.; Swisscanto Asset Management International S.A.; SoftBank Vision
Fund*; Lakestar LP; Korelya Capital SAS; Heartcore Capital
Meero SAS Paris, France Business to
Business Marketplaces
Business Support Services
Business and Financial Services
Provider of an on-demand professional photography platform for businesses.
6/18/2019 VC 3rd €205.97
White Star Capital; Prime Ventures NV*; Idinvest Partners; Global Founders Capital; Eurazeo SE*;
Avenir Growth Capital; Alven Capital SA; Aglae Ventures SAS
FINANCING
*Deal pending due to an Initial Enforcement Order made by the Competition and Markets Authority, UK pursuant to section 72(2) of the Enterprise Act 2002 (the Act)
V E N T U R E C A P I T A L R E P O R T
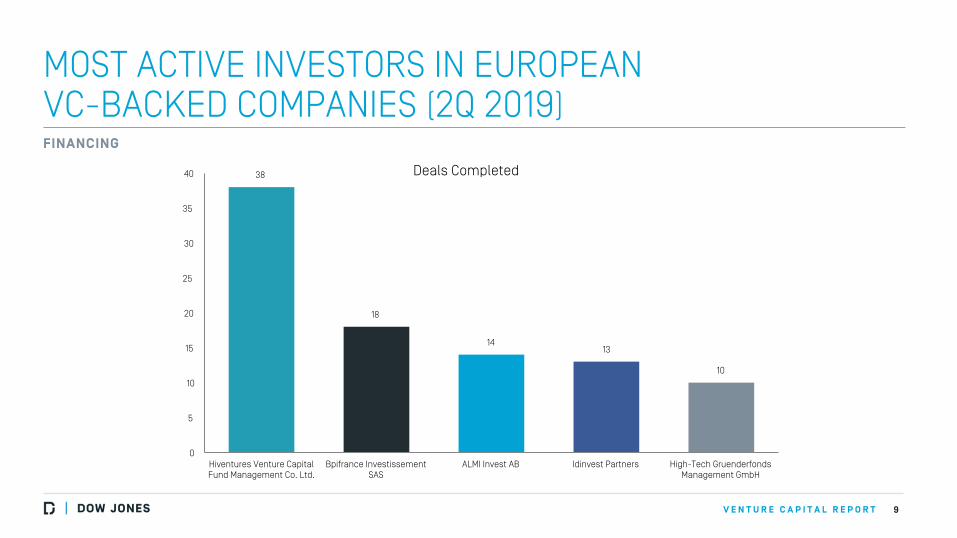
MOST ACTIVE INVESTORS IN EUROPEAN VC-BACKED COMPANIES (2Q 2019)
9
FINANCING
38
18
14 13
10
0
5
10
15
20
25
30
35
40
Hiventures Venture Capital Fund Management Co. Ltd.
Bpifrance Investissement SAS
ALMI Invest AB Idinvest Partners High-Tech Gruenderfonds Management GmbH
Deals Completed
V E N T U R E C A P I T A L R E P O R T
EQUITY FINANCING ROUNDS FOR EUROPEAN VC-BACKED COMPANIES BY COUNTRY (2Q 2019)
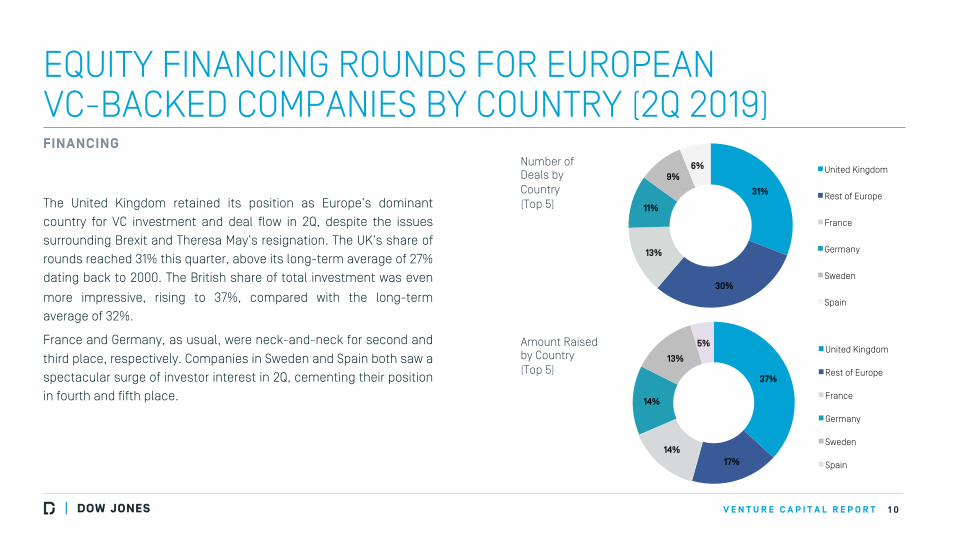
The United Kingdom retained its position as Europe’s dominant
country for VC investment and deal flow in 2Q, despite the issues
surrounding Brexit and Theresa May’s resignation. The UK’s share of
rounds reached 31% this quarter, above its long-term average of 27%
dating back to 2000. The British share of total investment was even
more impressive, rising to 37%, compared with the long-term
average of 32%.
France and Germany, as usual, were neck-and-neck for second and
third place, respectively. Companies in Sweden and Spain both saw a
spectacular surge of investor interest in 2Q, cementing their position
in fourth and fifth place.
1 0
FINANCING Number of Deals by Country (Top 5)
Amount Raised by Country (Top 5)
23%
19%
31%
30%
13%
11%
9% 6% United Kingdom
Rest of Europe
France
Germany
Sweden
Spain
37%
17% 14%
14%
13%
5% United Kingdom
Rest of Europe
France
Germany
Sweden
Spain
V E N T U R E C A P I T A L R E P O R T
VC FUNDRAISING SPRINGS BACK WITH BEST QUARTER IN 3 YEARS
1 1
FUNDRAISING
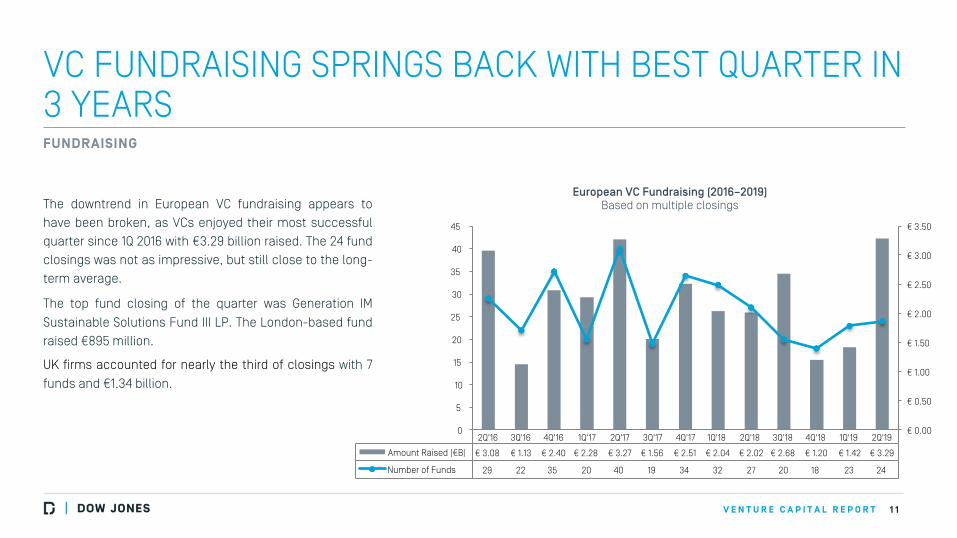
European VC Fundraising (2016–2019) Based on multiple closings The downtrend in European VC fundraising appears to
have been broken, as VCs enjoyed their most successful
quarter since 1Q 2016 with €3.29 billion raised. The 24 fund
closings was not as impressive, but still close to the long-
term average.
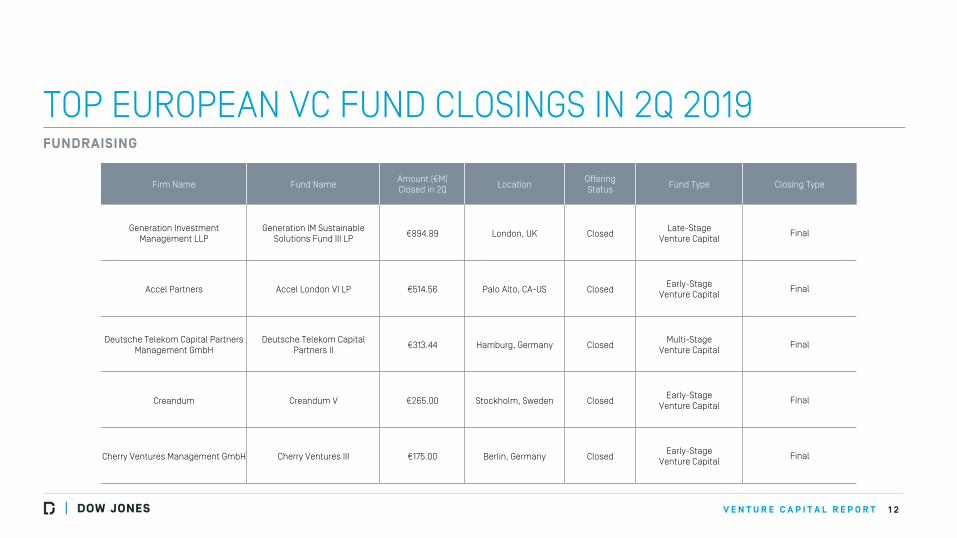
The top fund closing of the quarter was Generation IM
Sustainable Solutions Fund III LP. The London-based fund
raised €895 million.
UK firms accounted for nearly the third of closings with 7
funds and €1.34 billion.
2Q'16 3Q'16 4Q'16 1Q'17 2Q'17 3Q'17 4Q'17 1Q'18 2Q'18 3Q'18 4Q'18 1Q'19 2Q'19
Amount Raised (€B) € 3.08 € 1.13 € 2.40 € 2.28 € 3.27 € 1.56 € 2.51 € 2.04 € 2.02 € 2.68 € 1.20 € 1.42 € 3.29
Number of Funds 29 22 35 20 40 19 34 32 27 20 18 23 24
0
5
10
15
20
25
30
35
40
45
€ 0.00
€ 0.50
€ 1.00
€ 1.50
€ 2.00
€ 2.50
€ 3.00
€ 3.50
V E N T U R E C A P I T A L R E P O R T
TOP EUROPEAN VC FUND CLOSINGS IN 2Q 2019
1 2
FUNDRAISING
Firm Name Fund Name Amount (€M) Closed in 2Q
Location Offering Status
Fund Type Closing Type
Generation Investment Management LLP
Generation IM Sustainable Solutions Fund III LP
€894.89 London, UK Closed Late-Stage
Venture Capital Final
Accel Partners Accel London VI LP €514.56 Palo Alto, CA-US Closed Early-Stage
Venture Capital Final
Deutsche Telekom Capital Partners Management GmbH
Deutsche Telekom Capital Partners II
€313.44 Hamburg, Germany Closed Multi-Stage
Venture Capital Final
Creandum Creandum V €265.00 Stockholm, Sweden Closed Early-Stage
Venture Capital Final
Cherry Ventures Management GmbH Cherry Ventures III €175.00 Berlin, Germany Closed Early-Stage
Venture Capital Final
V E N T U R E C A P I T A L R E P O R T
EUROPEAN VENTURE CAPITAL EXIT ACTIVITY (2016-2019)
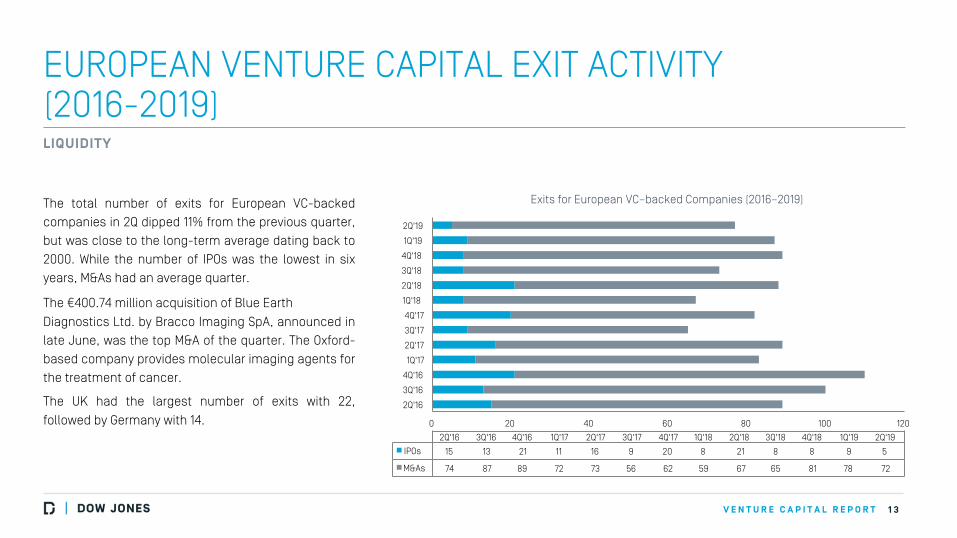
The total number of exits for European VC-backed
companies in 2Q dipped 11% from the previous quarter,
but was close to the long-term average dating back to
2000. While the number of IPOs was the lowest in six
years, M&As had an average quarter.
The €400.74 million acquisition of Blue Earth
Diagnostics Ltd. by Bracco Imaging SpA, announced in
late June, was the top M&A of the quarter. The Oxford-
based company provides molecular imaging agents for
the treatment of cancer.
The UK had the largest number of exits with 22,
followed by Germany with 14.
1 3
LIQUIDITY
Exits for European VC–backed Companies (2016–2019)
0 20 40 60 80 100 120
2Q'16
3Q'16
4Q'16
1Q'17
2Q'17
3Q'17
4Q'17
1Q'18
2Q'18
3Q'18
4Q'18
1Q'19
2Q'19
2Q'16 3Q'16 4Q'16 1Q'17 2Q'17 3Q'17 4Q'17 1Q'18 2Q'18 3Q'18 4Q'18 1Q'19 2Q'19
IPOs 15 13 21 11 16 9 20 8 21 8 8 9 5
M&As 74 87 89 72 73 56 62 59 67 65 81 78 72

V E N T U R E C A P I T A L R E P O R T
TOP M&As IN EUROPE (2Q 2019)
1 4
Company Name Location Brief
Description Industry
Code Industry Segment Industry Group
Close Date
Round Type
Amount Paid (€M)
Acquirer
Blue Earth Diagnostics Ltd.* Oxford, UK
Provider of molecular imaging agents for the treatment of
cancer.
Diagnostic Imaging Equipment
Medical Devices and Equipment
Healthcare 6/27/2019 Acquisition €400.74 Bracco Imaging SpA
Therachon Holding AG
Basel, Switzerland
Developer of therapeutics for serious, rare conditions.
Biotechnology Therapeutics
Biopharmaceuticals Healthcare 5/8/2019 Acquisition €304.26 Pfizer Inc.
Drivy SAS Paris, France Provider of a peer-to-peer car
rental online platform. Shopping
Facilitators Consumer
Information Services Consumer Services 4/24/2019 Acquisition €267.75 Getaround Inc.
LIQUIDITY
*Deal pending regulatory approval
V E N T U R E C A P I T A L R E P O R T
EUROPEAN VC-BACKED IPOs (2016-2019)
1 5
LIQUIDITY
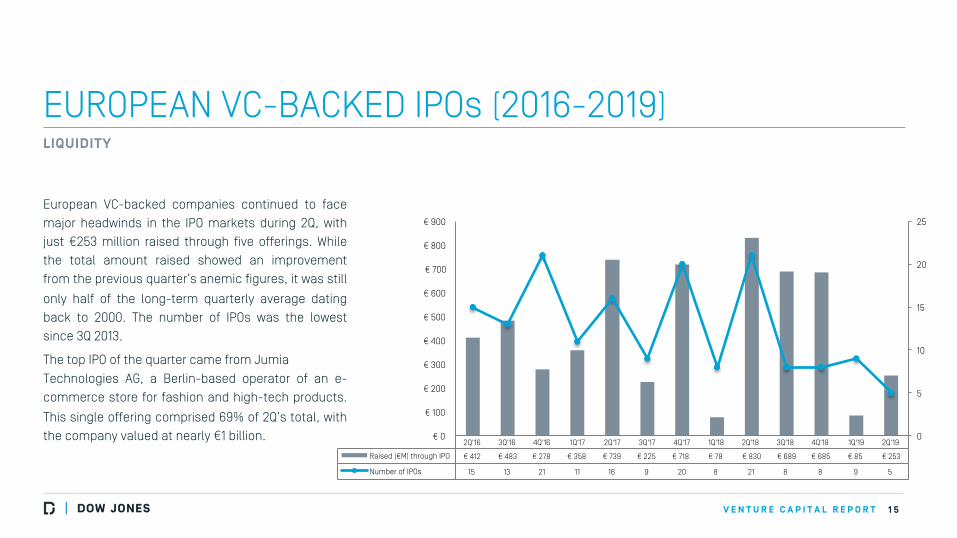
European VC-backed companies continued to face
major headwinds in the IPO markets during 2Q, with
just €253 million raised through five offerings. While
the total amount raised showed an improvement
from the previous quarter’s anemic figures, it was still
only half of the long-term quarterly average dating
back to 2000. The number of IPOs was the lowest
since 3Q 2013.
The top IPO of the quarter came from Jumia
Technologies AG, a Berlin-based operator of an e-
commerce store for fashion and high-tech products.
This single offering comprised 69% of 2Q’s total, with
the company valued at nearly €1 billion.
2Q'16 3Q'16 4Q'16 1Q'17 2Q'17 3Q'17 4Q'17 1Q'18 2Q'18 3Q'18 4Q'18 1Q'19 2Q'19
Raised (€M) through IPO € 412 € 483 € 278 € 358 € 739 € 225 € 718 € 78 € 830 € 689 € 685 € 85 € 253
Number of IPOs 15 13 21 11 16 9 20 8 21 8 8 9 5
0
5
10
15
20
25
€ 0
€ 100
€ 200
€ 300
€ 400
€ 500
€ 600
€ 700
€ 800
€ 900
V E N T U R E C A P I T A L R E P O R T
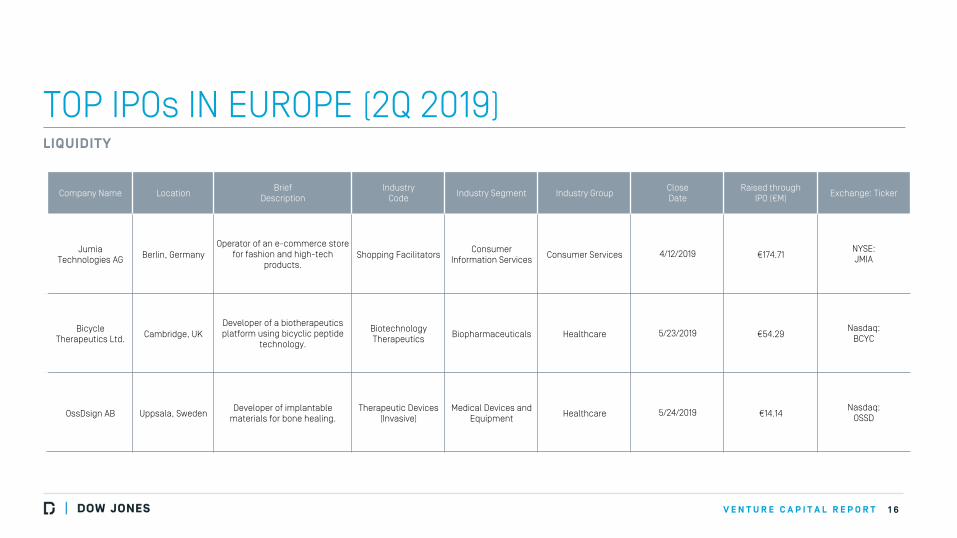
TOP IPOs IN EUROPE (2Q 2019)
1 6
LIQUIDITY
Company Name Location Brief
Description Industry
Code Industry Segment Industry Group
Close Date
Raised through IPO (€M)
Exchange: Ticker
Jumia Technologies AG
Berlin, Germany Operator of an e-commerce store
for fashion and high-tech products.
Shopping Facilitators Consumer
Information Services Consumer Services 4/12/2019 €174.71
NYSE: JMIA
Bicycle Therapeutics Ltd.
Cambridge, UK Developer of a biotherapeutics platform using bicyclic peptide
technology.
Biotechnology Therapeutics
Biopharmaceuticals Healthcare 5/23/2019 €54.29 Nasdaq:
BCYC
OssDsign AB Uppsala, Sweden Developer of implantable
materials for bone healing. Therapeutic Devices
(Invasive) Medical Devices and
Equipment Healthcare 5/24/2019 €14.14
Nasdaq: OSSD
V E N T U R E C A P I T A L R E P O R T
ABOUT US & METHODOLOGY
Dow Jones VentureSource helps venture capitalists, corporate development executives, investment bankers and service providers find deal and
partnership opportunities, perform comprehensive due diligence and examine trends in venture capital investment, fund-raising and liquidity. It provides
accurate, comprehensive data on venture-backed companies – including their investors and executives – in every region, industry and stage of
development throughout the world.
The investment figures included in this report cover venture backed companies headquartered in Europe, and are based on aggregate findings of Dow
Jones’ proprietary research for VentureSource.
This data was collected through surveys of professional firms, interviews with company executives, and from secondary sources. To be included,
companies have to receive financing from a venture capital or private equity firm. Our figures do not include companies that have received funding solely
from individual, corporate and/or government investors. The data in this report only accounts for equity funding, not convertible debt deals.
Figures contained throughout the report are current at time of editorial but subject to change without notice. No statement herein is to be construed as a
recommendation to buy or sell securities, or to provide investment advice.
1 7
V E N T U R E C A P I T A L R E P O R T
ABOUT DOW JONES
Dow Jones is a global provider of news and business information, delivering content to consumers and organizations around the world across multiple
formats, including print, digital, mobile and live events. Dow Jones has produced unrivaled quality content for more than 125 years and today has one of
the world’s largest newsgathering operations globally. It produces leading publications and products including the flagship Wall Street Journal,
America’s largest newspaper by paid circulation; Factiva, Barron’s, MarketWatch, Financial News, DJX, Dow Jones Risk & Compliance, Dow Jones
Newswires, and Dow Jones VentureSource.
MEDIA CONTACT:
Sophie Bent
+44 (0) 203 426 1381
1 8