renewable vs. non-renewable resources as … and st. marie apsa...renewable vs. non-renewable...
TRANSCRIPT
Renewable vs. Non-Renewable Resources as Causes
of Conflict in Sub-Saharan Africa, a Time-series
Analysis: 1970-2000
Samuel S. Stanton, Jr.
Grove City College
Joseph J. St. Marie
University of Southern Mississippi
Prepared for presentation at the American Political Science Association Annual
Meeting 2008, Boston, MA.
PLEASE DO NOT CITE WITHOUT PERMISSION OF THE AUTHORS
1
Renewable vs. Non-Renewable Resources as Causes of Conflict in
Sub-Saharan Africa, a Time-series Analysis: 1970-2000
Truly the “Heart of Darkness” appears to remain a “fire zone. Where
poets speak their heart then bleed for it.”1 Over the past thirty-five years, non-
African developing countries experienced a decrease, while African countries
experienced an increase in the outbreak of civil war (Collier and Hoeffler, 2002).
While Africa and Asia are the primary locations of civil war today and were the
primary locations of civil war during the Cold War, this work focuses on Sub-
Saharan Africa. We choose Africa because of the growing publicity African
conflicts receive and because of the general focus on Africa and Asia that
emerges in the literature on civil war.
Civil War
The current primary arguments about civil war consider the importance of
greed vs. grievance in explaining human behavior (Collier 1999, 2002, 2007,
Fearon and Laitin 2003, Oechslin 2006). Greed vs. grievance has been further
amended to consider feasibility (economic viability) and motivation (socio-
political inequality), with the caveat that greed promotes feasibility of civil war
and grievance is more motivational. This paper examines both economic
feasibility and socio-political inequality perspectives as greed vs. grievance in the
examination of civil war in Sub-Saharan Africa. Creating a nexus between the
literature on resource wars and renewable natural resource scarcities, this
research analyzes the affects certain resources (both renewable and non-
renewable) have on the occurrence, duration, and magnitude of civil wars in sub-
Saharan Africa.
This paper examines oil, diamonds and forested land2 as non-renewable
resources that feed the greed and feasibility hypotheses. The paper examines
freshwater and arable land, as renewable natural resource causes of civil war.
Renewable natural resources are sources of inequality that lead to grievance and
motivation for conflict.
The importance of continued study of civil war falls into three areas. First,
while conflict appears to be subsiding in the world, civil wars do continue and
according to Bennett and Stam (1996) civil wars last about last about seven (7)
1 Borrowed from Robert Conrad and from the lyrics of “One Tree Hill” by U2.
2 We are well aware that trees are a renewable natural resource. However, the demand for forestry
products, particularly derived from old growth hardwoods, leads us to accept arguments that forestry
products are part of the resources governments and rebels covet control over for monetary reasons.
2
years, while international conflicts last only about eleven (11) months on average.
Secondly, civil wars are fought between parties that share and if both survive,
will continue to share the same territorial limitations (as created by international
borders) after the conflict concludes. Finally, civil war can be viewed as a
conflict where defeat can mean the end of the existence of one or more parties to
the war, making compromise in the settlement of the conflict difficult at best
(Licklider, 1995).
The primary question we seek to answer in this paper is: whether greed or
grievance natural resources provide a better causal explanation for civil war in Sub-
Saharan Africa. We examine the years 1970 to 2000 utilizing data from the
Correlates of War, Civil War (Singer and Small 1994, updated by Collier, et al.
2007) using cross-sectional time-series models to test the impact of the greed vs.
grievance hypotheses on the occurrence, duration and magnitude of civil wars in
sub-Saharan Africa. Preliminary indications find a stronger case is made for
grievance and motivation hypotheses in the explanation of civil wars in Sub-
Saharan Africa.
To answer this intriguing question we divide the paper into six sections.
The first and second examine civil war and its causes. The Greed versus
Grievance hypotheses are introduced and explained. The third section outlines
the hypotheses we use in testing our models. The fourth section introduces the
data and explains the variables used in the analysis. The fifth section presents
the results of the statistical analysis. Finally, we will offer some conclusions
about the greed vs. grievance arguments, the veracity and quality of our own
effort, and the direction for future research on civil war in Sub-Saharan Africa.
The Causes of Civil War
We must first establish the definitions of “greed” and “grievance” before
looking at what exact factors are considered in testing these general ideas as
causes of civil war. Greed quite simply is the desire to accumulate more of
something to yourself or to the group you represent. In most cases of greed the
desired object has monetary value. Accumulating a large amount of something
of monetary value is perceived and in many cases translated into political power.
Simply put, wealth begets wealth. Grievance refers to a person or group of
people who are socially or politically differentiated from others, perhaps another
ethnic or religious group. The reality or the perception on the part of the
aggrieved group is that this differentiation, be it artificial or real, is negative
toward them. This is akin to an in-group/out-group situation where benefits
flow to the in-group but not he out-group creating hostility. An example of
3
extreme grievance would be a constitutional provision that prohibited members
of a certain group within the population from all forms of political participation
in the state. This group would definitely be aggrieved.
The Greed Hypothesis
At the center of the greed v. grievance debate is the work of Paul Collier,
who along with Anke Hoeffler and others have authored several works in the
last decade arguing that greed is the primary cause of civil war based on study of
income growth, plunder of natural resources, financial ability to maintain
military activity.3 Greed by all apprearance allows rebel movements to maintain
viability (Collier 1999, 2007; Collier and Hoeffler 1999; Humphreys 2002).
The primary argument of the greed hypothesis is that groups challenge
the state for control of resources of monetary value. The resources primarily fall
into what would be considered non-renewable natural resources. Non-
renewable natural resources are those resources that take over one human
generation to replenish themselves. Most non-renewable natural resources
require hundreds of years to regenerate and require great human effort to
retrieve. Among the resources that are considered to be non-renewable would
be oil, natural gas, diamonds, gold and silver, gemstones, and minerals. One
renewable natural resource is usually accepted as a greed resource—forests.
Forests provide a readily accessible source of both income and cover. While our
paper is about renewable vs. non-renewable resources, we will allow forested
land to act as a greed resource rather than a grievance resource.
Most of the recent research has tested the greed hypothesis. Greed has
been tested primarily in terms of commodity exports and done in either 5 year
periods or country years (Collier and Hoeffler 2002, DeRouen and Sobek 2004,
Fearon 2005). It has also been tested using income and economic growth (Collier
and Hoeffler 2002, Fearon 2005). If studied in 5 year periods, exports and
economic growth show a statistically significant relationship with civil war onset
(Collier and Hoeffler 2002, Fearon 2005), but not when studied in country year
format (Fearon 2005). In DeRouen and Sobek (2004) exports showed statistical
significance in relation to multiple forms of civil war termination. Fearon (2004)
includes contraband (illegal drugs, illegal trade in precious gems and minerals)
in his study and finds that contraband was statistically significant in relation to
civil war duration. Hegre etal (2001) include a variable called “development” in
3 Normally this citation would be given in text, but length leads to this footnote. Collier (1999, 2000, 2001,
2007); Collier and Hoeffler (2002, 2004), Collier, Hoeffler and Söderbom (2006); Collier, Hoeffler and
Rohner (2007); Collier and Sambanis (2002).
4
their model, which measures per capita energy consumption (2001, 37) yet did
not find it to be related to outbreak of civil war. This is important to note for
greed arguments, as control of energy production resources is pootentially a
great source of wealth. Lujala et al (2005) finds the presence and production of
both primary and secondary diamonds are statistically significant in relation to
civil war onset between 1945 and 1999. DeRouen and Sobek (2004) included a
variable measuring forested land and found this to statistically significant in
relation to multiple forms of civil war termination.
The Grievance Hypothesis
Grievance has also been tested repeatedly. Grievance is tested primarily
in terms of political form, linguistic differences, and religious differences
(DeRouen and Sobek 2004, Fearon 2004, 2005, Hegre etal 2001). The U-shaped
curve has been repeatedly demonstrated in these studies, showing conflict more
likely in transitionary states found in the lower scores of autocracy and
democracy than in either highly authoritarian or highly democratic states.
Interestingly ethnic fractionalization measured by ethnic linguistic
fractionalization (ELF) has not show itself to be highly related to onset or
duration of civil war, except when measured in five year periods (Fearon 2005).
Our work looks primarily are resources as the elements of greed and
grievance. Ross (2004) offers four (4) conclusions about resources and civil war.
1) oil dependence is linked to civil war onset, but not duration;
2) gemstones, opium, coca, and cannabis are not linked to onset, but
lengthen existing wars, and timber’s role is untested;
3) no statistical evidence links agricultural commodities to initiation or
duration of civil war;
4) claims that primary commodities are associated with the onset of civil
war are not very robust (Ross 2004, 352).
Ross is correct in stating that statistical evidence does not exist about agricultural
commodities as a cause of civil war. This does not mean that agriculture per se
has not been considered as an element of conflict. In studying the effects of
resource degradation on conflict behavior, Porter (1995) Baechler (1998), Homer-
Dixon (1994, 1999), and Klare (2001) each point out the negative affects of
resource degradation on the welfare of a society. Baechler and Homer-Dixon
particularly note the causal relation of resource degradation to conflict behavior.
5
These scholars have also focused on renewable natural resources as
sources of conflict. Homer-Dixon (1999) refers to the social consequences of
renewable natural resource scarcity and how this may lead to conflict. Of the
renewable natural resources considered by scholars studying the relationship
with conflict behavior, freshwater, arable land, and forested land are those most
often considered to have a strong relationship with conflict behavior (Baechler
1998, Deudney 1990, Hauge and Ellingsen 1993, Porter 1995)
Renewable natural resources in relation to conflict behavior are most
appropriately viewed as grievance mechanisms. The scarcity of a natural
resource can affect all people in society equally, but scarcity can also be
structural, that is caused by the policy of a state. When scarcity is structural it
has the potential to be used against opponents of the state. An example of this is
a policy that makes ownership of water rights illegal for a certain group in a
society. This group is now deprived of one of the necessary elements of life.
This sort of deprivation is a grievance, desire to have access to a required
element of human life is not greed, it is a desire to survive.
Based on the literature we find there is a categorical difference between
the resources that are greed based (sources of monetary wealth and income gain)
versus grievance resources (those resources necessary to support life). This
resource dichotomy provides an interesting means of studying civil war by
testing both the grievance hypotheses regarding renewable natural resources and
civil conflict and the greed hypotheses of civil war in determining which is a
better explanation for civil war in Sub-Saharan Africa, where both greed
resources and grievance resources are present (often both in abundance in the
same country).
We believe that renewable natural resources are a stronger causal
explanation for civil violence based on the literature of environmental security
and the wide divergence of findings regarding greed resources and civil war.
However, in this work we test greed and grievance equally since there is no
existing research that shows either greed or grievance to be beyond a shadow of
a doubt the stronger cause of civil war.
Hypotheses
The dependent variable in this paper is civil war in sub-Saharan Africa.
This study identifies a conflict as a civil war if it includes organized military
action, at least 1,000 battle deaths in a given year, at least five percent of the
deaths which were inflicted by the weaker party, and the national government at
the time was actively involved, as defined by Singer and Small (1994). These
6
figures will be used from the original Correlates of War (COW) dataset developed
by Singer and Small, as well as the updated Armed Conflict Dataset by Nils Petter
Gleditsch (2002). Our study also considers two important aspects of civil war—
duration, the temporal length of the conflict, and magnitude, the number of
deaths caused by the conflict. With this in mind we offer the following
hypotheses:
Greed based hypotheses:
H1: Presence of greed resource production will cause an increase in the
likelihood of civil war onset
H2: Presence of greed resource production will cause an increase in the
duration of civil war
H3: Presence of greed resource production will cause an increase in the
magnitude of civil war
Grievance based Hypotheses:
H4: Renewable natural resource scarcity will cause an increase in the likelihood
of civil war onset
H5: Renewable natural resource scarcity will cause an increase in the duration of
civil war
H6: Renewable natural resource scarcity will cause an increase in the magnitude
of civil war
We do not discount greed as a potential cause of civil war, even though our
sympathies based on extant literature appear to support grievance. Instead we
propose through our hypotheses to test each with equal rigor. We now turn to a
discussion of the data that will allow us to operationalize concepts found in the
literature and hypotheses and finally to the models used in testing this data.
Data and Variables
Our data is grouped in a country-year format. We examine 46 countries in
continental Sub-Saharan Africa from 1970-2000. The yearly panels are not equal,
as not all countries in Sub-Saharan Africa were independent in every year
covered in this study. The data also does not include the smaller, island-states of
Sub-Saharan Africa, nor does it include Lesotho or Swaziland. The choice to not
7
include these states is based on the large amount of missing data for these
countries. The dataset as complied has 1207 cases.
The dependent variable will test is civil war. We want to test the viability
of greed, measured as natural resources, in relations to three aspects of civil
war—onset, duration, and magnitude. This requires 3 models utilizing 2
different techniques (OLS and Logit regression) for measuring the statistical
relationship.
The first and fourth hypotheses (likelihood of civil war) use a
dichotomous variable, with “0” indicating a lack of civil war and “1” indicating
the occurrence of a civil war. This data was gathered from Nils Petter Gleditsch’s
updated version of the Correlates of War data (2004), originally compiled by
Singer and Small (1994).4 The Correlates of War data is the premier study and
analysis of civil wars. The data shows 202 cases where civil war occurred. In the
vast majority of cases (1511) no civil war occurred. This is of little surprise, as
violent conflict of any type is a rare occurrence.
The second and fifth hypotheses use duration of civil war as the
dependent variable, ranging from “0-12” with “0” indicating a lack of civil war
occurring in that year and increasing to “12” indicating that a civil war
composed all twelve months of that year, using the original COW data for the
years 1960 – 1997 and the Uppsala Conflict Data Program and International
Peace Research Institute, Oslo UCDP/PRIO Armed Conflict Dataset for the years
1998 – 2000 (2002).5 The mean value of duration is .91, indicating that in all 1713
cases an average civil war lasted less than one month. If we exclude the cases
where no civil war occurred in the country-year observed, however, the mean
value of duration is 9.48. This indicates that when a civil war did occur in a
given country in a given year, the average duration of an actual event was
approximately nine and one-half months.
Onset and Duration have been tested repeatedly in the study of civil war.
Magnitude, however, has received less coverage. In part this is due to the
difficulty in measuring magnitude. Is the magnitude of civil war to be construed
simply as the number of battle deaths in a calendar year or is it the total of all
deaths? We must recognize that the magnitude of conflict could be measured in
both military deaths and total deaths. Azam (2002) points out in a limited look at
civilian vs. military deaths in African civil wars, that the differences are often
staggering. For instance in the Angolan Civil War there were 21,000 military
deaths over 16 years (1975-1991) and 320,000 civilian deaths in the Sudan
4 Civil war occurrence data is available at: http://new.prio.no/CSCW-Datasets/
5 Duration of civil war data available at: http://correlatesofwar.org/datasets.htm
8
between 1983 and 1990 there were 10,000 military deaths and 500,000 civilian
deaths (Azam 2002, 132).
Civil war magnitude despite being discussed has not often been tested.
Thus, we propose a test. We test magnatude with the best and most complete
data available which is battle deaths per year. Our two remaining hypotheses
use a scalar dependent variable, measuring the magnitude of each civil war
using the number of battle deaths per year, from 1960 – 1997. This data was
gathered from Bethany Lacina’s Battle Deaths Dataset 1946 – 2005 provided by the
Centre for the Study of Civil War and the International Peace Research Institute,
Oslo (2006).6 While not a perfect measure, the numbers are still sobering to
consider. The mean value of magnitude for all the cases in our data, measured as
battle deaths per year, was 553.60 or roughly 554 battle deaths per year. If we
limit this to actual observed cases of civil war occurrence, the mean value for
magnitude is 5357.79. This indicates that when a civil war did occur in a given
country in a given year, the average number of battle deaths was nearly 5358 per
year.
Independent Variables
Our independent variables fall into two categories, those we believe are
associated with greed and those that are associated with grievance. We address
greed first, and then grievance. Certainly the list for each in not exhaustive, but
given data limitations these variables are the best candidates to conduct our tests.
Moreover, many have been used extensively before in published work
establishing their theoretical significance.
Greed Variables
Oil Producing State This variable measures whether a state was an oil
producing state in the year of observation. 397 of the 1207 cases in our data were
oil producing states in the given year of observation.
One-Third of Export GDP from Fuels Because oil as a resource is a greed
resource, it is necessary to test whether greed comes from larger share of GDP
from the production of oil. This measure is taken from Fearon and Laitin (2003).
119 of 1207 cases were countries in which fuels accounted for one-third or more
of export GDP in the given year.
6 Magnitude of civil war data available at: http://new.prio.no/CSCW-Datasets/
9
Diamond Producing State Diamonds have been argued to be one of the
primary sources of funding for civil war and much of the atrocities in Africa.
The presence of blood diamonds requires that a state be a diamond producing
state. Borrowing from the World Development Indicators we use a dichotomous
variable that measures whether a country was diamond producing. This is not
the best measure possible, which would be volume or dollar amount per year of
diamond production. However, secrecy within that industry makes such
numbers difficult to find and unreliable when found. 440 of 1207 cases were
diamond producing countries in a given year in our dataset.
SXP (Interpolated) Lacking a quality measure for the years 1970-2000 for
actual oil and diamond production we use interpolated sxp (Fearon 2005) a
measure of the percentage of GDP represented by primary commodity exports.
Primary commodities include minerals, ores, metals, and unrefined oil. The
interpolation is necessary because this indicator is only available through the
World Bank in five year measurement points. The mean value of SXP was .1761,
indicating that for the average country in a given year of the data the portion of
export GDP from primary commodities was almost 18%. The highest level of
SXP was 56%. The standard error of the mean is .0039.
Percentage of Lost Forested Land This measure gives the actual amount
of forested land lost in a country in a given year from the amount of forested
land present in the previous year. We use this measure to test for economic gain
from timbering, which if reports in many news sources are to be believed, is a
major source of deforestation. This percentage is based on forested land
estimates found in CIA, Keesing’s World Record, United Nations, and World
Development Indicator data. The mean percentage of lost forested land was
.2216% with a standard error of .0298. For most countries the sources used
indicate the loss of no forested land (1096 of 1207 cases have loss of 0%). At the
extreme end of the spectrum one country reported in one year the loss of 20% of
forested land.
For each of the above variables we also have created one and two year
lagged variables. It is entirely likely that desire to control wealth generated by
these resources is built over time as those outside and inside government see the
wealth generated by this resource in previous years and determine to take
control of the resource by force in the current year.
10
Grievance Variables
Percentage of Arable Land Lost This measures the percentage of arable
land lost from the previous calendar year. The measurement is based on the
same data sources as forested land. The belief is that land is a grievance resource
given that all people must eat. Conversely it is not greed that makes people
desirous of arable land when most people are involved in subsistence
agriculture—as is the case in Sub-Saharan Africa—it is merely survival. The
average loss of arable land was .2264% with a standard error of .0338. 1103 cases
show no loss of arable land, the extreme case showed loss of 24% of arable land.
Where loss occurred the norms were 1% (47 cases) and 2% (26 cases).
Freshwater Scarcity Accurate data for the cubic feet of freshwater
available in a country is not readily available for most of the world, and
particularly not for much of Sub-Saharan Africa. Simply put, people require
water to live. Not having access to fresh, potable water is a grievance. We turn
to the question of freshwater scarcity and pollution as an environmental concern.
In the CIA country data, Keesing’s country data, and the United Nations country
data, there are a sections that mention environmental concerns. If that section
mentions freshwater scarcity and/or pollution as an environmental concern in at
least two of the three sources, we coded that as a 1 (freshwater scarcity/pollution
present), if this was not listed as a concern in at least two of the sources, we
coded it as 0 (freshwater scarcity/pollution not present). 711 cases showed
freshwater scarcity/pollution was an issue of concern in the country in that year.
495 cases showed no concern for this issue in the country in the given year.
As with greed variable, those things leading to grievance may take time to
fully cause the population or the state to take violent action. A drought may last
only a year before policy is enacted that protects farmers from its ill effects, or
after two years no action may have been taken to protect the farmers and they
may decide it is necessary to take up arms against the state for the purpose of
protecting their lives. Thus, with these variables we also include lagged
variables of one and two years that are tested in our models.
Control Variables
Our independent variables do not exist in a vacuum. Other factors must
be considered as cause and correlates of civil war. We consider four factors that
have been used for a variety of reasons with a variety of results in previous
studies of civil war.
11
Polity This variable is the squared value of the standard polity score
generated by adding the Polity IV autocracy and democracy values. It is squared
because this allows us to see the U-shaped relation of governmental type with
respect to conflict. Those states that are highly autocratic and those that are
highly democratic are less likely to experience civil war. This has been
confirmed in many studies.
Gross Domestic Product Per Capita This allows us to test the general
economic health of a state. It is based on the measure of GDP in millions of U.S.
dollars. This is also a proxy measure in some studies for strength of the state and
relates the ability of the state to avoid violent attempts to harm or destroy the
state.
Ethnic Fractionalization We use the ethnic fractionalization scores as
found in Fearon and Laitin (2003). This allows us to control for the amount of
ethnic divisiveness in a country being a causal factor in organizing for and
engaging in civil violence.
Mountainous Terrain This variable measures the estimated percentage of
mountainous terrain in a country in a given year. This measure is taken from
Fearon and Laitin (2003). It is argued that rebel groups are more likely to form
and actively challenge the government to a greater extent when mountainous
terrain exists for the rebels to return to for protection from government action.
This argument is made more poignant by the use of terrain by terrorists and
tribesmen in the Afghanistan and Pakistan border regions.
Lagged Dependent Variables We also include lags of the dependent
variables in the models. It is always likely, and hardly ever found not
statistically significant, that civil war in the previous year (or duration, or
magnitude) is related to civil war in the current year.
Statistical Analysis
We employ a series of models that are in two formats. As civil war onset
is dichotomous, we use logit models to test the independent variables in relation
to onset. Both civil war duration and civil war magnitude are interval-ratio level
variables and allow us the use regression modeling. Our data are time-series and
cross sectional, however, the year panels are not equal for every country (since,
for instance, Angola was not independent until 1975 there are 26 cases for
Angola and since Nigeria existed independently in 1970 there are 31 cases for
Nigeria). To correct for this we use a generalized model that employs panel
corrected standard errors. The panel corrected standard error time series
12
regression model creates robust standard errors for the models enhancing the
quality of the results.
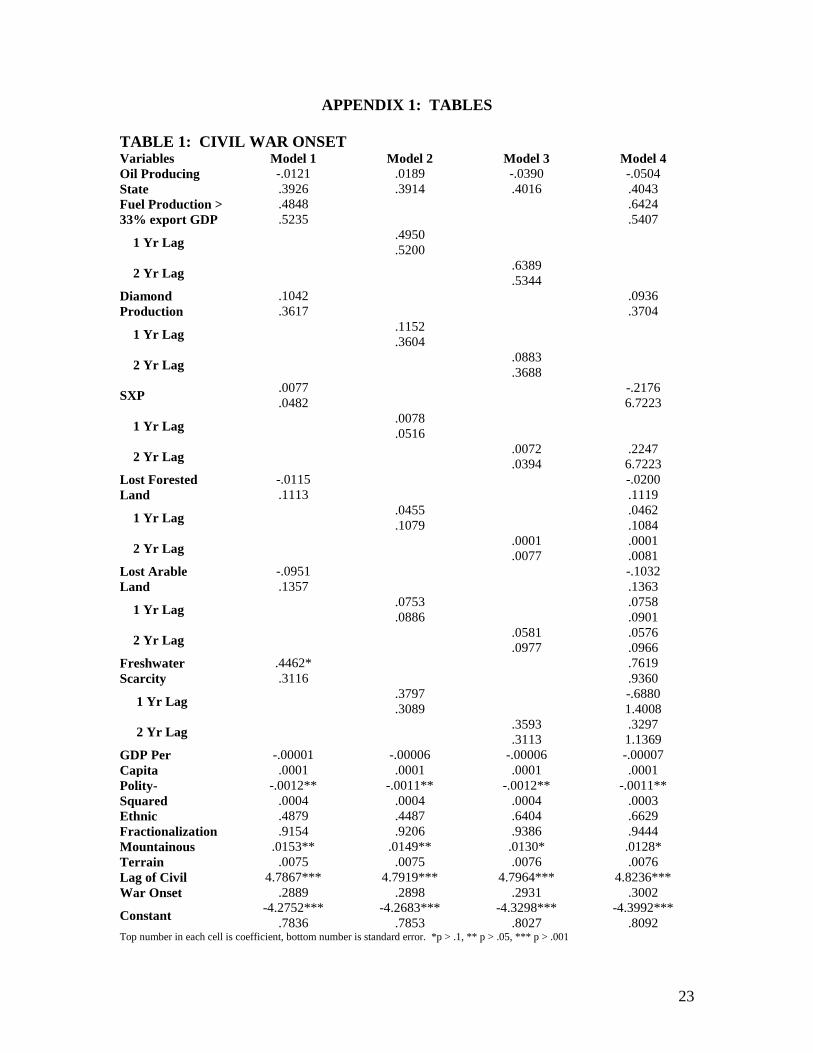
Models 1 through 4, reported in Table 1 are for the logit models with civil
war onset as the dependent variable.7 Model 1 includes only the current year
independent variables. Model 2 employs the one year lag independent variables.
Model 3 employs the two year lag independent variables and model 4 includes
the current year and both one and two year lag variables.8
Model 1 includes 1165 country-year observations. The Log Ratio Χ2 is
580.96 with a probability of .0000 and a Pseudo R2 of .5935.9 Of the independent
variables tested, only freshwater scarcity was found statistically significant and
then only at the .10 level. The control findings were consistent with findings in
previous studies indicating that rebel groups consider having terrain that is
favorable for hiding and defense against superior armed forces a plus when
initiating a civil war and that civil wars generally will not occur in highly
democratic or highly autocratic states.
Model 2 includes 1163 country-year observations. The Log Ratio Χ2 is
580.21 with a probability of .0000 and a Pseudo R2 of .5932. None of the
independent variables tested showed statistical significance in relation to civil
war onset. As with model 1 the control variables showed consistency with
previous studies of civil war onset. The preliminary indication of this model is
that what occurred one year prior to the civil war onset is not correlated or causal
to the event.
Model 3 includes 1122 country-year observations. The Log Ratio Χ2 is
565.31 with a probability of .0000 and a Pseudo R2 of .5944. In the same pattern
as model 2, the independent variables showed not statistically significant
relationships with civil war. The control variables remained consistent in
significance and in the indicated direction of the relationships. The indication of
this model is that resource production and issues from 2 years prior to the event
are not correlated with the onset of civil war.
Model 4 includes 1120 country-year observations. The Log Ratio Χ2 is
566.78 with a probability of .0000 and a Pseudo R2 of .5964. As with the first
three models the independent variables show no statistical significance in
7 Tables are located in Appendix 1.
8 1 and 2 year lags for fuel production greater than 33% of export GDP and diamond production were
dropped due to collinearity with the initial variable from which they were derived. Likewise, sxp lagged 1
year was also dropped due to collinearity with sxp. 9 We do not report the Pseudo R-sq. here as a means of showing fit or explained variance, as this cannot be
done with this statistic. The Pseudo R-Sq used in our models is a count Pseudo R-Sq. which ranges 0-1, in
each of our four logit models the Pseudo R-sq. of the final version of the model is greater than .5 and a
larger value than any of the other iterations of the model we considered.
13
relation to civil war and the control variables are in keeping with the findings of
existing scholarship.
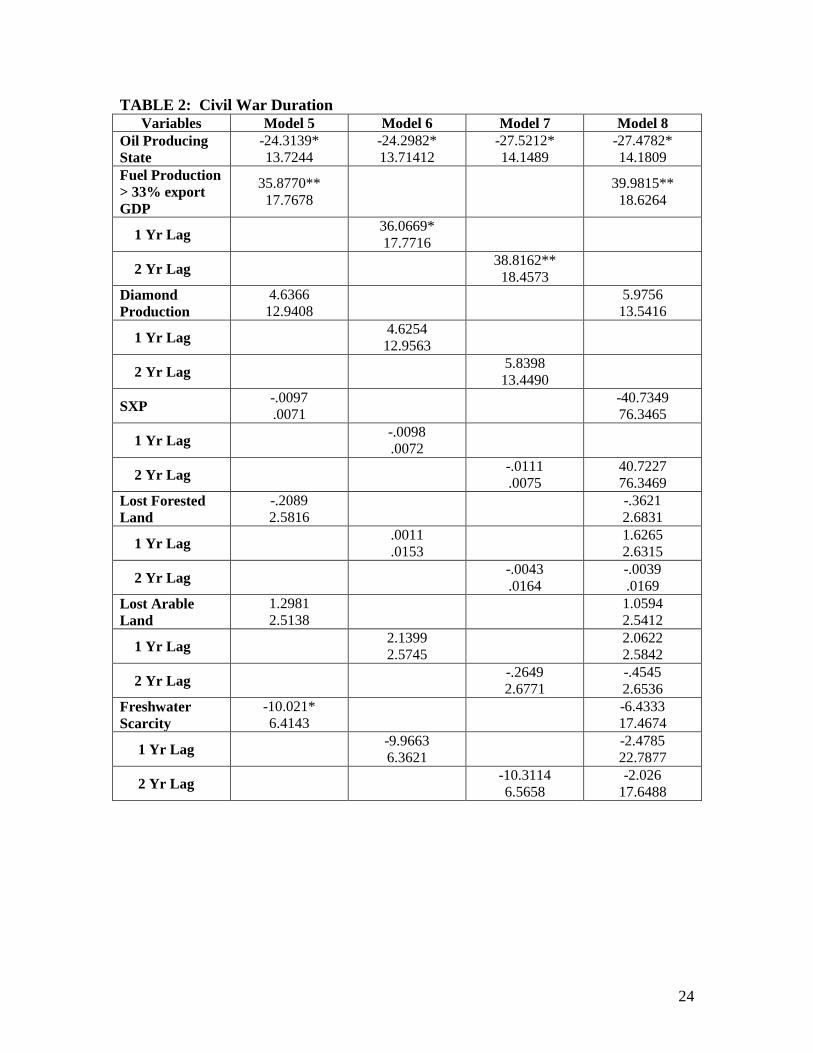
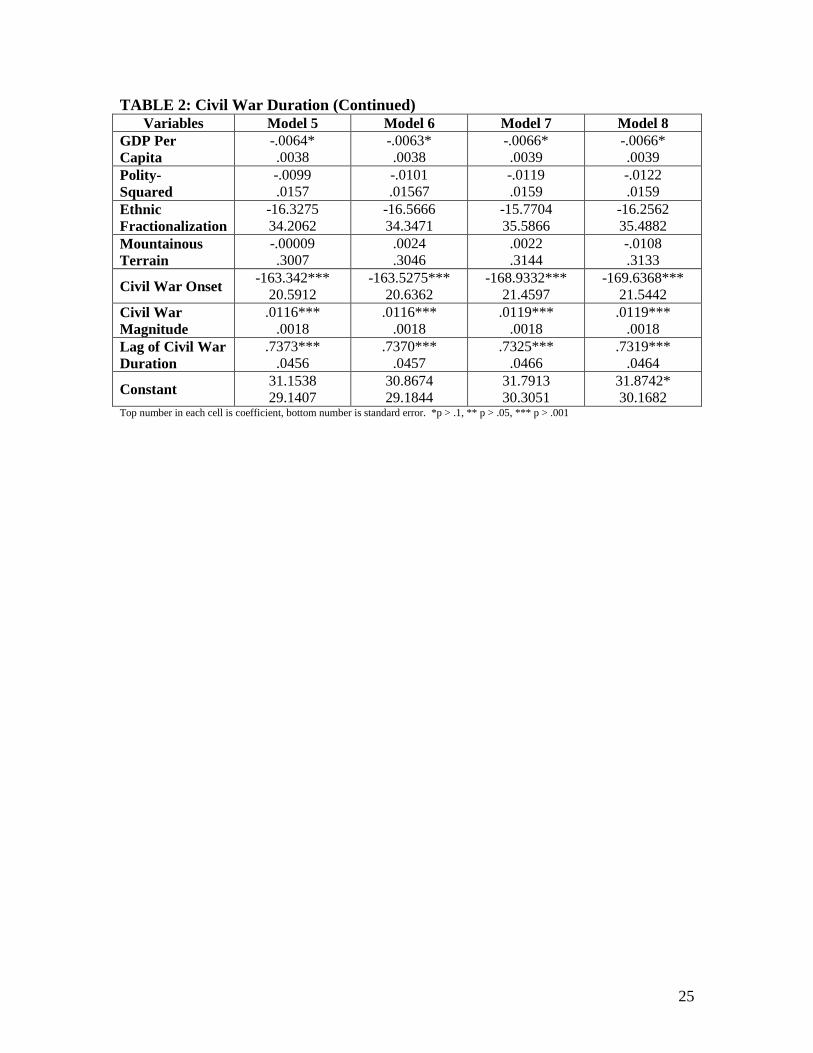
Models 5 through 8 are the time-series regressions with civil war duration
as the dependent variable with the independent variables done in the same
manner as in models 1 through 4. These results are shown in Table 2.10
Model 5, looks at measurements taken in the particular year in relation to
duration in that year and includes 1164 observations. The R2 for this model is
.6873, meaning nearly 69% of variance in civil war duration as measured
(number of months in this year that the conflict lasted) is explained by the
included independent variables. The Wald Χ2 for the model is 741.80 with
probability .0000 indicating a well specified model.
Oil producing states and having fuel exports greater than 33% of export
GDP were both statistically significant in relation to civil war duration. Being an
oil producing state was negative in its direction and 33% or greater export was
positive in its direction. Among the grievance variables freshwater scarcity was
statistically significant but was negative in its direction. GDP Per Capita was
significant and negative in direction. Civil war onset, civil war magnitude, and
the duration of civil war in the previous calendar year were all statistically
significant in relation to civil war duration in the given country in the given year.
Interestingly civil war onset is negatively related to civil war duration in this
model.
If each value of each independent variable is held at its value of central
tendency, the value of Civil War Duration would equal -2.36 months. In short, it
appears civil war is so rare even in one of the world’s most civil war prone areas
that duration is non-existent.11
Model 6, which uses one year lags of the independent variables in relation
to duration in that year, includes 1162 observations. The R2 for this model is
.6874, meaning nearly 69% of variance in civil war duration as measured
(number of months in this year that the conflict lasted) is explained by the
included independent variables. The Wald Χ2 for the model is 733.35 with
probability .0000 indicating a well specified model.
Oil production and fuel exports greater than 33% were both statistically
significant in model 6, with oil production still being negative in direction. No
other independent variables were statistically significant. GDP Per Capita and
Civil War Onset showed negative relationship with duration, and Civil War
Magnitude and the lag of Civil War Duration were both positive and statistically
significant in their relationships with civil war duration. When all of the
10
See fn 8. 11
Equations for models 5-12 are expressed in Appendix 2.
14
statistically significant variables were held at their measure of central tendency,
the value of civil war duration in model 6 is 7.7690 months. This indicates that
with duration past events do have a greater impact than current events.
Model 7, using two year lags of the independent variables, includes 1121
observations. The R2 for this model is .6888, meaning nearly 69% of variance in
civil war duration as measured (number of months in this year that the conflict
lasted) is explained by the included independent variables. The Wald Χ2 for the
model is 752.98 with probability .0000 indicating a well specified model.
The same variables that were significant in model 6 are significant in
model 7. The difference being here they are 2 year lags instead of one year lags.
The directions of the indicated relations remain the same. When all of the
independent variables are held at their measures of central tendency, the value of
civil war duration is 8.4063 months adding more credence to the finding that
events in previous years has greater impact on civil war duration than the events
of the current year.
Model 8 uses current year values plus the 1 and 2 year lag values of the
independent variables and includes 1119 observations. The R2 for this model is
.6892, meaning nearly 69% of variance in civil war duration as measured
(number of months in this year that the conflict lasted) is explained by the
included independent variables. The Wald Χ2 for the model is 753.90 with
probability .0000 indicating a well specified model.
The same variables that were significant in the earlier models remained
significant in this model and maintain the same direction of the relationship.
Freshwater scarcity did not reenter the equation in this model, an interesting
finding that will be discussed in the conclusions. When all of the independent
variables are held at their measures of central tendency, the value of civil war
duration is 8.5082 months adding more credence to the finding that events in
previous years has greater impact on civil war duration than the events of the
current year.
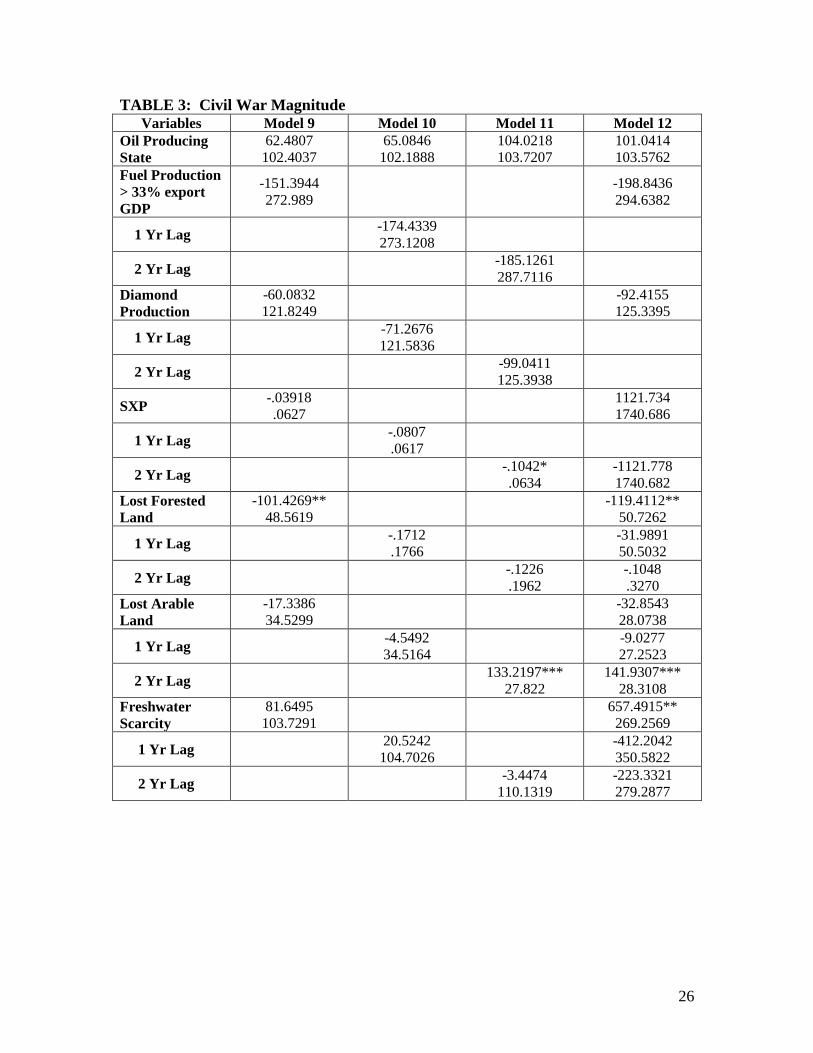
Table 3 records the results for models using civil war magnitude as the
dependent variable. As with the other models we test current and lead year
variables separately and then in a combined model.12
Model 9 uses current year values for the independent variables and has
1163 observations. The R2 for this model is .7020, meaning slightly more than
70% of variance in civil war magnitude is explained by the included independent
variables. The Wald Χ2 for the model is 694.84 with probability .0000 indicating a
well specified model.
12
See fn 8.
15
No grievance variable is significant in model 9, whole only one of the
greed variables is significant—loss of forested land. The direction of the
relationship is negative indicating as timbering activity increased the number of
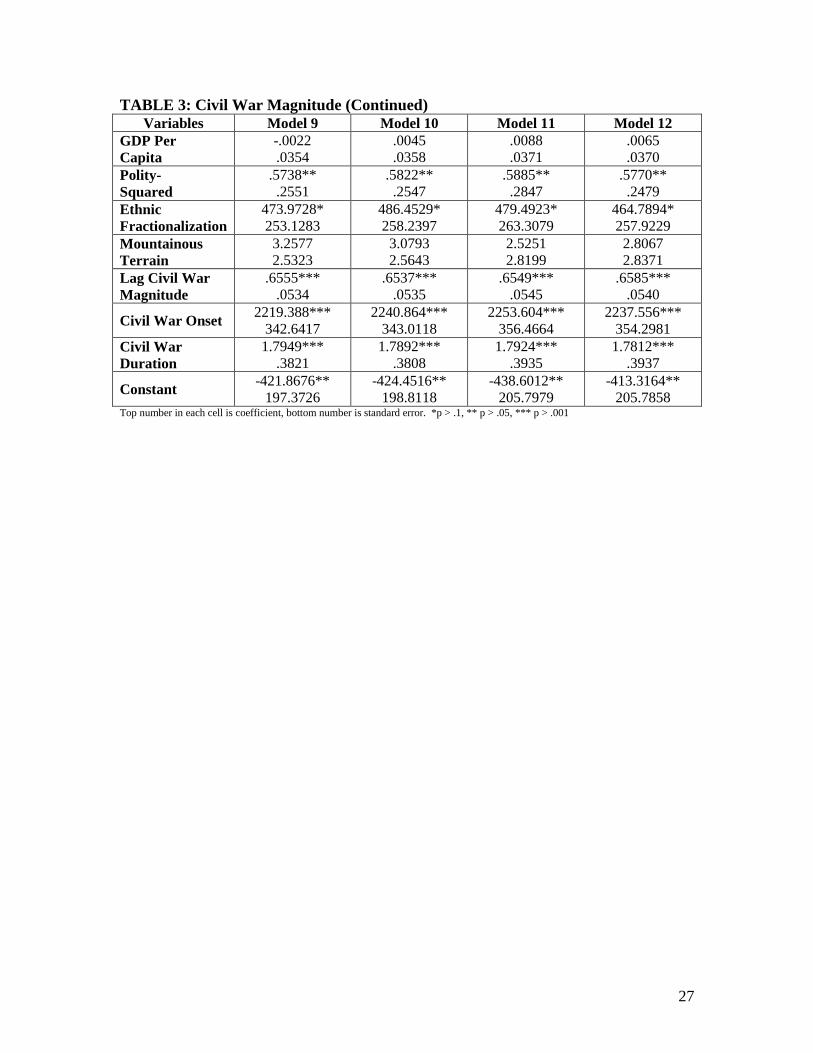
battle deaths per year decreased. Among the controls used polity-squared,
ethnic fractionalization, civil war onset, civil war duration, and the lag of civil
war magnitude were positively correlated and statistically significant
The findings regarding polity-squared and ethnic fractionalization are
interesting. Both highly autocratic regimes and highly democratic regimes can
expect higher magnitude civil war. Sub-Saharan African countries that have
lower heterogeneity of ethnicity can expect to have civil wars of greater
magnitude. If all of the statistically significant variables are held at their measure
of central tendency the magnitude of civil war on average would be 305.0559 or
roughly 300 battle deaths per year per country in Sub-Saharan Africa.
Model 10 uses 1 year lag values for the independent variables and has
1161 observations. The R2 for this model is .7001, meaning slightly more than
70% of variance in civil war magnitude is explained by the included independent
variables. The Wald Χ2 for the model is 682.44 with probability .0000 indicating a
well specified model.
In this model only the same control variables that were significant in
model 9 are significant. None of the greed or grievance variables showed
significance. If all of the statistically significant variables are held at their
measure of central tendency the magnitude of civil war on average would be
459.9097 or roughly 456 battle deaths per year per country in Sub-Saharan Africa.
Model 11 uses 2 year lag values for the independent variables and has
1120 observations. The R2 for this model is .7019, meaning slightly more than
70% of variance in civil war magnitude is explained by the included independent
variables. The Wald Χ2 for the model is 685.93 with probability .0000 indicating a
well specified model.
One greed variable, sxp, and one grievance variable, lost arable land, are
statistically significant when we consider a two year lag of their value in relation
to current year civil war magnitude. The value of sxp is negative in directional
relation to magnitude indicating that increased export value of primary
commodities in previous years leads to lower numbers of battle deaths during a
civil war in the current year. The value of lost arable land is positive in
relationship to magnitude. A probable implication of the arable land finding is
that it takes time for grievance caused by land loss to manifest in human action.
The same control variables were significant in this model as in the previous
magnitude models. If all of the statistically significant variables are held at their
16
measure of central tendency the magnitude of civil war on average would be
466.5636 or roughly 467 battle deaths per year per country in Sub-Saharan Africa.
Model 12 uses 1 and 2 year lag values as wells as the current year values
of the independent variables and has 1118 observations. The R2 for this model is
.7057, meaning slightly more than 70% of variance in civil war magnitude is
explained by the included independent variables. The Wald Χ2 for the model is
735.63 with probability .0000 indicating a well specified model.
One greed variable remains statistically significant in this full model. Lost
forested land remained significant and negative in direction with respect to civil
war magnitude. Two grievance variables were statistically significant, the two
year lag of lost arable land and the current year freshwater scarcity. Both of
these are positively correlated with civil war duration. What is indicated by this
combination is that the past loss of arable land couples with current freshwater
scarcity to increase the level of grievance mobilization into armed conflict.
The control variables found significant in models 9-11 remained
significant and in the same direction in model 12. The overall model indicates an
average value of 1117.5872, or roughly 1118 battle deaths per year per country
when the significant variables are held constant at their central tendency.
Conclusions
Based on findings from our models the data we have tested do not
support hypotheses dealing with the onset of civil war from either the greed or
grievance perspective. Our hypotheses regarding civil war duration are both
supported and contradicted in relation to greed and not supported at all for
grievance. The test of greed and grievance is split again with civil war
magnitude with greed not being supported or being directly contradicted and
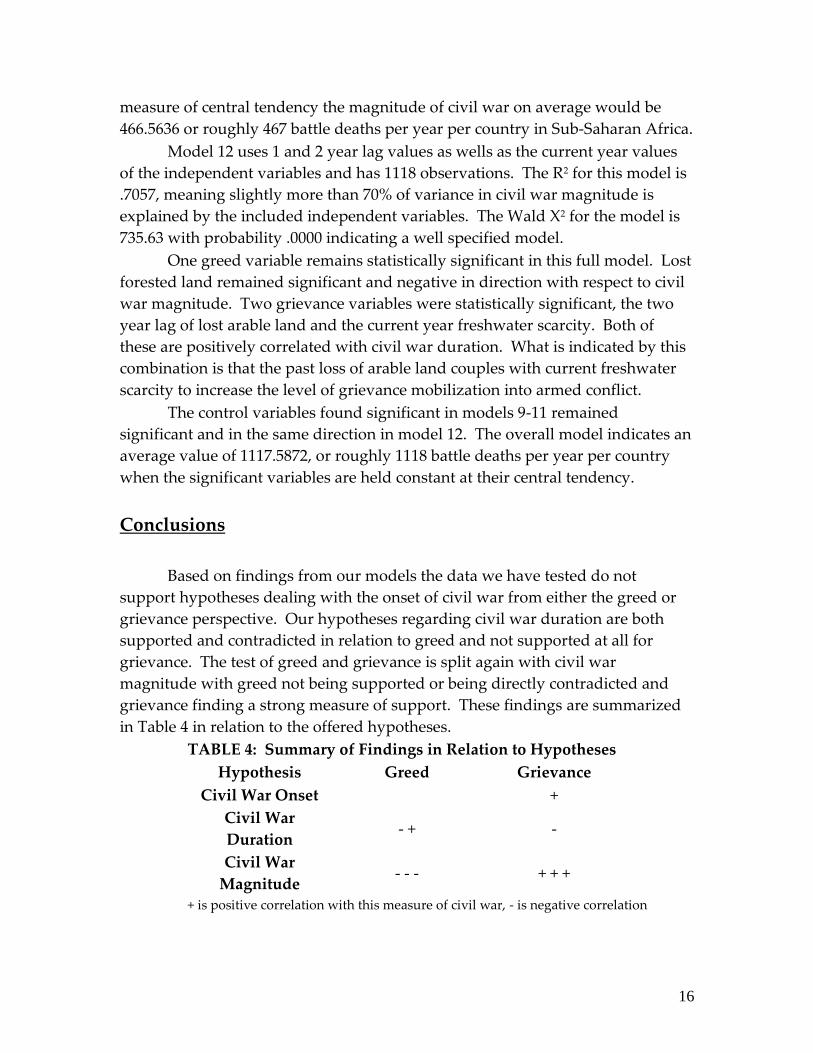
grievance finding a strong measure of support. These findings are summarized
in Table 4 in relation to the offered hypotheses.
TABLE 4: Summary of Findings in Relation to Hypotheses
Hypothesis Greed Grievance
Civil War Onset +
Civil War
Duration - + -
Civil War
Magnitude - - - + + +
+ is positive correlation with this measure of civil war, - is negative correlation
17
Given the number of variations on each of the variables used, there were
28 chances for greed to have positive or negative relation with each measurement
of civil war used. In our models greed was negatively more often than positively
correlated. There were 12 chances for grievance to be positively or negatively
related to civil war. Grievance was positively related four times and negatively
related one time. The most interesting set of findings is in relation to civil war
magnitude. Here greed causes magnitude to diminish and grievance causes
magnitude to increase. It is in the area of civil war magnitude that we also have
our most robust results in relation to the hypotheses offered.
To be sure, civil war is a difficult subject to explain in great detail. What
we believe we have found are unique processes that shed light on how we look
at intrastate political violence. Civil wars are processes not just brush fires that
start quickly, burn hot and then die out as quickly as they start. On the contrary,
civil wars are processes and as such we have utilized models that take this into
account. We believe that our examination of natural resources and civil war
provides a way to unlock the civil war process on a different level than has been
accomplished in previous studies.
Specifically we find that lost land, lost forests and less fresh water are
indeed important but are not immediately important. This seems to indicate that
immediate needs are not only important but are important in the long-term. For
example, subsistence farmers may be able to survive one year having been
pushed from their land but not two, thus they have a grievance since they
probably have no other form of income or skills to earn a living. They would also
have a grievance if they cannot return to their land.
Conversely the “greed” hypothesis would indicate that the possession of
large amounts of land is an initiating factor in civil war, however this would only
be true in capital intensive agricultural societies where large amounts of land can
be exploited by a handful of people. A counter-argument would be that it is not
the production but the exports of these products that creates the conditions for
greedy people to expropriate them for their own gain. However, the composition
of the greed variable SXP is skewed heavily toward non-renewable products and
non-foodstuffs. Thus our findings on lost arable land and water scarcity as
important components of the conflict process reinforce the grievance hypothesis
since they are both immediate and long-term elements of agricultural
production. As for urban dwellers loss of land is not important but the ability to
purchase food certainly is. They might have grievances if the government cannot
provide access to food; however this is different from greed.
18
In sum, our findings seem to confirm that the grievance hypothesis is a
stronger explanation and predictor for civil war than the greed hypothesis. The
results indicating the importance of the magnitude of civil war is an important
innovation has been shown to be significant especially with renewable resource
variables. This finding indicates that the processes that start civil wars are
complex and have an indeterminate lead time. Further research on the particular
mechanisms, time required for grievances to reach a critical mass and the specific
renewable resources are warranted.
19
Bibliography
Azam, Jean-Paul (2002). “Looting and Conflict Between Ethnoregional Groups,
Lessons for State Formation in Africa”, Journal of Conflict Resolution, 46(1): 131-
153.
Baechler, Günther. “Why Environmental Transformation Causes Violence: A
Synthesis,” Environmental Change and Security Report, 4 (Spring 1998): 24-44.
Balch-Lindsay, Dylan and Andrew Enterline (2000). “Killing Time: The World
Politics oof Civil War Duration, 1820-1992”, International Studies Quarterly, (44):
615-642.
Beck, Nathaniel and Jonathan N. Katz, “What to do (and not to do) with Time-
Series Cross-Section Data,””American Political Science Review 89, 3 (September
1995): 634-647.
Bennett, D. Scott and Alan C. Stamm III (1996). “The Duration of Interstate Wars,
1816-1985”, American Political Science Review, 90(2): 239-257.
Collier, Paul (1999a). “On the Economic Consequences of Civil War”, Oxford
Economics Papers, 51(4): 168-183.
____________ (2000). Rebellion as a Quasi-Criminal Activity. The Journal of
Conflict Resolution. 44: 839-853.
____________ (2006). “Economic Causes of Civil Conflict and Their Implications
for Policy”, Oxford Economics Paper.
____________ (2007). The Bottom Billion, Why the Poorest Countries are Failing and
What Can Be Done About It”, New York: Oxford University Press.
Collier, Paul and Anke Hoeffler. 1999. Justice-Seeking and Loot-Seeking in Civil
War. World Bank Paper.
Collier, Paul and Anke Hoeffler (2002). “On the Incidence of Civil War in
Africa”, Journal of Conflict Resolution, 46(1): 13-28.
20
Collier, Paul and Anke Hoeffler (2004). “Greed and Grievance in Civil War”,
Oxford Economic Papers, 56:563-95.
Collier, Paul, Hoeffler, Anke, and Rohner, Dominic (2007). “Beyond Greed and
Grievance: Feasibility and Civil War”, Oxford Economic Paper.
Collier, Paul, Hoeffler, Anke and Söderbom, Måns (2006). “On the Duration of
Civil War”, Journal of Peace Research, 41(3): 253-273.
Collier, Paul and Sambanis, Nicholas (2002). “Understanding Civil War”, Journal
of Conflict Resolution, 46(1): 3-12.
DeRouen, Karl R. Jr. and Sobek, David (2004). “The Dynamics of Civil War
Duration and Outcome”, Journal of Peace Research, 41(3)L 303-320.
Deudney, Daniel, “The Case Against Linking Environmental Degradation and
National Security,” Millenium 19, 3 (1990): 461-476.
Fearon, James D. (2004). “Why Do Some Civil Wars Last So Much Longer Than
Others?”, Journal of Peace Research, 41(3): 275-301.
____________. (2005). “Primary Commodity Exports and Civil War”, Journal of
Conflict Resolution, 49(4): 483-507.
Fearon, James D. and David Laitin (2003). “Ethnicity, Insurgency and Civil
War”, American Political Science Review, 97(1): 75-90.
Fearon, James D., Kasara, Kimuli, and Daivd D. Laitin (2007). “Ethnic Minority
Rule and Civil War Onset”, American Political Science Review, 101(1): 187-193.
Gleditsch, Nils Petter, Peter Wallensteen, Mikael Eriksson, Margareta Sollenberg,
and Håvard Strand. 2002. “Armed Conflict 1946-2001: A New Dataset.” Journal of
Peace Research. 39: 615-637.
Hauge, Wenche and Tanja Ellingsen. “Beyond Environmental Scarcity: Causal
Pathways to Conflict,” Journal of Peace Research, 35, 3 (1993): 299-317.
21
Hegre, Håvard (2004). “Duration and Termination of Civil War”, Journal of Peace
Research, 41(3): 243-252.
Hegre, Håvard, Ellingsen, Tanja, Gates, Scott and Gleditsch, Nils Petter (2001).
“Toward a Democratic Civil Peace? Democracy, Political Change, and
Civil War, 1816-1992”, American Political Science Review, 95(1): 33-48.
Homer-Dixon, Thomas F. “Global Environmental Change and International
Security,” in David Dewitt, David Haglund and John Kirton, Eds., Building New
Global Order, Ontario: Oxford University Press, 1993: 185-228.
____________. “Environmental Scarcities and Violent Conflict: Evidence
from Cases,” International Security 16, 2 (Summer 1994): 5-40.
____________. Environment, Scarcity, and Violence, Princeton, NJ: Princeton
University Press, 1999.
Lacina, Bethany and Nils Petter Gleditsch. 2005. “Monitoring Trends in Global
Combat: A New Dataset of Battle Deaths.” European Journal of Population.
21: 145–116.
Licklider, Roy (1995). “The Consequences of Negotiated Settlements in Civil
Wars, 1945-1993”, American Political Science Review, 89(3): 681-690.
Lujala, Päivi, Gleditsch, Nils Petter, and Gilmore, Elisabeth (2005). “A Diamond
Curse?”, Journal of Conflict Resolution, 49(4): 538-562.
Oechslin, Manuel (2006). “Foreign Aid, Political Instability, and Economic
Growth”, University of Zurich Paper.
Porter, Gareth. “Environmental Security as a National Security Issue,” Current
History 94, 92 (May 1995): 218-222.
Ross, Michael L (2004). “What Do We Know About Natural Resources and Civil
War?”, Journal of Peace Research, (41)3: 337-356.
22
Sambanis, Nicholas (2004). “What is Civil War? Conceptual and Empirical
Complexities of an Operational Definition”, Journal of Conflict Resolution,
48(6): 814-858.
Singer, J.D. and M. Small. 1994. Correlates of War Project: International and
Civil War Data, 1816-1992. Ann Arbor, MI: Inter-Univeristy Consortium
for Political and Social Research.
23
APPENDIX 1: TABLES
TABLE 1: CIVIL WAR ONSET Variables Model 1 Model 2 Model 3 Model 4
Oil Producing
State
-.0121
.3926
.0189
.3914
-.0390
.4016
-.0504
.4043
Fuel Production >
33% export GDP
.4848
.5235
.6424
.5407
1 Yr Lag .4950
.5200
2 Yr Lag .6389
.5344
Diamond
Production
.1042
.3617
.0936
.3704
1 Yr Lag .1152
.3604
2 Yr Lag .0883
.3688
SXP .0077
.0482
-.2176
6.7223
1 Yr Lag .0078
.0516
2 Yr Lag .0072
.0394
.2247
6.7223
Lost Forested
Land
-.0115
.1113
-.0200
.1119
1 Yr Lag .0455
.1079
.0462
.1084
2 Yr Lag .0001
.0077
.0001
.0081
Lost Arable
Land
-.0951
.1357
-.1032
.1363
1 Yr Lag .0753
.0886
.0758
.0901
2 Yr Lag .0581
.0977
.0576
.0966
Freshwater
Scarcity
.4462*
.3116
.7619
.9360
1 Yr Lag .3797
.3089
-.6880
1.4008
2 Yr Lag .3593
.3113
.3297
1.1369
GDP Per
Capita
-.00001
.0001
-.00006
.0001
-.00006
.0001
-.00007
.0001
Polity-
Squared
-.0012**
.0004
-.0011**
.0004
-.0012**
.0004
-.0011**
.0003
Ethnic
Fractionalization
.4879
.9154
.4487
.9206
.6404
.9386
.6629
.9444
Mountainous
Terrain
.0153**
.0075
.0149**
.0075
.0130*
.0076
.0128*
.0076
Lag of Civil
War Onset
4.7867***
.2889
4.7919***
.2898
4.7964***
.2931
4.8236***
.3002
Constant -4.2752***
.7836
-4.2683***
.7853
-4.3298***
.8027
-4.3992***
.8092 Top number in each cell is coefficient, bottom number is standard error. *p > .1, ** p > .05, *** p > .001
24
TABLE 2: Civil War Duration
Variables Model 5 Model 6 Model 7 Model 8
Oil Producing
State
-24.3139*
13.7244
-24.2982*
13.71412
-27.5212*
14.1489
-27.4782*
14.1809
Fuel Production
> 33% export
GDP
35.8770**
17.7678
39.9815**
18.6264
1 Yr Lag 36.0669*
17.7716
2 Yr Lag 38.8162**
18.4573
Diamond
Production
4.6366
12.9408
5.9756
13.5416
1 Yr Lag 4.6254
12.9563
2 Yr Lag 5.8398
13.4490
SXP -.0097
.0071
-40.7349
76.3465
1 Yr Lag -.0098
.0072
2 Yr Lag -.0111
.0075
40.7227
76.3469
Lost Forested
Land
-.2089
2.5816
-.3621
2.6831
1 Yr Lag .0011
.0153
1.6265
2.6315
2 Yr Lag -.0043
.0164
-.0039
.0169
Lost Arable
Land
1.2981
2.5138
1.0594
2.5412
1 Yr Lag 2.1399
2.5745
2.0622
2.5842
2 Yr Lag -.2649
2.6771
-.4545
2.6536
Freshwater
Scarcity
-10.021*
6.4143
-6.4333
17.4674
1 Yr Lag -9.9663
6.3621
-2.4785
22.7877
2 Yr Lag -10.3114
6.5658
-2.026
17.6488
25
TABLE 2: Civil War Duration (Continued)
Variables Model 5 Model 6 Model 7 Model 8
GDP Per
Capita
-.0064*
.0038
-.0063*
.0038
-.0066*
.0039
-.0066*
.0039
Polity-
Squared
-.0099
.0157
-.0101
.01567
-.0119
.0159
-.0122
.0159
Ethnic
Fractionalization
-16.3275
34.2062
-16.5666
34.3471
-15.7704
35.5866
-16.2562
35.4882
Mountainous
Terrain
-.00009
.3007
.0024
.3046
.0022
.3144
-.0108
.3133
Civil War Onset -163.342***
20.5912
-163.5275***
20.6362
-168.9332***
21.4597
-169.6368***
21.5442
Civil War
Magnitude
.0116***
.0018
.0116***
.0018
.0119***
.0018
.0119***
.0018
Lag of Civil War
Duration
.7373***
.0456
.7370***
.0457
.7325***
.0466
.7319***
.0464
Constant 31.1538
29.1407
30.8674
29.1844
31.7913
30.3051
31.8742*
30.1682 Top number in each cell is coefficient, bottom number is standard error. *p > .1, ** p > .05, *** p > .001
26
TABLE 3: Civil War Magnitude
Variables Model 9 Model 10 Model 11 Model 12
Oil Producing
State
62.4807
102.4037
65.0846
102.1888
104.0218
103.7207
101.0414
103.5762
Fuel Production
> 33% export
GDP
-151.3944
272.989
-198.8436
294.6382
1 Yr Lag -174.4339
273.1208
2 Yr Lag -185.1261
287.7116
Diamond
Production
-60.0832
121.8249
-92.4155
125.3395
1 Yr Lag -71.2676
121.5836
2 Yr Lag -99.0411
125.3938
SXP -.03918
.0627
1121.734
1740.686
1 Yr Lag -.0807
.0617
2 Yr Lag -.1042*
.0634
-1121.778
1740.682
Lost Forested
Land
-101.4269**
48.5619
-119.4112**
50.7262
1 Yr Lag -.1712
.1766
-31.9891
50.5032
2 Yr Lag -.1226
.1962
-.1048
.3270
Lost Arable
Land
-17.3386
34.5299
-32.8543
28.0738
1 Yr Lag -4.5492
34.5164
-9.0277
27.2523
2 Yr Lag 133.2197***
27.822
141.9307***
28.3108
Freshwater
Scarcity
81.6495
103.7291
657.4915**
269.2569
1 Yr Lag 20.5242
104.7026
-412.2042
350.5822
2 Yr Lag -3.4474
110.1319
-223.3321
279.2877
27
TABLE 3: Civil War Magnitude (Continued)
Variables Model 9 Model 10 Model 11 Model 12
GDP Per
Capita
-.0022
.0354
.0045
.0358
.0088
.0371
.0065
.0370
Polity-
Squared
.5738**
.2551
.5822**
.2547
.5885**
.2847
.5770**
.2479
Ethnic
Fractionalization
473.9728*
253.1283
486.4529*
258.2397
479.4923*
263.3079
464.7894*
257.9229
Mountainous
Terrain
3.2577
2.5323
3.0793
2.5643
2.5251
2.8199
2.8067
2.8371
Lag Civil War
Magnitude
.6555***
.0534
.6537***
.0535
.6549***
.0545
.6585***
.0540
Civil War Onset 2219.388***
342.6417
2240.864***
343.0118
2253.604***
356.4664
2237.556***
354.2981
Civil War
Duration
1.7949***
.3821
1.7892***
.3808
1.7924***
.3935
1.7812***
.3937
Constant -421.8676**
197.3726
-424.4516**
198.8118
-438.6012**
205.7979
-413.3164**
205.7858 Top number in each cell is coefficient, bottom number is standard error. *p > .1, ** p > .05, *** p > .001
28
APPENDIX 2
FORMULAS FOR REGRESSION LINES
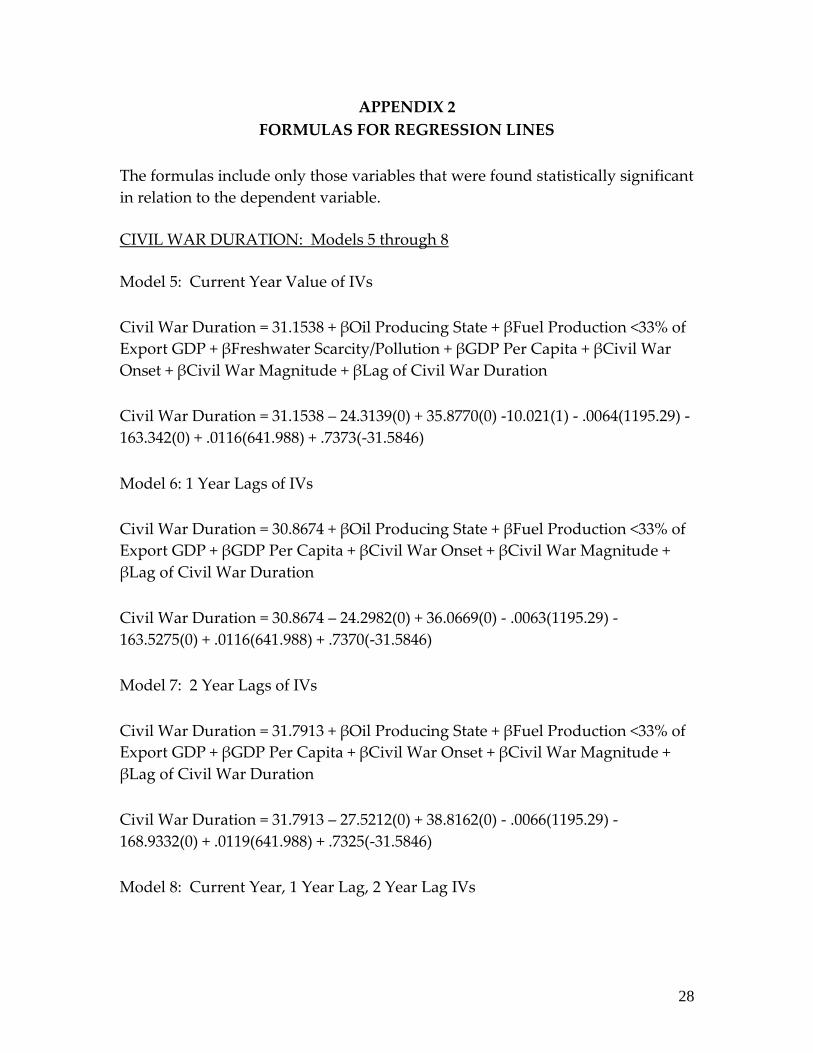
The formulas include only those variables that were found statistically significant
in relation to the dependent variable.
CIVIL WAR DURATION: Models 5 through 8
Model 5: Current Year Value of IVs
Civil War Duration = 31.1538 + βOil Producing State + βFuel Production <33% of
Export GDP + βFreshwater Scarcity/Pollution + βGDP Per Capita + βCivil War
Onset + βCivil War Magnitude + βLag of Civil War Duration
Civil War Duration = 31.1538 – 24.3139(0) + 35.8770(0) -10.021(1) - .0064(1195.29) -
163.342(0) + .0116(641.988) + .7373(-31.5846)
Model 6: 1 Year Lags of IVs
Civil War Duration = 30.8674 + βOil Producing State + βFuel Production <33% of
Export GDP + βGDP Per Capita + βCivil War Onset + βCivil War Magnitude +
βLag of Civil War Duration
Civil War Duration = 30.8674 – 24.2982(0) + 36.0669(0) - .0063(1195.29) -
163.5275(0) + .0116(641.988) + .7370(-31.5846)
Model 7: 2 Year Lags of IVs
Civil War Duration = 31.7913 + βOil Producing State + βFuel Production <33% of
Export GDP + βGDP Per Capita + βCivil War Onset + βCivil War Magnitude +
βLag of Civil War Duration
Civil War Duration = 31.7913 – 27.5212(0) + 38.8162(0) - .0066(1195.29) -
168.9332(0) + .0119(641.988) + .7325(-31.5846)
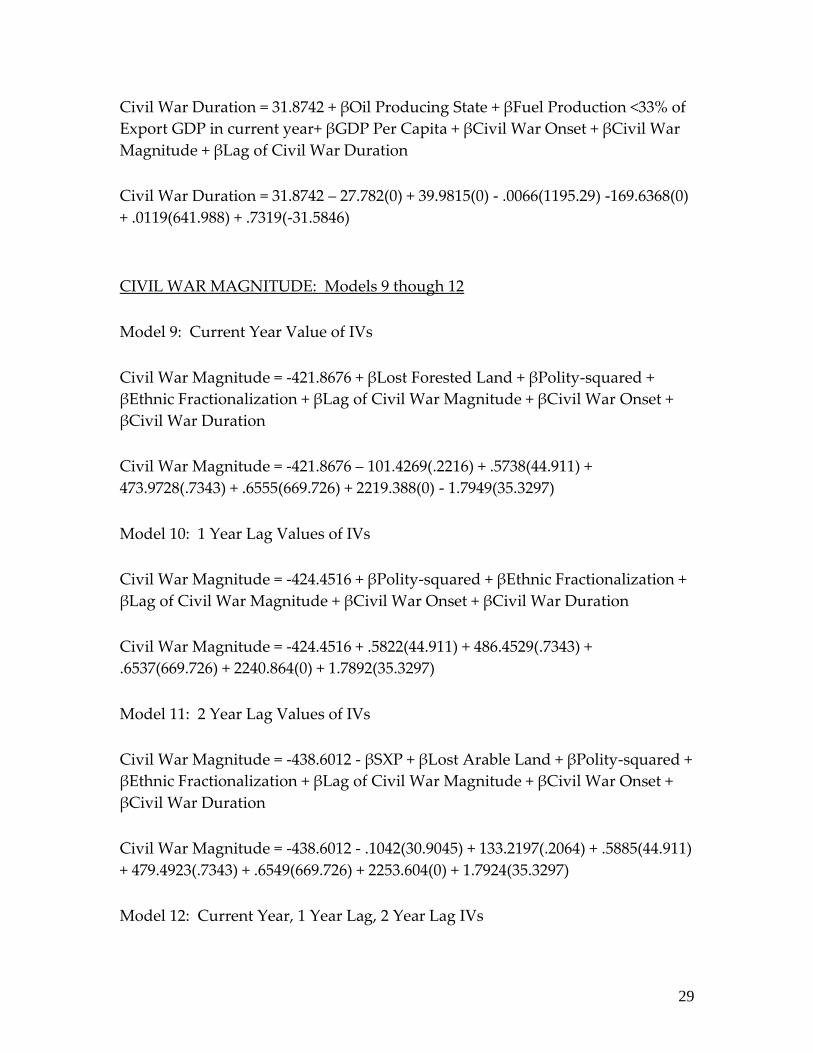
Model 8: Current Year, 1 Year Lag, 2 Year Lag IVs
29
Civil War Duration = 31.8742 + βOil Producing State + βFuel Production <33% of
Export GDP in current year+ βGDP Per Capita + βCivil War Onset + βCivil War
Magnitude + βLag of Civil War Duration
Civil War Duration = 31.8742 – 27.782(0) + 39.9815(0) - .0066(1195.29) -169.6368(0)
+ .0119(641.988) + .7319(-31.5846)
CIVIL WAR MAGNITUDE: Models 9 though 12
Model 9: Current Year Value of IVs
Civil War Magnitude = -421.8676 + βLost Forested Land + βPolity-squared +
βEthnic Fractionalization + βLag of Civil War Magnitude + βCivil War Onset +
βCivil War Duration
Civil War Magnitude = -421.8676 – 101.4269(.2216) + .5738(44.911) +
473.9728(.7343) + .6555(669.726) + 2219.388(0) - 1.7949(35.3297)
Model 10: 1 Year Lag Values of IVs
Civil War Magnitude = -424.4516 + βPolity-squared + βEthnic Fractionalization +
βLag of Civil War Magnitude + βCivil War Onset + βCivil War Duration
Civil War Magnitude = -424.4516 + .5822(44.911) + 486.4529(.7343) +
.6537(669.726) + 2240.864(0) + 1.7892(35.3297)
Model 11: 2 Year Lag Values of IVs
Civil War Magnitude = -438.6012 - βSXP + βLost Arable Land + βPolity-squared +
βEthnic Fractionalization + βLag of Civil War Magnitude + βCivil War Onset +
βCivil War Duration
Civil War Magnitude = -438.6012 - .1042(30.9045) + 133.2197(.2064) + .5885(44.911)
+ 479.4923(.7343) + .6549(669.726) + 2253.604(0) + 1.7924(35.3297)
Model 12: Current Year, 1 Year Lag, 2 Year Lag IVs

30
Civil War Magnitude = -413.3164 – βLost Forested Land + βLost Arable Land 2
Year Lag + βFreshwater Scarcity + βPolity-squared + βEthnic Fractionalization +
βLag of Civil War Magnitude + βCivil War Onset + βCivil War Duration
Civil War Magnitude = -413.3164 – 119.4112(.2264) + 141.9307(.2064) + 657.4915(1)
+ .5770(44.911) + 464.7894(.7343) + .6585(669.726) + 2237.556(0) + 1.7812(35.3297)