poisoning with soman, an organophosphorus … with soman, an organophosphorus nerve agent, alters...
TRANSCRIPT
Poisoning with Soman, an Organophosphorus Nerve Agent,Alters Fecal Bacterial Biota and Urine Metabolites: a Case forNovel Signatures for Asymptomatic Nerve Agent Exposure
Derese Getnet,a Aarti Gautam,a Raina Kumar,a,b Allison Hoke,a,c Amrita K. Cheema,d Franco Rossetti,e
Caroline R. Schultz,f Rasha Hammamieh,a Lucille A. Lumley,g Marti Jetta*
aIntegrative Systems Biology Program, U.S. Army Center for Environmental Health Research, Fort Detrick,Maryland, USA
bAdvanced Biomedical Computing Center, Frederick National Laboratory for Cancer Research, Fort Detrick,Maryland, USA
cThe Geneva Foundation, U.S. Army Center for Environmental Health Research, Fort Detrick, Maryland, USAdDepartments of Oncology and Biochemistry, Molecular and Cellular Biology, Georgetown University MedicalCenter, Washington, DC, USA
eClinical Research Management, Silver Spring, Maryland, USAfEdmond Scientific Company, Aberdeen Proving Ground, Maryland, USAgU.S. Army Medical Research Institute of Chemical Defense, Aberdeen Proving Ground, Maryland, USA
ABSTRACT The experimental pathophysiology of organophosphorus (OP) chemicalexposure has been extensively reported. Here, we describe an altered fecal bacterialbiota and urine metabolome following intoxication with soman, a lipophilic G classchemical warfare nerve agent. Nonanesthetized Sprague-Dawley male rats were sub-cutaneously administered soman at 0.8 (subseizurogenic) or 1.0 (seizurogenic) of the50% lethal dose (LD50) and evaluated for signs of toxicity. Animals were stratifiedbased on seizing activity to evaluate effects of soman exposure on fecal bacterial bi-ota and urine metabolites. Soman exposure reshaped fecal bacterial biota by alter-ing Facklamia, Rhizobium, Bilophila, Enterobacter, and Morganella genera of the Firmi-cutes and Proteobacteria phyla, some of which are known to hydrolyze OP chemicals.However, analogous changes were not observed in the bacterial biota of the ileum,which remained the same irrespective of dose or seizing status of animals after so-man intoxication. However, at 75 days after soman exposure, the bacterial biota sta-bilized and no differences were observed between groups. Interestingly, in consider-ing just the seizing status of animals, we found that the urine metabolomes weremarkedly different. Leukotriene C4, kynurenic acid, 5-hydroxyindoleacetic acid, nor-epinephrine, and aldosterone were excreted at much higher rates at 72 h in seizinganimals, consistent with early multiorgan involvement during soman poisoning.These findings demonstrate the feasibility of using the dysbiosis of fecal bacterial bi-ota in combination with urine metabolome alterations as forensic evidence for pre-symptomatic OP exposure temporally to enable administration of neuroprotectivetherapies of the future.
IMPORTANCE The paucity of assays to determine physiologically relevant OP expo-sure presents an opportunity to explore the use of fecal bacteria as sentinels incombination with urine to assess changes in the exposed host. Recent advances insequencing technologies and computational approaches have enabled researchersto survey large community-level changes of gut bacterial biota and metabolomicchanges in various biospecimens. Here, we profiled changes in fecal bacterial biotaand urine metabolome following a chemical warfare nerve agent exposure. The sig-nificance of this work is a proof of concept that the fecal bacterial biota and urinemetabolites are two separate biospecimens rich in surrogate indicators suitable for
Received 1 May 2018 Accepted 7 August2018
Accepted manuscript posted online 14September 2018
Citation Getnet D, Gautam A, Kumar R, Hoke A,Cheema AK, Rossetti F, Schultz CR,Hammamieh R, Lumley LA, Jett M. 2018.Poisoning with soman, an organophosphorusnerve agent, alters fecal bacterial biota andurine metabolites: a case for novel signaturesfor asymptomatic nerve agent exposure. ApplEnviron Microbiol 84:e00978-18. https://doi.org/10.1128/AEM.00978-18.
Editor Andrew J. McBain, University ofManchester
This is a work of the U.S. Government and isnot subject to copyright protection in theUnited States. Foreign copyrights may apply.
Address correspondence to Marti Jett,[email protected].
* Present address: Marti Jett, U.S. Army Centerfor Environmental Health Research, FortDetrick, Maryland, USA.
D.G., A.G., and R.K. contributed equally to thisarticle.
PHYSIOLOGY
crossm
November 2018 Volume 84 Issue 21 e00978-18 aem.asm.org 1Applied and Environmental Microbiology
on June 30, 2019 by guesthttp://aem
.asm.org/
Dow
nloaded from
monitoring OP exposure. The larger value of such an approach is that assays devel-oped on the basis of these observations can be deployed in any setting with moder-ate clinical chemistry and microbiology capability. This can enable estimation of theaffected radius as well as screening, triage, or ruling out of suspected cases of expo-sures in mass casualty scenarios, transportation accidents involving hazardous mate-rials, refugee movements, humanitarian missions, and training settings when cou-pled to an established and validated decision tree with clinical features.
KEYWORDS soman, gut microbiome, 16S rRNA gene, urine metabolome
Despite the serious health threat posed to communities, organic derivatives ofphosphorus (organophosphorus [OP])-containing acids have a wide range of
applications in modern society (1–3). OP-containing products are in excessive useworldwide for the control of agricultural or household pests. OP-containing pesticidesaccount for almost 38% of all pesticides used across the globe, leading to nearly 3million poisonings, over 200,000 deaths annually, and the contamination of numerousecosystems (4). In addition, application of OP derivatives as agents of war and terrorismin the form of nerve agents poses a significant threat to both civilians and thewarfighter. Exposure to OP leads to various degrees of neurotoxicity due to cholinergicreceptor hyperactivity, mediated primarily by the inhibition of acetylcholinesterase(AChE) (5). The excessive accumulation of acetylcholine leads to severe physiologicalcomplications that may manifest as muscarinic symptoms (e.g., lacrimation, salivation,diarrhea, miosis, and bradycardia), nicotinic symptoms (e.g., tachycardia, hypertension,convulsions, and paralysis of skeletal and respiratory muscles), and death (1–3, 6, 7).
Soman (pinacolyl methylphosphonofluoridate or GD [German agent D]) is one of theG class nerve agents (volatile agents associated with inhalation toxicity) that inhibitAChE much more rapidly but less specifically than V class nerve agents (viscous agentsassociated with transdermal toxicity) (2, 6, 8). Whole-body autoradiography studies inmice revealed that intravenously administered tritiated soman ([3H]soman) spreadsthrough the entire body in less than 5 min (9). High levels of accumulation were notedin the lungs, skin, gallbladder, intestinal lumen, and urine during the first 24 h.[3H]pinacolyl methylphosphoric acid ([3H]PMPA), a hydrolyzed acid and primary me-tabolite of soman, was found to be concentrated in specific organs such as lungs, heart,and kidneys within minutes of [3H]soman administration, which reflected the highlyreactive (i.e., rapidly aging) nature of soman in vivo (10). Significant amounts of somanwere also detected in red blood cells, a major esterase depot, compared to the plasma.In addition, those studies revealed that the common route of excretion for PMPA, amajor soman metabolite, was via urine and the intestinal lumen content (9, 11).Interestingly, only trace amounts of [3H]soman, [3H]PMPA, or [3H]methylphosphonicacid (hydrolyzed PMPA) were observed in the central nervous system (CNS). Currentclinical nerve agent exposure assessments are primarily based on overt physiologicalreactions such as convulsions, loss of consciousness, and salivation for high-doseexposures or pupil constriction and respiratory distress for low-dose exposures (12, 13).Recent studies have also demonstrated the feasibility of identifying OP hydrolysisproducts in hair and nail clippings to verify nerve agent exposure after 30 days (13, 14).Hence, monitoring asymptomatic exposure or verifying suspected exposure during thepresymptomatic phase using minimally invasive and rapid molecular methods repre-sents an ideal approach and capability. Thus, identification of new surrogate biomark-ers of toxicity and/or exposure to soman and other OP chemicals is essential from botha clinical and a public health standpoint, especially for triaging population-level expo-sures.
Using an omics approach, we have assessed the potential value of correlationsbetween changes in fecal bacterial biota or urine metabolites and OP exposure todetermine if these biospecimens are suitable for diagnostic use for exposure surveil-lance and monitoring in a rat model of soman exposure. More importantly, we filled ina knowledge gap regarding how OP exposure directly or indirectly impacts bacterial
Getnet et al. Applied and Environmental Microbiology
November 2018 Volume 84 Issue 21 e00978-18 aem.asm.org 2
on June 30, 2019 by guesthttp://aem
.asm.org/
Dow
nloaded from
communities of the mammalian gut and alters the global urine metabolic profile. Forover 20 years, specific species of the Bacteroidetes and Proteobacteria phyla have beenimplicated in enhanced biodegradation of OP pesticides in the bioremediation field.Therefore, exploring the role of the microbiome in a mammalian host’s response to OPis the next logical step (4, 15). Furthermore, recent advances in sequencing technolo-gies have enabled a detailed analysis of structural changes in the gut microbiome,revealing the dynamic ecosystem of the bacterial biota and its essential role in healthand disease. We also identified urine as a suitable specimen type for investigation inthis study because urine consists of numerous metabolites as outputs from multiplepathways and provides a snapshot of both local and systemic physiological changes(16). With these concerns in mind, we focused our efforts on exploring and describingsoman-induced dysbiosis of the gut microbiota and alterations in the urine metabo-lome.
RESULTSClinical manifestation of soman insult. To establish soman-induced toxicity with
and without seizure, Sprague-Dawley rats were subcutaneously injected with salinesolution or with a 0.8 median lethal dose (LD50) (subseizurogenic and unmitigated bytreatment) or a 1.0 LD50 (seizurogenic and mitigated by treatment) exposure equivalentof soman. To reduce mortality, the animals given 1.0 LD50 were also administeredatropine sulfate and HI-6 1 min after exposure. Rats that developed seizures at 1 LD50
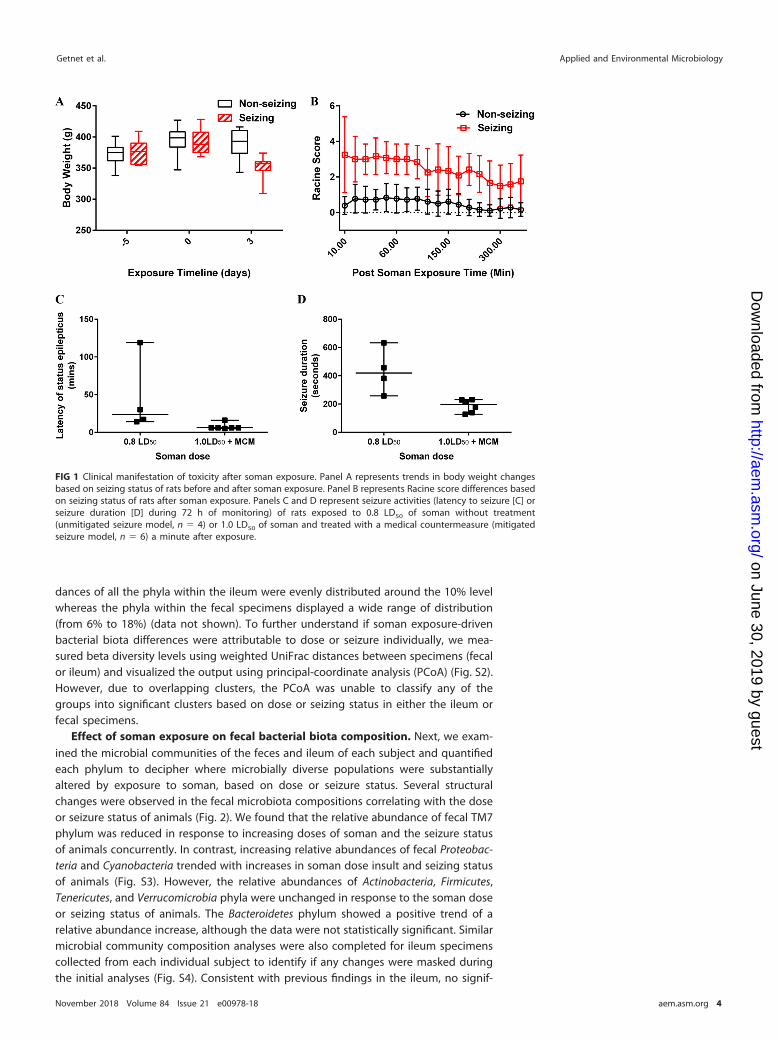
were given diazepam to control seizing. Approximately 42% of the animals exposed tosoman (0.8 or 1.0 LD50) experienced seizure irrespective of the dose or the medicaltreatment regimen administered. As expected, control rats did not experience seizurefrom administration of the vehicle. Seizing animals experienced notable weight loss aftersoman poisoning (Fig. 1A). The Racine scale score, representing a quantitative assess-ment of seizure-related activities such as degrees of tremors, convulsions, and seizures,was significantly higher in seizing subjects than in nonseizing subjects, as expected(Fig. 1B) (17–19). On the basis of electroencephalograph (EEG) activity, body weight,and Racine score, we broadly categorized our analysis groups into a nonseizing group(no seizure, n � 13) and a seizing group (exposure seizure or sustained seizure, n � 10).We also further subdivided cohorts based on dose because of seizure differences (Fig.1C and D). Fecal matter, urine, and tissues were harvested from animals to examine thegut microbiota and urine metabolic changes due to the soman insult.
Taxonomic changes to soman exposure. To assess the effect of soman exposureon the bacterial biota, we sequenced the V3 and V4 hypervariable regions of the 16SrRNA from the feces and ileum of all animals at 72 h. Collecting and sequencingspecimens from individual animals enabled us to assess the effect of dose- or seizing-status-driven changes in individual bacterial compositions. By measuring multiplealpha diversity estimates within a dose (0.8 LD50 or 1.0 LD50) or seizing status (non-seizing or seizing) for specimens, we found statistically significantly (P � 0.05) altereddiversity in the fecal bacterial biota of seizing animals at both the subseizurogenic 0.8LD50 and seizurogenic 1.0 LD50 levels (with a pronounced effect in seizing animals withthe 0.8 LD50 exposure) that was markedly different from that seen with the control ornonseizing groups (see Fig. S1A in the supplemental material). Measuring levels ofalpha diversity between the ileum specimens of control and soman-exposed animals,however, a higher degree of taxon similarity was observed irrespective of dose orseizing status (Fig. S1B) of specimens. The bacterial biota of the ileum was not alteredby exposure to soman, while the fecal bacterial biota was substantially altered.
In order to investigate if organism abundance accounted for the alpha diversitydifferences observed between the fecal and ileum bacterial biota in response to somaninsult, we rank ordered all phyla identified in the study based on relative abundances(data not shown). To our surprise, no differences between the fecal and ileum bacterialphylum abundance distributions were observed. In both fecal and ileum specimens, asexpected, Firmicutes and Bacteroidetes accounted for the most abundant phyla fol-lowed by Verrucomicrobia, Tenericutes, and Actinobacteria. However, the relative abun-
Soman-Induced Changes in Microbiome and Urine Applied and Environmental Microbiology
November 2018 Volume 84 Issue 21 e00978-18 aem.asm.org 3
on June 30, 2019 by guesthttp://aem
.asm.org/
Dow
nloaded from
dances of all the phyla within the ileum were evenly distributed around the 10% levelwhereas the phyla within the fecal specimens displayed a wide range of distribution(from 6% to 18%) (data not shown). To further understand if soman exposure-drivenbacterial biota differences were attributable to dose or seizure individually, we mea-sured beta diversity levels using weighted UniFrac distances between specimens (fecalor ileum) and visualized the output using principal-coordinate analysis (PCoA) (Fig. S2).However, due to overlapping clusters, the PCoA was unable to classify any of thegroups into significant clusters based on dose or seizing status in either the ileum orfecal specimens.
Effect of soman exposure on fecal bacterial biota composition. Next, we exam-ined the microbial communities of the feces and ileum of each subject and quantifiedeach phylum to decipher where microbially diverse populations were substantiallyaltered by exposure to soman, based on dose or seizure status. Several structuralchanges were observed in the fecal microbiota compositions correlating with the doseor seizure status of animals (Fig. 2). We found that the relative abundance of fecal TM7phylum was reduced in response to increasing doses of soman and the seizure statusof animals concurrently. In contrast, increasing relative abundances of fecal Proteobac-teria and Cyanobacteria trended with increases in soman dose insult and seizing statusof animals (Fig. S3). However, the relative abundances of Actinobacteria, Firmicutes,Tenericutes, and Verrucomicrobia phyla were unchanged in response to the soman doseor seizing status of animals. The Bacteroidetes phylum showed a positive trend of arelative abundance increase, although the data were not statistically significant. Similarmicrobial community composition analyses were also completed for ileum specimenscollected from each individual subject to identify if any changes were masked duringthe initial analyses (Fig. S4). Consistent with previous findings in the ileum, no signif-
FIG 1 Clinical manifestation of toxicity after soman exposure. Panel A represents trends in body weight changesbased on seizing status of rats before and after soman exposure. Panel B represents Racine score differences basedon seizing status of rats after soman exposure. Panels C and D represent seizure activities (latency to seizure [C] orseizure duration [D] during 72 h of monitoring) of rats exposed to 0.8 LD50 of soman without treatment(unmitigated seizure model, n � 4) or 1.0 LD50 of soman and treated with a medical countermeasure (mitigatedseizure model, n � 6) a minute after exposure.
Getnet et al. Applied and Environmental Microbiology
November 2018 Volume 84 Issue 21 e00978-18 aem.asm.org 4
on June 30, 2019 by guesthttp://aem
.asm.org/
Dow
nloaded from
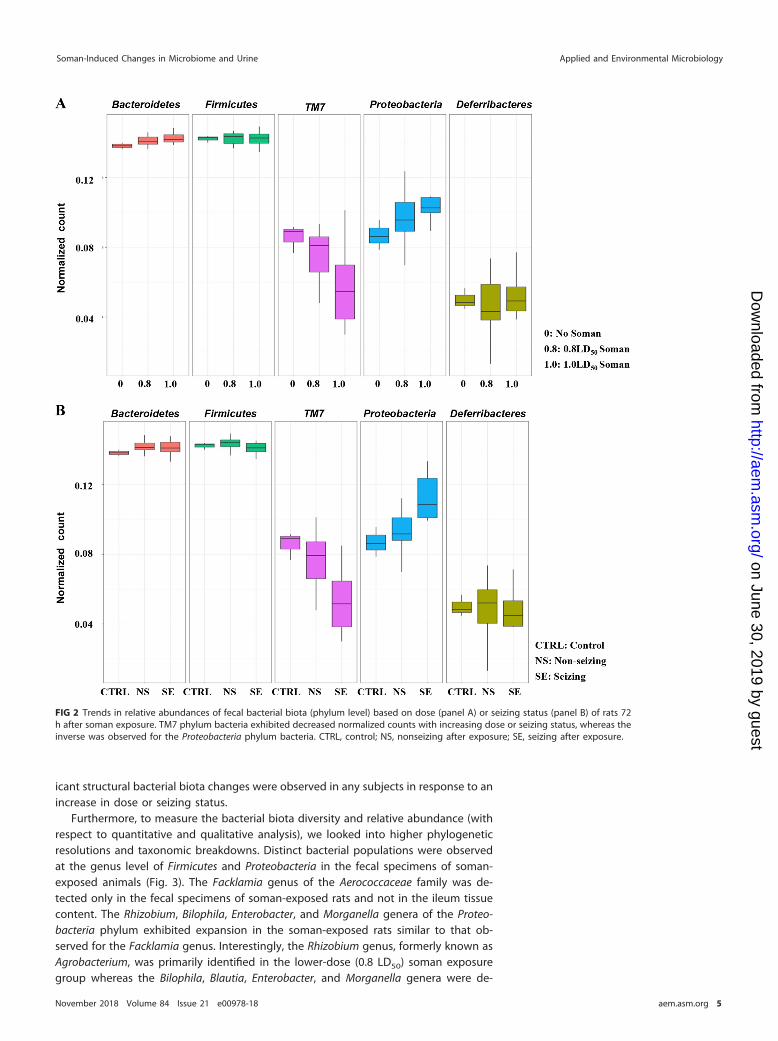
icant structural bacterial biota changes were observed in any subjects in response to anincrease in dose or seizing status.
Furthermore, to measure the bacterial biota diversity and relative abundance (withrespect to quantitative and qualitative analysis), we looked into higher phylogeneticresolutions and taxonomic breakdowns. Distinct bacterial populations were observedat the genus level of Firmicutes and Proteobacteria in the fecal specimens of soman-exposed animals (Fig. 3). The Facklamia genus of the Aerococcaceae family was de-tected only in the fecal specimens of soman-exposed rats and not in the ileum tissuecontent. The Rhizobium, Bilophila, Enterobacter, and Morganella genera of the Proteo-bacteria phylum exhibited expansion in the soman-exposed rats similar to that ob-served for the Facklamia genus. Interestingly, the Rhizobium genus, formerly known asAgrobacterium, was primarily identified in the lower-dose (0.8 LD50) soman exposuregroup whereas the Bilophila, Blautia, Enterobacter, and Morganella genera were de-
FIG 2 Trends in relative abundances of fecal bacterial biota (phylum level) based on dose (panel A) or seizing status (panel B) of rats 72h after soman exposure. TM7 phylum bacteria exhibited decreased normalized counts with increasing dose or seizing status, whereas theinverse was observed for the Proteobacteria phylum bacteria. CTRL, control; NS, nonseizing after exposure; SE, seizing after exposure.
Soman-Induced Changes in Microbiome and Urine Applied and Environmental Microbiology
November 2018 Volume 84 Issue 21 e00978-18 aem.asm.org 5
on June 30, 2019 by guesthttp://aem
.asm.org/
Dow
nloaded from
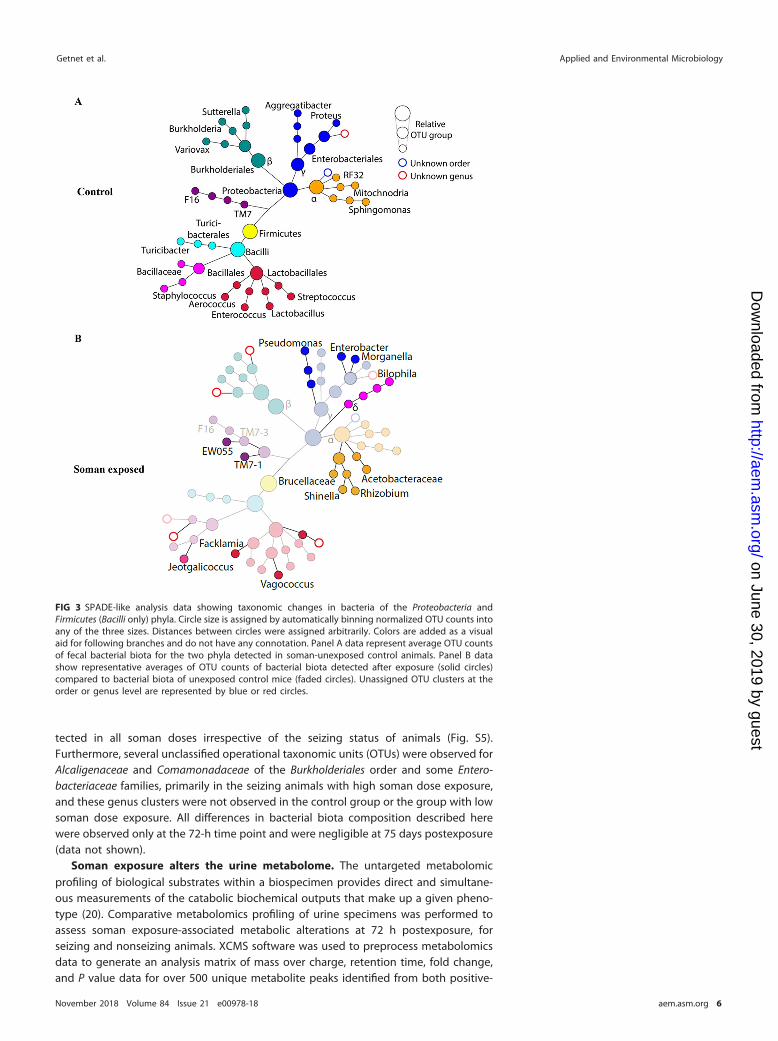
tected in all soman doses irrespective of the seizing status of animals (Fig. S5).Furthermore, several unclassified operational taxonomic units (OTUs) were observed forAlcaligenaceae and Comamonadaceae of the Burkholderiales order and some Entero-bacteriaceae families, primarily in the seizing animals with high soman dose exposure,and these genus clusters were not observed in the control group or the group with lowsoman dose exposure. All differences in bacterial biota composition described herewere observed only at the 72-h time point and were negligible at 75 days postexposure(data not shown).
Soman exposure alters the urine metabolome. The untargeted metabolomicprofiling of biological substrates within a biospecimen provides direct and simultane-ous measurements of the catabolic biochemical outputs that make up a given pheno-type (20). Comparative metabolomics profiling of urine specimens was performed toassess soman exposure-associated metabolic alterations at 72 h postexposure, forseizing and nonseizing animals. XCMS software was used to preprocess metabolomicsdata to generate an analysis matrix of mass over charge, retention time, fold change,and P value data for over 500 unique metabolite peaks identified from both positive-
FIG 3 SPADE-like analysis data showing taxonomic changes in bacteria of the Proteobacteria andFirmicutes (Bacilli only) phyla. Circle size is assigned by automatically binning normalized OTU counts intoany of the three sizes. Distances between circles were assigned arbitrarily. Colors are added as a visualaid for following branches and do not have any connotation. Panel A data represent average OTU countsof fecal bacterial biota for the two phyla detected in soman-unexposed control animals. Panel B datashow representative averages of OTU counts of bacterial biota detected after exposure (solid circles)compared to bacterial biota of unexposed control mice (faded circles). Unassigned OTU clusters at theorder or genus level are represented by blue or red circles.
Getnet et al. Applied and Environmental Microbiology
November 2018 Volume 84 Issue 21 e00978-18 aem.asm.org 6
on June 30, 2019 by guesthttp://aem
.asm.org/
Dow
nloaded from
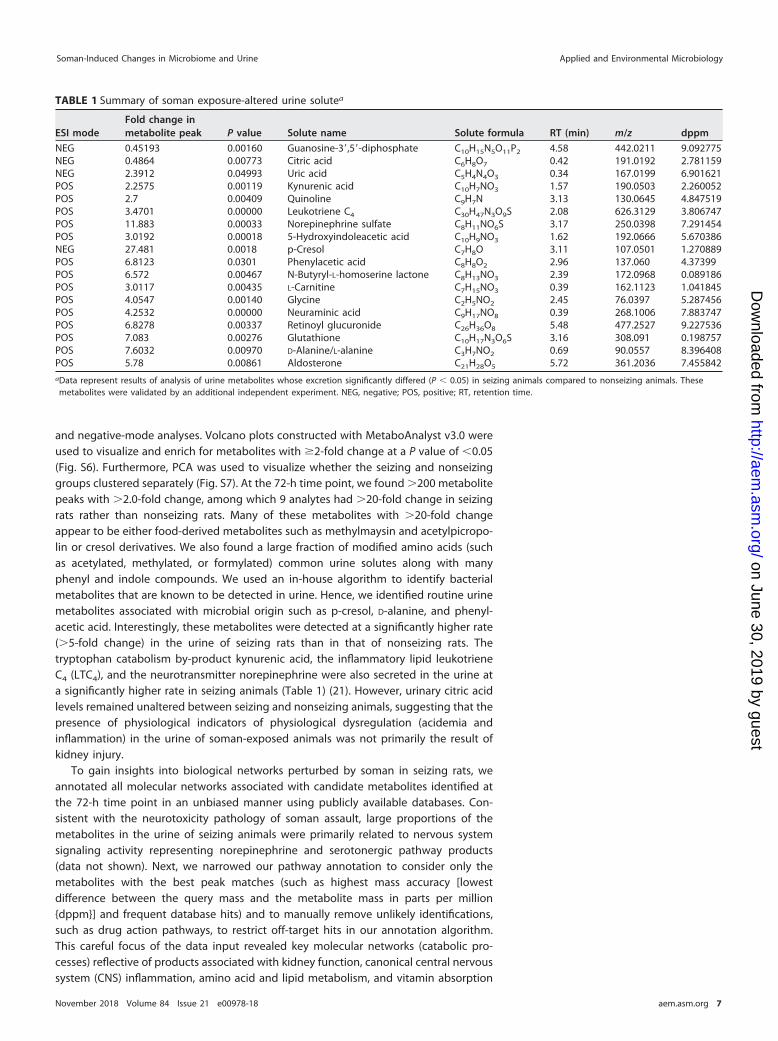
and negative-mode analyses. Volcano plots constructed with MetaboAnalyst v3.0 wereused to visualize and enrich for metabolites with �2-fold change at a P value of �0.05(Fig. S6). Furthermore, PCA was used to visualize whether the seizing and nonseizinggroups clustered separately (Fig. S7). At the 72-h time point, we found �200 metabolitepeaks with �2.0-fold change, among which 9 analytes had �20-fold change in seizingrats rather than nonseizing rats. Many of these metabolites with �20-fold changeappear to be either food-derived metabolites such as methylmaysin and acetylpicropo-lin or cresol derivatives. We also found a large fraction of modified amino acids (suchas acetylated, methylated, or formylated) common urine solutes along with manyphenyl and indole compounds. We used an in-house algorithm to identify bacterialmetabolites that are known to be detected in urine. Hence, we identified routine urinemetabolites associated with microbial origin such as p-cresol, D-alanine, and phenyl-acetic acid. Interestingly, these metabolites were detected at a significantly higher rate(�5-fold change) in the urine of seizing rats than in that of nonseizing rats. Thetryptophan catabolism by-product kynurenic acid, the inflammatory lipid leukotrieneC4 (LTC4), and the neurotransmitter norepinephrine were also secreted in the urine ata significantly higher rate in seizing animals (Table 1) (21). However, urinary citric acidlevels remained unaltered between seizing and nonseizing animals, suggesting that thepresence of physiological indicators of physiological dysregulation (acidemia andinflammation) in the urine of soman-exposed animals was not primarily the result ofkidney injury.
To gain insights into biological networks perturbed by soman in seizing rats, weannotated all molecular networks associated with candidate metabolites identified atthe 72-h time point in an unbiased manner using publicly available databases. Con-sistent with the neurotoxicity pathology of soman assault, large proportions of themetabolites in the urine of seizing animals were primarily related to nervous systemsignaling activity representing norepinephrine and serotonergic pathway products(data not shown). Next, we narrowed our pathway annotation to consider only themetabolites with the best peak matches (such as highest mass accuracy [lowestdifference between the query mass and the metabolite mass in parts per million{dppm}] and frequent database hits) and to manually remove unlikely identifications,such as drug action pathways, to restrict off-target hits in our annotation algorithm.This careful focus of the data input revealed key molecular networks (catabolic pro-cesses) reflective of products associated with kidney function, canonical central nervoussystem (CNS) inflammation, amino acid and lipid metabolism, and vitamin absorption
TABLE 1 Summary of soman exposure-altered urine solutea
ESI modeFold change inmetabolite peak P value Solute name Solute formula RT (min) m/z dppm
NEG 0.45193 0.00160 Guanosine-3=,5=-diphosphate C10H15N5O11P2 4.58 442.0211 9.092775NEG 0.4864 0.00773 Citric acid C6H8O7 0.42 191.0192 2.781159NEG 2.3912 0.04993 Uric acid C5H4N4O3 0.34 167.0199 6.901621POS 2.2575 0.00119 Kynurenic acid C10H7NO3 1.57 190.0503 2.260052POS 2.7 0.00409 Quinoline C9H7N 3.13 130.0645 4.847519POS 3.4701 0.00000 Leukotriene C4 C30H47N3O9S 2.08 626.3129 3.806747POS 11.883 0.00033 Norepinephrine sulfate C8H11NO6S 3.17 250.0398 7.291454POS 3.0192 0.00018 5-Hydroxyindoleacetic acid C10H9NO3 1.62 192.0666 5.670386NEG 27.481 0.0018 p-Cresol C7H8O 3.11 107.0501 1.270889POS 6.8123 0.0301 Phenylacetic acid C8H8O2 2.96 137.060 4.37399POS 6.572 0.00467 N-Butyryl-L-homoserine lactone C8H13NO3 2.39 172.0968 0.089186POS 3.0117 0.00435 L-Carnitine C7H15NO3 0.39 162.1123 1.041845POS 4.0547 0.00140 Glycine C2H5NO2 2.45 76.0397 5.287456POS 4.2532 0.00000 Neuraminic acid C9H17NO8 0.39 268.1006 7.883747POS 6.8278 0.00337 Retinoyl glucuronide C26H36O8 5.48 477.2527 9.227536POS 7.083 0.00276 Glutathione C10H17N3O6S 3.16 308.091 0.198757POS 7.6032 0.00970 D-Alanine/L-alanine C3H7NO2 0.69 90.0557 8.396408POS 5.78 0.00861 Aldosterone C21H28O5 5.72 361.2036 7.455842aData represent results of analysis of urine metabolites whose excretion significantly differed (P � 0.05) in seizing animals compared to nonseizing animals. Thesemetabolites were validated by an additional independent experiment. NEG, negative; POS, positive; RT, retention time.
Soman-Induced Changes in Microbiome and Urine Applied and Environmental Microbiology
November 2018 Volume 84 Issue 21 e00978-18 aem.asm.org 7
on June 30, 2019 by guesthttp://aem
.asm.org/
Dow
nloaded from
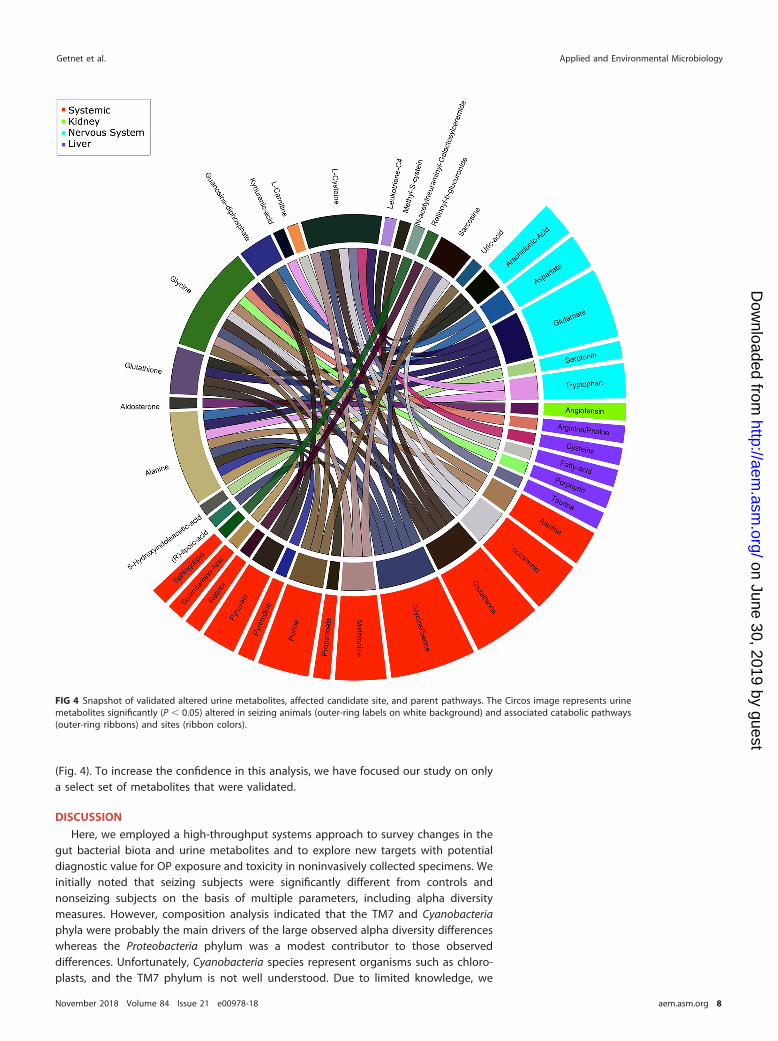
(Fig. 4). To increase the confidence in this analysis, we have focused our study on onlya select set of metabolites that were validated.
DISCUSSION
Here, we employed a high-throughput systems approach to survey changes in thegut bacterial biota and urine metabolites and to explore new targets with potentialdiagnostic value for OP exposure and toxicity in noninvasively collected specimens. Weinitially noted that seizing subjects were significantly different from controls andnonseizing subjects on the basis of multiple parameters, including alpha diversitymeasures. However, composition analysis indicated that the TM7 and Cyanobacteriaphyla were probably the main drivers of the large observed alpha diversity differenceswhereas the Proteobacteria phylum was a modest contributor to those observeddifferences. Unfortunately, Cyanobacteria species represent organisms such as chloro-plasts, and the TM7 phylum is not well understood. Due to limited knowledge, we
FIG 4 Snapshot of validated altered urine metabolites, affected candidate site, and parent pathways. The Circos image represents urinemetabolites significantly (P � 0.05) altered in seizing animals (outer-ring labels on white background) and associated catabolic pathways(outer-ring ribbons) and sites (ribbon colors).
Getnet et al. Applied and Environmental Microbiology
November 2018 Volume 84 Issue 21 e00978-18 aem.asm.org 8
on June 30, 2019 by guesthttp://aem
.asm.org/
Dow
nloaded from
concluded that data from these two phyla are insufficient for drawing meaningfulconclusions with respect to the observed biological differences at this time. Thus, wefocused our efforts on close examination of the genus compositions of the variousphyla identified in our study, especially Proteobacteria. To this end, we noted thepresence of Facklamia genus, a member of the Firmicutes, only in the feces and not inthe ileum digesta of rats exposed to soman. This genus is associated only minimallywith invasive disease, but it is known to be occasionally isolated from specimens ofurinary tract infections and chorioamnionitis infections (22). We also observed Blautia,another Firmicutes family member, which was highly enriched only in the feces ofsoman-exposed animals. Unfortunately, limited data are available regarding the met-abolic functions, specifically, hydrolysis, reduction, or esterification of xenobiotics, forthese organisms within the gut and additional investigations are needed in this area.
Many of the organophosphate-degrading (opd) genes implicated in the enhanceddegradation of OP chemicals are located on mobile elements known to be transferredbetween organisms (23). In addition, a majority of these genes exhibit broad specificityand activity against OP chemicals either by directly hydrolyzing the phosphoesterbonds in organophosphorus compounds or by further degradation of methylphospho-nate esters to reduce the toxicity or reactivation of OP (4, 23). Such genes have beenisolated from select species of the Flavobacterium, Pseudomonas, Alteromonas, Burk-holderia, Bacillus, Alcaligenes, Enterobacter, and Rhizobium genera, to name a few. Sincewe had identified multiple genera such as Enterobacter and Rhizobium that are knownto be carriers of opd genes and involved in enhanced biodegradation of OP chemicals,we investigated opd genes from pooled fecal specimens and detected several targetsthat indicated that the expected gene templates were present in the bacterial biota(see Fig. S8 in the supplemental material). However, we do not have evidence for aspecific species that is carrying the opd gene templates or transcript data supportingthe idea of active expression of the genes (no RNA or protein). Rhizobium, an Alpha-proteobacteria, is an aerobic, oxidase-positive, Gram-negative bacillus isolated from thesoil environment and is known to cause plant tumors (24, 25). Currently, there is limitedinformation about which species of Rhizobium reside in the gut of mammals as routinecommensals (which would be identifiable with a whole-genome sequencing approach)and whether these have a functional role(s) (15, 24). The Bilophila genus is a Deltapro-teobacteria, where B. wadsworthia is the only known species in this genus. B. wadswor-thia is known to thrive on taurine and H2 production, especially around highly fermen-tative sites (26). We found that B. wadsworthia was highly enriched and detectable inall soman-exposed cohorts irrespective of dose or seizing status but not in controlanimals, suggesting that an unusually highly anaerobic environment could have pro-moted this organism’s detection. Hence, we decided to validate B. wadsworthia usinga PCR assay targeting 16S rRNA in fecal DNA extracts, pooled due to the limitedamounts of the original specimens (Fig. S8). We observed that B. wadsworthia levelswere altered across pooled groups, especially in seizing animals with high doseexposure, and that its 16S rRNA was only minimally expressed in controls.
Seizures that accompany soman intoxication lead to profound brain damagethrough excitotoxic cell death of neurons, accompanied by neuroinflammation (27).Along this line, we detected elevated levels of tryptophan catabolism (�2-fold change),revealed by the detection of kynurenic acid and quinoline, in the urine of seizinganimals. Kynurenic acid is a putative neuroprotective metabolite and an antagonist ofN-methyl-D-aspartate (NMDA) receptors (21, 28, 29). Elevated levels of quinoloneindicate overall increased systemic tryptophan catabolism during soman intoxication inseizing animals, presumably driven by inflammation in the brain, known to induceexpression of tryptophan-degrading indoleamine-2,3-dioxygenase (IDO) (28, 29). Thisnotion of the inflammatory neuropathology of soman exposure was further supportedby the detection of increased systemic levels of the eicosanoid inflammatory mediatorleukotriene C4 (LTC4) in the urine of seizing animals. LTC4 is one of the cysteinylleukotrienes (cys-LTs) generated by the enzymatic oxidation of arachidonic acid, a fattyacid released from neuronal membrane glycerophospholipids during a secondary
Soman-Induced Changes in Microbiome and Urine Applied and Environmental Microbiology
November 2018 Volume 84 Issue 21 e00978-18 aem.asm.org 9
on June 30, 2019 by guesthttp://aem
.asm.org/
Dow
nloaded from
phase of brain injury (via a cascade of physiological reactions to primary injury) (30, 31).Furthermore, after acute soman intoxication and seizure onset, high levels of acetyl-choline accumulate in the CNS. This is followed by decreased levels of norepinephrine,aspartate, and glutamate (GLU) (i.e., excitatory amino acid [EAA] neurotransmitters) inthe brain (5, 32). After neuronal damage, the sustainment of seizures involves increasesin concentration of EAAs such as GLU along with norepinephrine, serotonin (5-hydroxytryptamine [5-HT]), and its metabolite 5-hydroxyindolacetic acid (5-HIAA) (27).In our experimental system, the primary stimulant soman is known to cause severeneuropathology, specifically, inflammation of the CNS. Consistent with this notion, weobserved and validated increased levels of the neurotransmitters norepinephrine (�11-fold change) and the serotonin metabolite 5-HIAA and increased levels of the cys-LTLTC4 in the urine metabolite profile of seizing animals, clearly indicating increasedinflammation associated with CNS neuropathology. Aldosterone is an essential miner-alocorticoid hormone directly involved in the regulation of sodium absorption andpotassium excretion in the kidney, salivary glands, sweat glands, and colon (33).Elevated levels of aldosterone are known to alter glomerular structure and function viapro-oxidative and profibrotic changes (34). Hence, aldosterone increases glomerularpermeability to albumin, leading to increased protein urinary excretion. We found thaturinary excretion of aldosterone is more than 5 times higher in seizing rats than innonseizing rats, suggesting that symptomatic soman exposure may cause proteinuriaand increased electrolyte excretion. Furthermore, in this context, aldosterone-drivennephropathy and renal damage of modest effect are possible secondary features ofsoman insult that can be easily exploited for presymptomatic monitoring of exposure.However, our experimental design did not include proper specimen preservation oranalysis of renal function, specifically, of levels of protein in urine, for use in readilyavailable gold standard clinical pathology assays.
Xenobiotic metabolites of microbial origin have been previously detected in urine(35, 36). In our study, we identified a few of the most common microbial urinarymetabolites, including p-cresol and phenylacetic acid (37). Both of these metabolitesresult from tyrosine catabolism by colon microbes and are then sulfated by the colonicepithelium, resulting in reabsorption back into the host. High levels of p-cresol sulfateare correlated with cardiovascular diseases as well as mortality of chronic kidneydisease patients (35). Furthermore, the phenolic features of such compounds arespeculated to mimic neurotransmitters and interfere with the blood-brain barrier (35).Consistent with our finding of dysbiosis of the gut bacterial biota, the soman-exposedanimals in our study had significant increases in the levels of p-cresol (27�) andphenylacetic acid (7�) in their urine compared to nonseizing animals. However, we didnot obtain enough 16S sequencing resolution for species-level information in ourefforts to identify organisms, especially those associated with tyrosine catabolism suchas Clostridium difficile (35).
Although this was a proof-of-concept study (i.e., a feasibility study) that applieduntargeted technologies, we were able to enrich for candidate diagnostic markers bothfrom the bacterial biota and from urine solutes and to also identify organisms with apotential role as forensic signatures of exposure. With additional resources and better-targeted technology, we plan to pursue a more detailed analysis of a large cohort ofanimals, specifically, to temporally populate quantitative ratios of specific bacteria andurine metabolites in male and female rats. Furthermore, we plan to profile multiplechemical nerve agents and pesticides. On the basis of these findings, one can envisionmoderately complex assays with a correlation matrix and a decision algorithm toenhance current clinical microbiology and urine chemistry workflows for diagnosticpurposes. This would be valuable for presymptomatic-phase screening to enabledisease modifying therapies, determining the radius of impact during mass exposure,and casual/passive screening of training sites and camps, as well as monitoring ofrefugees from noninvasive samples.
Getnet et al. Applied and Environmental Microbiology
November 2018 Volume 84 Issue 21 e00978-18 aem.asm.org 10
on June 30, 2019 by guesthttp://aem
.asm.org/
Dow
nloaded from
MATERIALS AND METHODSAnimals. Male Sprague-Dawley rats (Charles River Laboratories, Kingston, NY) (250 to 300 g) were
individually housed on a 12:12-h light cycle with ad libitum access to food and water. Rats were weigheddaily. The experimental protocol was approved by the Institutional Animal Care and Use Committee atthe United States Army Medical Research Institute of Chemical Defense (IACUC U-908), and all proce-dures were conducted in accordance with the principles stated in the Guide for the Care and Use ofLaboratory Animals and the Animal Welfare Act of 1966 (P.L. 89 –544), as amended.
Surgery and EEG recording. Rats were surgically implanted with a subcutaneous transmitter(F-40EET; Data Sciences International, Inc. [DSI], St. Paul, MN) as described by Schultz et al. (38) to recordbihemispheric cortical EEG waveform activity as well as body temperature and activity throughout theduration of the experiment. Surgery was conducted under conditions of isoflurane administration (3% to4% induction; 1.5% to 3% maintenance), and rats received buprenorphine (Reckitt Benckiser Pharma-ceuticals, Inc., Richmond, VA) (0.03 mg/kg of body weight, subcutaneously [s.c.]) immediately after fullrecovery from anesthesia. Rats were allowed to recover from surgery for 7 to 14 days prior to somanexposure. RPC-1 PhysioTel receivers (DSI) were placed under the rats’ home cages for EEG acquisition (24h/day) with baseline recordings made at least 24 h prior to exposure. Data were digitized at 250 Hz andrecorded using Dataquest ART 4.1 (Acquisition software; DSI).
Soman exposures. Rats were exposed to soman at 0.8 or 1.0 LD50 (0.5 ml/kg, using 157.4 and 196.8�g/ml, respectively) or saline solution (control) and evaluated for seizure activity. The soman LD50 for ratsis 98.4 �g/ml (38). Soman was obtained from the Edgewood Chemical Biological Center (AberdeenProving Ground, MD). To promote survival, rats that received 1.0 LD50 of mg/kg soman were treated withmedical countermeasures (MCM; an admix of 2 mg/kg atropine sulfate [ATS; Sigma-Aldrich ChemicalCompany, St. Louis, MO, USA] and 93.6 mg/kg HI-6 [Starkes Associates, Buffalo, NY, USA] [0.5 ml/kg,intramuscularly {i.m.}]) at 1 min after exposure and rats that developed seizures were treated with 10mg/kg diazepam (DZP; Hospira Inc., Lake Forest, IL, USA) (2 ml/kg, s.c.) at 30 min after seizure onset (withaverage seizure onset of 8 min).
Behavioral seizure. Behavioral seizures were scored using a modified Racine scale (17–19) consisting ofthe following stages: stage 1, mastication, tongue fasciculation, oral tonus; stage 2, head tremors, head bobs;stage 3, limb clonus or tonus, body tremor; stage 4, rearing with forelimb clonus; stage 5, rearing and fallingwith generalized convulsions. For analysis, rats received a score corresponding to the maximum stage reachedper time interval. Observations were made continuously for up to 5 h after exposure to soman.
EEG analysis. Full-power spectral analysis of EEG, identification of epileptiform activity, and other EEGanomalies were analyzed according to methods described previously (39). EEG-recorded seizures wereconfirmed through visual screening and characterized by sustained frequencies and the value correspondingto the most prominent frequencies in hertz (e.g., the highest power level calculated by the MatLab program,expressed in microvolts squared per hertz). Some soman-exposed rats developed seizure activity (SE), with theseizure onset at �8 min for those exposed to 1.0 LD50, while others did not develop seizures.
Sample collection. All surfaces and tools, including a guillotine, collection foils, sample tubes, salinesolution bottle, and syringes, were sprayed with RNase Away. Animals were administered Fatal-Plus(sodium pentobarbital), and, once fully anesthetized, the rats were euthanized using a guillotine. Urinewas collected directly from the bladder using a syringe with a 21-gauge needle, saved in RNase-freemicrocentrifuge tubes, and flash frozen in liquid nitrogen. The ileum was removed and flash frozen.Digesta was flushed out by rinsing with sterile saline solution during sample processing. Organs werecollected in foils and flash frozen in liquid nitrogen. Fresh fecal pellets were collected during rat handlingand stored at �80°C for processing.
DNA extraction. Samples were kept cold at all times before the extraction. The Ileum tissues wereweighed and homogenized in 50 mM Tris-HCl (Lonza, Walkersville, MD, USA) with 2 nM EDTA solution(Lonza) using a BeadBeater (Bio Spec Products, Inc., Bartlesville, OK, USA), the DNA extraction was carriedout using a Qiagen DNeasy blood and tissue kit (Qiagen Inc., Germantown, MD, USA), and RNA wasextracted using TRIzol reagent (Invitrogen, Life Technologies, Grand Island, NY, USA) in conjunction witha Qiagen miRNeasy minikit (Qiagen). The fecal samples were weighed, RNA was extracted using a MoBioPowerSoil total RNA isolation kit (Mo Bio Laboratories, Inc., Carlsbad, CA, USA), and DNA was extractedusing a MoBio PowerSoil DNA elution accessory kit. The extracted DNA was used for PCR and sequencing.
Library preparation and sequencing. We used primers that were previously designed to amplifythe V3-V4 hypervariable regions of the 16S rRNA gene (40). A limited-cycle PCR generated a singleamplicon of �460 bp, and this was followed by addition of Illumina sequencing adapters and dual-indexbarcodes. Using paired 300-bp reads and MiSeq v3 reagents, the ends of each read were overlapped togenerate high-quality, full-length reads of the V3 and V4 regions in a single run.
Data analysis. Sequence read quality assessment, filtering, barcode trimming, and chimera detectionwere performed on demultiplexed sequences using the USEARCH method in the Quantitative InsightsInto Microbial Ecology (QIIME) package (v.1.9.1) (41). OTUs were defined by clustering with 97% sequencesimilarity cutoffs (at 3% divergence). The representative sequence for an OTU was chosen as the mostabundant sequence showing up in that OTU by collapsing identical sequences and choosing the onethat was read with the most abundant sequences. Representative sequences were then alignedagainst the Greengenes database core set (v.gg_13_8) using the PyNAST alignment method(http://greengenes.secondgenome.com/). The minimum sequence length of 150 nucleotides (nt) andthe minimum match value of 75% were used for the alignment (42, 43). The RDP Classifier program (v.2.2)was used to assign the taxonomy to the representative set of sequences using a prebuilt database ofassigned sequences of a reference set (44). Alpha diversity analysis was performed using the PhyloSeqR package (www.bioconductor.org), and the Chao1 metric (to estimate the species richness), the
Soman-Induced Changes in Microbiome and Urine Applied and Environmental Microbiology
November 2018 Volume 84 Issue 21 e00978-18 aem.asm.org 11
on June 30, 2019 by guesthttp://aem
.asm.org/
Dow
nloaded from
observed-species metric (representing the count of unique OTUs found in the sample), and thephylogenetic distance (PD_whole_tree) were calculated (45). Similarly, beta diversity data were calcu-lated using QIIME and visualized using principal-coordinate analysis (PCoA) to visualize distancesbetween samples on an x-y-z plot. The ranked-abundance profile was created using the BiodiversityR RBioconductor package (2.7-2) to highlight the most abundant phylum in all samples. To determine thedifferentially abundant taxonomic groups over different groups in the soman-exposed animals versusnon-soman-exposed animals at different doses and in the seizing group versus the non-seizing group,linear models were fitted using moderated standard errors and the empirical Bayes model following thetrimmed mean of M-values normalization method (TMM) for normalization of OTU counts. The normal-ized abundance profile was created across different doses (0.8 and 1.0 LD50) of soman exposurecompared with control samples; similarly, samples from seizing versus nonseizing rats were compared tonon-soman-exposed control samples.
To predict the metabolites contributed per microbial composition, we used PICRUSt (v.1.0.0), an opensource tool that uses precomputed gene content inference for 16S rRNA. PICRUSt uses the OTUabundance count generated using “closed-reference” OTU picking against the Greengenes database fornormalization of OTU tables. Each OTU value was first divided by known as well as predicted 16S copynumber abundance values (46). Final metagenome functional predictions were performed by multiplyingnormalized OTU abundance values by values corresponding to each predicted functional profile.Statistical hypothesis testing analysis of metagenomics profiles was performed using R to compare KEGGOrthologs (v.80.0) data between pre- and post-soman-exposed samples, and principal-coordinate anal-ysis was also performed. The predicted metagenome functional counts were normalized using the TMMnormalization method to fit linear models using the contrast function to compute fold changes bymoderating the standard errors using an empirical Bayes model. Log odds and moderated t statisticscorresponding to differential predicted significant metabolite data derived from KEGG Orthologs usingcomparisons between pre- and post-soman-exposed samples at different doses and the seizing groupversus the nonseizing group were computed with a P value cutoff of �0.05. Significant metabolites werefurther annotated using an in-house metabolite annotation function with other databases such as HMDB(v.2.5), KEGG (compounds, pathways, orthologs, and reactions) (v.80.0), SMPDB (v.2.0), and FOODB (v.1.0).
Metabolomic profiling and data analysis. Urine samples were processed using the method ofTyburski et al. (47). Briefly, the samples were thawed on ice and subjected to vortex mixing. Formetabolite extraction, 20 �l of urine was mixed with 80 �l of 50% acetonitrile (in water) containinginternal standards (10 �l of debrisoquine [1 mg/ml] and 50 �l of 4-nitrobenzoic acid [1 mg/ml]). Thesupernatant was transferred to a fresh tube and used for ultraperformance liquid chromatography-electrospray ionization-quadrupole-time of flight-mass spectrometry (UPLC-ESI-Q-TOF-MS) analysis (XevoG2; Waters Corporation, USA). Each sample (5 �l) was injected onto a reverse-phase 50-by-2.1-mm BEH1.7-�m-pore-size C18 column using an Acquity UPLC system (Waters Corporation, USA). The gradientmobile phase was comprised of water containing 0.1% formic acid solution (buffer A) and acetonitrilecontaining a 0.1% formic acid solution (buffer B). Each sample was resolved for 10 min at a flow rate of0.5 ml/min. This approach has been extensively used for metabolomic profiling of biofluids, UPLCgradient conditions, and mass spectrometry parameters and was described in detail previously (48–50).The UPLC gradient consisted of 100% buffer A for 0.5 min, a ramp curve of 6% to 60% buffer B from 0.5min to 4.5 min, a ramp curve of 6% to 100% buffer B from 4.5 to 8.0 min, a hold at 100% buffer B until9.0 min, and then a ramp curve of 6% to 100% buffer A from 9.0 min to 9.2 min, followed by a hold at100% buffer A until 10 min. The column eluent was introduced directly into the mass spectrometer byelectrospray. Mass spectrometry was performed on a quadrupole-time of flight mass spectrometeroperating in either negative or positive electrospray ionization mode with a capillary voltage of 3.2 kVand a sampling cone voltage of 35 V. The desolvation gas flow rate was 800 liters/h, and the temperaturewas set to 350°C. The cone gas flow rate was 50 liters/h, and the source temperature was 150°C. The datawere acquired in V mode with a scan time of 0.3 s and an interscan delay of 0.08 s. Accurate mass wasmaintained by infusing sulfadimethoxine (311.0814 m/z) into 50% aqueous acetonitrile (250 pg/�l) at arate of 30 �l/min via the lockspray interface every 10 s. Data were acquired in centroid mode using a m/zmass range of 50 to 850 for TOF-MS scanning, in duplicate (technical replicates), for each sample inpositive- and negative-ionization modes and checked for chromatographic reproducibility. For allprofiling experiments, the sample queue was staggered by interspersing samples of the two groups toeliminate bias. Pooled sample injections performed throughout the run (one pool was created by mixing2-�l aliquots from all 110 samples) were used as quality controls (QCs) to assess the inconsistencies thatare particularly evident in large batch acquisitions in terms of retention time drifts and variations in ionintensity over time. QCs were projected in the orthogonal partial least-squares– discriminant analysis(OPLS-DA) model along with the study samples to ensure that the technical performance did not impactthe biological information (51). The raw data were preprocessed using XCMS software (52) for peakdetection and alignment. The resultant three-dimensional data matrix consisting of mass/charge ratioswith retention times and feature intensities was subjected to multivariate data analysis using Metabo-Analyst v 3.0. Quantitative descriptors of model quality for the OPLS-DA models included R2 (explainedvariation of the binary outcome [treatment versus control]) and Q2 (cross-validation-based predictedvariation of the binary outcome). We used score plots to visualize the discriminating properties of theOPLS-DA models. The features selected via OPLS-DA were used for accurate mass-based databasesearches; subsequently, the identity of a subset of metabolites was confirmed using tandem massspectrometry.
Ethics approval and consent to participate. This research complied with the Animal Welfare Actand implemented Animal Welfare regulations and the Public Health Service Policy on Humane Care and
Getnet et al. Applied and Environmental Microbiology
November 2018 Volume 84 Issue 21 e00978-18 aem.asm.org 12
on June 30, 2019 by guesthttp://aem
.asm.org/
Dow
nloaded from
Use of Laboratory Animals and adhered to the principles noted in The Guide for the Care and Use ofLaboratory Animals (National Research Council [NRC], 2011). Consent for publication was not needed(human subjects did not participate in this study).
Accession number(s). Sequences can be accessed from the NCBI Sequence Read Archive (SRA) atstudy accession no. SRP116704 (BioProject no. PRJNA401162).
Data availability. Data generated and analyzed during this study are included in the publishedarticle and the supplemental material files, with the exception of raw urine mass spectrometry and75-day microbiome assay data, which are available from M. Jett upon request.
SUPPLEMENTAL MATERIAL
Supplemental material for this article may be found at https://doi.org/10.1128/AEM.00978-18.
SUPPLEMENTAL FILE 1, PDF file, 1.3 MB.
ACKNOWLEDGMENTSWe thank Kirandeep Gill (Georgetown University) for technical assistance with
metabolomics data as well as Matthew Rice and Julia Scheerer for editorial input.The views, opinions, and findings contained in this report are ours and should not
be construed as official Department of the Army, Department of Defense, or U.S.Government positions, policies, or decisions unless so designated by other officialdocumentation. Citations of commercial organizations or trade names in this report donot constitute an official Department of the Army endorsement or approval of theproducts or services of these organizations. The Biomedical Advanced Research andDevelopment Authority (BARDA) was not involved in the study design or in thecollection, analysis, and interpretation of data or the decision to write the manuscriptand submit it for publication.
We declare no competing interests.Support was provided by interagency agreements between BARDA, the Geneva
Foundation (ARO agreement no. W911NF-13-1-0376), and the U.S. Army MedicalResearch Institute of Chemical Defense (USAMRICD) as well as a memorandum ofagreement between USAMRICD and the U.S. Army Center of Environmental Health(USACEHR). The Metabolomics Shared Resource in Georgetown University (Wash-ington, DC, USA) is partially supported by NIH/NCI/CCSG grant P30-CA051008.
D.G. analyzed data and wrote the manuscript. A.G. coordinated microbiome andmetabolomics analyses and obtained the samples, A.H. processed microbiome speci-mens and completed validation, R.K. analyzed the data, and A.K.C. completed metabo-lomics analysis. F.R. analyzed the EEG data, and C.R.S. conducted animal experiments.L.A.L., M.J., and R.H. conceived and designed the study and edited the manuscript. Allof us read and approved the final manuscript.
REFERENCES1. Abdollahi M, Karami-Mohajeri S. 2012. A comprehensive review on
experimental and clinical findings in intermediate syndrome caused byorganophosphate poisoning. Toxicol Appl Pharmacol 258:309 –314.https://doi.org/10.1016/j.taap.2011.11.014.
2. Marrs TC. 1993. Organophosphate poisoning. Pharmacol Ther 58:51– 66.https://doi.org/10.1016/0163-7258(93)90066-M.
3. Acon-Chen C, Koenig JA, Smith GR, Truitt AR, Thomas TP, Shih TM. 2016.Evaluation of acetylcholine, seizure activity and neuropathology follow-ing high-dose nerve agent exposure and delayed neuroprotective treat-ment drugs in freely moving rats. Toxicol Mech Methods 26:378 –388.https://doi.org/10.1080/15376516.2016.1197992.
4. Singh BK, Walker A. 2006. Microbial degradation of organophosphoruscompounds. FEMS Microbiol Rev 30:428 – 471. https://doi.org/10.1111/j.1574-6976.2006.00018.x.
5. Shih T-M, McDonough JH, Jr. 1997. Neurochemical mechanisms insoman-induced seizures. J Appl Toxicol 17:255–264. https://doi.org/10.1002/(SICI)1099-1263(199707)17:4�255::AID-JAT441�3.0.CO;2-D.
6. Misik J. 2015. Acute toxicity of some nerve agents and pesticides in rats.Drug Chem Toxicol 38:32–36. https://doi.org/10.3109/01480545.2014.900070.
7. Kassa J, Korabecny J, Sepsova V, Tumova M. 2014. The evaluation ofprophylactic efficacy of newly developed reversible inhibitors of acetyl-cholinesterase in soman-poisoned mice - a comparison with commonlyused pyidostigmine. Basic Clin Pharmacol Toxicol 115:571–576. https://doi.org/10.1111/bcpt.12269.
8. Villa AF, Houze P, Monier C, Risede P, Sarhan H, Borron SW, MegarbaneB, Garnier R, Baud FJ. 2007. Toxic doses of paraoxon alter the respiratorypattern without causing respiratory failure in rats. Toxicology 232:37– 49.https://doi.org/10.1016/j.tox.2006.12.006.
9. Kadar T, Raveh L, Cohen G, Oz N, Baranes I, Balan A, Ashani Y, Shapira S.1985. Distribution of H-3 soman in mice. Arch Toxicol 58:45– 49. https://doi.org/10.1007/BF00292616.
10. Reynolds ML, Little PJ, Thomas BF, Bagley RB, Martin BR. 1985. Relation-ship between the biodisposition of [3H]soman and its pharmacologicaleffects in mice. Toxicol Appl Pharmacol 80:409 – 420. https://doi.org/10.1016/0041-008X(85)90385-0.
11. Shih ML, Mcmonagle JD, Dolzine TW, Gresham VC. 1994. Metabolitepharmacokinetics of soman, sarin and GF in rats and biological moni-toring of exposure to toxic organophosphorus agents. J Appl Toxicol14:195–199. https://doi.org/10.1002/jat.2550140309.
Soman-Induced Changes in Microbiome and Urine Applied and Environmental Microbiology
November 2018 Volume 84 Issue 21 e00978-18 aem.asm.org 13
on June 30, 2019 by guesthttp://aem
.asm.org/
Dow
nloaded from
12. Brown MA, Brix KA. 1998. Review of health consequences from high-,intermediate- and low-level exposure to organophosphorus nerveagents. J Appl Toxicol 18:393– 408. https://doi.org/10.1002/(SICI)1099-1263(199811/12)18:6�393::AID-JAT528�3.0.CO;2-0.
13. Appel AS, McDonough JH, McMonagle JD, Logue BA. 2016. Analysis ofnerve agent metabolites from hair for long-term verification of nerveagent exposure. Anal Chem 88:6523– 6530. https://doi.org/10.1021/acs.analchem.6b01274.
14. Appel AS, Logue BA. 2016. Analysis of nerve agent metabolites from nailclippings by liquid chromatography tandem mass spectrometry. J Chro-matogr B Analyt Technol Biomed Life Sci 1031:116 –122. https://doi.org/10.1016/j.jchromb.2016.07.034.
15. Horne I, Sutherland TD, Harcourt RL, Russell RJ, Oakeshott JG. 2002.Identification of an opd (organophosphate degradation) gene in anAgrobacterium isolate. Appl Environ Microbiol 68:3371–3376. https://doi.org/10.1128/AEM.68.7.3371-3376.2002.
16. Contrepois K, Jiang L, Snyder M. 2015. Optimized analytical proceduresfor the untargeted metabolomic profiling of human urine and plasma bycombining hydrophilic interaction (HILIC) and reverse-phase liquid chro-matography (RPLC)-mass spectrometry. Mol Cell Proteomics 14:1684 –1695. https://doi.org/10.1074/mcp.M114.046508.
17. Racine R, Chipashvili S, Okujava V. 1972. Modification of seizure activityby electrical stimulation: III. Mechanisms. Electroencephalogr Clin Neu-rophysiol 32:295–299. https://doi.org/10.1016/0013-4694(72)90178-2.
18. Racine RJ. 1972. Modification of seizure activity by electrical stimulation.I. After-discharge threshold. Electroencephalogr Clin Neurophysiol 32:269 –279. https://doi.org/10.1016/0013-4694(72)90176-9.
19. Racine RJ. 1972. Modification of seizure activity by electrical stimulation.II. Motor seizure. Electroencephalogr Clin Neurophysiol 32:281–294.https://doi.org/10.1016/0013-4694(72)90177-0.
20. Patti GJ, Yanes O, Siuzdak G. 2012. Innovation: metabolomics: the apo-gee of the omics trilogy. Nature Rev Mol Cell Biol 13:263–269. https://doi.org/10.1038/nrm3314.
21. Dantzer R, O’Connor JC, Lawson MA, Kelley KW. 2011. Inflammation-associated depression: from serotonin to kynurenine. Psychoneuroendocri-nology 36:426–436. https://doi.org/10.1016/j.psyneuen.2010.09.012.
22. Lawson PA, Collins MD, Falsen E, SJoden B, Facklam R. 1999. Facklamialanguida sp. nov., isolated from human clinical specimens. J Clin Micro-biol 37:1161–1164.
23. Karpouzas DG, Singh BK. 2006. Microbial degradation of organophosphorusxenobiotics: metabolic pathways and molecular basis. Adv Microb Physiol51:119–225. https://doi.org/10.1016/S0065-2911(06)51003-3.
24. Pereira LA, Chan DSG, Ng TM, Lin R, Jureen R, Fisher DA, Tambyah PA.2009. Pseudo-outbreak of Rhizobium radiobacter infection resultingfrom laboratory contamination of saline solution. J Clin Microbiol 47:2256 –2259. https://doi.org/10.1128/JCM.02165-08.
25. Moreau-Gaudry V, Chiquet C, Boisset S, Croize J, Benito Y, Cornut PL,Bron A, Vandenesch F, Maurin M. 2012. Three cases of post-cataractsurgery endophthalmitis due to Rhizobium (Agrobacterium) radiobacter.J Clin Microbiol 50:1487–1490. https://doi.org/10.1128/JCM.06106-11.
26. da Silva SM, Venceslau SS, Fernandes CLV, Valente FMA, Pereira IAC.2008. Hydrogen as an energy source for the human pathogen Bilophilawadsworthia. Antonie Van Leeuwenhoek 93:381–390. https://doi.org/10.1007/s10482-007-9215-x.
27. McDonough JH, Jr, Shih TM. 1997. Neuropharmacological mechanismsof nerve agent-induced seizure and neuropathology. Neurosci BiobehavRev 21:559 –579. https://doi.org/10.1016/S0149-7634(96)00050-4.
28. Savitz J, Dantzer R, Wurfel BE, Victor TA, Ford BN, Bodurka J, BellgowanPSF, Teague TK, Drevets WC. 2015. Neuroprotective kynurenine metab-olite indices are abnormally reduced and positively associated withhippocampal and amygdalar volume in bipolar disorder. Psychoneu-roendocrinology 52:200 –211. https://doi.org/10.1016/j.psyneuen.2014.11.015.
29. Savitz J, Drevets WC, Smith CM, Victor TA, Wurfel BE, Bellgowan PSF,Bodurka J, Teague TK, Dantzer R. 2015. Putative neuroprotective andneurotoxic kynurenine pathway metabolites are associated with hip-pocampal and amygdalar volumes in subjects with major depressivedisorder. Neuropsychopharmacology 40:463– 471. https://doi.org/10.1038/npp.2014.194.
30. Farias S, Frey LC, Murphy RC, Heidenreich KA. 2009. Injury-related produc-tion of cysteinyl leukotrienes contributes to brain damage following exper-imental traumatic brain injury. J Neurotrauma 26:1977–1986. https://doi.org/10.1089/neu.2009.0877.
31. Raithel M, Zopf Y, Kimpel S, Naegel A, Molderings G, Buchwald F, Schultis
H, Kressel J, Hahn E, Konturek P. 2011. The measurement of leukotrienesin urine as diagnostic option in systemic mastocytosis. J Physiol Phar-macol 62:469 – 472.
32. Hu CY, Robinson CP. 1988. The effects of soman on norepinephrineuptake, release, and metabolism. Toxicol Appl Pharmacol 96:185–190.https://doi.org/10.1016/0041-008X(88)90079-8.
33. Bizzarri C, Pedicelli S, Cappa M, Cianfarani S. 2016. Water balance and ‘saltwasting’ in the first year of life: the role of aldosterone-signaling defects.Horm Res Paediatr 86:143–153. https://doi.org/10.1159/000449057.
34. Bernardi S, Toffoli B, Zennaro C, Bossi F, Losurdo P, Michelli A, CarrettaR, Mulatero P, Fallo F, Veglio F, Fabris B. 2015. Aldosterone effects onglomerular structure and function. J Renin Angiotensin Aldosterone Syst16:730 –738. https://doi.org/10.1177/1470320315595568.
35. Tanaka H, Sirich TL, Meyer TW. 2015. Uremic solutes produced by colonmicrobes. Blood Purif 40:306 –311. https://doi.org/10.1159/000441578.
36. Tanaka H, Sirich TL, Plummer NS, Weaver DS, Meyer TW. 2015. Anenlarged profile of uremic solutes. PLoS One 10:e0135657. https://doi.org/10.1371/journal.pone.0135657.
37. Meyer TW, Hostetter TH. 2012. Uremic solutes from colon microbes.Kidney Int 81:949 –954. https://doi.org/10.1038/ki.2011.504.
38. Schultz MK, Wright LKM, Furtado MD, Stone MF, Moffett MC, Kelley NR,Bourne AR, Lumeh WZ, Schultz CR, Schwartz JE, Lumley LA. 2014.Caramiphen edisylate as adjunct to standard therapy attenuates soman-induced seizures and cognitive deficits in rats. Neurotoxicol Teratol44:89 –104. https://doi.org/10.1016/j.ntt.2014.06.002.
39. de Araujo Furtado M, Lumley LA, Robison C, Tong LC, Lichtenstein S,Yourick DL. 2010. Spontaneous recurrent seizures after status epilepticusinduced by soman in Sprague-Dawley rats. Epilepsia 51:1503–1510.https://doi.org/10.1111/j.1528-1167.2009.02478.x.
40. Klindworth A, Pruesse E, Schweer T, Peplies J, Quast C, Horn M, GlocknerFO. 2013. Evaluation of general 16S ribosomal RNA gene PCR primers forclassical and next-generation sequencing-based diversity studies. Nu-cleic Acids Res 41:e1. https://doi.org/10.1093/nar/gks808.
41. Caporaso JG, Kuczynski J, Stombaugh J, Bittinger K, Bushman FD,Costello EK, Fierer N, Pena AG, Goodrich JK, Gordon JI, Huttley GA, KelleyST, Knights D, Koenig JE, Ley RE, Lozupone CA, McDonald D, Muegge BD,Pirrung M, Reeder J, Sevinsky JR, Tumbaugh PJ, Walters WA, Widmann J,Yatsunenko T, Zaneveld J, Knight R. 2010. QIIME allows analysis ofhigh-throughput community sequencing data. Nat Methods 7:335–336.https://doi.org/10.1038/nmeth.f.303.
42. McDonald D, Price MN, Goodrich J, Nawrocki EP, DeSantis TZ, Probst A,Andersen GL, Knight R, Hugenholtz P. 2012. An improved Greengenestaxonomy with explicit ranks for ecological and evolutionary analyses ofbacteria and archaea. ISME J 6:610 – 618. https://doi.org/10.1038/ismej.2011.139.
43. Caporaso JG, Bittinger K, Bushman FD, DeSantis TZ, Andersen GL, Knight R.2010. PyNAST: a flexible tool for aligning sequences to a template align-ment. Bioinformatics 26:266–267. https://doi.org/10.1093/bioinformatics/btp636.
44. Wang Q, Garrity GM, Tiedje JM, Cole JR. 2007. Naive Bayesian classifierfor rapid assignment of rRNA sequences into the new bacterial taxon-omy. Appl Environ Microbiol 73:5261–5267. https://doi.org/10.1128/AEM.00062-07.
45. McMurdie PJ, Holmes S. 2013. phyloseq: an R package for reproducibleinteractive analysis and graphics of microbiome census data. PLoS One8:e61217. https://doi.org/10.1371/journal.pone.0061217.
46. Langille MGI, Zaneveld J, Caporaso JG, McDonald D, Knights D, Reyes JA,Clemente JC, Burkepile DE, Thurber RLV, Knight R, Beiko RG, Hutten-hower C. 2013. Predictive functional profiling of microbial communitiesusing 16S rRNA marker gene sequences. Nat Biotechnol 31:814 – 821.https://doi.org/10.1038/nbt.2676.
47. Tyburski JB, Patterson AD, Krausz KW, Slavik J, Fornace AJ, Jr, GonzalezFJ, Idle JR. 2009. Radiation metabolomics. 2. Dose- and time-dependenturinary excretion of deaminated purines and pyrimidines after sublethalgamma-radiation exposure in mice. Radiat Res 172:42–57.
48. Patterson AD, Maurhofer O, Beyoglu D, Lanz C, Krausz KW, Pabst T,Gonzalez FJ, Dufour JF, Idle JR. 2011. Aberrant lipid metabolism inhepatocellular carcinoma revealed by plasma metabolomics and lipidprofiling. Cancer Res 71:6590 – 6600. https://doi.org/10.1158/0008-5472.CAN-11-0885.
49. Li F, Patterson AD, Krausz KW, Tanaka N, Gonzalez FJ. 2012. Metabolo-mics reveals an essential role for peroxisome proliferator-activated re-ceptor alpha (PPARalpha) in bile acid homeostasis. J Lipid Res 53:1625–1635. https://doi.org/10.1194/jlr.M027433.
Getnet et al. Applied and Environmental Microbiology
November 2018 Volume 84 Issue 21 e00978-18 aem.asm.org 14
on June 30, 2019 by guesthttp://aem
.asm.org/
Dow
nloaded from
50. Tyburski JB, Patterson AD, Krausz KW, Slavik J, Fornace AJ, Jr, Gonzalez FJ,Idle JR. 2008. Radiation metabolomics. 1. Identification of minimally invasiveurine biomarkers for gamma-radiation exposure in mice. Radiat Res 170:1–14.
51. Bylesjö M, Rantalainen M, Cloarec O, Nicholson JK, Holmes E, Trygg J.2006. OPLS discriminant analysis: combining the strengths of PLS-DA
and SIMCA classification. J Chemom 20:341–351. https://doi.org/10.1002/cem.1006.
52. Smith CA, Want EJ, O’Maille G, Abagyan R, Siuzdak G. 2006. XCMS:processing mass spectrometry data for metabolite profiling using non-linear peak alignment, matching, and identification. Anal Chem 78:779 –787. https://doi.org/10.1021/ac051437y.
Soman-Induced Changes in Microbiome and Urine Applied and Environmental Microbiology
November 2018 Volume 84 Issue 21 e00978-18 aem.asm.org 15
on June 30, 2019 by guesthttp://aem
.asm.org/
Dow
nloaded from