akashdeep commerce classes - yolavivekworld.yolasite.com/resources/sybcom economics notes.pdf ·...
TRANSCRIPT
Business Economics Paper Business Economics Paper Business Economics Paper Business Economics Paper IIIIIIII Revised June 20Revised June 20Revised June 20Revised June 2011110000
S.Y.B.Com
By - Vivek Kumar
AKASHDEEP COMMERCE CLASSESRahul Wadekar's

Vivek Kumar
2
Business Economics Paper II
Second Year B.Com. of University of Mumbai With effect from 2009-2010
Section I 1. Introduction to Macro Economics
Circular flow of Income: Closed (Two and three sector models) and open Economy models, Trade cycles features and phases- changing Sectoral composition of India’s national income. 2. Economy in the short run
Meaning of aggregate demand and equilibrium National income (Y=E), concept of multiplier. Supply of money: constituents; determinants; velocity of circulation of money; RBI approach to money supply, Money demand: liquidity preference. IS-LM frame work, 3. Issues in inflation, Employment and unemployment
Demand pull and cost push inflation, inflationary gap, Causes and effects of inflation, measures to control inflation in India, Impact of globalization on employment in India, Nature of unemployment in India, Employment policy since1991.
Section II
4. Economic transition in India
a. Agriculture: Importance of agriculture in India economy, recent issues and policies in Indian agriculture – WTO and Indian b. Industry: Structural changes and composition of industry since 1991, small scale industries; role, problems and policies since 2000, disinvestment: policies and issues, SEZ: Concept, role and impact c. Significance and growth of service sector.
5. Inclusive growth
Meaning and importance, National and global action plan – Millennium development goals, government policy to promote human development with reference to education, health, family welfare in India, National population policy 2000.
6. Economy in the long run
Long run objectives: growth and sustainability – concept and importance of knowledge economy, knowledge based exports from India.
AKASHDEEP COMMERCE CLASSES
3
CONTENTS
Section I 1. Introduction to Macro Economics
Circular flow of Income Changing Sectoral composition of India’s national income
2. Economy in the short run Keynesian theory of effective demand Multiplier. Determinants of Supply of money RBI approach to money supply, Money demand: cash transaction and cash balance methods liquidity preference. IS-LM curves,
3. Issues in inflation, Employment and unemployment
Demand pull and cost push inflation, inflationary gap, Causes and effects of inflation, Measures to control inflation in India, Globalization and employment Nature of unemployment in India, Employment policy since1991
Section II 4. Economic transition in India
Importance of agriculture in India economy, Recent issues National Agricultural Policy Indian agriculture – WTO and Indian Industrialization since 1991 Small scale industries Disinvestment policies and issues, Special Economic Zones Service sector
5. Inclusive growth Meaning and importance National and global action plan Millennium development goals, Human development Index and Education Human development and Health National population policy 2000
6. Economy in the long run Long run objectives Knowledge economy Knowledge Commission Knowledge based exports from India.
AKASHDEEP COMMERCE CLASSES Vivek Kumar
SYBCom Business Economics paper II (2009 onwards) 5
1. Introduction to Macro Economics
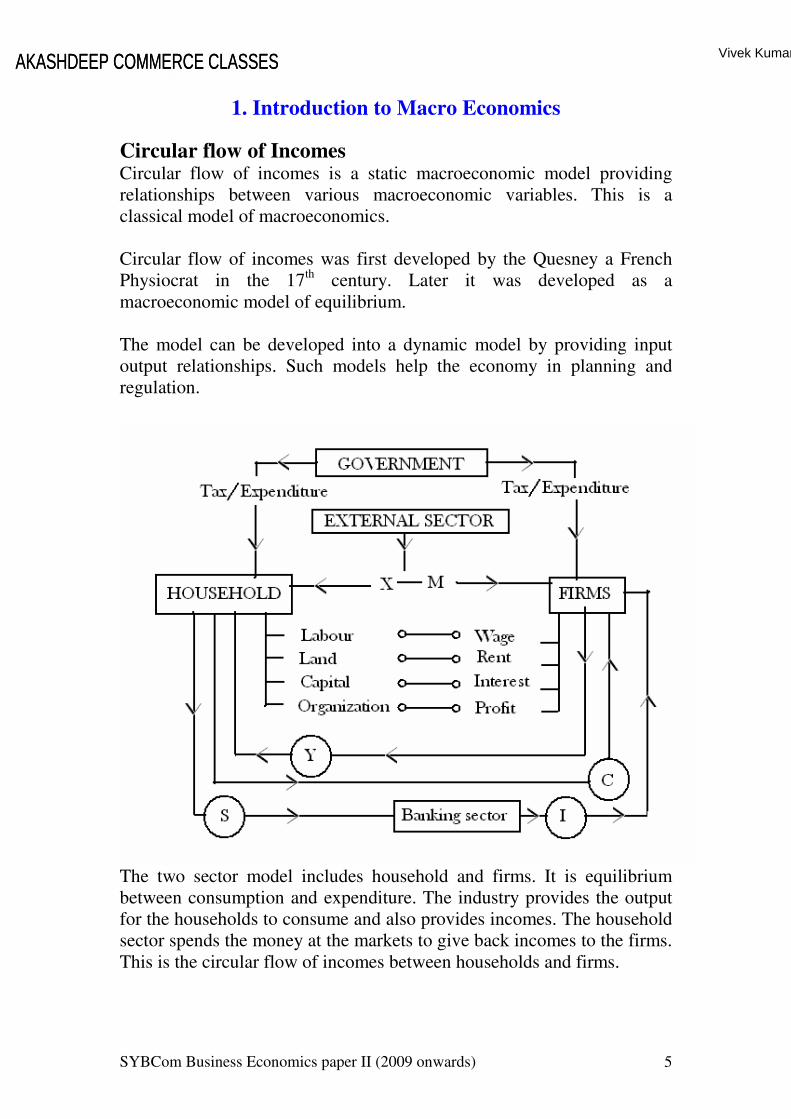
Circular flow of Incomes Circular flow of incomes is a static macroeconomic model providing relationships between various macroeconomic variables. This is a classical model of macroeconomics. Circular flow of incomes was first developed by the Quesney a French Physiocrat in the 17th century. Later it was developed as a macroeconomic model of equilibrium. The model can be developed into a dynamic model by providing input output relationships. Such models help the economy in planning and regulation.
The two sector model includes household and firms. It is equilibrium between consumption and expenditure. The industry provides the output for the households to consume and also provides incomes. The household sector spends the money at the markets to give back incomes to the firms. This is the circular flow of incomes between households and firms.
AKASHDEEP COMMERCE CLASSESAKASHDEEP COMMERCE CLASSES Vivek Kumar
6
The three sector model includes the banking sector, where the equilibrium includes
Y=C+S The households save the income that is not spent. Further the savings become investment through the banking sector. Thus
Y=C+I, where S=I Government sector will include tax and expenditure made on both the sectors.
Y=C+I+G It is closed economy. By including the external sector, it becomes an equilibrium with open economy.
Y=C+I+G+(X-M) This is a macroeconomic model with five sectors: household, firms, banking, Government and the external sectors. The circular flow of incomes is an important model or estimating national income. It is useful in studying the interdependence between various sectors.
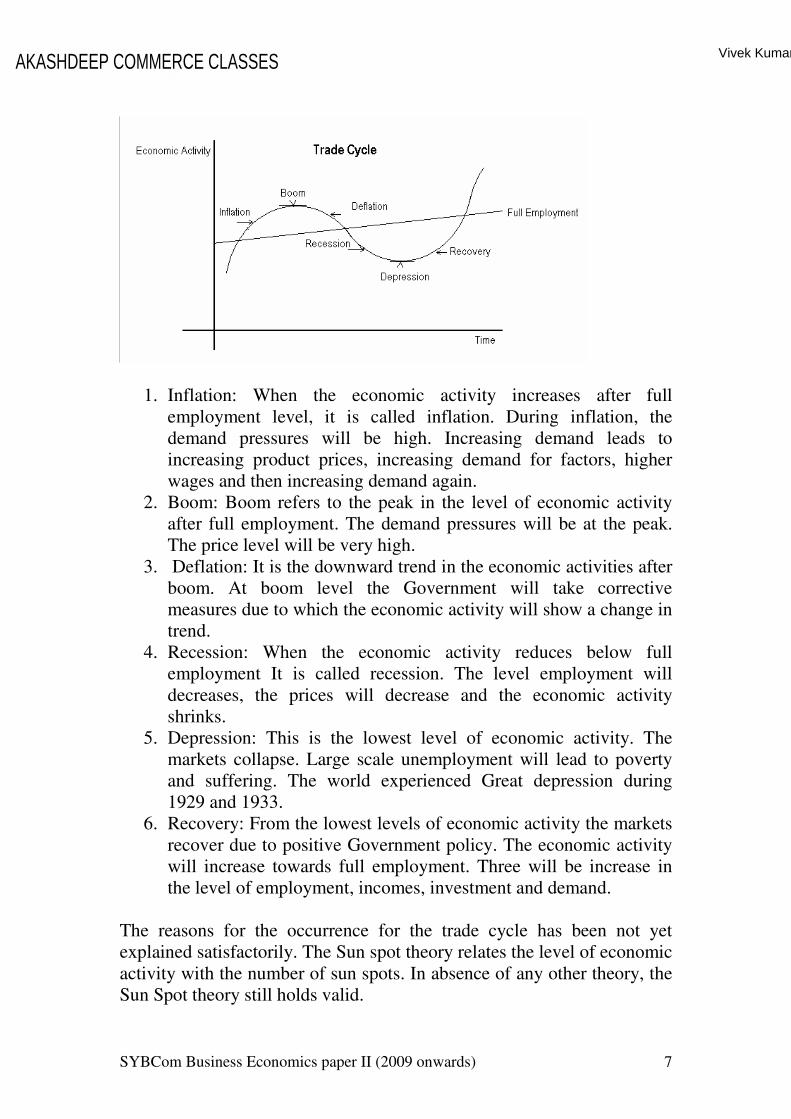
Trade Cycles Periodic changes in the level of economic acclivities in the long run are commonly termed as trade cycles. The level of economic activity periodically, increases and reaches a peak, shows a change in trend, decreases and bottoms out and finally, changes trend towards increase. Such cyclical changes in the level of economic activities constitute the trade cycle. Trade cycle is a neoclassical concept of macro economics which tries to explain the changes in the economic activities with respect to time. The concept of trade cycle was initially developed by Joseph Schumpeter. The different phases in the trade cycle are named in relation to the full employment level. Accordingly, there are six phases of trade cycle:
1. Inflation 2. Boom 3. Deflation 4. Recession 5. Depression, and 6. Recovery
AKASHDEEP COMMERCE CLASSES Vivek Kumar
SYBCom Business Economics paper II (2009 onwards) 7
1. Inflation: When the economic activity increases after full employment level, it is called inflation. During inflation, the demand pressures will be high. Increasing demand leads to increasing product prices, increasing demand for factors, higher wages and then increasing demand again.
2. Boom: Boom refers to the peak in the level of economic activity after full employment. The demand pressures will be at the peak. The price level will be very high.
3. Deflation: It is the downward trend in the economic activities after boom. At boom level the Government will take corrective measures due to which the economic activity will show a change in trend.
4. Recession: When the economic activity reduces below full employment It is called recession. The level employment will decreases, the prices will decrease and the economic activity shrinks.
5. Depression: This is the lowest level of economic activity. The markets collapse. Large scale unemployment will lead to poverty and suffering. The world experienced Great depression during 1929 and 1933.
6. Recovery: From the lowest levels of economic activity the markets recover due to positive Government policy. The economic activity will increase towards full employment. Three will be increase in the level of employment, incomes, investment and demand.
The reasons for the occurrence for the trade cycle has been not yet explained satisfactorily. The Sun spot theory relates the level of economic activity with the number of sun spots. In absence of any other theory, the Sun Spot theory still holds valid.
AKASHDEEP COMMERCE CLASSES Vivek Kumar

8
Phillips curve is the modern concept which relates unemployment and inflation. According to Phillip, there is a trade off between inflation and unemployment; one can be reduced only at the cost of the other. If inflation is reduced, unemployment increases and if unemployment is reduced inflation may increase. In such case the ideal alternative is to find such a point on the curve which is closest to the origin. By selecting such a combination, both inflation and unemployment can be maintained at tolerable levels.
Sectoral Composition of India’s National Income
According to Colin Clark, the economic development of any country is the transitions from the development of primary sector to the secondary manufactured sector. Such as transformation from primary to secondary sectors involve development of factors of production, skill, technology, resource utilization, human resource development and careful planning. The primary sector is made up of activities like agriculture, forestry, fishing, mining etc. The secondary sector comprises manufacturing, construction, power, water supply etc. The tertiary sector includes trade, transportation, finance, communication etc.
Sectoral Contribution To National Income : (percentages)
Primary Secondary Service
1950-51 57.0 13.5 29.5
1990-91 34.0 23.3 42.7
2006-07 20.6 24.7 54.7
AKASHDEEP COMMERCE CLASSES Vivek Kumar
SYBCom Business Economics paper II (2009 onwards) 9
Primary Sector
The role of primary sector is gradually reducing. Its contribution of 57 percent to national income in 1950-51 reduced to 34 percent by 1990-91 and further declined to 20.6 percent by 2006-07. The current agriculture share, though low, contributes to self sufficiency of food grain production and also raising exports of agricultural origin. This is because of the fact that over the years the productivity levels in agriculture have risen, rapidly. The New Agricultural development policy 1969 had greatly contributed to the development of the sector. In the primary sector agriculture is the main activity. It employs 70 percent of the work force. The cultivators are a majority with 42 percent and the agricultural laborers are only to the extent of 26.3 percent within the primary sector. Though the cultivators constitute 42 percent of the total occupations, they are mostly small and marginal farmers operating uneconomic land holdings. Primary Sector is a sector of large scale unemployment and poverty.
Secondary Sector
The share of secondary sector has increased greatly in the last sixty years. Its share was 13.5 percent of national income in 1950-51 which increased to 24.7 percent by 2006-07. Secondary sector has a dominant manufacturing sector. The increasing share is mostly due to rapid industrialization. Over the years industry has been growing almost at a rate of 7 percent per annum. The thrust given in the first two plan period to industry and the policy of public sector growth helped in widening the heavy industry base of development in India. The nationalization of large scale industries of 1950s and huge investment outlays on public sector were responsible in the development of secondary sector. In terms of occupation large and small scale industries together constitute 10 percent of the total occupational share. Mining and construction together constitute 2 percent of the occupational share. In the process of economic development it is natural that the role of agriculture declines. Though the share of primary sector decreases in relative terms, in absolute terms its output increased. This is because the industry and infrastructure develop and aid the primary sector developing rapidly. There will be increase in the productivity in leaps.
AKASHDEEP COMMERCE CLASSES Vivek Kumar

SYBCom Business Economics paper II (2009 onwards) 10
Service Sector:
It is essential to develop the service sector for the development of industry. With rapid development of trade and commerce, related infrastructure also develops. The growth of tertiary sector is ancillary to growth. The sector owes to the development in the insurance and communication sectors. Wide spread banking network, transportation and storage greatly contribution to rapid industrial development. The service sector’s share increased from 29.5 to 54.7 percent between 1950 and 2007. This is mostly due to globalization and growth of IT Sectors. Nationalization of insurance business of 1950s and 14 leading commercial banks in 1969 are land marks in the development of tertiary sector. The advent of satellite communication had made territory sector a high-tech sector. Growth of IT sector has added to the infrastructure. Globalization of the economy, making Indian industry competitive in the international market and soliciting foreign investment were the major changes of New Economic policy of 1991. This change gave an impetus to the growth of service sector. In the years to come the tertiary sector poised for much faster growth. It will be essential in the process of liberalization and Globalization of the economy. Within the tertiary sector, by occupations, trade and commerce constitute 6 percent and services make up for 8 percent. The rapid growth of service sector is evident by the fast developing "middle-class" in India. Over the years, India has experienced a transition in the structural pattern. The economy which was left independent as a mass of underdeveloped economy stagnant with low productivities, primitive technologies, dormant industry, absence of infrastructure, poverty and unemployment is I n the process of rapid transformation. The stagnant and primitive economy has transformed into a high growth economy. The New economic policy of 1991 has given a different policy direction to India by decontrols, deregulations and Globalization. The world around it is acknowledged that the Indian economy is potentially on the path of development. The process of liberalization had begun in 1980s, by 1985 it was further consolidated, finally, in 1991; New Economic policy gave a new
AKASHDEEP COMMERCE CLASSES Vivek Kumar
SYBCom Business Economics paper II (2009 onwards) 11
direction. The mixed economic pattern now takes shape of a market oriented economy. With globalization, the possibilities of rapid growth rates have increased. In spite of growth and potential of growth, India had been harboring tendencies of inequalities. The growth of monopolies in the corporate sector, differences in the distribution of personal incomes and disparities in the rural and urban land holdings highlight inequalities. However, the Government uses fiscal and legislative measures to bring in equalities, so that the benefits of development are shared by all, alike.
2. Economy in the short run Classical Theory of Employment
Macro economic theories provide relationship between various macro-economic variables like consumption, imports, savings, interest, invest, taxes, exports and employment. These relationships are studied with respect to employment. Hence macro-economic theories are called theories of employment.
Say’s Law Of Markets
The classical theory in general believes in laissez faire. Following are relationships advocated by classical theory.
1. Full employment is natural state. It is known that the objective of macro economic exercise is full employment. Thus full employment is natural tendency of every economy.
2. Unemployment or Over-employment is found in short run. In long run economies attain full employment.
3. Laissez faire indicates that there is no state interference. It is a process of full employment .It is natural and automatic.
J.B. say represents classical theory of employment. He explains working through say’s law of markets. According to him,
“Supply creates its own demand”
Any increment in supply will correspondingly increase demand. Increase in supply is possible only when wages are increased. Increase in income leads to increase in demand. This way the demand-supply equality is
maintained.
AKASHDEEP COMMERCE CLASSES Vivek Kumar

SYBCom Business Economics paper II (2009 onwards) 12
Criticisms of classical theories
1. Classical theories are long run theories: - According to Keynes theory should aim at short run problems and policies. Long run is imaginary.
2. Classical economists believed that economies could have equilibrium only with employment. But countries have equilibrium even with unemployment.
3. Increasing the level of employment is not possible by laissez faire policy. Full employment is not automatically
4. Savings do constitute leakage in classical system .It reduces demand.
5. Unemployment can not be solved by a wage-cut policy. Strong trade union movement will resist any decrease in wages.
Theory of Effective Demand
The classical economists failed to provide policy solutions to economic problems. The classical theory believed in long run and full employment equilibrium. Keynesian economics is short run economics. According to the theory equilibrium is possible even with unemployment. There is no automatic system in long run, which will grant full employment. According to Keynes employment theory, it should provide short run solutions He assigns an active role to the Govt. This is a deviation from traditional laissez faire system. Keynesian theory is called the general theory of employment The private investment can create employment to a certain level. Therefore the govt. investment can help in increasing the level of employment.
Factors Determining Effective Demand:- There are two important factors determining effective demand.
1. Aggregate demand function and 2. Aggregate supply function
AKASHDEEP COMMERCE CLASSES Vivek Kumar
SYBCom Business Economics paper II (2009 onwards) 13
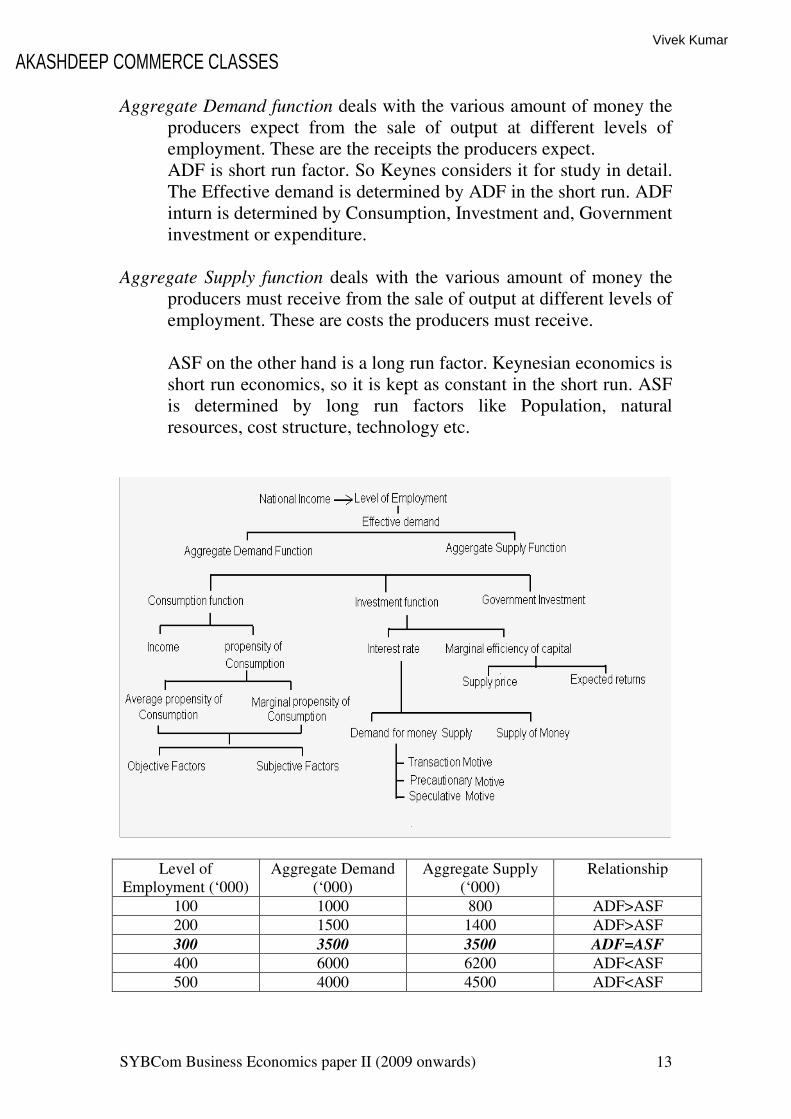
Aggregate Demand function deals with the various amount of money the producers expect from the sale of output at different levels of employment. These are the receipts the producers expect. ADF is short run factor. So Keynes considers it for study in detail. The Effective demand is determined by ADF in the short run. ADF inturn is determined by Consumption, Investment and, Government investment or expenditure.
Aggregate Supply function deals with the various amount of money the
producers must receive from the sale of output at different levels of employment. These are costs the producers must receive. ASF on the other hand is a long run factor. Keynesian economics is short run economics, so it is kept as constant in the short run. ASF is determined by long run factors like Population, natural resources, cost structure, technology etc.
Level of Employment (‘000)
Aggregate Demand (‘000)
Aggregate Supply (‘000)
Relationship
100 1000 800 ADF>ASF
200 1500 1400 ADF>ASF
300 3500 3500 ADF=ASF
400 6000 6200 ADF<ASF
500 4000 4500 ADF<ASF
AKASHDEEP COMMERCE CLASSESVivek Kumar
SYBCom Business Economics paper II (2009 onwards) 14
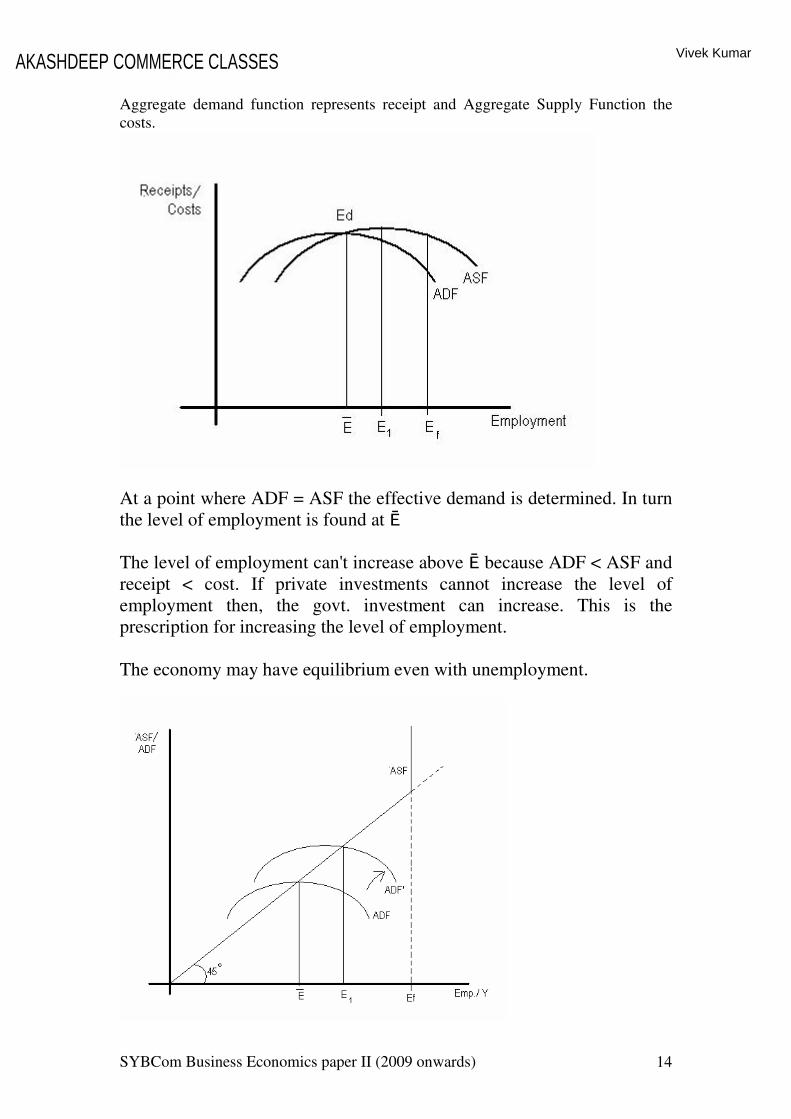
Aggregate demand function represents receipt and Aggregate Supply Function the costs.
At a point where ADF = ASF the effective demand is determined. In turn the level of employment is found at Ē The level of employment can't increase above Ē because ADF < ASF and receipt < cost. If private investments cannot increase the level of employment then, the govt. investment can increase. This is the prescription for increasing the level of employment. The economy may have equilibrium even with unemployment.
AKASHDEEP COMMERCE CLASSES Vivek Kumar
SYBCom Business Economics paper II (2009 onwards) 15
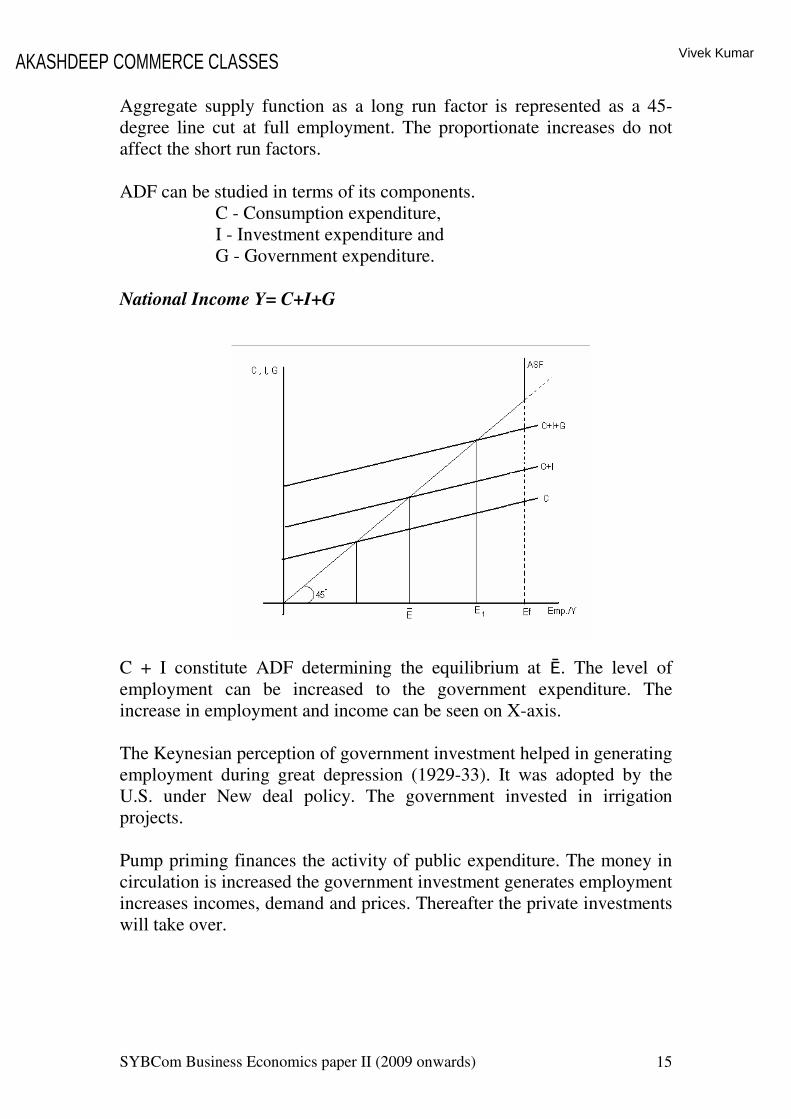
Aggregate supply function as a long run factor is represented as a 45-degree line cut at full employment. The proportionate increases do not affect the short run factors. ADF can be studied in terms of its components.
C - Consumption expenditure, I - Investment expenditure and G - Government expenditure.
National Income Y= C+I+G
C + I constitute ADF determining the equilibrium at Ē. The level of employment can be increased to the government expenditure. The increase in employment and income can be seen on X-axis. The Keynesian perception of government investment helped in generating employment during great depression (1929-33). It was adopted by the U.S. under New deal policy. The government invested in irrigation projects. Pump priming finances the activity of public expenditure. The money in circulation is increased the government investment generates employment increases incomes, demand and prices. Thereafter the private investments will take over.
AKASHDEEP COMMERCE CLASSES Vivek Kumar
SYBCom Business Economics paper II (2009 onwards) 16
The fall out of Keynesian government investment is inflation. In the process of generating resources for employment; the government increases the money in circulation. This is also called as deficit financing. Deficit financing is highly inflationary. Hence inflation is purely post Keynesian occurrence. However government investment is found highly suitable for financing development employment and growth.
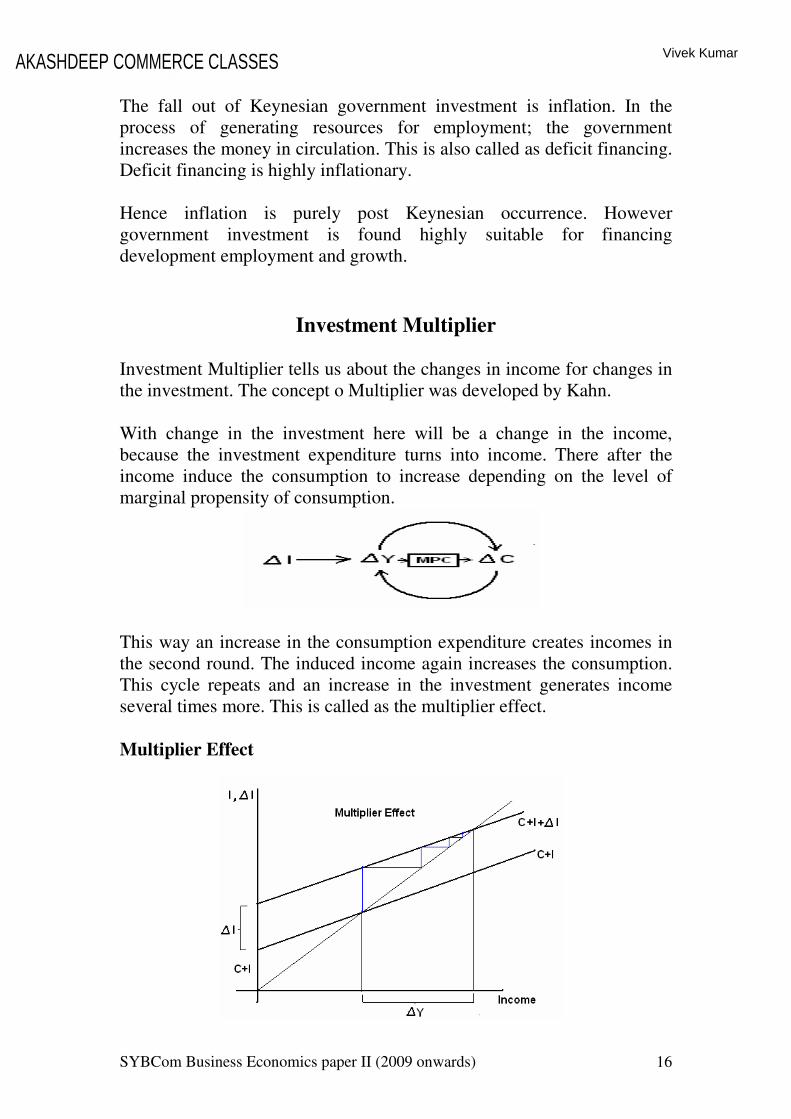
Investment Multiplier Investment Multiplier tells us about the changes in income for changes in the investment. The concept o Multiplier was developed by Kahn. With change in the investment here will be a change in the income, because the investment expenditure turns into income. There after the income induce the consumption to increase depending on the level of marginal propensity of consumption.
This way an increase in the consumption expenditure creates incomes in the second round. The induced income again increases the consumption. This cycle repeats and an increase in the investment generates income several times more. This is called as the multiplier effect.
Multiplier Effect
AKASHDEEP COMMERCE CLASSES Vivek Kumar
SYBCom Business Economics paper II (2009 onwards) 17
The multiplier has a time lag. The multiplier works into the long run. Each year some income is added and consumption is generated. This may taper with time but it shall continue for ever, theoretically. This is called multiplier effect Propensity of Consumption
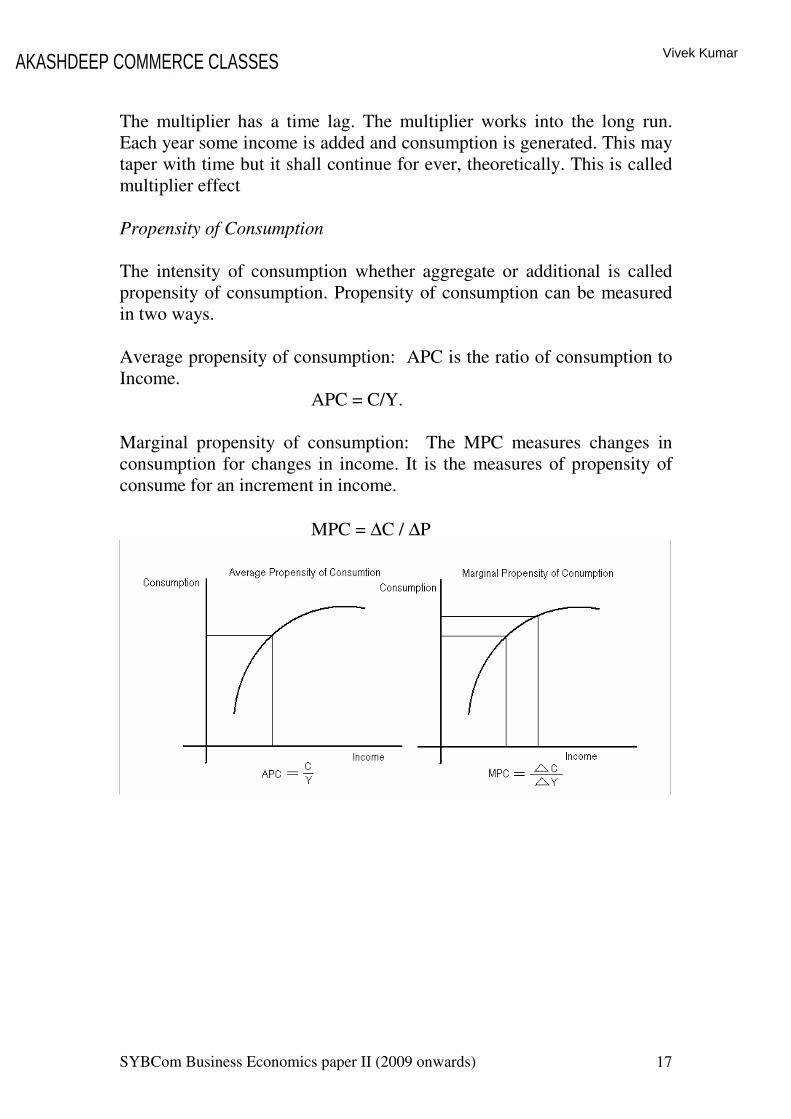
The intensity of consumption whether aggregate or additional is called propensity of consumption. Propensity of consumption can be measured in two ways. Average propensity of consumption: APC is the ratio of consumption to Income. APC = C/Y. Marginal propensity of consumption: The MPC measures changes in consumption for changes in income. It is the measures of propensity of consume for an increment in income.
MPC = ∆C / ∆P
AKASHDEEP COMMERCE CLASSES Vivek Kumar
SYBCom Business Economics paper II (2009 onwards) 18
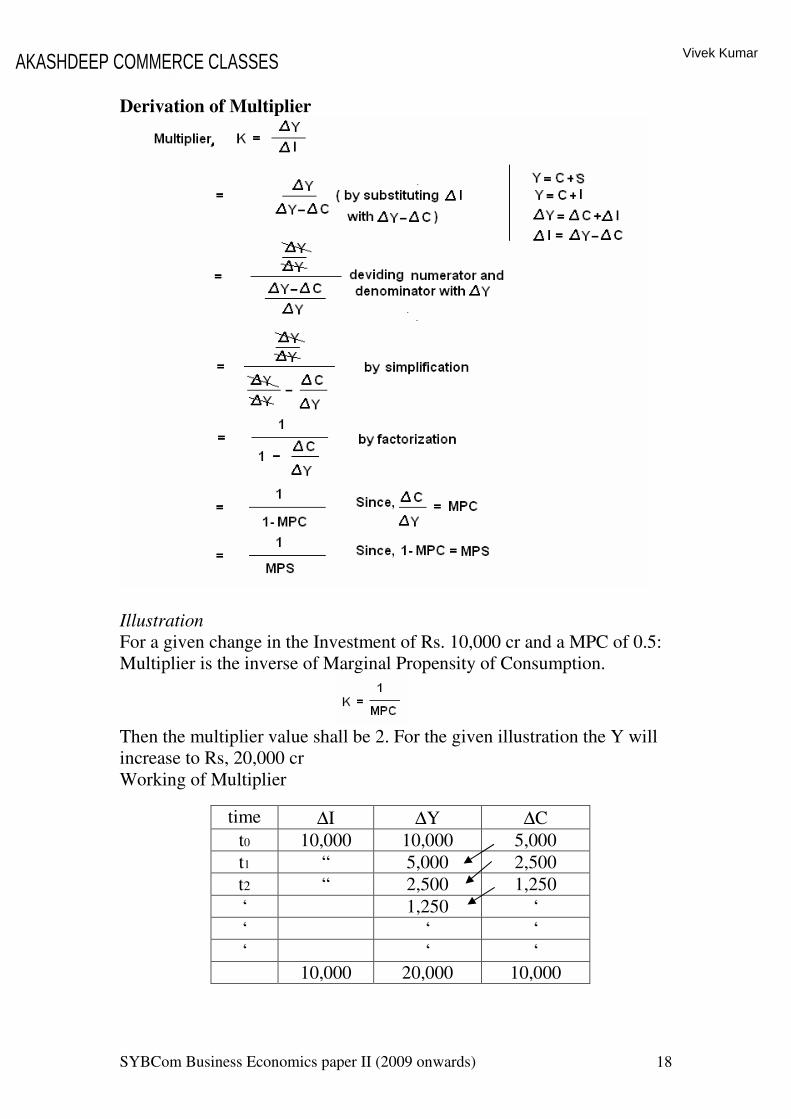
Derivation of Multiplier
Illustration
For a given change in the Investment of Rs. 10,000 cr and a MPC of 0.5: Multiplier is the inverse of Marginal Propensity of Consumption.
Then the multiplier value shall be 2. For the given illustration the Y will increase to Rs, 20,000 cr Working of Multiplier
time ∆I ∆Y ∆C
t0 10,000 10,000 5,000 t1 “ 5,000 2,500 t2 “ 2,500 1,250
‘ 1,250 ‘ ‘ ‘ ‘ ‘ ‘ ‘
10,000 20,000 10,000
AKASHDEEP COMMERCE CLASSES Vivek Kumar
SYBCom Business Economics paper II (2009 onwards) 19
Assumptions or Limitations or leakages in Multiplier
1. Multiplier effect lasts over a larger time period. There is time lag in the realization of multiplier effect. So in the short run only a part of the multiplier effect can be got. The remaining is considered as a leakage n the multiplier.
2. If the increased incomes are used in the repayment of old debts, the multiplier effect stops.
3. The increased incomes shall be spent on domestic consumption only. Money pent on imports will shift the multiplier effect outside the country.
4. With increased incomes the Government increases tax, the multiplier effect reduces. This is because the disposable income decreases each time.
5. There shall not be liquidity preference. If people hold cash balances with out spending the multiplier effect stops.
6. Investment in second hand securities and gold reduces multiplier effect.
7. There should be excess capacity in the industry to produce goods with increasing demand for consumer goods.
Acceleration Principle
The accelerator deals with changes in the investment for changes in the consumption. It is the continuation of multiplier effect. The multiplier indicated changes in Income for changes in the investment. With changes in the consumption, changes in the investment are given by acceleration principle.
Normally, assets last over a fixed life period. This is useful for the calculation of depreciation and capital consumption. At aggregate level, depreciation is treated as replace investment. Depending on the rate of depreciation, annually, certain investment is needed. This is called replacement investment. The capital output ratio tells us about the demand for investment for a certain output. For an increase in the consumption there will be certain need for investment. In addition there will be replacement investment. Together the total investment for the economy is computed.
AKASHDEEP COMMERCE CLASSESVivek Kumar
SYBCom Business Economics paper II (2009 onwards) 20
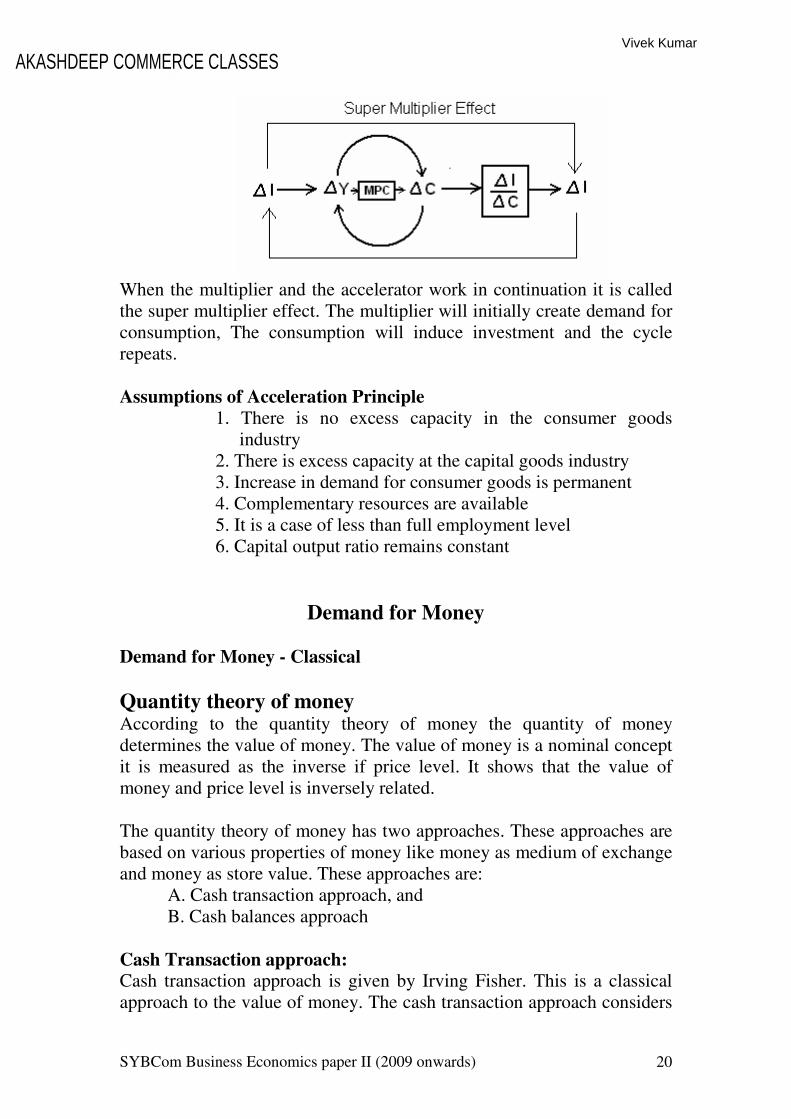
When the multiplier and the accelerator work in continuation it is called the super multiplier effect. The multiplier will initially create demand for consumption, The consumption will induce investment and the cycle repeats. Assumptions of Acceleration Principle
1. There is no excess capacity in the consumer goods industry
2. There is excess capacity at the capital goods industry 3. Increase in demand for consumer goods is permanent 4. Complementary resources are available 5. It is a case of less than full employment level 6. Capital output ratio remains constant
Demand for Money Demand for Money - Classical
Quantity theory of money According to the quantity theory of money the quantity of money determines the value of money. The value of money is a nominal concept it is measured as the inverse if price level. It shows that the value of money and price level is inversely related. The quantity theory of money has two approaches. These approaches are based on various properties of money like money as medium of exchange and money as store value. These approaches are: A. Cash transaction approach, and B. Cash balances approach Cash Transaction approach:
Cash transaction approach is given by Irving Fisher. This is a classical approach to the value of money. The cash transaction approach considers
AKASHDEEP COMMERCE CLASSESVivek Kumar
21
the money for transaction purposes; the property of medium of exchange is considered for defining the quantity theory. According to Fisher,
The monetary equilibrium is identified at a point where the demand for money is equal to the supply of money. This equality is used for explaining the quantity theory of money.
M V = P T Supply of Money = Demand for Money
The Supply of money is made up of M V where,
M - Money Stock V - Velocity of circulation of money
The demand for money is made up of P T, where
P – Price level T – Total amount of transactions At this equilibrium Fisher considers V and T to be constant in the short run. The velocity of circulation depends on the degree of monetization and number of transactions depends on the purchasing pattern of consumers. These two factors remain constant in the short run. Then there is a direct association between M = P With increase in M, the money stock the price level increases. In crease in the price level means, the value of money has decreased. This is the quantity theory of money. The Fisher’s equation to the quantity theory of money has several limitations.
1. The theory is an over simplification of monetary process. 2. It is a mathematical identity but fails to explain even the
monetary equilibrium. 3. The equation does not include real factors like investment,
employment or output. 4. The equation fails to bring in the cause and effect relation
ship between M and P. 5. Even though it is a monetary theory, it fails to include
important monetary variable like interest
AKASHDEEP COMMERCE CLASSESVivek Kumar

SYBCom Business Economics paper II (2009 onwards) 22
Demand for Money - Neo classical
Cash balances Approach (Cambridge Equations)
The cash balance approach to the quantity theory of money is given by Cambridge economists like A. Marshall, A.C. Pigou, Robertson and Keynes. The cash balance approach considers the store value of money as an important property. The Cambridge economists identify the households demand for cash for the purpose of hoarding as an important part of demand for money. The quantity theory is explained with the help of identities called as the Cambridge equations. 1. A. Marshall: The cash balance approach to the quantity theory of money is
explained with the help of the Cambridge equation M = PKT Where M is the money stock, P is the price level, T is the total value of transactions and K is that part of T which is held as cash balance. Assuming T and K to be constant in the short run, there is a direct association between M and P. The cash balance held by households is the hoarding of cash. This is an important part of demand for money.
2. A.C. Pigou M = KR P
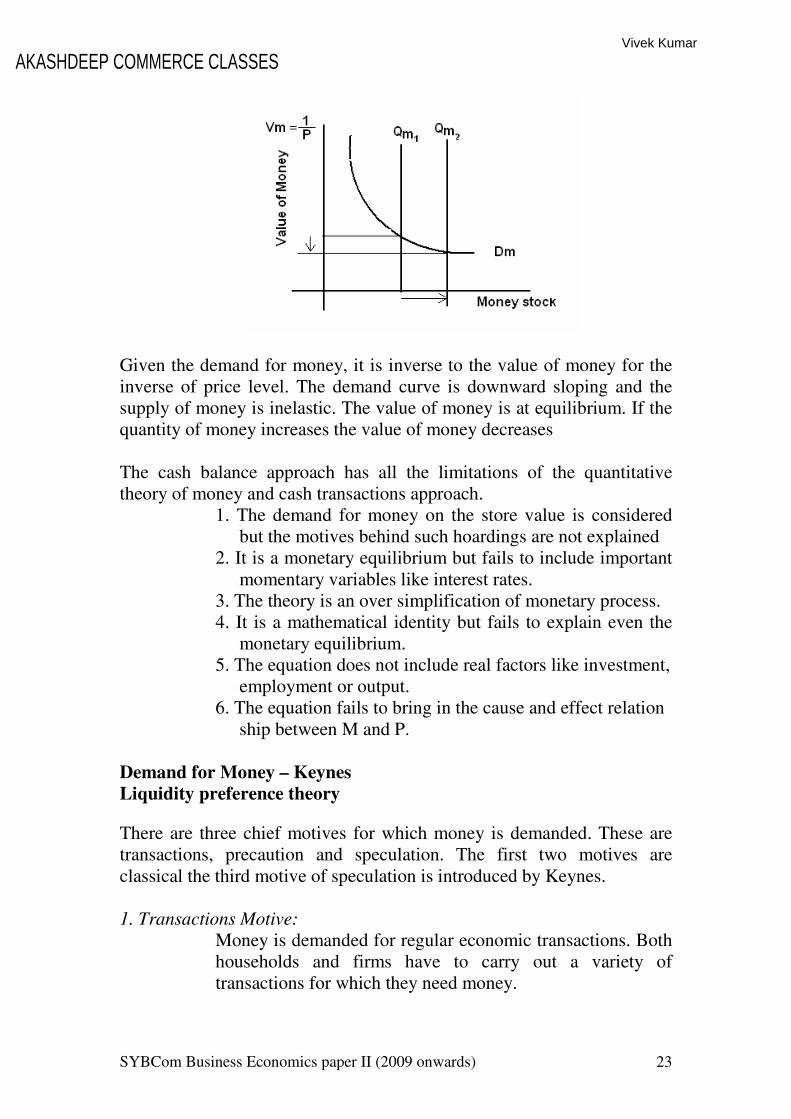
Where, M is the money stock, and P is the value of money, i.e. the inverse of price, R is the aggregate real resources and K is that part of R held as real balance by the households. In this case the money stock and the value of money are inversely related. This is the cash balance approach to quantity theory of money.
AKASHDEEP COMMERCE CLASSESVivek Kumar
SYBCom Business Economics paper II (2009 onwards) 23
Given the demand for money, it is inverse to the value of money for the inverse of price level. The demand curve is downward sloping and the supply of money is inelastic. The value of money is at equilibrium. If the quantity of money increases the value of money decreases The cash balance approach has all the limitations of the quantitative theory of money and cash transactions approach.
1. The demand for money on the store value is considered but the motives behind such hoardings are not explained
2. It is a monetary equilibrium but fails to include important momentary variables like interest rates.
3. The theory is an over simplification of monetary process. 4. It is a mathematical identity but fails to explain even the
monetary equilibrium. 5. The equation does not include real factors like investment,
employment or output. 6. The equation fails to bring in the cause and effect relation
ship between M and P.
Demand for Money – Keynes
Liquidity preference theory
There are three chief motives for which money is demanded. These are transactions, precaution and speculation. The first two motives are classical the third motive of speculation is introduced by Keynes. 1. Transactions Motive:
Money is demanded for regular economic transactions. Both households and firms have to carry out a variety of transactions for which they need money.
AKASHDEEP COMMERCE CLASSESVivek Kumar
SYBCom Business Economics paper II (2009 onwards) 24
It is related to the size of the income and type of activities performed by individuals, households and firms. Demand for money to satisfy transactions motive is about 50 percent of the size of an individual or household income.
2. Precautionary motive:
Money demanded to satisfy the precautionary motive is for meant for unforeseen circumstances. This amount of money kept aside can be used during times of uncertainty or emergency. It depends mainly on the size and responsibilities of the family and size of the income. In the short run these factors remain constant and hence demand for money also remains nearly constant.
3. Speculative motive:
Keynes was the first to identify the role of speculative activities. Such demand is made to invest in capital market for buying shares, bonds, securities etc. when their prices are low. Keeping money in this idle form is known as hoarding of money. It all depends upon fluctuating prices and market conditions for securities.
The total demand for money or liquidity can be classified into two parts:
Total demand for money = L = L1 + L2
L1 is that part of money or liquidity demanded to satisfy transactions and precautionary motives. Keynes calls this the demand for Active Cash balances or money. Active cash balances depend on the income of the households. The second part L2 is money demanded made to satisfy the speculative motive. Keynes has called this as demand for Passive Cash balances or money. Speculative demand depends upon the prices of securities.
AKASHDEEP COMMERCE CLASSESVivek Kumar
SYBCom Business Economics paper II (2009 onwards) 25
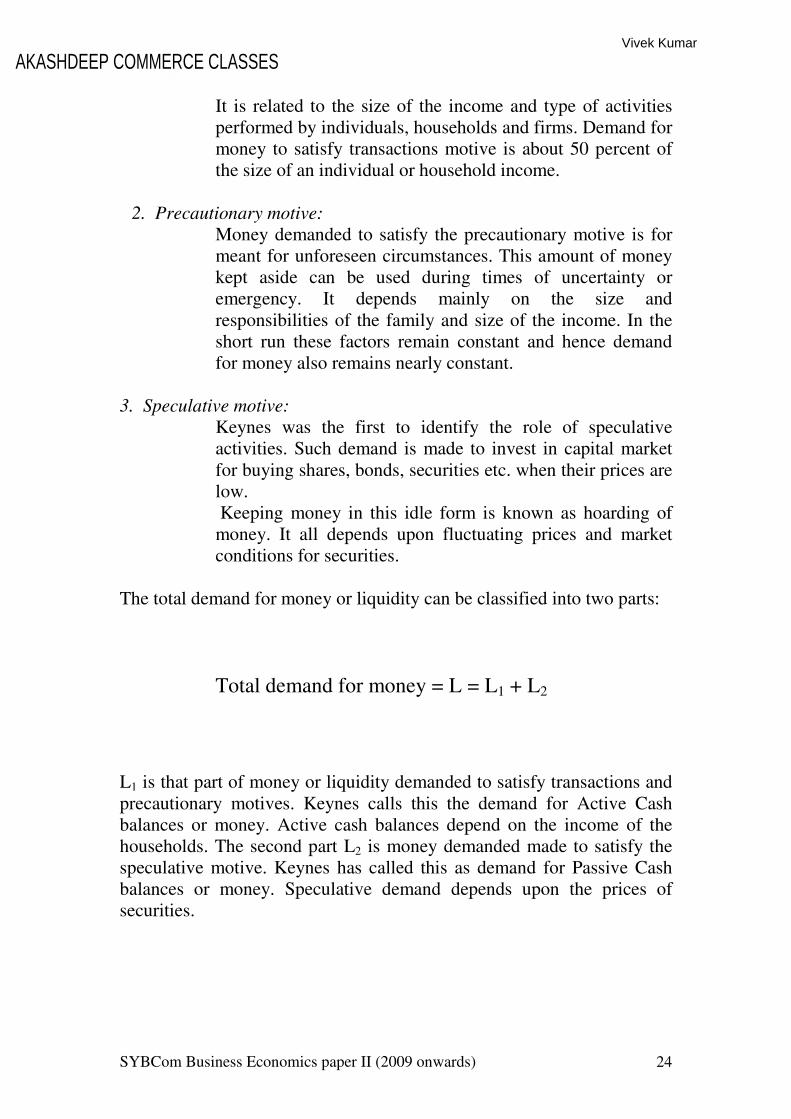
The negative relationship between rate of interest and liquidity preference is found only up to a minimum interest rate. There after, the demand for money becomes infinity. The zone where the demand for money is infinity is called as the liquidity trap. Any increase in money supply at this level will not have any effect on the liquidity preference. At liquidity trap the demand for money tends to be infinity.
Supply of Money
Velocity of money Velocity of money is defined simply as the rate at which money changes hands. Velocity refers to how many times a given quantity of money is spent during the period under consideration, usually one year. If velocity is high, money is changing hands quickly, and a relatively small money supply can fund a relatively large amount of purchases. If velocity is low, then money is changing hands slowly, and it takes a much larger money supply to fund the same number of purchases. It is known that GDP = M x V; that is, GDP equals the quantity of money times its velocity. By dividing the Gross Domestic Product (GDP) by the Money Supply (M1) Velocity of Money can be derived. Velocity of Money = Gross Domestic Product Money Supply
AKASHDEEP COMMERCE CLASSESVivek Kumar
SYBCom Business Economics paper II (2009 onwards) 26
Factors determining velocity of money
• Change in Price for goods and services.
• Availability of Substitutes
• Credit Supply
• Rate of Interest
• Banking habits
• Development of banking system
• Inflation
• Future expectations
• Liquidity preference
Constituents of Money supply
The supply of money is the State function. The Central bank possesses the monopoly of issue of currency. Traditionally the supply of constitutes coins and currency. There are several approaches to the constituents of money supply. 1. With ever expanding properties and functions of money the
constituents of money has been rapidly changing. Since David Hume, the composition of money started including coins and currency together with demand deposits. The deposits which are chequable are as liquid as cash. So primarily, money supply should be made up of: Coins and currency + Demand deposits
2. Milton Friedman described money with wider coverage and functions. According to him money supply should comprise coins and currency, demand deposits and also time deposits. Time deposits are those which have a time obligation between the bank and the depositors. They are liquid but with a time prescription.
Coins and currency + Demand deposits + Time deposits
The spending of the house hold is influenced by the cash held by them. But the time deposits also enhance the spending decisions. Time deposits can function as liquidity preference thus allowing households exercise greater spending.
AKASHDEEP COMMERCE CLASSESVivek Kumar
SYBCom Business Economics paper II (2009 onwards) 27
Milton Friedman’s approach is accepted and followed all over the world as the standard of measuring money supply. This is similar to the measure M3 followed by Reserve Bank of India.
3. Gurley and Shaw offer the widest definition of money supply. According to them, money supply shall include all that can be converted into cash, depending on convertibility of asset.
However, the assets shall be included in money supply based on their liquidity. E.g. Cash is cent percent liquid, where as time deposit has lesser liquidity, loans, securities, gold all have liquidity which gradually declines. These assets shall be included as per the weightages assigned to their liquidity.
4. Bank of England follows the method suggested by Radcliffe Committee. The method has wider coverage; it includes assets depending on liquidity and convertibility. Reserve Bank of India followed method similar to this upto 1977, when the II Working Group suggested an alternative and indigenous method of measuring money supply.
5. Reserve bank of India
The II Working Group appointed by The Reserve Bank of India suggested four measures to the money supply. These measures provide better definition to money supply and provide different estimates for use of monetary policy.
M1 = Coins and currency + Demand deposits of all Commercial and cooperative Banks
M2 = M1 + Demand deposits of Post office saving organization
M3 = M1 + Time deposit of Commercial and Cooperative Banks
M4= M3 + All deposits of Post office savings organizations
M1 is the measure of basic liquidity. It is this primary level liquidity which influences the hose hold price index of necessary goods. For control of inflation based on general price index, M1 is used for policy purposes.
AKASHDEEP COMMERCE CLASSESVivek Kumar
SYBCom Business Economics paper II (2009 onwards) 28
M2 is specially designed for the Indian context. It brings out the strength of the Post Office Savings Organization in India. India with its kind of spread, PO organization is selected as agency of banking facilities in the remote areas. M2 brings out the role of PO savings organization.
M3 is the international standard of money supply. IMF, World Bank and WTO use this measure, uniformly, for comparing different economies of the world. M3 is similar to Milton Friedman’s measure of money supply. M3 is the measure of aggregate liquidity in the economy. This is an important measure for monetary targeting by RBI.
M4 is the widest measure of monetary resources in India. It includes the demand, time and other deposits of commercial banks, cooperative bank and PO savings organization.
IS and LM Curves
The theory given by Hicks and Hansen is an improvement over the Keynesian theory. Hicks and Hansen developed model considering the goods well as money markets. It is the equilibrium between the two markets which determines growth. Keynesian theory of effective demand considered the goods market to draw the equilibrium. The equality between, ADF and ASF determined the short run equilibrium. Aggregate demand, Y=C+I+G, where, Aggregate demand is made up of C, I, and G explains the effect of goods market. Similarly, the money market is determined by, the liquidity demand for money and interest rate, given elastic supply of money from the central bank. IS curves deal with Goods market and LM curves deal with money market. Relationship between good market and money market:
• MEC and interest determine Investment
• The money market determines interest
• Investment determines income
• Income determines consumption and again
• Consumption determines investment
AKASHDEEP COMMERCE CLASSESVivek Kumar
SYBCom Business Economics paper II (2009 onwards) 29
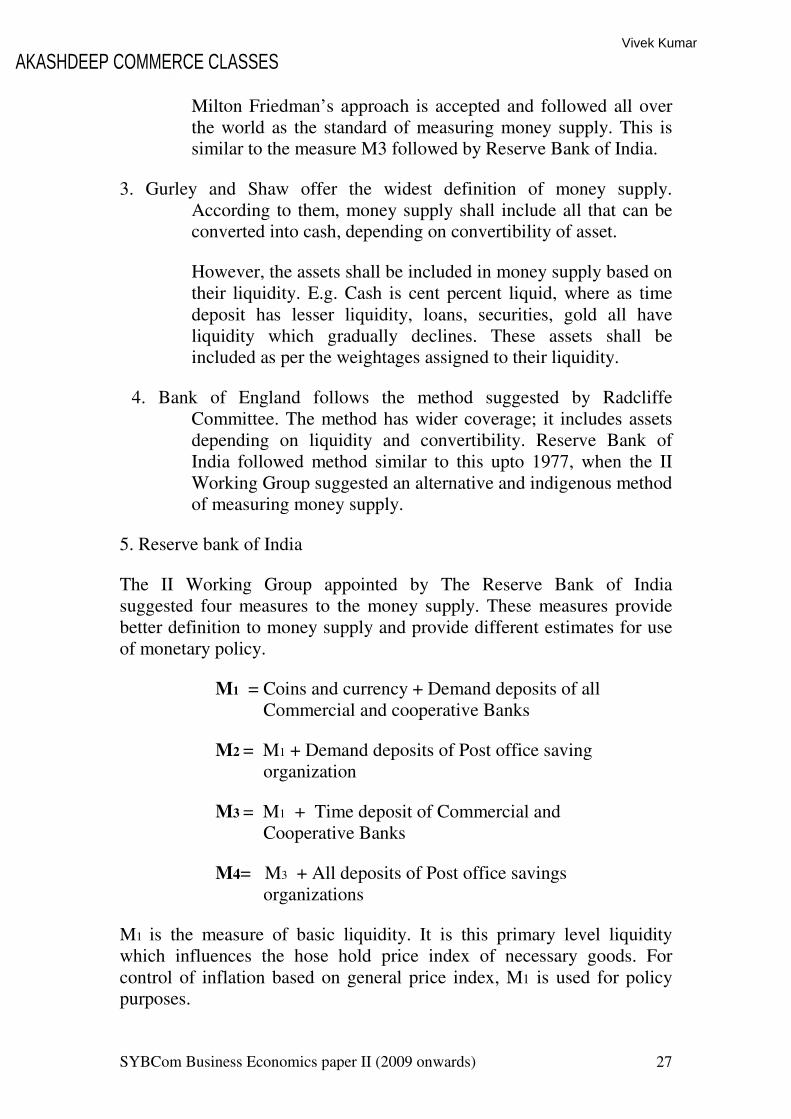
Derivation of IS Curves
It can be seen that at a point where ASF=ADF, the equilibrium E1 is drawn., Further, the rate of interest at that level of income Y is found on the lower diagram. Similarly, with a shift in the ADF, the equilibrium will shift to E2. The equilibrium is drawn on the lower diagram with corresponding rate of interest. By joining E1 and E2 in the lower diagram, the IS curve is drawn.
AKASHDEEP COMMERCE CLASSESVivek Kumar
SYBCom Business Economics paper II (2009 onwards) 30
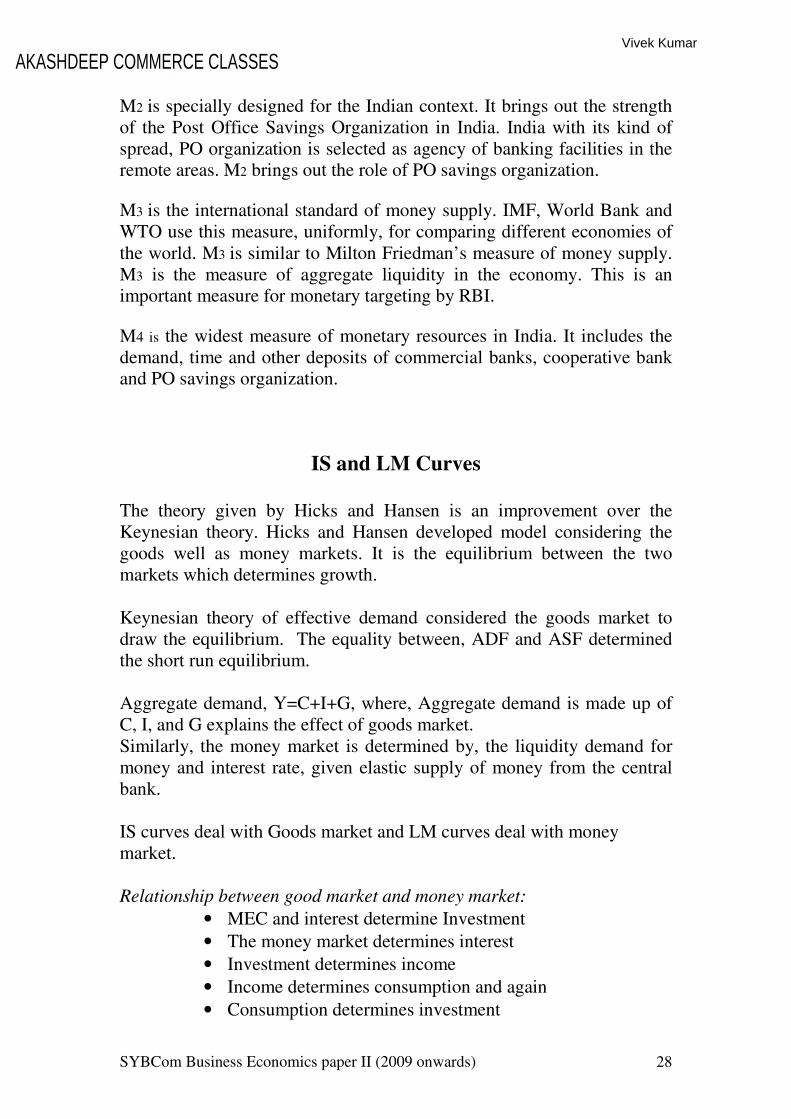
Shifts in IS Curve
On the IS curve, the region above the curve, right of the curve, represents, excess supply, caused by increasing government expenditure. Similarly, the region below the curve, left of the curve, represents, excess demand, caused by increasing consumer spending.
Derivation of LM Curve L1 and L2 are the liquidity schedules showing a negative relationship between, liquidity preference and rate of interest. The supply of money is inelastic (constant). It depends on the fudiciary system of the central bank.
AKASHDEEP COMMERCE CLASSESVivek Kumar

SYBCom Business Economics paper II (2009 onwards) 31
With a shift in the liquidity schedule, the rate of interest increases. These changes are drawn on the right diagram and the corresponding incomes are identified. Thus the LM curve is drawn and positive function between rate of interest and real income. The region above the LM curve shows excess supply of money and the region below denotes excess demand for money.
Interaction between IS and LM Curves
AKASHDEEP COMMERCE CLASSESVivek Kumar
SYBCom Business Economics paper II (2009 onwards) 32
The interaction between IS and LM curves show that: In the upper quarter there will be excess supply of goods and excess money. The income and interest rates shall decrease. In the lower quarter there will be excess demand for goods causing excess demand for money. The income and rate of interest increase. In the left quarter There will be excess demand for goods excess supply of money, causing income to increase and rate of interest to decrease. In the right quarter, there will be excess supply of goods and excess demand for money causing income and interest rate to increase.
Effects of Fiscal and Monetary Policy on interest and incomes
FFiissccaall ppoolliiccyy:: IInnccrreeaassee iinn GGoovveerrnnmmeenntt ssppeennddiinngg iinnccrreeaasseess tthhee iinnccoommee bbyy
mmuullttiipplliieerr eeffffeecctt.. HHoowweevveerr,, aann iinnccrreeaassee iinn tthhee GGoovveerrnnmmeenntt iinnvveessttmmeenntt
mmaayy lleeaadd ttoo aa ddeeccrreeaassee iinn tthhee rraattee ooff iinntteerreesstt aanndd hhee oouuttppuutt mmaayy rreemmaaiinn
ssaammee..
Monetary policy: The increase in the money supply by the Central bank will decrease interest rates and increase investment and output. The monetary policy will be called ineffective if
• IS curve is inelastic, where changes in rate of interest does not effect output.
• With liquidity trap, the increase in money supply fails to decrease rates of interest or increase investment and output.
3. Issues in inflation, Employment and unemployment
Economics of Inflation According to neoclassical economics inflation refers to increase in the level of economic activity after full employment. Presently, inflation is found even with unemployment. This is called stagflation. Inflation
• Inflation is post Keynesian concept. Primarily inflation is caused by indiscriminate expansion of money supply.
AKASHDEEP COMMERCE CLASSESVivek Kumar
SYBCom Business Economics paper II (2009 onwards) 33
• Inflation means too much money chasing too few goods.
• Increase in monetary resources against stagnant real output leads to inflation.
• Inflation is a monetary phenomenon.
• Inflation is caused by excess demand pressures on the goods and factors of production due to increase in monetary resources.
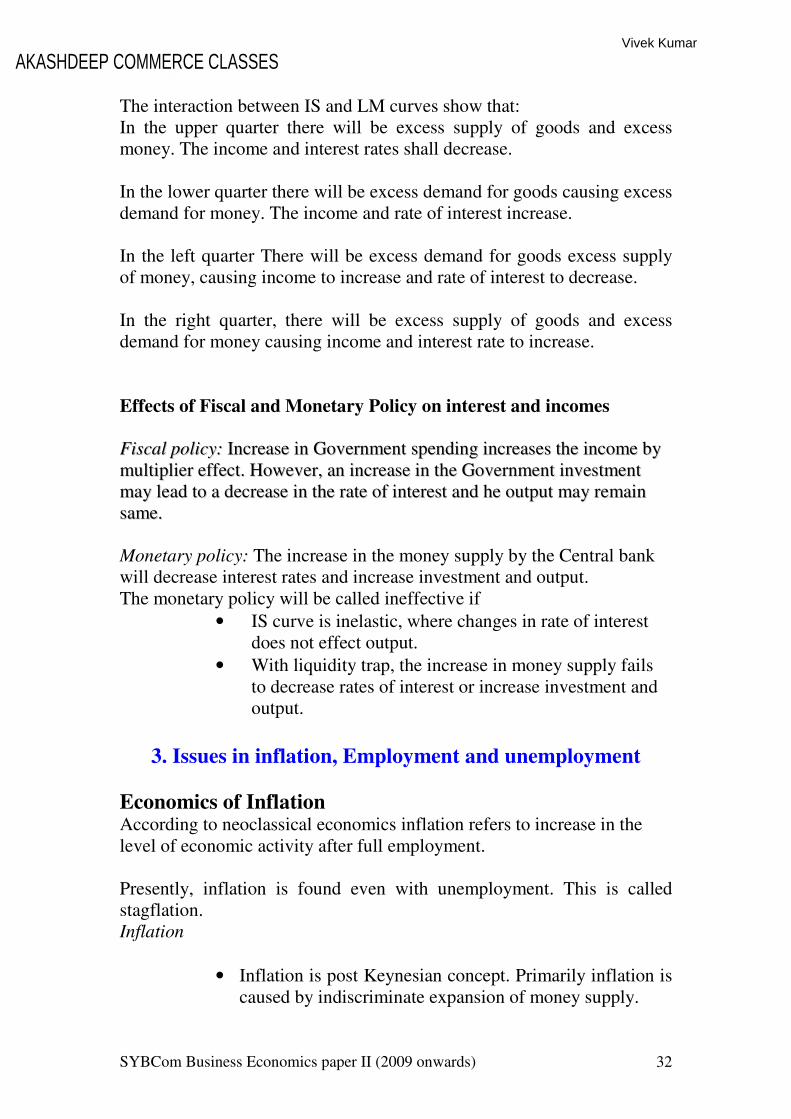
Inflationary Gap
Inflationary gap arise when there is an increase in incomes and the pout put remaining same. The additional income is absorbed by the same out put, thus causing the prices to increase.
In the diagram, with an increase in the income the consumption function will shift up wards. The equilibrium should move from E1 to E2. But E1 is a full employment situation; the equilibrium can not shift to E2 (to the right of ASF) but moves to E3. The additional income and expenditure is consumed by the same real output. E1to E3 is the inflationary gap. Types of Inflation
Inflation can be classified based on major causes. Accordingly, there can be four types of inflation Budgetary inflation:
This is the inflation caused by expansion of money supply resulting out of Government’s budgetary activities. The Government may
AKASHDEEP COMMERCE CLASSESVivek Kumar
SYBCom Business Economics paper II (2009 onwards) 34
increase money circulation to meet the deficits in the budget for financing any contingency. If Government expands money for non productive purposes it leads to inflation. During Post Keynesian period, this has been a major cause for rapid increase in inflation all over the world.
Wartime inflation:
During the emergencies of war, the Government generates resources by currency expansion. In addition, the prices may incase due to scarcity followed by hoarding and black marketing. Such inflation is generally controlled after war. War time inflation is a common occurrence these days.
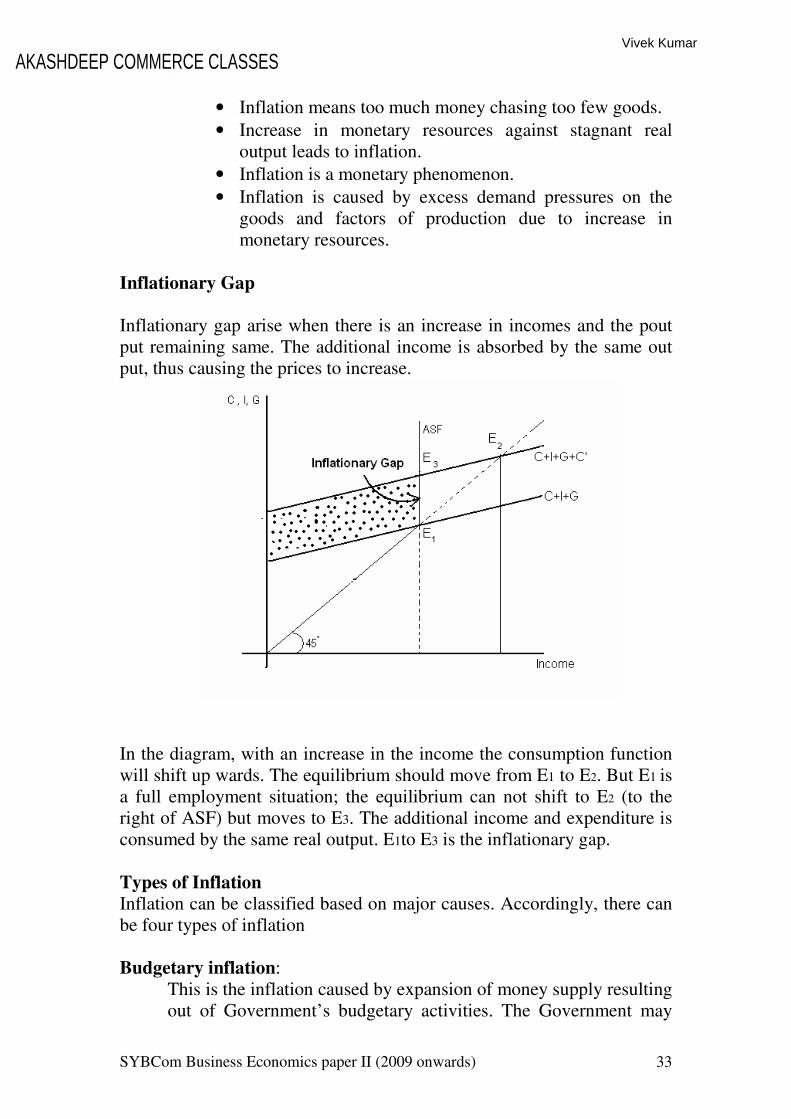
Demand Pull Inflation
Demand pull inflation is caused by increasing demand arising out of excess money supply and increase in demand for factors by the industry. Demand pull factors
1. Increase in money supply due to budgetary activity 2. Increase in demand for goods 3. Increase in demand for factors by the industry
According to Keynes, after full employment E if the aggregate demand increases to D1, D2, and D3, the real output can not increase and the equilibrium will be shifting only on the ASF to E1, E2, and E3. As a result the prices will increase to P1, P2, and P3. This is the inflation driven by demand pull factors
AKASHDEEP COMMERCE CLASSESVivek Kumar
SYBCom Business Economics paper II (2009 onwards) 35
Demand-pull factors in India
a. The parallel economy creates demand pressures from unexpected sectors of the economy.
b. The unorganized money markets pump in those additional resources which cause inflation.
c. Increasing public expenditure creates large amount of incomes. Public expenditure, which constitutes 43 percent of GNP is a major source of income.
d. Rapid monetary expansion leads to excess inflationary pressures. A monetary base of Rs. 2, 65,000 crore generates a large income and the following demand.
e. Deficit financing create those resources which create inflation. The deficits create additional resources of around Rs.10,000 crores annually.
f. Due to in appropriate taxation large disposable income is left causing high rates of inflation.
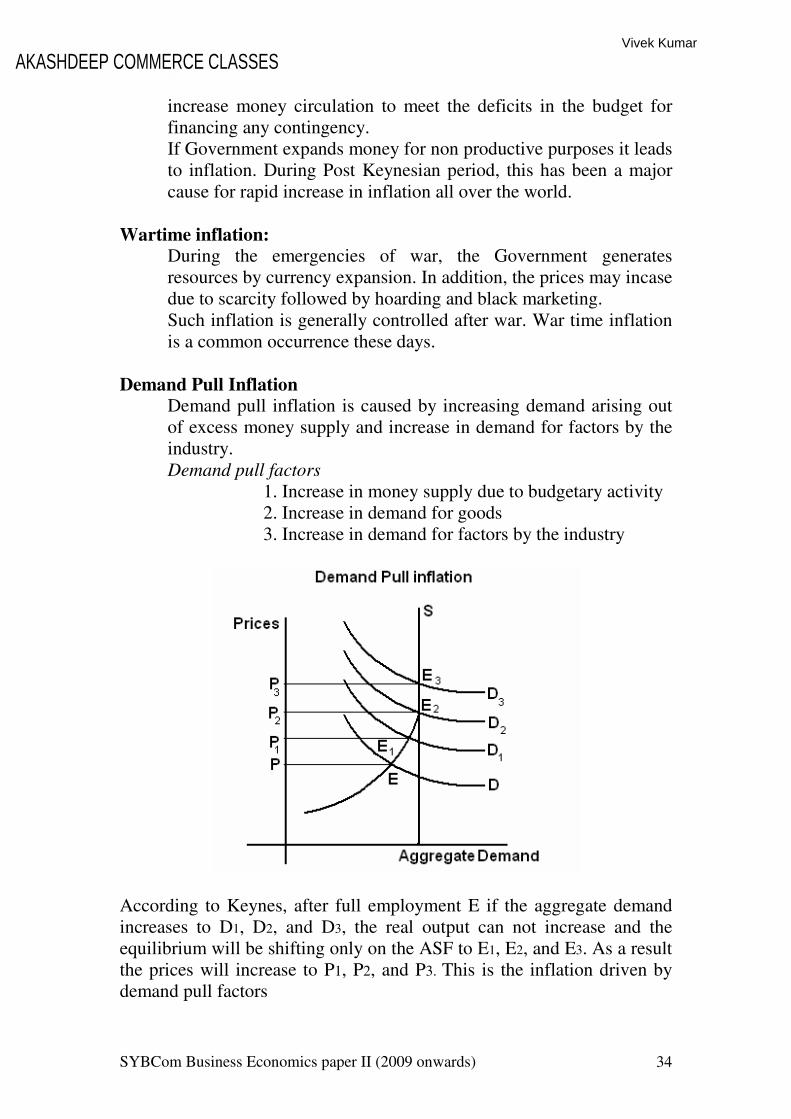
Cost Push Inflation
Cost push factors
1. Increasing prices 2. Decrease in the real income (purchasing power) 3. Decreasing in the standard of living. 4. Increase in demand for factors 5. Increase in demand for more wages 6. Wages increase due to strong trade union 7. Increase in the cost of production 8. The prices increase.
AKASHDEEP COMMERCE CLASSESVivek Kumar
SYBCom Business Economics paper II (2009 onwards) 36
Under cost push inflation even with increasing demand the supply can not shift. Against an inelastic supply curve an increase in demand D1, D2, and D3 will shift the supply curve. The cost structure undergoes a change and the equilibrium will be found on the same inelastic supply curve. The real out put remains same and the value of out put increases to P1, P2, and P3. Hence the prices will increase. This is cost push inflation. Cost-push factors in India:
a. Administered prices tend to be inflationary. The prices of coal and fertilizers affect agricultural prices and prices of power.
b. The prices determined by the Bureau of Industrial costs also tend to be inflationary for inputs. With the cascading effect, the prices spiral upwards.
c. The strong trade union movement always bargains higher wages. The politicized trade unions command larger bargaining power.
d. Industrial strikes, lockouts lead to wastage of resources. e. The labour legislation always provides higher wage than
productivity.
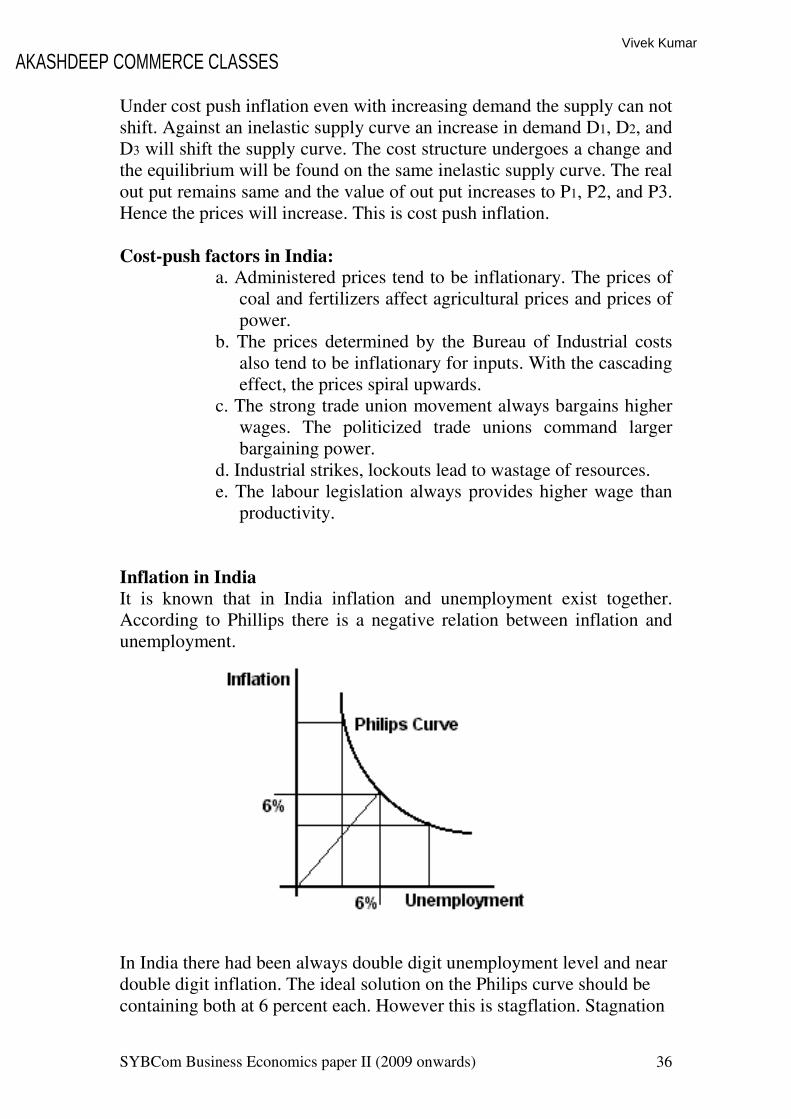
Inflation in India
It is known that in India inflation and unemployment exist together. According to Phillips there is a negative relation between inflation and unemployment.
In India there had been always double digit unemployment level and near double digit inflation. The ideal solution on the Philips curve should be containing both at 6 percent each. However this is stagflation. Stagnation
AKASHDEEP COMMERCE CLASSESVivek Kumar
SYBCom Business Economics paper II (2009 onwards) 37
of markets due to unemployment and increase in prices lead to state deficits. Theoretically there are two sets of factors causing inflation, viz. Cost push and demand pull. They are equally operational in the context of India.
Anti inflationary policy in India:
Inflation is identified as a destabilizing force, right in 1960s. The effective control had been always evading the policy.
• The XI plan aims at anti-inflationary growth. The plan pegs down deficit financing to 6.6 percent of the resources. The total fiscal deficits should be brought down to 3 percent of GNP.
• The recent MoU between RBI and Government to limit Treasury bill expansion only to Rs. 6,000 crores can work out to be anti-inflationary.
• Strict monetary targeting with less than 12 percent growth in monetary resources will be useful.
• The policy of liberalization is likely to bring in capital inputs which can increase industrial productivity. The improvement in real sector is highly effective in controlling inflation.
• The internal debt can be reduced so that the non-plan expenditure can be reduced. With lowering of debt, interest payment will also decrease. This will help in reducing budget deficits.
• The growth can be made self sustaining by reducing subsidies. It will also reduce budgetary deficits.
• The internal debt can be redeemed by the proceeds of sale of public sectors. This will be an effective and less burdensome method.
• Increase in export potential will enable India also to import and support domestic production. Larger availability of goods can reduce inflation.
Impact of globalization on employment in India,
Globalization has played an important role in the generation of employment in India.
AKASHDEEP COMMERCE CLASSESVivek Kumar
SYBCom Business Economics paper II (2009 onwards) 38
Since the economic liberalization policies in the 1990s, the employment scenario in the country has significantly improved. An analysis of the impact of globalization on employment in India will bring out a number of factors in this regard. 1. Market liberalization policies and employment
There was significant rise in the customer base and it slowly gave rise to the consumer market and supply started increasing. As, supply is directly involved with employment, more supply led to more production which led to more employment.
2. Growth of new segments in the market
Due to globalization and the growth of the consumer market, a number of segments in various sectors of the industry have grown over the years. This has led to the significant rise in the rate of demand and supply. In the recent years, a number of industry segments such as information technology, agro products, personal and beauty care, health care and other sectors have come into the market.
3. Growth of Unorganized sector
In the unorganized sector, there has been an increase in demand which has improved the rate of employment. As per the recent surveys, there has been a significant increase in the number of people working in the unorganized and allied sectors. The pay package in all these unorganized sectors have also increased to a great extent.
4. Improvement in the standard of living
As globalization has put a favorable impact in the economy of the country, there has been an improvement in the standard of living of the people. It is expected that the economy in India will grow by around 6-7 percent, yearly. This growth rate is expected to improve the overall employment situation more and the per capita income will also increase significantly.
5. Development of other sectors
Globalization has positively affected the growth of various sectors in India. These have opened up new employment opportunities for the people. The service industry has a share of around 54 percent of the yearly Gross Domestic Product (GDP). The industrial sector contributes around 29 percent while the agricultural sector
AKASHDEEP COMMERCE CLASSESVivek Kumar
SYBCom Business Economics paper II (2009 onwards) 39
contributes around 17 percent to the gross domestic product. Some of the well known exports of the country consist of tea, cotton, jute, wheat, sugarcane and so on. Due to the growth of customer base in all these sectors, more and more employment opportunities are opening up. In the manufacturing sector, there has been a growth of around 12 percent while the communication and storage sector has also grown up by around 16.64 percent.
Small-scale industries provide steady employment to many of its citizens in small towns and villages. Tourism is also an important contributor to the Indian Economy. 6. Government Initiatives
To keep pace with the favorable effects of globalization, the government has taken a number of initiatives.
a. A number of employment opportunities such as Prime
Minister Rojgar Yojna and the CM Rojgar Yojna have been initiated to improve the employment situation in the rural areas.
b. The Minimum Wages scheme has been implemented. c. To improve the quality of the workforce, education has
been emphasized in rural areas. Under these schemes, new schools are being opened up and attention is also being given to the welfare of the students. Likewise in the urban sector too, more and more employment opportunities are being opened up for the youth in a number of government sectors, banks and so on.
d. In order to foster communication and migration of workforce to various parts of the country to cater to the needs, the government has also developed infrastructure to a great extent. New roads and highways are being constructed to increase connectivity.
Nature of Unemployment in India
Types of Unemployment:
1. Frictional unemployment: This unemployment caused by people moving in between jobs, e.g. graduates or people changing jobs. There will always be some frictional unemployment.
AKASHDEEP COMMERCE CLASSESVivek Kumar

SYBCom Business Economics paper II (2009 onwards) 40
2. Structural Unemployment: This occurs due to a mismatch of
skills in the labour market it can be caused by: a) Occupational immobility's. This refers to the difficulties
in learning new skills applicable to a new industry, and technological change.
b) Geographical Immobility's. This refers to the difficulty in moving regions to get a job.
c) Technological Change. If there is the developments of labour saving technology in some industries there will be a fall in demand for labour.
d) Structural change in the economy. The decline of the coal mines due to a lack of competitiveness meant that many coal miners were unemployed and they may find it more difficult to get jobs in new industries such as computers.
3. Classical or Real Wage Unemployment: This occurs when
wages in a competitive labour market are pushed above the equilibrium. This is sometimes known as "disequilibrium" unemployment. Wages will also be sticky downwards. This could be caused by minimum wages, or trades unions.
4. Demand Deficient or "Cyclical Unemployment": This occurs
when the economy is below full capacity. e.g. in a recession when AD falls there will be a fall in output, therefore firms will employ less workers because they are producing less goods.
5. Seasonal Unemployment: Unemployment tends to be higher
during certain times of the year, either in summer or winter depending on the country.
The Expert Committee on Unemployment Estimates (1970) suggested three different approaches to measure employment and unemployment. The three approaches are:
1. Usual status approach with a reference period of 365 days preceding the date of survey. The person is unemployed for the entire period
2. Current weekly status : A person is considered to be
employed if he or she pursues any one or more of the gainful activities for at least one-hour on any day of the reference week.
AKASHDEEP COMMERCE CLASSESVivek Kumar
SYBCom Business Economics paper II (2009 onwards) 41
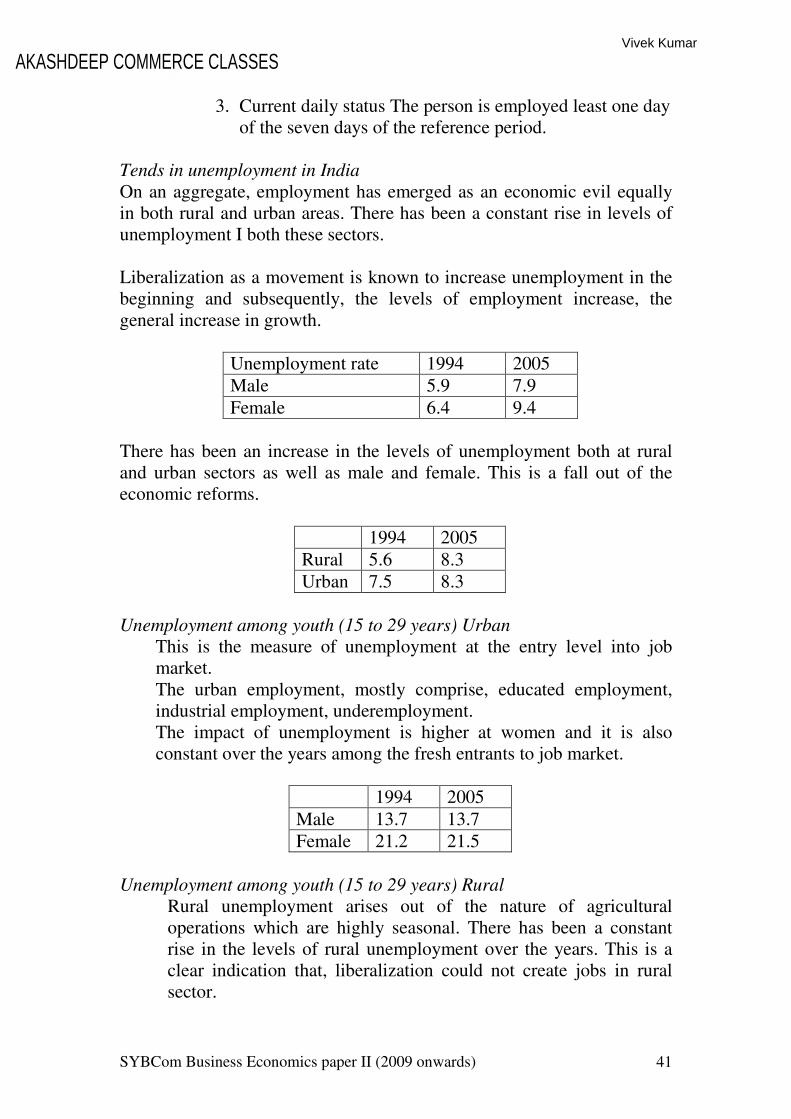
3. Current daily status The person is employed least one day of the seven days of the reference period.
Tends in unemployment in India
On an aggregate, employment has emerged as an economic evil equally in both rural and urban areas. There has been a constant rise in levels of unemployment I both these sectors. Liberalization as a movement is known to increase unemployment in the beginning and subsequently, the levels of employment increase, the general increase in growth.
Unemployment rate 1994 2005 Male 5.9 7.9
Female 6.4 9.4 There has been an increase in the levels of unemployment both at rural and urban sectors as well as male and female. This is a fall out of the economic reforms.
1994 2005 Rural 5.6 8.3 Urban 7.5 8.3
Unemployment among youth (15 to 29 years) Urban
This is the measure of unemployment at the entry level into job market. The urban employment, mostly comprise, educated employment, industrial employment, underemployment. The impact of unemployment is higher at women and it is also constant over the years among the fresh entrants to job market.
1994 2005
Male 13.7 13.7 Female 21.2 21.5
Unemployment among youth (15 to 29 years) Rural
Rural unemployment arises out of the nature of agricultural operations which are highly seasonal. There has been a constant rise in the levels of rural unemployment over the years. This is a clear indication that, liberalization could not create jobs in rural sector.
AKASHDEEP COMMERCE CLASSESVivek Kumar
SYBCom Business Economics paper II (2009 onwards) 42
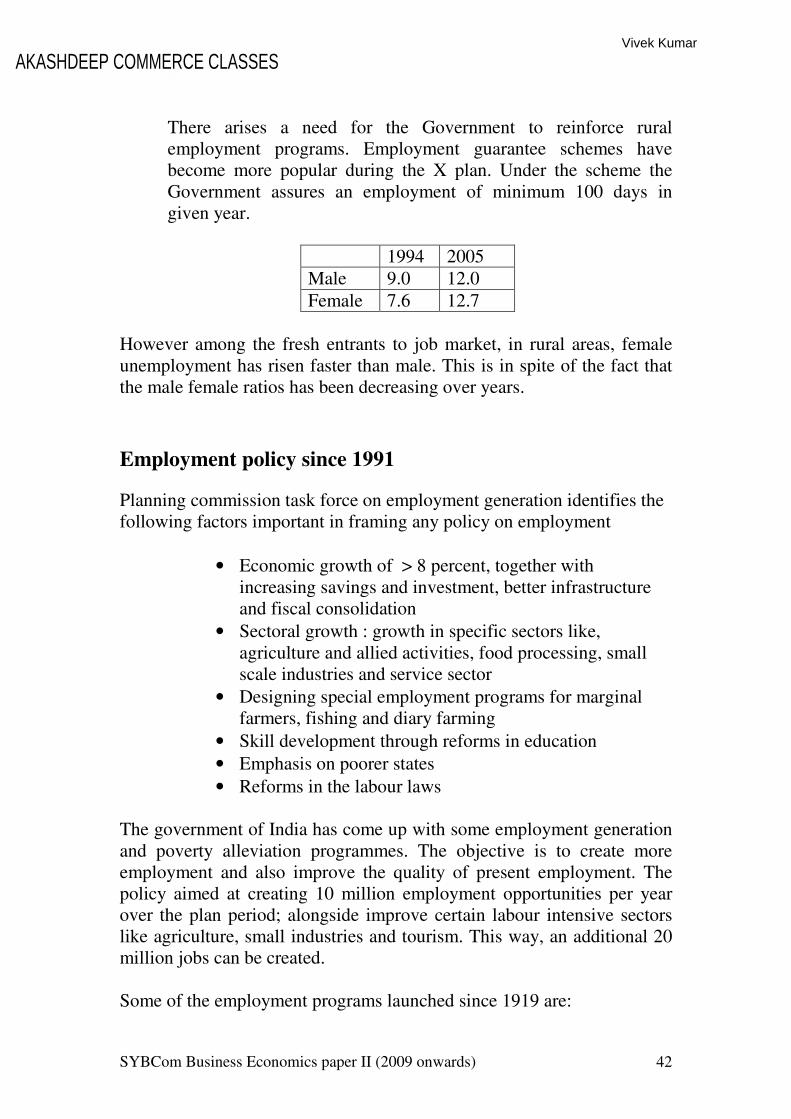
There arises a need for the Government to reinforce rural employment programs. Employment guarantee schemes have become more popular during the X plan. Under the scheme the Government assures an employment of minimum 100 days in given year.
1994 2005 Male 9.0 12.0
Female 7.6 12.7 However among the fresh entrants to job market, in rural areas, female unemployment has risen faster than male. This is in spite of the fact that the male female ratios has been decreasing over years.
Employment policy since 1991
Planning commission task force on employment generation identifies the following factors important in framing any policy on employment
• Economic growth of > 8 percent, together with increasing savings and investment, better infrastructure and fiscal consolidation
• Sectoral growth : growth in specific sectors like, agriculture and allied activities, food processing, small scale industries and service sector
• Designing special employment programs for marginal farmers, fishing and diary farming
• Skill development through reforms in education
• Emphasis on poorer states
• Reforms in the labour laws The government of India has come up with some employment generation and poverty alleviation programmes. The objective is to create more employment and also improve the quality of present employment. The policy aimed at creating 10 million employment opportunities per year over the plan period; alongside improve certain labour intensive sectors like agriculture, small industries and tourism. This way, an additional 20 million jobs can be created. Some of the employment programs launched since 1919 are:
AKASHDEEP COMMERCE CLASSESVivek Kumar
SYBCom Business Economics paper II (2009 onwards) 43
• Swarnjayanthi Gram Swarozgar Yojana
It was launched in April 1999 by merging programs like IRDP, TRYSEM, DWCRA etc into a single self employment scheme.
• Food for Work Programme
It was launched in February 2001 to give food through wage employment in the drought affected areas in eight states. Wages are paid by the state governments partly in cash and partly in food grains. These are provided free of cost by the centre to the drought affected states.
• Pradhan Mantri Gram Sadak Yojana
This was launched in December 2000 to provide connectivity to all rural areas with a population of more than 1000 by the year 2003 and with a population of more than 500 by the year 2007 through good roads.
• Samagra Awas Yojana
It was launched in 1999-2000 as a housing scheme to ensure provision of shelter, sanitation and safe drinking water.
• Pradhan Mantri Gramodaya Yojana This program was launched in 2000-2001 focusing on five important areas of village development, health, drinking water, primary education, housing and rural roads with the aim of improving the quality of life of people in rural areas.
• Sampoorna Grameen Rozgar Yojana
It was launched in September 2001 to provide wage employment and food security in rural areas and also to create durable economic and social assets.
• Jawahar Gram Samridhi Yojana
It was launched in April 1999 by restructuring the Jawahar
Rozgar Yojana and is implemented by Gram Panchayats for creating productive community assets.
• Employment for the urban poor: Under Nehru Rojgar
Yojana, earlier known as Urban Self employment Program, 7 lac man days of employment was created . Similarly,
AKASHDEEP COMMERCE CLASSESVivek Kumar
SYBCom Business Economics paper II (2009 onwards) 44
during VIII Plan, 7 lac micro entrepreneurs were launched under Self employment for Educated Youth.
• Khadi and Village Industries Commission has played an active role in reaching technology to rural households for promoting cottage/micro enterprises.
AKASHDEEP COMMERCE CLASSESVivek Kumar
SYBCom Business Economics paper II (2009 onwards) 45
Section II
4. Economic transition in India
Nature and significance of Agriculture In the development of any economy, agriculture plays a very important role. It becomes more significant in a large country like India with diverse land resources. The role of agriculture was first identified by Quesney, a physiocrat. According to him it is the only the agriculture sector which can generate a surplus and create value, other sectors only transform value. Economists like R.Nurkes gave a secondary importance to agriculture in the pattern of development. Arthur Lewis again gives primary importance to agriculture. It is a known fact that the contribution of agriculture sector decreases with rapid development, but in India it still plays a significant role.
Significance of Agriculture in Indian Economy: The significance of agriculture in Indian economy can be measured through its contribution to national product, employment, industry and international trade.
• Contribution to National Product :
In the initial stages of development agriculture contributes to a larger share in the national product. With rapid developments in the manufacturing and service sectors, its share decreases. However its contribution also depends on resource endowments. In advanced economies like USA and UK agriculture constitutes around 3 percent of the national output.
In India, agriculture subscribed 56.5 percent of national
output in 1951, but it gradually reduced to 23.3 percent by 2006-07 as per 1981 prices. The decrease in agricultural contribution relatively indicates the development of manufacturing and service sectors. In spite of its reducing share, India has self sufficiency in food grains with 199 mil tons output.
AKASHDEEP COMMERCE CLASSESVivek Kumar
SYBCom Business Economics paper II (2009 onwards) 46
• Contributions to Employment : Agriculture has been the largest employing sector through out the plans. Its share in employment generation was 69.5 percent in 1951 and remained high at 38 percent even by 2007. This is mostly due to the composition of rural, urban population, over dependence on agriculture and attitudes towards migration.
There have been efforts, spread through out the plans to generate employment in rural sector by various schemes and projects like IRDP, IADP, DPAP, etc. The rural employment situation is, however, faced with problems of disguised unemployment, under employment and seasonal unemployment.
• Agriculture- Industry interdependence : The dependence between industry and agriculture is
traditionally considered very important. These sectors help each other and grow in the process. Agriculture supplies excess man power to industry, agriculture is the source of raw material for industry. Agriculture provides food supply and actually provides the incomes and markets for the industry. On the other hand, industry provides the capital inputs, infrastructure, technology and markets for the agriculture sector. It is also useful in providing means of better standard of living and absorbs the excess labour.
• Contributions to Internal Trade : It is seen that the contribution of agriculture to GNP has
been decreasing over the years but still considered significant. Similar is the trend in terms of international trade. In 1950 its contribution to international trade was 75 percent. The share of agriculture output decreased to 16.4 percent by 2006-07. This is mostly due to factors like growth of non-basic goods. This trend is considered advisable. The agriculture output being inelastic at certain level, diversification is essential.
Over the years the import of food grains has also come down. The exports were traditionally Cotton, Jute and Tea. Presently, the exports are diversified to horticultural products, dairy products, vegetables, oil and oil cakes.
AKASHDEEP COMMERCE CLASSESVivek Kumar
SYBCom Business Economics paper II (2009 onwards) 47
Recent issues in Indian Agriculture 1. Food Security
1. Physical availability: Food security involves physical
availability of food to the entire population in a country. 2. Economic access: To make adequate food available to all,
it is necessary that the people have enough economic access or the purchasing power so that they can acquire the food they need.
3. Healthy life: For healthy life the food available should be
adequate in quality and quantity to meet nutritional requirements.
4. Long term basis: A nation may acquire self sufficiency in
food at a point of time, but the food security requires that timely and adequate supply of food should be available on a long term basis.
Remedies to Improve Food Security System: The following are the measures suggested to reform the PDS or the FSS:-
1. Proper management of stocks: The FCI of India should take adequate measures to manage the stocks. A substantial amount of good grains stocks can be saved form rodents, if proper measures are undertaken.
2. Decentralization of PDS: PDS is criticized because of its
inefficiencies on account of its centralized nature. Economists believe that local level authorities such as panchayats and NGO’s should be involved in PDS for identification of the poor living BPL, and also in the distribution of food grains in their jurisdiction.
3. Linking wage employment programmes with PDS: It is
strongly argued that PDS should be linked with wage-employment schemes like JGSY and EAS. The PDS supplies should be undertaken through such schemes so that the PDS benefit would reach to the deserving poor people and not to the non poor.
AKASHDEEP COMMERCE CLASSESVivek Kumar
SYBCom Business Economics paper II (2009 onwards) 48
4. Identification of commodities: Through extensive consumer
surveys, the government should identify the PDS commodities, which provide higher benefits to the poor. The commodities which are mostly used by the poor and the non poor need be included under PDS.
5. Stern action again diversion: The state governments should
take stern action against those shopkeepers who divert the PDS stocks in the open market, such as penalty and cancellation of license.
2. Agricultural Pricing The agricultural Price Commission was set up in 1985 with several broad objectives.
1. To provide better incentives for technology transfer. The is looked upon as a means of improving productivity as well.
2. To influence cropping pattern and rationalize the utilization
of land. The traditionalism in cropping is a major defect of Indian agriculture.
3. To maintain uniform and respectable standard of living for
the cultivators and the consumers at large. A mechanism to influence agricultural pricing was developed. The administered price was intended to deliberately manage agricultural marketing in two ways.
a. Minimum Support Price (MSP) : MSP for major crops was stipulated. The MSP was intended to provide a reasonable minimum price below which the market was not allowed to fall. This was an inducement to the cultivators and assurance of certain fixed return on their produce. Active among such MSPs are the prices for jute, sugarcane, coffee, cotton, oil seeds etc. Among these, for jute and sugar the MSP is made statutory.
b. Procurement Price for Cereals : It is price determined for
cereals which is applicable on transaction between the cultivators and the state. The government buys cereals at this
AKASHDEEP COMMERCE CLASSESVivek Kumar
SYBCom Business Economics paper II (2009 onwards) 49
administered price. The procurement price is generally less than the market price. The procurement price is subject to frequent revisions.
3. Agricultural Research
The area of Agricultural research in India deals with:
• Improving the quality of seeds and fertilizers.
• Improving the techniques and technology for cultivation.
• Developing better method of soil conservation.
• Developing better techniques of improving soil fertility.
• Improvement in agriculture related activities like fisheries, animal husbandry etc.
• Preservation and maintenance of crops
Research led developments in agriculture has made India self sufficient in food grainand a leading procedure of several agricultural commodities in the world. Due to agriculture research, several changes took place in Indian agriculture.
Following are the stages of Agricultural Development in India:
1. Pre-Green Revolution: Boost in productivity growth of coarse grains and pulses per unit of land.
2. Green Revolution: Expansion of area and rapid growth in
productivity of wheat and rice, made possible by widespread adoption of improved varieties, expansion of agricultural research, demonstration and education, and investment in irrigation, supported by establishment of a national infrastructure to produce and supply inputs and to warehouse, distribute and market outputs.
3. Post-Green Revolution: Continued growth in productivity
through intensification of chemical and labour inputs, followed by a gradual deceleration in productivity growth. Expansion of area under maize, cotton, sugarcane, and oilseeds.
4. Commercialization: Further diversification of cropping
patterns from low value to high value crops such as fruits,
AKASHDEEP COMMERCE CLASSESVivek Kumar

SYBCom Business Economics paper II (2009 onwards) 50
vegetables, flowers and other horticulture crops for domestic consumption, processing and export.
National Policy on Agricultural 2000 The National Policy on agriculture aims at :
• A growth rate in excess of 4 per cent per annum in the agriculture sector
• Growth that is based on efficient use of resources and conserves our soil, water and bio-diversity;
• Growth with equity, i.e., growth which is widespread across regions and farmers;
• Growth that is demand driven and caters to domestic markets and maximizes benefits from exports of agricultural products in the face of the challenges arising from economic liberalization and globalization;
• Growth that is sustainable technologically, environmentally and economically.
Specific areas of policy:
1. Sustainable Agriculture: To promote technically sound, economically viable, environmentally non-degrading, and socially acceptable use of country's natural resources - land, water and genetic endowment to promote sustainable development of agriculture.
2. Food and Nutritional Security: To raise the productivity and
production of crops to meet the increasing demand for food generated by unabated demographic pressures and raw materials for expanding agro-based industries.
3. Transfer of Technology: To improve the role of Krishi
Vigyan Kendras, Non-Governmental Organizations, Farmers Organizations, Cooperatives, corporate sector and para-technicians in agricultural extension will be encouraged for organizing demand driven production systems.
AKASHDEEP COMMERCE CLASSESVivek Kumar

SYBCom Business Economics paper II (2009 onwards) 51
4. Resource management: Emphasis is placed on resource
management in respect of soil, water, and land. Technologies have been developed to improve the quality of land and soil resources, soil – resource maps for some states have been prepared and crop weather relationship models have been developed for different agro – ecosystems.
Policy outline
1. Privatization of agriculture 2. Private sector participation for technology transfer,
capital flow and development of horticulture 3. Increase in investment for better human resource
development 4. Agricultural research 5. Guards against quantitative restrictions of WTO 6. National livestock breeding strategy 7. Developing plant varieties 8. Review of excise duty on farm machinery 9. Rural Electrification 10. Developing renewable sources of energy 11. Package insurance policy in rural sector
Farmers’ Policy 2007
In continuation with the National Policy of Indian Agriculture, the Government enacted the Farmers’ Policy in 2007. The policy aims at:
1. Economic wellbeing of farmers 2. New technologies 3. Agricultural bi-security system 4. Support services to women 5. Credit and insurance 6. DnyaChuapaals provide Information and
Communication technology for farmers 7. Minimum support price on crops to farmers 8. Food security
AKASHDEEP COMMERCE CLASSESVivek Kumar
SYBCom Business Economics paper II (2009 onwards) 52
WTO and India Agriculture
From 1947 to 1994, General Agreement on Trade and Tariff (GATT) was the forum for managing trade barriers. The World Trade Organization (WTO) was established on 1st January 1995. . The WTO has 148 members, accounting for over 97 percent of world trade. Around 30 others are negotiating membership. WTO prescribes several conditions governing trade agreements in service sector, intellectual property rights, international disputes and also agriculture. Important among them is the Agreement on Agriculture. WTO Agreement on agriculture covers
1. Market access: This involves tariffication, and reduction in tariff and access opportunities. Tariffication means all non-tariff barriers like quotas, variable levies, minimum support prices, discretionary licensing and state trading measures need to be placed with tariffs. This is 24 percent for developing countries.
2. Domestic support: Policies are subject to reduction, from the total support given 1986-88. Total Aggregate Measure of Support (Total AMS) shall be 13 percent.
3. Export subsidies: Export subsidy expenditure to be reduced to 36 percent and for developing countries is 24 percent.
As special differential treatment, developing countries are permitted untargeted subsidized food distribution to meet requirements of urban and rural poor. In operation WTO prescribes four fold approach:
• Green Box: It contains fixed payments to producers for environmental programs, so long as the payments are not a part of current production
• Blue Box: Minimum support price and direct payments to agriculture
• Special and differential box: Investment subsidies
• Amber Box: Contains domestic subsidies that governments have agreed to reduce but not eliminate. The Blue Box contains subsidies which can be increased without limit, so
AKASHDEEP COMMERCE CLASSESVivek Kumar
SYBCom Business Economics paper II (2009 onwards) 53
long as payments are linked to production-limiting programs.
India and WTO:
India has undertaken is to bind its tariffs on primary agricultural products at 100 percent; processed foods at 150 percent; and edible oils at 300 percent. Further, India’s share in total agricultural exports from developing Asia is 8 percent
• Maintains quantitative restrictions due to Balance of Payments reasons
• No commitment regarding market access.
• Green box is considered with development box
• Agricultural exports do not get direct subsidy.
• Indirect subsidy by way of exemption of export profit from Income tax
• Subsidies on cost of freight on export shipment of fruits, vegetables, floral products
• Share of Indian agriculture in world market is negligible except rice
• Subsidies of rich nations does not effect Indian exports
• Indian products are cost effective
• No fear of Indian markets being flooded by imports
• It is important to protect food and livelihood security to alleviate poverty, rural development and employment
• There is a need to create opportunities for expansion of agricultural exports with meaningful market access in developing counties.
Structural changes and composition of industry since 1991 The process of industrialization depends on the following factors:
1. Availability of natural resources 2. Availability of low cost skilled labour 3. Capital accumulation 4. Business environment 5. Economic policy and market conditions
The process of industrialization can be divided into four phases
AKASHDEEP COMMERCE CLASSESVivek Kumar
SYBCom Business Economics paper II (2009 onwards) 54
Phase I: Faster growth rate (1950-65): The period records an average growth of 6.6 percent p.a. The period corresponds to the first three plans. During the first two plans industry received great emphasis inters of suitable policy and investment out lays.
Development of infrastructure, research and development and import
of capital goods helped industrial growth. The growth strategy was biased towards industry.
Phase II: Structural retrogression (1965-80): The period after III plan
showed an average annual growth of 4.0 percent there were years when the growth rate had reduced even to 0.2 percent and 0.5 between 1966 and 68.
• There were more and more restrictions on the growth of industries. The industrial licensing system made the industry develop at a slower pace.
• The problem of industrial sickness was becoming more and more active engulfing small, large and public sector enterprises.
• It is also known that bad agricultural harvests effect the industrial growth with a time lag. This can be seen by way of falling industrial growth rate subsequent to bad harvest in 1960.
• The period of structural retrogression provided some useful experiences for the Indian industry to change its policy emphasis and direction.
Phase II: Recovery stage of 1980-90: During this stage the industry
showed an average growth rate of 7.7 percent p.a.
• The need for liberalization was felt. The growth of public sector was diverted towards active joint sectors and also progressive privatization.
• The industrial policy now changed over to export promotion as against traditional import substitution. Inflow of foreign capital was allowed subject to the restrictions of FERA.
AKASHDEEP COMMERCE CLASSESVivek Kumar
SYBCom Business Economics paper II (2009 onwards) 55
Phase IV: Liberalization: period succeeding New Economic Policy called post reforms period. The New Economic Policy of 1991 gave a new direction to the Indian industry by reducing tariff rates, allowing free flow of foreign investments, deregulations, decontrols, reinforcing market mechanism privatization etc.,
The economic effects of such liberalization can be seen by way of
rapid increase in exports, industrial growth. The period between 1991 and 94 is called as the beginning of liberalization.
• During this period the policy of liberalization was supported by the VII Five Year Plan, EXIM Policy 1992-97 and various finance bills enacted each year with annual budgets.
• New Economic policy was showing results by way of bringing in more and more foreign direct investment and also institutional investment.
• The public sector investment stopped and also privatization had begun. The Indian industry was finding it difficult to compete with multinational corporations and imports.
• Industry grew at rates of 8.2 percent in 1992 and declined to 6 percent by 1994
The period between 1994 and 1999 showed moderate recovery’
• Foreign direct investment and growth of Multi National Corporations forced many Indian companies either closure or mergers. The competition was becoming intense.
• The financial reforms were reinforced as per Narasimham committee recommendations.
• Many banks increased their capital base by issuing new capital in the market.
AKASHDEEP COMMERCE CLASSESVivek Kumar
SYBCom Business Economics paper II (2009 onwards) 56
• Insurance sector was privatized. Several Multi National Corporations stared insurance companies.
The period after 2000 is consider as a period of consolidation.
• With an average growth of 8.4 percent the capital goods sector recorded a growth of 15 8.4 percent.
• Energy sector generated 700 billion kwh of electricity by 2008. India has emerged as the 5th largest producer of electricity.
• Small scale industries remain a major economic activity, contributing 42 percent of industrial production.
• The effect of global recession is not severe in India. The economic growth is above 6 percent with all sectors recording good growth.
• For the year 2007-08 the average growth of industries is around 8 percent with capital goods showing 16.5 percent growth.
• Presently the basic industries account for 21 percent, consumption goods sector accounts for 19 percent, intermediate goods 53 percent and capital goods represent 7 percent of total industrial production.
New Industrial Policy 1991
1. Industrial licensing is abolished except for a negative list of 18 industries. All other procedures of registrations pertaining to DGTD and MRTP have been relaxed. This comes during such times when the regime of controls had reached a peak. Presently, it is a case of automatic approval or deemed approval for industrial enterprises.
2. The MRTP limit of greater than Rs. 100 crores prescribed
in 1985 is totally waived. The regulatory power of MRTP acts is abolished. The restriction on transfer of shares and acquisitions is removed.
AKASHDEEP COMMERCE CLASSESVivek Kumar
SYBCom Business Economics paper II (2009 onwards) 57
3. The public sector has been, now made open for private sector. Except for a short list of 7 units, private sector is free to enter production. This list of 7 units is made up of activities like defense, coal, minerals, mining, Railways, atomic energy etc.
4. There is proposal of progressive disinvestment of sector
units. Currently, the government has completed two rounds.
5. The sick units are referred to BIFR. In extreme cases
closure is thought of. 6. The memorandum of understanding provides greater
autonomy for public sector money management. 7. Even in public sector enterprises joint ventures and
foreign collaborations are planned. The infrastructure which was so far developed by PSUs is now made open for even foreign investment.
8. The foreign investment is made free from the barriers.
The investment can now be made even to the extent of holding company (larger than 51 percent equity). Import of capital goods is made automatic against foreign capital.
9. There are liberal terms of royalties and repatriation of
profits upto 5 percent of capital or Rs. 1 crore. 10. Automatic foreign technology agreements are made in 34
high priority industries. This will be making the foreign investment very lucrative.
Disinvestment Policies
Disinvestment in Public Sector Units is a move towards privatization of public sector. This is an important off shoot of New Economic Policy 1991. The case for disinvestment in Public Sector Units, arise out of the following reasons:
AKASHDEEP COMMERCE CLASSESVivek Kumar
SYBCom Business Economics paper II (2009 onwards) 58
• The rate of profitability is so low that the capital employed in Public Sector Units is grossly under utilized.
• The number and volume of loss marking Public Sector Units is on the increase not due to social considerations but mostly on account of operational inefficiency.
• The activity of privatization may provide access to better and professional management and direct accountability.
• Privatization is looked upon as a means of efficient utilization of resources.
• The capacity utilization and output can be expanded due to competitive efficiency.
• Market orientation will provide representative prices. The prices should reflect true scarcities and utilities.
• The pressures on budgetary resources can be lessened. This becomes most important due to consistent deficits in the budget and the evils thereon.
• By making public sector cost efficient it can be made competitive in the international market.
• The entire productive sector can be made market oriented. It provides a check on the operations through demand and supply forces.
Important objectives of disinvestment in Public Sector Units are:
• Reduction of financial burden on Government
• Improving public finance
• Introducing competition with market discipline
• Encouraging wider share in ownership
• Depoliticizing essential services Government policies on disinvestment aim at
AKASHDEEP COMMERCE CLASSESVivek Kumar
SYBCom Business Economics paper II (2009 onwards) 59
• Bringing down government equity to 26 percent or lower
• Restructuring of potential and viable Public sector units
• Close down Public sector units that can’t be revived
• Protect the interests of the workers Methods of disinvestment: There are different methods of disinvestment each suitable, specifically to a region or industry. These are:
• Strategic sale
• At the capital market by offering for sale at fixed or book building,
• At secondary market and private placement
• Reduction in equity by buy back of shares and conversion of equity into other instruments
• Trade sale, Asset sale and winding-up, management and employees buyout, cross sale and sale through de-merger and spinning off
In India the Disinvestment Commission (1977) was constituted to advice on disinvestment, enterprises, its modalities and the utilization of the proceeds. The committee suggested that
• Restructuring and reorganization of Public Sector Enterprises before disinvestment,
• Strengthening of the well-functioning enterprises, and
• To utilize the disinvestment proceeds to create a fund for restructuring of Public Sector Units.
Suggestions
• Reduce the government holding in Public Sector units to less than 50 per cent
• The Government shall ensure public accountability of managers by showing measurable performance.
• Restriction on budgetary support or government guarantee for loans, except for specific public purpose oriented investments.
AKASHDEEP COMMERCE CLASSESVivek Kumar
SYBCom Business Economics paper II (2009 onwards) 60
• Banks should monitor the performance of Public Sector units because they have a great stake in the loans raised by Public Sector units
• To ensure that Public Sector units do not abuse their oligopolistic position in the domestic market, reasonably open trade and investment regime could impart the discipline of the world market.
Small Scale Industries
Indian cottage and small scale industries always played an important role right from the pre-independence period. During the British rule the cottage industries did receive a setback due to policy neglect. But in the plan periods these small industries regained their significance. In a labour abundant economy like India, cottage and small scale sector help in providing employment, mobilizing resources and ancillarization. Since SSI are labour intensive it is considered highly effective in India. As against the general industrial capital output ratio of 8, SSI have a small Incremental Capital Output Ratio of 4. It emerges as capital effective enterprise. This is also an indication of capital productivity. In independent India, SSI and cottage industries had been given a prominent place right from Industrial policy Resolution of 1948. The IV group industries enable SSI to develop without state regulations and also quality them for incentives. Though out the economic history of India, SSI have been helping in rapid industrialization by ancillarization and developing local markets.
Since December 21, 1999, Small Scale Industry is defined as any industrial unit with Investment in fixed assets like plants and equipments either held on ownership terms on lease or on hire purchase should not be more than Rs 10 million. Small-Scale industries can be categorized as Cottage Industries, Agro-based industries and Small Industries. Over the years the small scale industries have under gone a large change. The traditional small-scale industries clearly differ from their modern counterparts in many respects. The traditional units are highly labor
AKASHDEEP COMMERCE CLASSESVivek Kumar
SYBCom Business Economics paper II (2009 onwards) 61
consuming with their age-old machineries and conventional techniques of production resulting in poor productivity whereas the modern small-scale units are much more productive with less manpower and more sophisticated equipments. Policy towards Small Scale Industries
The Policy of the Government towards Small Scale Industries aims at :
• Developing small scale sector as a major source of employment
• Encourage decentralized industrial expansion
• Ensuring equitable distribution of income.
• Mobilizing capital investment and entrepreneurship skills
• Ensuring increased production of consumer goods in the small scale sector and
• Expanding employment opportunities through setting up of small scale industries.
WTO conditions provide for removal of quantitative restrictions on SSI. Keeping this in view the Government tries to trying to improve the competitiveness through various measures. These measures include:
• Strengthening existing technological facilities, Government is formulating a scheme of assistance for Technology upgradation
• Improving access to latest information, automation of industry service organizations,
• In order to facilitate adequate flow of credit, a scheme of Credit Guarantee has been launched.
• Measures to improve infrastructure facilities and promote marketing of products
AKASHDEEP COMMERCE CLASSESVivek Kumar
SYBCom Business Economics paper II (2009 onwards) 62
In the light of World Trade Organization the Government made policy provisions by which the Small Scale Industries receive incentives like
• Allowing SSI to export goods to the member countries of the WTO with fewer restrictions,
• Reduction of tariffs on imports to Small scale industries
• Providing modern technologies from the other countries at reduced cost
• Greater Market orientation
Special Economic Zones Special Economic Zones are centralized areas developed with world class infrastructure, set of fiscal incentives, dealing with a specific products or products. Special Economic Zones were promoted by the Government, but recently, private Special Economic Zones are also encouraged. India was one of the first in Asia to recognize the effectiveness of the Export Processing Zone (EPZ) model in promoting exports, with Asia's first EPZ set up in Kandla in 1965. To overcome the shortcomings experienced by way of multiple controls, absence of world-class infrastructure, and unfriendly policy to attract larger foreign investments in India, the Special Economic Zones Policy came into being in April 2000. Special Economic Zones are looked upon as the engine for economic growth supported by quality infrastructure complemented by an attractive fiscal package, both at the Centre and the State level, with the minimum possible regulations. Special Economic Zones play an important role in
1. generation of additional economic activity, 2. promotion of exports of goods and services, 3. promotion of investment from domestic and foreign
sources, 4. creation of employment opportunities, and
AKASHDEEP COMMERCE CLASSESVivek Kumar
SYBCom Business Economics paper II (2009 onwards) 63
5. development of infrastructure facilities. As against the earlier control regime, Special Economic Zones are important because they offer convenience by
• Simplified procedures for development, operation, and maintenance of the Special Economic Zones and for setting up units and conducting business in Special Economic Zones;
• Single window clearance for setting up of an Special Economic Zones;
• Single window clearance for setting up a unit in a Special Economic Zone;
Incentives under Special Economic Zones are:
• Duty free import/domestic procurement of goods for development, operation and maintenance of SEZ units
• 100 percent Income Tax exemption on export income for SEZ units under Section 10AA of the Income Tax Act for first 5 years, 50 percent for next 5 years thereafter and 50 percent of the ploughed back export profit for next 5 years.
• Exemption from Central Sales Tax.
• Exemption from Service Tax.
• Single window clearance for Central and State level approvals.
Special Economic Zones are in the public sector as well as private sector. They deal with a variety of activities like Pharmaceuticals and Biotechnology, hi-tech engineering products and related services, Pharmaceutical, Gems and Jewellery, Footwear, Information Technology, Hardware and Bioinformatics, Handicrafts, textiles, electronics and can be even multi-product. Special Economic Zones had total export earnings of Rs 10, 00,000 cr by 2008-09.
AKASHDEEP COMMERCE CLASSESVivek Kumar
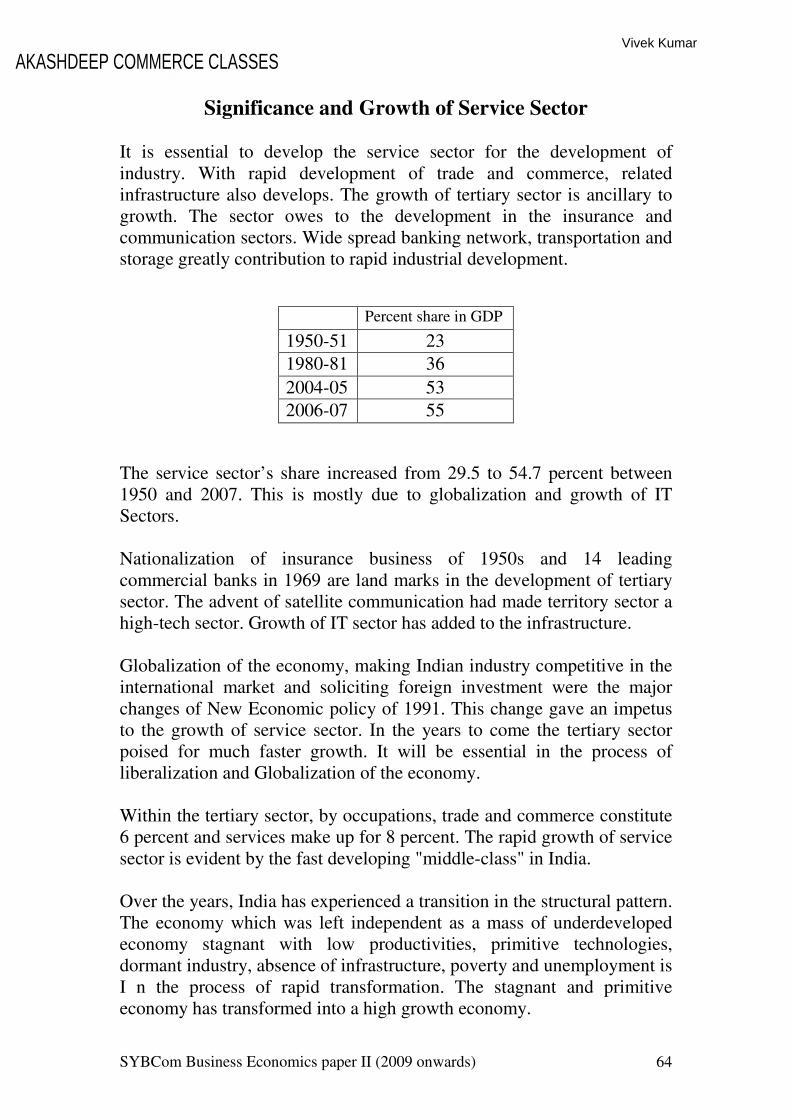
SYBCom Business Economics paper II (2009 onwards) 64
Significance and Growth of Service Sector It is essential to develop the service sector for the development of industry. With rapid development of trade and commerce, related infrastructure also develops. The growth of tertiary sector is ancillary to growth. The sector owes to the development in the insurance and communication sectors. Wide spread banking network, transportation and storage greatly contribution to rapid industrial development. The service sector’s share increased from 29.5 to 54.7 percent between 1950 and 2007. This is mostly due to globalization and growth of IT Sectors. Nationalization of insurance business of 1950s and 14 leading commercial banks in 1969 are land marks in the development of tertiary sector. The advent of satellite communication had made territory sector a high-tech sector. Growth of IT sector has added to the infrastructure. Globalization of the economy, making Indian industry competitive in the international market and soliciting foreign investment were the major changes of New Economic policy of 1991. This change gave an impetus to the growth of service sector. In the years to come the tertiary sector poised for much faster growth. It will be essential in the process of liberalization and Globalization of the economy. Within the tertiary sector, by occupations, trade and commerce constitute 6 percent and services make up for 8 percent. The rapid growth of service sector is evident by the fast developing "middle-class" in India. Over the years, India has experienced a transition in the structural pattern. The economy which was left independent as a mass of underdeveloped economy stagnant with low productivities, primitive technologies, dormant industry, absence of infrastructure, poverty and unemployment is I n the process of rapid transformation. The stagnant and primitive economy has transformed into a high growth economy.
Percent share in GDP
1950-51 23
1980-81 36
2004-05 53
2006-07 55
AKASHDEEP COMMERCE CLASSESVivek Kumar
SYBCom Business Economics paper II (2009 onwards) 65
The New economic policy of 1991 has given a different policy direction to India by decontrols, deregulations and Globalization. The world around it is acknowledged that the Indian economy is potentially on the path of development. The process of liberalization had begun in 1980s, by 1985 it was further consolidated, finally, in 1991, New Economic policy gave a new direction. The mixed economic pattern now takes shape of a market oriented economy. With globalization, the possibilities of rapid growth rates have increased. In spite of growth and potential of growth, India had been harboring tendencies of inequalities. The growth of monopolies in the corporate sector, differences in the distribution of personal incomes and disparities in the rural and urban land holdings highlight inequalities. However, the Government uses fiscal and legislative measures to bring in equalities, so that the benefits of development are shared by all, alike.
Trends in the growth of service sector
• The share of service sector in generating employment has been increasing. During 21983 it contributed 21 percent of industrial employment which increased to 28 percent by 2008.
• Tourism has developed as the third largest foreign exchange earner in India
• Retail trade has touched $ 320 billion mark in 2007
• Insurance sector is growing at the rate of 15 to 20 percent.
• Transport sector is recording 120 percent growth
• Business Process Out Sourcing is emerging as an important part of service sector.
AKASHDEEP COMMERCE CLASSESVivek Kumar

SYBCom Business Economics paper II (2009 onwards) 66
• India is rigorously working towards standardization of products and processes for competitive exports. India is fast procuring Six Sigma and ISO standards.
6. Inclusive Growth
Inclusive growth Inclusive growth is a process, in which, economic growth, measured by a sustained expansion in GDP, contributions to opportunity, capabilities, access and security. Inclusive Growth basically means the following:
1. Opportunity: The economy should generate more and varied ways for people to earn a living and increase their incomes over time.
2. Capability: The economy shall provide the means for
people to create or enhance their capabilities in order to exploit available opportunities.
3. Access: The economy shall provide the means to bring
opportunities and capabilities together. 4. Security: The economy shall provide the means for
people to protect themselves against a temporary or permanent loss of livelihood.
Inclusive growth and India
• Poverty Reduction and increase in quantity and quality of employment: There are 458 million workers in India in 2004-05. Out of this 423 million workers are unorganized workers (92 percent). Thus, quality of employment needs to be improved. Workers in this sector do not have social security. Government shall provide minimum social security to unorganized workers
• Agricultural Development: The agricultural growth has been reducing from 3.5 percent during 1981-97 to 2 percent during 1997-2005. There are land and water problems. Agricultural policy shall consider these
AKASHDEEP COMMERCE CLASSESVivek Kumar
SYBCom Business Economics paper II (2009 onwards) 67
aspects. There are disparities in growth across regions and crops: growth rate declined more in rain fed areas. The per capita land availability is fast decreasing. There is a reduction in share of employment (still 55 percent )
• Social Sector Development: In social sector there is a need for significant achievements in education and health. The Human development index rank is 127 out of 170 countries. The problems in Social Sector are slow progress, large regional, social and gender disparities, low level and slow growth in public expenditures particularly on health, poor quality delivery systems, privatization of health and education
• Reduction in regional disparities: There are significant regional disparities in India. In terms of per capita income the highest is Rs.16,679 in Punjab and lowest at Bihar with Rs.3557. Female infant mortality varies from 12 in Kerala to 88 in Madhya Pradesh. These disparities are mostly due to low investment in physical and human capital, Technology and bad governance
• Protecting the environment: There is a need to prevent degradation of land, water, and control in pollution levels. The challenges of climate need to be met effectively. Finally, higher economic growth should not lead to decline in our environment
Millennium Development Goals
The Millennium Development Goals are drawn from the actions and targets contained in the Millennium Declaration that was adopted by 189 nations-and signed by 147 heads of state and governments during the UN Millennium Summit in September 2000. The Millennium Development Goals are eight goals to be achieved by 2015.
1. Eradicate extreme poverty and hunger: Reduce by half, the proportion of people whose income is less than $1 a day AND the proportion of people who suffer from hunger, , between 1990 and 2015.
AKASHDEEP COMMERCE CLASSESVivek Kumar
SYBCom Business Economics paper II (2009 onwards) 68
2. Achieve universal primary education: Ensure that, by 2015,
children everywhere, boys and girls alike, will be able to complete a full course of primary schooling
3. Promote gender equality and empower women: Eliminate
gender disparity in primary and secondary education, preferably by 2005, and in all levels of education no later than 2015
4. Reduce child mortality: Reduce by two-thirds, between
1990 and 2015, the under-five mortality rate 5. Improve maternal health: Reduce by three-quarters,
between 1990 and 2015, the maternal mortality ratio 6. Combat HIV/AIDS, malaria and other diseases: To Stop
the spread of HIV/AIDS by 2015. Further, reduce by half, the incidence of malaria and other major diseases
7. Ensure environmental sustainability: Integrate the
principles of sustainable development into country policies and programs and reverse the loss of environmental resources. AND reduce by half the proportion of people without safe drinking water and basic sanitation. By 2020 achieve a significant improvement in the lives of at least 100 million slum dwellers
8. Develop a Global Partnership for Development: Develop
non-discriminatory trading and financial
These eight Millennium Development Goals are divided into 21 quantifiable targets that are measured by 60 indicators. These goals recognize the interdependence between growth, poverty reduction and sustainable development. They state that development depends on democratic governance, the rule of law, respect for human rights and peace and security. The goals consider time-bound and measurable targets accompanied by indicators for monitoring progress. The targets bring together, in the eighth Goal, the responsibilities of developing countries with those of developed countries, founded on a global partnership
AKASHDEEP COMMERCE CLASSESVivek Kumar
SYBCom Business Economics paper II (2009 onwards) 69
Millennium Development Goals and India
The Goals that were formulated in 2000 at the UN Millennium Summit are set to be achieved by 2015. In this direction India has the following action plan
1. The target of poverty reduction 19 percent population below the poverty line by 2015 is actively considered.
2. In India there is an increase in construction of school
facilities, the filling of vacancies and training of teachers, success in enrolment, and reductions in drop out rates.
3. India has 16 percent of the world’s population, but its share
of fresh water sources is only 4 percent. The National Water Policy (2002) emphasizes conservation and sustainable use of water, and prioritizes its use for drinking, hydro-power, agriculture, industries and ecology. Government programmes on water relate to extension of irrigation systems, watershed programmes and rainwater harvesting.
4. Over 60 percent of all HIV cases in Asia live in India. to
reduce mortality by 50 percent on account of TB, malaria, other vector and water-borne diseases, to achieve zero level growth of HIV AIDS, and to increase health expenditure by government to 2.0 percent of GDP by 2010.
5. The male-female literacy gap has reduced from 25 percent
in 1991 to 22 percent in 2001. The literacy gap between the sexes is also higher in rural than in urban areas.
6. Malnutrition accounts for nearly 50 percent of child deaths
in India. IMR has been steadily declining in India from 146 in 1951 to 58 in 2005.
7. As of 2001-03, India’s MMR is 301 with over a little over
48 percent births being attended by skilled health personnel. The Planning Commission projects that India will miss the MMR target for 2015, which is less than 109. The Government of India has launched the National Rural Health Mission (NRHM) in 2005 to improve basic health care delivery system in India.
AKASHDEEP COMMERCE CLASSESVivek Kumar
SYBCom Business Economics paper II (2009 onwards) 70
8. The benefits of technology are made available to a wider mass in cooperation with the private sector. The number of internet users has also increased to 3.5 persons per 100 from 2001 to 2006.
Human Development Index and Human Resource Development Human development is a process of developing quality embodied in human beings. According to human development report 1997, Human development is a process of widening people’s choice as well as raising the level of well being achieved. UNDP measures HD in terms of HDI. This is a composite index encompassing selected information on literacy and education, expectation of life at birth and measures of material well being. HDI shows the quality of life of the people. The Human Development Index (HDI) is the measure of life expectancy, literacy, education, standard of living, and GDP per capita for countries worldwide. It is a standard means of measuring well-being, especially child welfare.
The HDI combines three basic dimensions:
• Life expectancy at birth, as an index of population health and longevity
• Knowledge and education, as measured by the adult literacy rate (with two-thirds weighting) and the combined primary, secondary, and tertiary gross enrollment ratio (with one-third weighting).
• Standard of living, as measured by the natural logarithm of gross domestic product(GDP) per capita at purchasing power parity (PPP)
Countries with high HDI are USA, Japan and Norway with HDI 0.8 and above. These are countries with high HDI ranking. HDI lower than 0.5 are poor countries like Pakistan and Bangladesh India with HDI of 0.577 ranks 124th belongs to group with HDI score. HDI Score between 0.5 and 0.8 are called medium countries.
AKASHDEEP COMMERCE CLASSESVivek Kumar
SYBCom Business Economics paper II (2009 onwards) 71
The national human development index report for India found that Kerala ranks top of the list with a HDI of 0.638 and Bihar ranks the last with HDI of 0.367. The next top three positions go to Punjab, Tamilnadu, and Maharashtra with HDI value of over 0.52. The lowest three states apart from Bihar are M.P, U.P, and Assam.
The Gender Empowerment Measure (GEM) is a measure of inequalities between men's and women's opportunities in a country. It combines inequalities in three areas: political participation and decision making, economic participation and decision making, and power over economic resources. It is one of the five indicators used by the United Nations Development Programme in its annual Human Development Report
Human Development Through Education
Education is universally recognized as an important element of HD. It plays an important role in economic growth and population control. There has been an increase in Gross Enrolment Ratios in the field of education. Gross Enrolment Ratio has improved in both primary and upper primary levels during the period of 1950-51 to 2005-06. According to economic survey 2006-07, Gross Enrolment Ratio of the primary level has risen from 42.6 percent in 1950-51 to 95.4 percent in 2002-03. Similarly GER at upper primary level has increased from 12.7 percent to 60.9 percent in the same period. The literacy rate of the country as a whole has increased from 18.33 percent to 65.38 percent between 1951-2001.The literacy rate for males has increased from 27.16 percent to 75.85 percent and for females from 8.86 percent to 54.16 percent during the same period. The growth rate of literacy during 1991 to 2001 has been higher in case of females as compared to males and has been higher in rural areas as compared to urban areas. But after this much growth also we have not achieved that level of growth where there is complete literacy. The failures of literacy are due to:
• Lower enrollment of girls
• Increase in number of students per teacher
• High dropout rates
• Inadequate infrastructure
• Neglect of quality in education
AKASHDEEP COMMERCE CLASSESVivek Kumar

SYBCom Business Economics paper II (2009 onwards) 72
Human development through health
As it is rightly said health is wealth, health forms an important aspect of HD. In India over the years economic growth and development are not merely confined to increased GDP or per capita income but in broader terms it has been extended to enhancement of human well being .This includes not only an adequate level of consumption of food and other types of consumer goods but also access to basic social services especially education, health, safe and clean drinking water, sanitation as well as expansion of economic and social opportunities for all individuals. In India social welfare and social security measures were introduced only after independence:
1. Employee’s State Insurance Act,1948 was passed to provide compulsory and contributory health insurance
2. Family Pension: family pension schemes were
introduced from March 1st 1971 called Coal Mines Family Pension Scheme and Employment Family Pension Scheme to provide long term financial securities to families.
3. Gratuity: The payment of gratuity act was passed in
1972. According to this act completion of 5 years of service the employees are entitled to gratuity payable at the rate of 15 days wages for each completed years of service.
4. Maternity Benefit Act was enacted to provide uniform
standards for maternity protection
Achievements in Health Care
1. The death rate dropped from 12.5 in 1981 to 8.5in 2007.The death rate is expressed per thousand.
2. Infant mortality reduced from 110 in 1981 to 68 in
2007. Infant mortality expressed as deaths of infants below 12 months of age per thousand.
AKASHDEEP COMMERCE CLASSESVivek Kumar
SYBCom Business Economics paper II (2009 onwards) 73
3. The number of primary health centers increased from
5700 to 24000, between 1918 and 2007. 4. Increase in life expectancy: Life expectancy has
increased from 50.8 in 1981 to 60.3 in current levels. 5. Control of diseases: national health programs are
implemented to control communicable and non communicable diseases.
Limitations:
1. 20 percent of population does not have access to safe drinking water as a result of which they are affected by water borne diseases.
2. Huge stock of food grains are held by government, yet a good number of people suffer from hunger and malnutrition
3. People in India are reluctant to use of medical health until the sickness becomes severe.
4. Due to population and congestion in urban areas there are many health problems.
Human development through family welfare
Government of India has adopted several family welfare programs during planning period. It aimed at:
1. to stabilize the growth of population 2. to improve health of mothers and children
3. to reduce infant mortality rate and maternal mortality rate
4. to ensure responsible rate
5. to ensure responsible parenthood.
National Population Policy 2000 Human resources act as a focus of economic development. Higher the number of persons in an economy, larger is the demand for its national product. If the size of population is more than what can be absorbed by the national product, it leads to a number of problems. Over population results in acute shortages and scarcities, slowing down the process of capital formation, affecting balance of trade, employment generation, etc.
AKASHDEEP COMMERCE CLASSESVivek Kumar
SYBCom Business Economics paper II (2009 onwards) 74
A policy on population becomes essential to restore certain demographic features to normalcy. The Population Policy 2000 is a recent move towards improving the demographic character of India.
Objectives of Policy:
1. to reduce infant mortality rate to below30 per thousand live birth
2. to reduce maternal mortality rate below 100 per 100000
live birth 3. to lower total fertility rate at 2.1 children by 2010
4. to achieve a stable population by 2045
The following are the main features of National Population Policy, 2000:
1. Improve the basic reproductive and child health services, supplies and infrastructure.
2. Make school education free and compulsory till the age
of 14 and reduce dropouts at primary and secondary school levels to below 20 percent for both boys and girls.
3. Reduce infant mortality rate to below 30 per 1000 live
births. 4. Reduce maternal mortality rate to below 100 per 100000
live births. 5. Achieve universal immunization of children against all
vaccine preventable diseases. 6. Promote delayed marriage for girls, not earlier than age
18 and preferably after 20 years of age. 7. Achieve 80 percent institutional deliveries and 100
percent deliveries by trained persons.
AKASHDEEP COMMERCE CLASSESVivek Kumar
SYBCom Business Economics paper II (2009 onwards) 75
8. Achieve universal access to information/ counseling and services for fertility regularization and contraception with a wide basket of choices.
9. Achieve 100 percent registration of births, deaths,
marriage and pregnancy. 10. Prevent and control communicable diseases. 11. Integrate Indian system of medicine in the provision of
reproductive and child health services and in reaching out to households.
6. Economy in the long run Long run growth strategy for India: India is fast developing as a major economic power in the world. India has seen several changes in the post reforms period these changes include:
• Rapidly increasing educational levels,
• Increasing technological innovation and application
• Availability of cheaper and faster communication is reducing physical and social barriers, both within the country and internationally.
• Information is being made available in greater quantity and quality than ever before, and
• Globalization and opening up of new markets. Given these trends, the long run strategy for India shall include:
1. A targeted approach to bring millions of families above the poverty line.
2. Generation of nearly ten millions of new employment opportunities per annum, especially for those in the lower income groups.
3. Eradication of illiteracy.
AKASHDEEP COMMERCE CLASSESVivek Kumar

SYBCom Business Economics paper II (2009 onwards) 76
4. A concerted effort to raise primary and secondary enrolment rates and minimize dropouts.
5. Improved public health to reduce infant mortality and child malnutrition.
6. Massive investment in power generation, telecommunications and other physical and social infrastructure.
7. Accelerated acquisition of technology capabilities to raise productivity in agriculture, industry and services.
Knowledge Economy
The Concept
India’s growing population of young people will give the country a demographic advantage over many countries. As a result there is a need in, India to reorganize knowledge-oriented focus of development. The National Knowledge Commission was established in June 2005. The strategy suggested by National Knowledge Commission was:
• Creation of Knowledge: strengthen education systems, promote research and development in a variety of fields, and partner with foreign sources to expand learning
• Application of Knowledge: health, agriculture, government and industry sectors to revise governance through technology
• Dissemination of Knowledge: focus on widespread basic education for all
National Knowledge Commission Focus Areas
The access to knowledge is a fundamental goal of India’s strategy. The following issues are considered by the commission:
• Adult literacy
• Delivery of information
• Public information availability
• Affirmative action framework Policy for Change
The National Knowledge Commission recommends the following strategy:
AKASHDEEP COMMERCE CLASSESVivek Kumar
SYBCom Business Economics paper II (2009 onwards) 77
• The promotion of sound research in universities and institutes and the achievement of worldwide competitiveness in the quality of higher education
• The linkage of research in institutes with industry needs to best develop research and development
• The diversification of funding sources for institutes and universities as a strategy for collaboration and knowledge sharing
• The promotion of innovation through the National Innovation Foundation, which encourages students to use new approaches in science and technology
• The strengthening of Intellectual Property Rights in the country
• The inclusion of internet and e-learning into standard education systems
• The promotion of new agricultural technology that will provide sustainable food sources
• The protection of traditional knowledge which is particularly at risk due to the expansion of new technologies
• The creation of a comprehensive e-governance system to reduce costs, empower citizens and improve efficiency
Further development of India’s educational system is believed to be the key in the advancement of the knowledge economy. The education system should be reinforced to create a sound Knowledge Economy. The following changes shall be brought in to the educational system:
o Aim for 95 percent to 100 percent literacy in the next 10 years
AKASHDEEP COMMERCE CLASSESVivek Kumar
SYBCom Business Economics paper II (2009 onwards) 78
o Decontrol and involve the management of all primary schools to the local bodies such as Panchayats, Village Groups, Municipalities and local Citizen Groups.
o Scrap ‘Licence Raj’ in Higher and Technical Education,
after and including class XI, to allow innovation, creativity and excellence in Education.
o Ensure that 80 percent to 90 percent of the population in
the age group of 14 years to 50 years goes in for some sort of relevant Vocational Education and Training.
o Allow starting of Enterprise Skills Education, ESD, from
Class 5th to the 12th. More than 60 percent of the work force in India is self-employed.
o Upgrade all Higher Secondary schools for Vocational
Education and Training and have full time counselors o Allow private finance and participation in all sectors of
education. o Allow tax breaks and incentives for private and NRI
funding, for the next 20 years. India as a Global Knowledge Economy
India can become a leader in the global knowledge economy by 2010. In this part, I plan to define the skills and expertise that one needs to have to succeed in the knowledge economy and propose several strategies to make these available in India to meet the expected explosion in demand.
The knowledge can be classified in two ways:
• Explicit knowledge which can be stored by a company and marketed, and
• Tacit knowledge which resides within people and represents skills. This is the characteristic of people within the industry,
AKASHDEEP COMMERCE CLASSESVivek Kumar
79
Knowledge based exports Indian knowledge base exports are classified into low technology with food beverages, wood, paper, textiles; medium and high technology goods with chemicals, pharmaceuticals, electronics, and transport equipment.
1. Knowledge based exports comprise, high tech exports, service exports and export earnings from IT enabled activities
2. Indian exports are IT based. 16 percent of India’s total
exports are IT services and IT-based business services. 3. Exports of computer and information services and other
business services account for $ 14,000 of which are computer and information services constitute 81.4 percent.
4. Off shore activities are more than high tech
manufacturing. 5. Business Process out Sourcing has emerged as an
important revenue earner for India in recent times. Business Process Outsourcing means carrying out those processes in India which are other wise expensive in a country of main activity.
6. Knowledge Process Outsourcing is fast emerging as an
important export earner for India. There are specific reasons for Knowledge Process Outsourcing to grow in India:
7. India has unique advantages in having large English-
speaking professionals with degrees in engineering, science or mathematics.
8. The Indian Diaspora in the United States and the United
Kingdom can help the Indian Knowledge Process to grow 9. The entrepreneurial and business community in India has
the capacity to benefit from a god policy environment.
AKASHDEEP COMMERCE CLASSESVivek Kumar