reactions of graphene oxide and buckminsterfullerene in
TRANSCRIPT
Purdue UniversityPurdue e-Pubs
Open Access Dissertations Theses and Dissertations
8-2016
Reactions of graphene oxide andbuckminsterfullerene in the aquatic environmentYingcan ZhaoPurdue University
Follow this and additional works at: https://docs.lib.purdue.edu/open_access_dissertations
Part of the Environmental Engineering Commons
This document has been made available through Purdue e-Pubs, a service of the Purdue University Libraries. Please contact [email protected] foradditional information.
Recommended CitationZhao, Yingcan, "Reactions of graphene oxide and buckminsterfullerene in the aquatic environment" (2016). Open Access Dissertations.896.https://docs.lib.purdue.edu/open_access_dissertations/896
Graduate School Form30 Updated
PURDUE UNIVERSITYGRADUATE SCHOOL
Thesis/Dissertation Acceptance
This is to certify that the thesis/dissertation prepared
By
Entitled
For the degree of
Is approved by the final examining committee:
To the best of my knowledge and as understood by the student in the Thesis/Dissertation Agreement, Publication Delay, and Certification Disclaimer (Graduate School Form 32), this thesis/dissertation adheres to the provisions of Purdue University’s “Policy of Integrity in Research” and the use of copyright material.
Approved by Major Professor(s):
Approved by:Head of the Departmental Graduate Program Date
Yingcan Zhao
REACTIONS OF GRAPHENE OXIDE AND BUCKMINSTERFULLERENE IN THE AQUATIC ENVIRONMENT
Doctor of Philosophy
Chad T. JafvertChair
Timothy R. Filley
Inez Hua
Ronald F. Turco
Chad T. Jafvert
Dulcy M. Abraham 6/21/2016

i
REACTIONS OF GRAPHENE OXIDE AND BUCKMINSTERFULLERENE IN THE AQUATIC
ENVIRONMENT
A Dissertation
Submitted to the Faculty
of
Purdue University
by
Yingcan Zhao
In Partial Fulfillment of the
Requirements for the Degree
of
Doctor of Philosophy
August 2016
Purdue University
West Lafayette, Indiana

ii
To my parents and Liang, for their love, support and encouragement.
iii
ACKNOWLEDGEMENTS
I would like to express my deepest gratitude to my Ph.D. major advisor, Prof.
Jafvert, for his guidance, support and encouragement throughout my graduate research
studies during the past few years at Purdue. Even though sometimes he is extremely
busy, he would like to help me out with my hundreds of academic questions and
difficulties. I also enjoy the academic freedom he gave me to explore my own interest
in research. I have learned so much from him and if I have a chance to be faculty
member in environmental engineering area in the future, I hope to be someone like
you, Dr. Jafvert, patient, kind, generous and full of career passion.
I want to further thank one of my committee members, Prof. Inez Hua, who
provided me the opportunity to be a teaching assistant with her in Fall 2014 for the
course CE/EEE 350 Introduction to Environmental Engineering. I cherish the whole
semester working with her and five peer undergraduate TAs.
I want to thank all my committee member: Drs. Chad Jafvert, Timothy Filley, Inez
Hua and Ronald Turco. Without their guidance, this thesis would have been impossible
to complete. I also want to thank Nadya Zyaykina, the environmental engineering
laboratory manager. Thanks for her kindness and patience even though I bothered her
so many times. I also would like to thank Prof. Zhi Zhou who provided instruments for

iv
my gel electrophoresis experiments and give me helpful suggestions when I applied for
postdoc positions.
I want to express my thankfulness to my lab mates: Somi, Hsin-Se, Tengyi, Ming,
Xuda, Xuqing, Yining and Yichen; also Dr. Filley and his group: Tim Berry and Christy. I
will cherish all your help and the time we spent together. Thanks to all my friends here
at Purdue. You are like angels to make me feel we are just like a family.
Although being so far away from home, my parents Honglai Zhao and Wenyan
Zhang have never stopped offering me love and encouragement. Being their single
child, I know I owe them a lot. Thanks for their support and love, forever.
At the period of writing this thesis, I am excited to know that my husband and I
will have our first baby soon. She gives me so much courage that keeps me moving on. I
always wish to give her all the best things in life. Thank you for choosing us to be your
parents and welcome to our home, my little sweetie.
v
TABLE OF CONTENTS
Page
LIST OF TABLES ................................................................................................................... vii
LIST OF FIGURES .................................................................................................................. ix
ABSTRACT .......................................................................................................................... xiii
CHAPTER 1. INTRODUCTION ......................................................................................... 1
1.1 Scope and Significance ..................................................................................... 1
1.2 Fullerenes ......................................................................................................... 2
1.2.1 Physical and Chemical Properties of C60 ....................................................... 2
1.2.2 C60 Toxicity .................................................................................................... 3
1.2.3 C60 Photo-activity .......................................................................................... 4
1.3 Graphene Oxide ................................................................................................ 5
1.3.1 Graphene Oxide Applications ....................................................................... 6
1.3.2 Environmental Applications using Graphene Oxide-based Material ........... 7
1.3.3 Toxicity of Graphene Oxide........................................................................... 7
1.3.4 Environmental Transformation of Graphene Oxide ..................................... 8
1.3.5 High Electron Transfer Ability of Graphene Oxide........................................ 9
1.4 Chapter Outline .............................................................................................. 10
CHAPTER 2. ENVIRONMENTAL PHOtOCHEMISTRY OF SINGLE LAYERED GRAPHENE
OXIDE IN WATER ............................................................................................................... 12
2.1 Abstract........................................................................................................... 12
2.2 Introduction .................................................................................................... 13
2.3 Materials and Methods .................................................................................. 17
2.3.1 Materials ..................................................................................................... 17
2.3.2 Preparation of Aqueous Graphene Oxide ................................................... 17
vi
Page
2.3.3 Irradiation and GO Analysis ........................................................................ 18
2.3.4 ROS Measurement ...................................................................................... 19
2.4 Results and Discussion .................................................................................... 20
2.5 Conclusion ...................................................................................................... 30
2.6 Supporting Information .................................................................................. 32
CHAPTER 3. Light-IndepenDENT rEDOX REACTIONS OF GRAPHENE OXIDE IN WATER:
ELECTRON TRANSFER FROM NADH TO MOLECULAR OXYGEN PRODUCING REACTIVE
OXYGENM SPECIES (ROS) .................................................................................................. 37
3.1 Abstract........................................................................................................... 37
3.2 Introduction .................................................................................................... 38
3.3 Materials and Method .................................................................................... 40
3.3.1 Materials ..................................................................................................... 40
3.3.2 Oxidation of NADH ...................................................................................... 41
3.3.3 ROS Detection ............................................................................................. 41
3.3.4 Gel Electrophoresis ..................................................................................... 43
3.4 Results and Discussion .................................................................................... 43
3.5 Conclusion ...................................................................................................... 58
CHAPTER 4. INDIRECT PHOTO-TRANSFORMATION OF GRAPHENE OXIDE IN WATER 59
4.1 Abstract........................................................................................................... 59
4.2 Introduction .................................................................................................... 60
4.3 Materials and Methods .................................................................................. 63
4.3.1 Materials ..................................................................................................... 63
4.3.2 Irradiation of GO in Solar Spectrum Light ................................................... 63
4.3.3 Materials Analysis ....................................................................................... 64
4.4 Results and Discussion .................................................................................... 64
4.5 Conclusion ...................................................................................................... 70
4.6 Environmental Significance ............................................................................ 71
vii
Page
CHAPTER 5. PHOTOREACTIONS OF AQU/NC60 CLUSTERS UNDER SIMULATED
SUNLIGHT: PHOTO MINERALIZATION AND PRODUCT CHARACTERIZATION .................... 72
5.1 Abstract........................................................................................................... 72
5.2 Introduction .................................................................................................... 72
5.3 Materials and Methods .................................................................................. 75
5.3.1 Materials ..................................................................................................... 75
5.3.2 Aqu/nC60 Suspension Preparation .............................................................. 76
5.3.3 HPLC Measurement .................................................................................... 78
5.3.4 UV-Vis spectroscopy and pH measurement ............................................... 79
5.3.5 Headspace CO2 measurement .................................................................... 79
5.4 Results and Discussion .................................................................................... 80
5.5 Conclusions ..................................................................................................... 88
CHAPTER 6. OVERALL SUMMARY AND RECOMMENDATION ..................................... 89
6.1 Summary ......................................................................................................... 89
6.2 Recommendations .......................................................................................... 91
REFERENCES ...................................................................................................................... 93
VITA ................................................................................................................................. 104
viii
LIST OF TABLES
Table Page
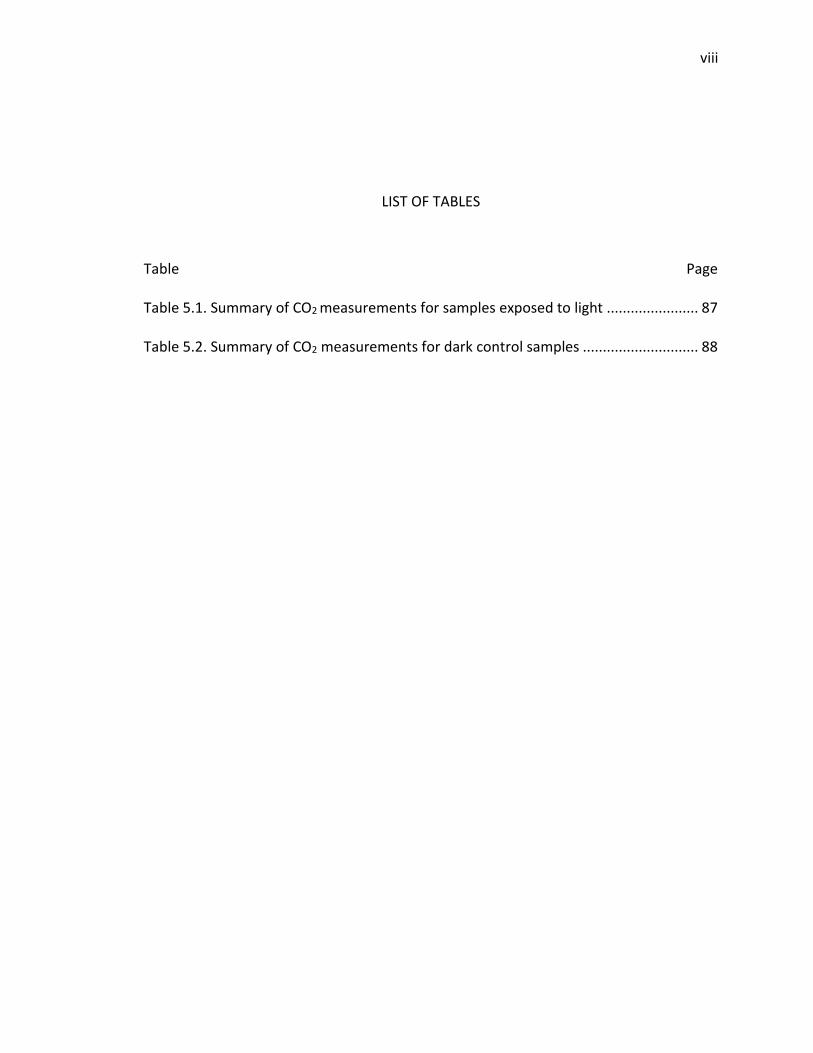
Table 5.1. Summary of CO2 measurements for samples exposed to light ....................... 87
Table 5.2. Summary of CO2 measurements for dark control samples ............................. 88
ix
LIST OF FIGURES
Figure .............................................................................................................................Page
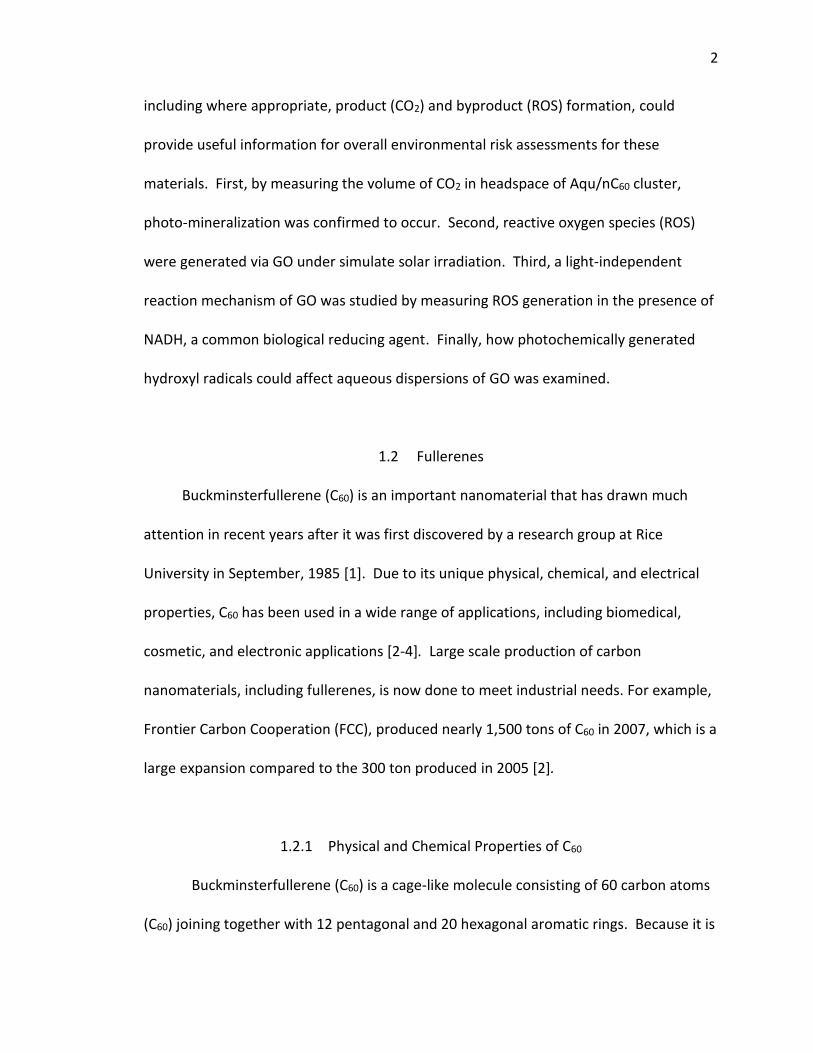
1.1 C60 Buckminsterfullerene .............................................................................................. 3
1.2 The structure of graphene oxide (adapted from C.E. Hamilton, PhD Thesis, 2009, Rice
University) ........................................................................................................................... 6
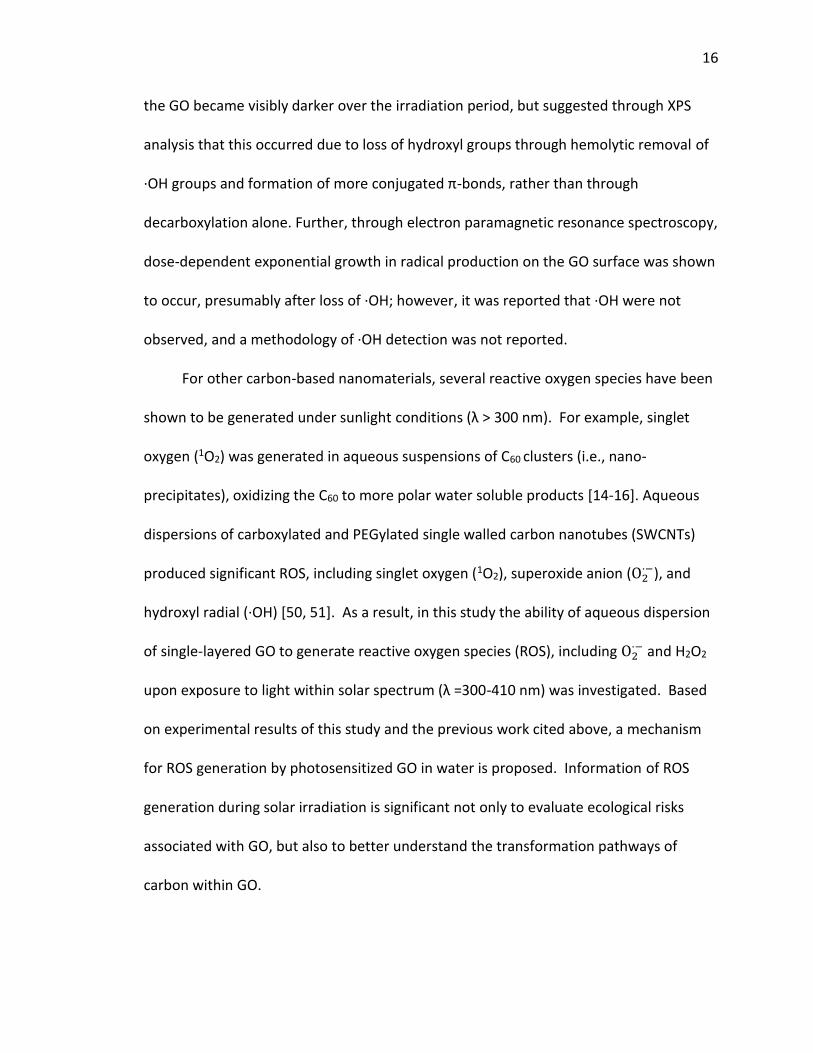
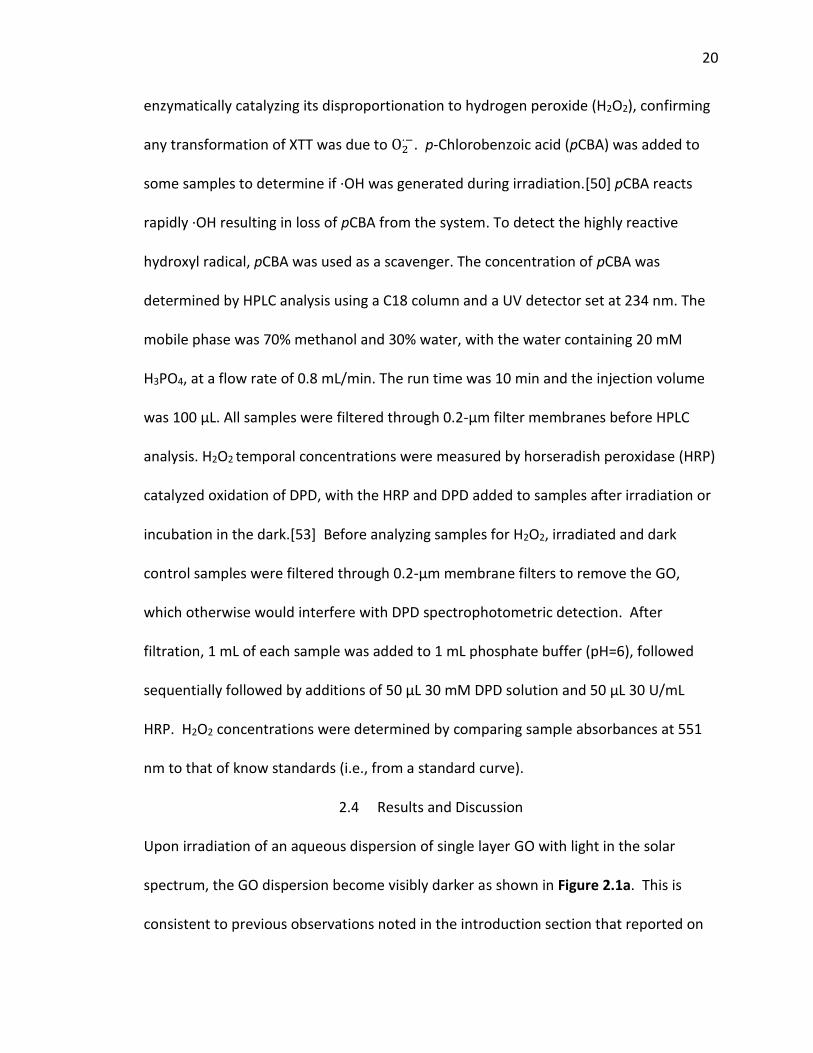
2.1 (a) Photograph of 5 mg/L GO at pH 7, before (left vial) and after (right vial) irradiation
for 2 hours under lamp light irradiation; and (b) the change in the UV-visible light
absorption spectra of GO suspensions with increasing time of irradiation. .................... 22
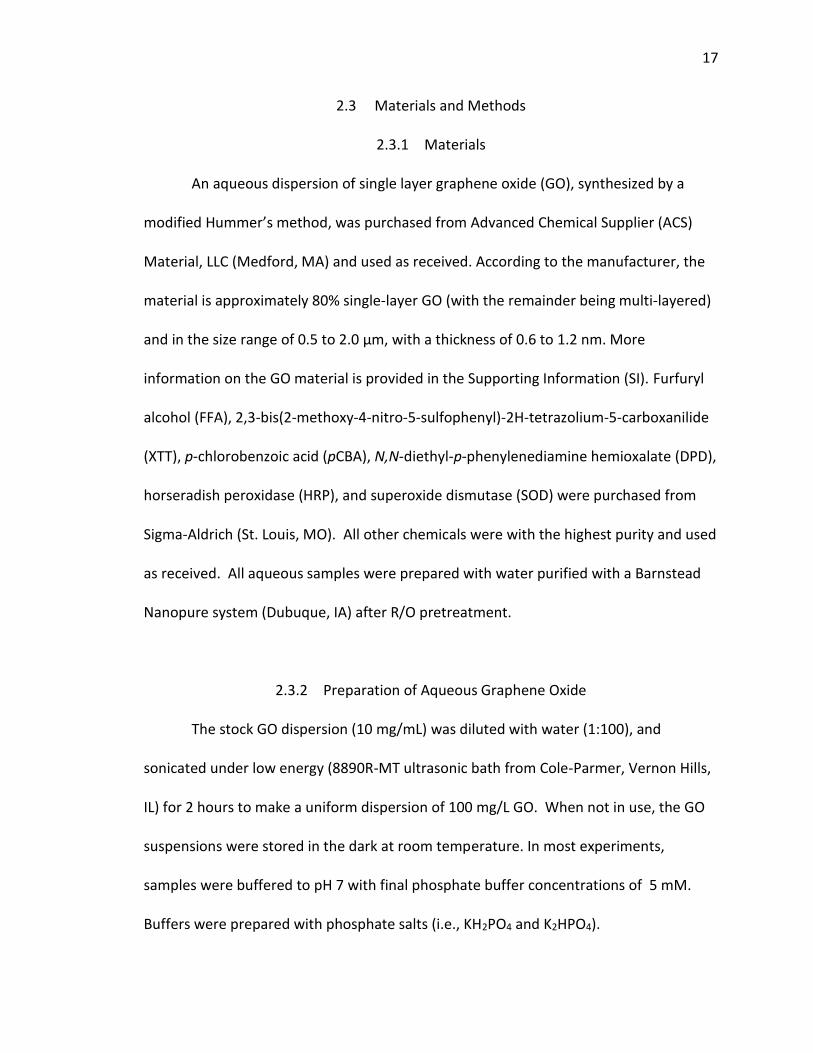
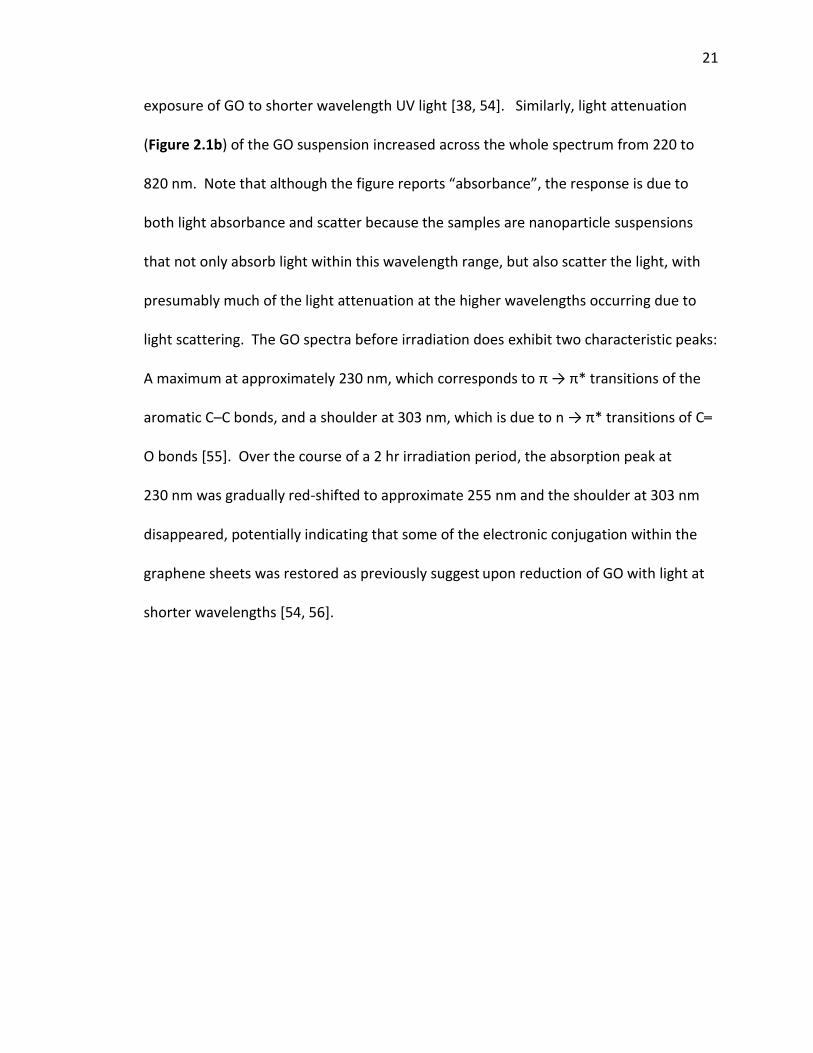
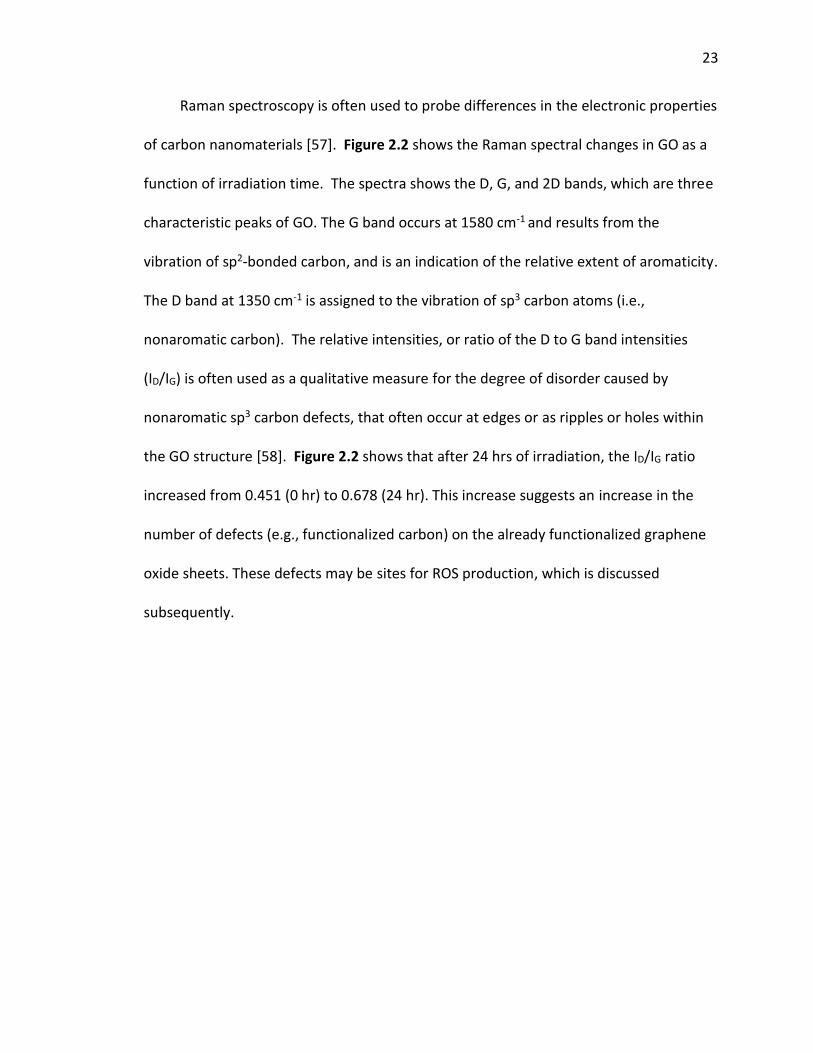
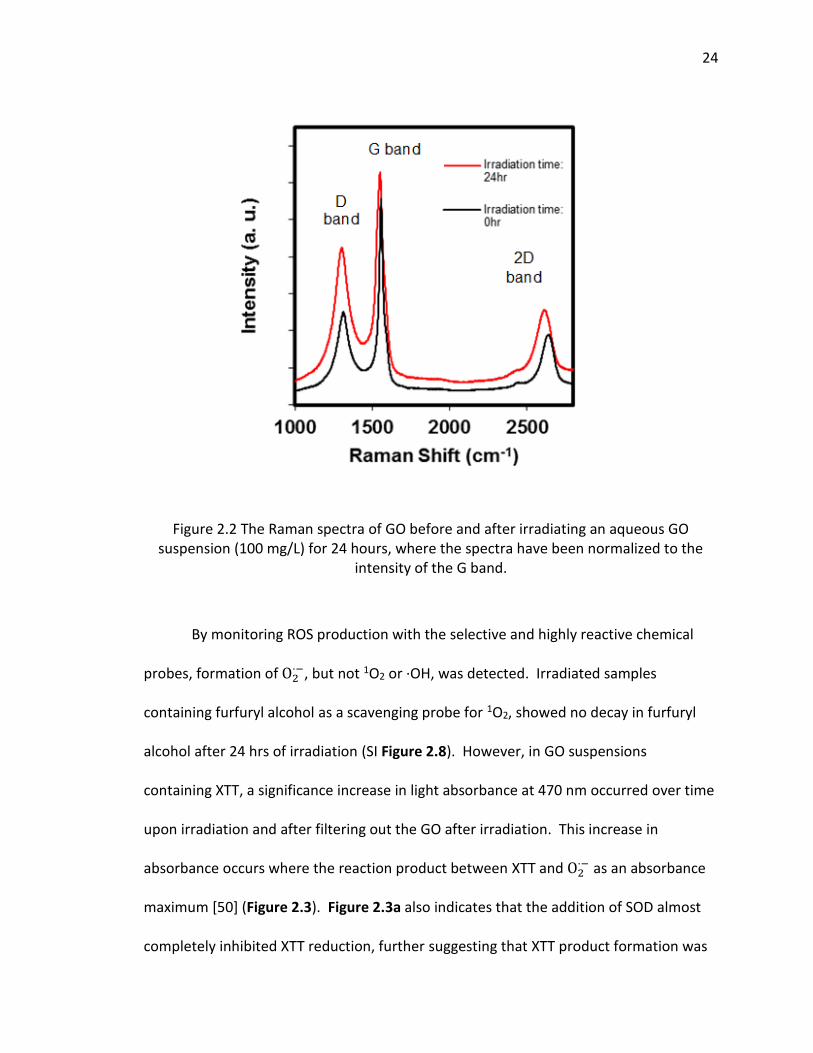
2.2 The Raman spectra of GO before and after irradiating an aqueous GO suspension (100
mg/L) for 24 hours, where the spectra have been normalized to the intensity of the G
band. ................................................................................................................................. 24
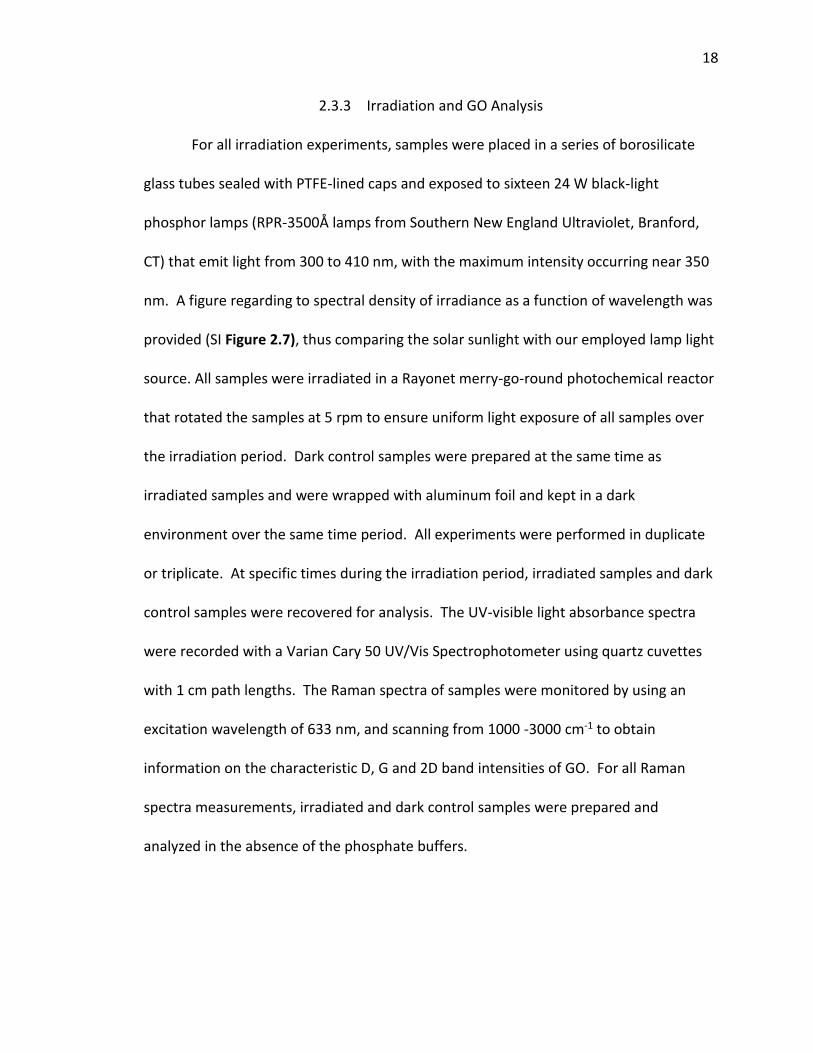
2.3 (a) Evidence of superoxide anion formation by reaction with XTT at 470 nm, upon lamp
light irradiation of a 5 mg/L GO suspension at pH 7. (b) The change in the UV-visible light
absorption spectra for a suspension of GO (5 mg/L) and XTT (0.1 mM). ......................... 26
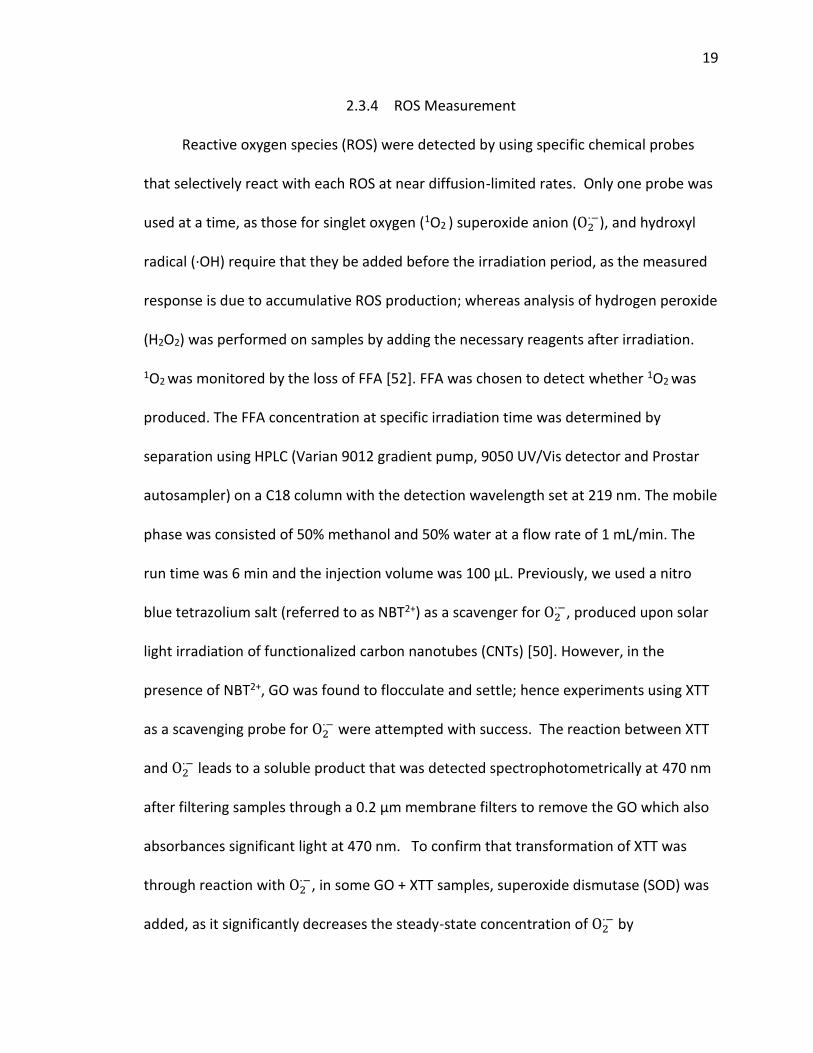
2.4 (a) Evidence for the increase in H2O2 concentration over time upon lamp light
irradiation of GO at pH 7. (b) The standard curve of H2O2 using DPD/HRP method. ..... 29
2.5 Proposed pathway for ROS production by photosensitization of GO in water. ......... 31
2.6 Images of GO (Provided by ACS Material LLC.). .......................................................... 32
x
Figure .............................................................................................................................Page
2.7 Spectral density of solar and employed lamp light irradiance as a function of time
(solar irradiance data was from ASTM G173-03 Reference Spectra). .............................. 33
2.8 Data points are the concentrations of FFA (initially at 0.2 mM) detected in suspensions
of 5 mg/L GO at pH 7. All samples were analyzed by HPLC after removing the GO with a
0.2-μm membrane filter. .................................................................................................. 34
2.9 Photograph of 5 mg/L GO in water with XTT (0.1 mM) at pH=7 at irradiation times of
0, 0.5, 1, 1.5, 2, 2.5, and 3 hr (left to right), before filtering out the GO particles. .......... 35
2.10 Data points are the concentrations of pCBA (initially at 5 μM) detected in suspensions
of 5 mg/L GO at pH 7after irradiation (), or incubation in the dark (). ....................... 36
3.1 Chemical structures of NADH and NAD+. ................................................................... 44
3.2 (a) The UV-visible absorption spectra of NADH (0.2 mM) and GO (5 mg/L) at pH 7 as a
function of time under dark conditions. (b) The loss of NADH (0.2 mM) with and without
GO (5 mg/L), calculated based on the change in light absorbance at 340 nm................ 46
3.3 (a) NBT2+ (0.2 mM) product formation indicating presence of superoxide anion at pH=7
(b) The effect of GO concentration in the production of superoxide anion within the
system containing NADH, NBT2+ and 0 mg/L GO (), 5 mg/L GO (), 10 mg/L GO (), 20
mg/L GO (). .................................................................................................................... 49
3.4 Evidence of superoxide anion using XTT as a scavenger. ........................................... 50
3.5 Evidence of H2O2 production via DPD/HRP product formation. ................................ 52
3.6 Scavenging for ·OH with pCBA in pH 7 phosphate buffered solutions. ...................... 53
xi
Figure .............................................................................................................................Page
3.7 (a) Gel image of pBR322 DNA after an 8 hr incubation at pH 7 in the different
experimental systems. (b) Quantitative analysis of DNA bands. ..................................... 56
3.8 (a) Gel images showing the time course of pBR322 DNA fragmentation, in GO
suspensions containing NADH at pH 7. The concentration of GO, NADH and pBR322 DNA
were 5 mg/L, 0.2 mM and 0.015 µg/µL, respectively. (b) Quantitative analysis of DNA
bands. ................................................................................................................................ 57
3.9 Proposed mechanism of GO acting as an electron shuttle to produce reactive oxygen
species(ROS) and subsequent DNA cleavage. .................................................................. 58
4.1 Characterization of GO. a) UV/Vis absorption spectra. b) Raman spectra. ................ 65
4.2 UV-visible attenuation spectra of samples (measured as absorbance); (a) 10 mg/L GO
with 100 mM H2O2 under irradiation with solar wavelength lamp light; (b) 10 mg/L GO
(with no H2O2) under irradiation with solar wavelength lamp light; and (c) 10 mg/L GO
with 100 mM H2O2 dark control. ....................................................................................... 67
4.3 Images of samples at specific experimental times: (a) GO before irradiation; (b) GO
after 48 hr of irradiation with solar-wavelength lamp light; and (c) GO and H2O2 after 48
hr of irradiation with solar-wavelength lamp light. All samples contain 10 mg/L GO, and
either zero or 100 mM H2O2. ............................................................................................ 69
4.4 Degradation of GO in the presence of H2O2 under irradiation by measuring TOC. ... 70
5.1 Merry-go-round photo-reactor ................................................................................... 78
5.2 HPLC analysis of Aqu/nC60 after zero, 5, and 15 days of light exposure. ................... 82

xii
Figure .............................................................................................................................Page
5.3 UV-Vis spectra of aqu/nC60 and irradiated C60 ........................................................... 84
5.4 pH changes of C60 irradiated and dark control samples. ............................................ 85
5.5 CO2 measurements as a function of time. .................................................................. 86
xiii
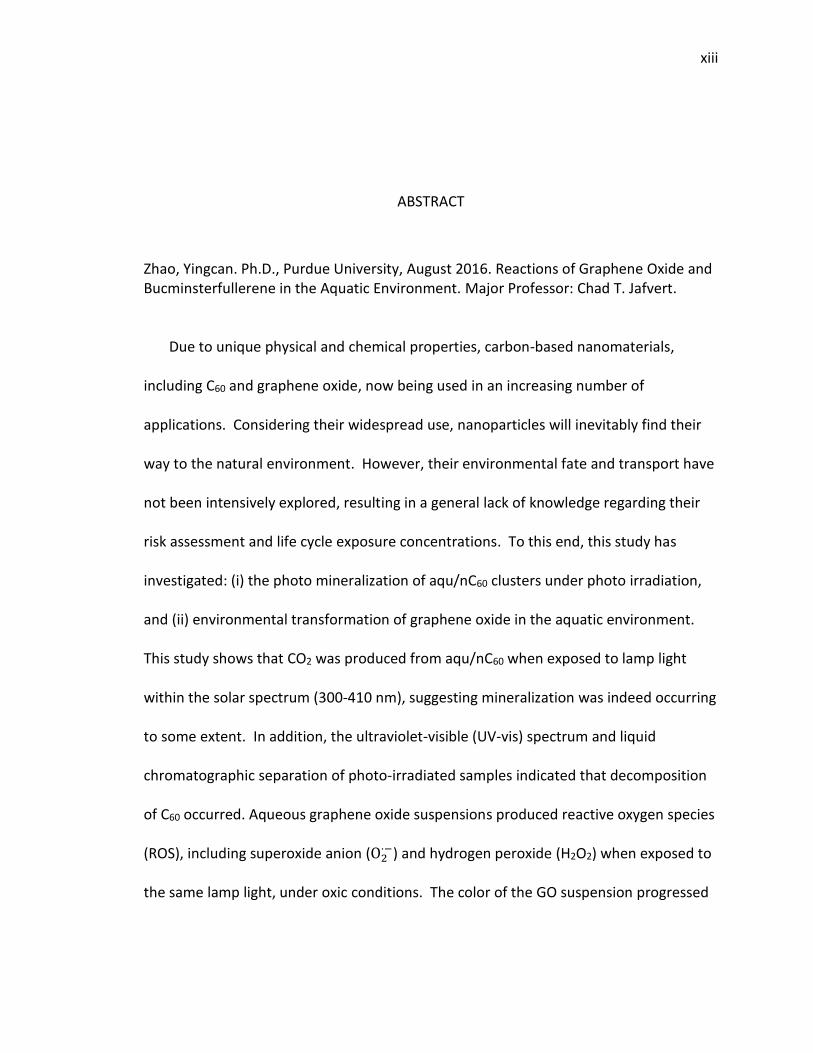
ABSTRACT
Zhao, Yingcan. Ph.D., Purdue University, August 2016. Reactions of Graphene Oxide and Bucminsterfullerene in the Aquatic Environment. Major Professor: Chad T. Jafvert. Due to unique physical and chemical properties, carbon-based nanomaterials,
including C60 and graphene oxide, now being used in an increasing number of
applications. Considering their widespread use, nanoparticles will inevitably find their
way to the natural environment. However, their environmental fate and transport have
not been intensively explored, resulting in a general lack of knowledge regarding their
risk assessment and life cycle exposure concentrations. To this end, this study has
investigated: (i) the photo mineralization of aqu/nC60 clusters under photo irradiation,
and (ii) environmental transformation of graphene oxide in the aquatic environment.
This study shows that CO2 was produced from aqu/nC60 when exposed to lamp light
within the solar spectrum (300-410 nm), suggesting mineralization was indeed occurring
to some extent. In addition, the ultraviolet-visible (UV-vis) spectrum and liquid
chromatographic separation of photo-irradiated samples indicated that decomposition
of C60 occurred. Aqueous graphene oxide suspensions produced reactive oxygen species
(ROS), including superoxide anion (O2·−) and hydrogen peroxide (H2O2) when exposed to
the same lamp light, under oxic conditions. The color of the GO suspension progressed
xiv
from pale to dark brown during the photoreaction process, consistent with changes in
the UV-vis spectrum. Raman spectra showed that the ratio of the ID/IG bands increased
as irradiation proceeded, suggesting an increased number of defects (e.g., functional
groups and vacancies) on the graphene oxide sheets. These defects may be the sites for
ROS production. In dark environments, GO was able to accept electrons from a well
know reducing agent and electron donor (NADH), oxidizing NADH to NAD+, and
transferring these electrons to molecular oxygen in water, producing the reactive
oxygen species (ROS) superoxide anion (O2·−) and hydrogen peroxide (H2O2). DNA
cleavage was observed in air-satured GO suspensions that contained NADH, suggesting
that ROS production could be a mechanism for DNA damage by GO within biological
cells. Indirect photochemical reactions involving GO were shown to occur in an
experiment in which hydroxyl radicals were generated by the photo-decay of hydrogen
peroxide. GO was oxidized by ·OH within a 48 hr irradiation period, as measured by
changes in the UV-Vis absorbance spectra over the wavelengths from 300 to 800 nm.
Spectral changes were consistent with visible color changes (i.e., fading) from 0 to 48
hours. Hence, both direct and indirect photochemical reactions might greatly affect the
lifetime and stability of GO in surface waters.
1
CHAPTER 1. INTRODUCTION
1.1 Scope and Significance
Due to the increasing use of carbon-based nano-materials (e.g. carbon nanotubes,
fullerenes such as C60, and graphene oxide (GO), it is anticipated that significant
quantities of these materials will find their way to the environment over the next few
decade, if used are not restricted to prevent their release. However, compared with the
vast number of studies to investigate new applications, studies on the environmental
fate and transport of many of these materials are limited. The overall objective of this
research was: (i) to investigate mineralization of C60 clusters in aqueous suspensions of
nC60 clusters under simulated solar irradiation; and (ii) to better understand the
photochemistry of GO in water and the mechanisms of light-independent reactions
involving GO in aquatic systems. The specific goals were fourfold: (1) To test whether
there is CO2 produced from Aqu/nC60 clusters under simulated sunlight; (2) to examine
photochemical transformation and reaction mechanisms of single-layered GO in
simulated sunlight; (3) to explore mechanisms of light-independent reaction of single-
layered GO in water by measuring ROS production in the presence of a common
biological reducing agent (NADH); and (4) to examine indirect photochemistry of GO.
Data on the physical and chemical changes to these two materials (C60 and GO),
2
including where appropriate, product (CO2) and byproduct (ROS) formation, could
provide useful information for overall environmental risk assessments for these
materials. First, by measuring the volume of CO2 in headspace of Aqu/nC60 cluster,
photo-mineralization was confirmed to occur. Second, reactive oxygen species (ROS)
were generated via GO under simulate solar irradiation. Third, a light-independent
reaction mechanism of GO was studied by measuring ROS generation in the presence of
NADH, a common biological reducing agent. Finally, how photochemically generated
hydroxyl radicals could affect aqueous dispersions of GO was examined.
1.2 Fullerenes
Buckminsterfullerene (C60) is an important nanomaterial that has drawn much
attention in recent years after it was first discovered by a research group at Rice
University in September, 1985 [1]. Due to its unique physical, chemical, and electrical
properties, C60 has been used in a wide range of applications, including biomedical,
cosmetic, and electronic applications [2-4]. Large scale production of carbon
nanomaterials, including fullerenes, is now done to meet industrial needs. For example,
Frontier Carbon Cooperation (FCC), produced nearly 1,500 tons of C60 in 2007, which is a
large expansion compared to the 300 ton produced in 2005 [2].
1.2.1 Physical and Chemical Properties of C60
Buckminsterfullerene (C60) is a cage-like molecule consisting of 60 carbon atoms
(C60) joining together with 12 pentagonal and 20 hexagonal aromatic rings. Because it is
3
not a nanoparticle, but rather a molecule, its solubility can be determined, and C60 has
an extremely low solubility in water [5, 6]. However, it is well recognized that aqueous
nano-clusters, or nC60, occur in water as stable aqueous colloidal suspensions. These
suspensions can be prepared by extended stirring, sonication in water, or through
solvent exchange using organic solvents [7-9].
Figure 1.1 C60 Buckminsterfullerene, image from ref [10]
1.2.2 C60 Toxicity
Several toxicity studies have shown that C60 can induce oxidative stress to the
brain of juvenile largemouth bass and may also be responsible for cytotoxicity, resulting
in DNA cleavage and cellular structure damage [11-13]. These results raise concerns
over these and other potential negative effects on human and animal health, thus
motivating additional research C60 toxicity and on its environmental fate and transport.
4
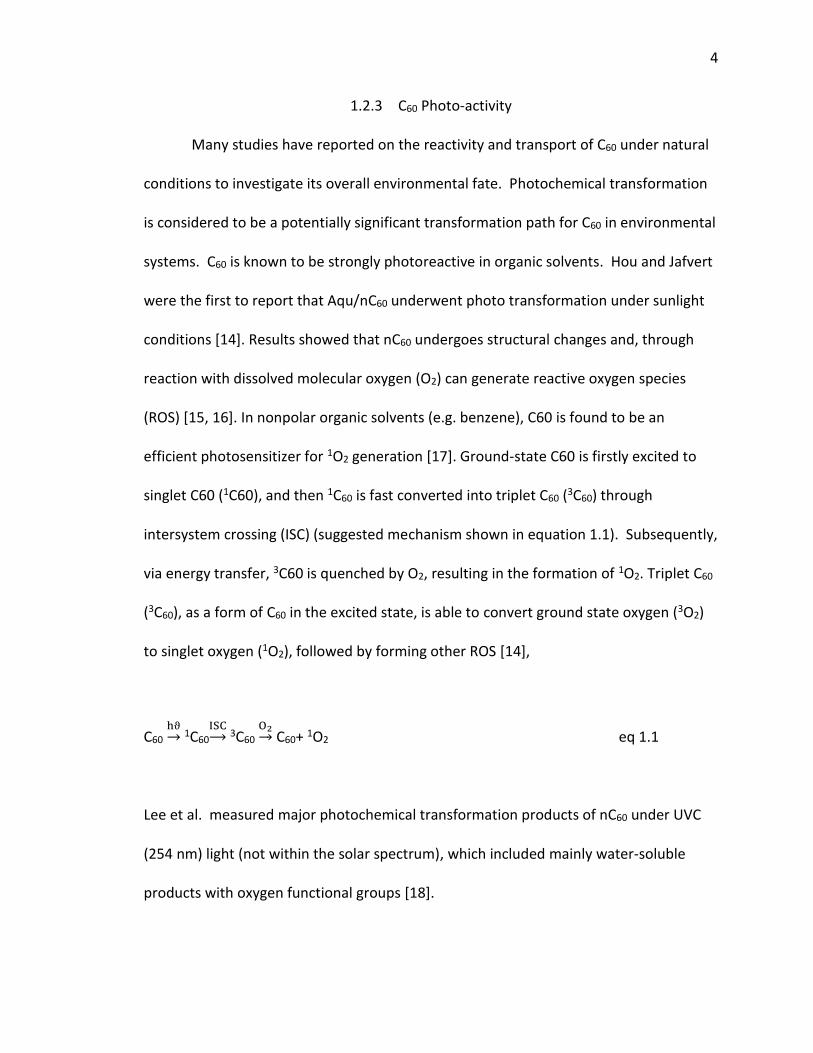
1.2.3 C60 Photo-activity
Many studies have reported on the reactivity and transport of C60 under natural
conditions to investigate its overall environmental fate. Photochemical transformation
is considered to be a potentially significant transformation path for C60 in environmental
systems. C60 is known to be strongly photoreactive in organic solvents. Hou and Jafvert
were the first to report that Aqu/nC60 underwent photo transformation under sunlight
conditions [14]. Results showed that nC60 undergoes structural changes and, through
reaction with dissolved molecular oxygen (O2) can generate reactive oxygen species
(ROS) [15, 16]. In nonpolar organic solvents (e.g. benzene), C60 is found to be an
efficient photosensitizer for 1O2 generation [17]. Ground-state C60 is firstly excited to
singlet C60 (1C60), and then 1C60 is fast converted into triplet C60 (3C60) through
intersystem crossing (ISC) (suggested mechanism shown in equation 1.1). Subsequently,
via energy transfer, 3C60 is quenched by O2, resulting in the formation of 1O2. Triplet C60
(3C60), as a form of C60 in the excited state, is able to convert ground state oxygen (3O2)
to singlet oxygen (1O2), followed by forming other ROS [14],
C60 hϑ→ 1C60
ISC→ 3C60
O2→ C60+ 1O2 eq 1.1
Lee et al. measured major photochemical transformation products of nC60 under UVC
(254 nm) light (not within the solar spectrum), which included mainly water-soluble
products with oxygen functional groups [18].
5
The rate of CO2 photo-production is an important indicator of photochemical
reactivity of organic materials under solar irradiation. Hou et al. [14] first suggested that
C60 may undergo some mineralization to CO2 by measuring the total organic carbon
(TOC) concentration under lamp light irradiation using lamps that emit light only within
the solar spectrum (8 UVA lamps that emit from 300 to 410 nm, centered at 350 nm).
The results showed a decrease in TOC from 65 mg/L to 11.3 mg/L after 65 days.
However, no previous study has shown mineralization to CO2, mainly because previous
experiments used concentration of Aqu/nC60 that were too low to properly detect
accumulation of CO2 above background, or conducted the experiments for only brief
periods of time [19, 20].
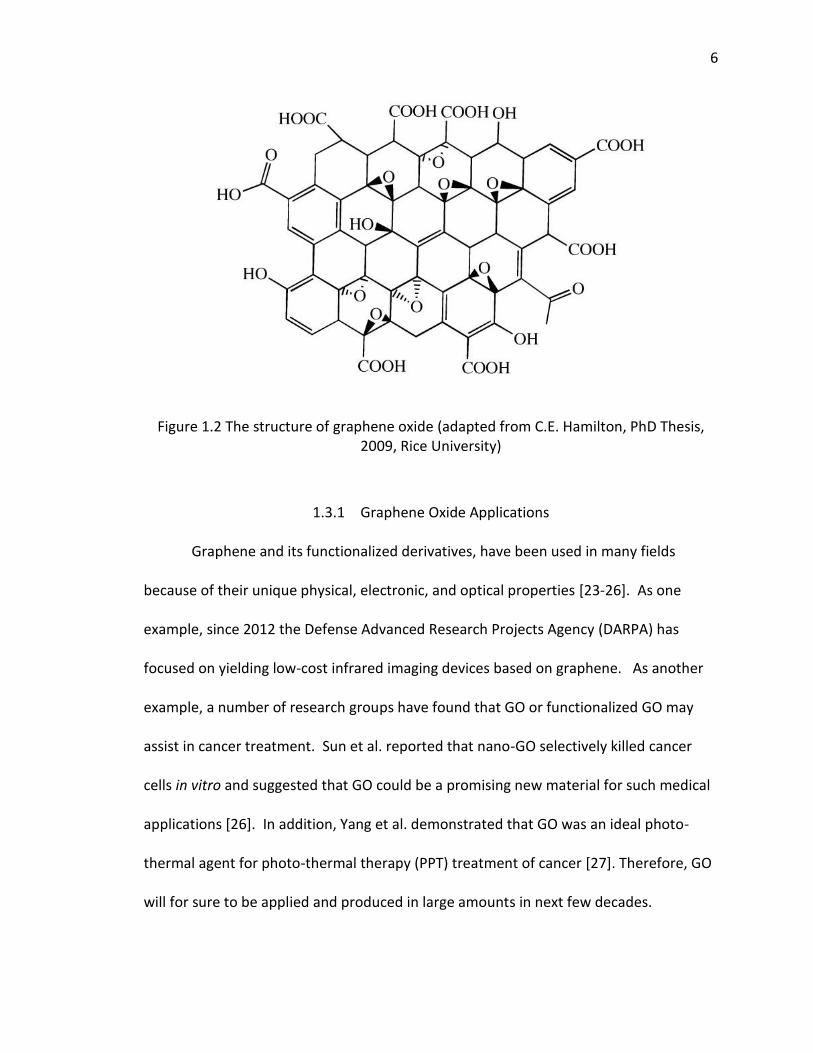
1.3 Graphene Oxide
Graphene oxide (GO) is a precursor material in graphene preparation and has a
large number of epoxy, hydroxyl, and carboxyl groups on its surface [21]. The structure
of graphene oxide is shown in Figure 1.2 (Figure 1.2 was adapted from C.E. Hamilton,
PhD Thesis, 2009, Rice University). The presence of these oxygenated functional groups
render GO extremely hydrophilic [22], making it an ideal material to use in aqueous
dispersions.
6
Figure 1.2 The structure of graphene oxide (adapted from C.E. Hamilton, PhD Thesis, 2009, Rice University)
1.3.1 Graphene Oxide Applications
Graphene and its functionalized derivatives, have been used in many fields
because of their unique physical, electronic, and optical properties [23-26]. As one
example, since 2012 the Defense Advanced Research Projects Agency (DARPA) has
focused on yielding low-cost infrared imaging devices based on graphene. As another
example, a number of research groups have found that GO or functionalized GO may
assist in cancer treatment. Sun et al. reported that nano-GO selectively killed cancer
cells in vitro and suggested that GO could be a promising new material for such medical
applications [26]. In addition, Yang et al. demonstrated that GO was an ideal photo-
thermal agent for photo-thermal therapy (PPT) treatment of cancer [27]. Therefore, GO
will for sure to be applied and produced in large amounts in next few decades.
7
1.3.2 Environmental Applications using Graphene Oxide-based Material
Graphene oxide has exceptional electron-transfer properties. Based on this fact,
GO has been considered as an ideal material to expand the light-response range of
other nanoparticles. For example, after reacting with BiOBr, GO changes the conduction
band and balance band of BiOBr to enhance its photocatalytic activity under visible light
irradiation [28]. Graphene oxide-TiO2 composites also have been intensively studied
and used for photo-degradation of pollutants, because GO can act as an electron shuttle
for TiO2 nanoparticles, improving the lifetime of the electron-hole pairs [29]. Moon et al.
found that TiO2-reduced GO has a high removal efficient for the photocatalytic oxidation
of As(III) [30].
1.3.3 Toxicity of Graphene Oxide
Akahaen et al. showed that hydrazine-reduced GO was more toxic to bacteria
than the parent GO, and suggested this is the result of the “sharper” nanowalls on the
reduced GO (RGO) [31]. For the cytotoxicity of GO to human cells, Liao et al. observed
that sonicated (smaller) GO exhibited higher hemolytic activity compared to larger GO
material. Viability assay experimental results revealed that both graphene and GO have
toxic effects to human skin fibroblasts [32]. Wang’s group reported that single-layer GO
had dose-dependent toxicity to human lung epithelial cells and fibroblasts and caused
obvious toxicity when doses were above 50 mg/L, suggesting the potential risk of GO to
human health [33]. Hu et al. found that GO could destroy cell membranes by direct
interactions between cell membranes and GO nanosheets [34]. In contrast, Chang’s
8
group used different sized GO and proposed that all the different sized materials
showed no toxicity to A549 cells, which are typical human lung cells [35]. The variability
among the results might be attributed to the various methods through which GO and
graphene can be made. However, there is no doubt that GO might cause some
toxicological effects to humans, motivating further study on the fate and effects of GO
in the natural environment.
1.3.4 Environmental Transformation of Graphene Oxide
Chemical transformation is a key factor affecting the characteristics of nano-
materials. Photo transformation is an important transformation process in the natural
environment. The π-bonds in GO absorb solar spectrum light, thus photochemical
transformation may be an important pathway in aqueous systems if light absorption is
followed by chemical reaction. Indeed, it is well known that photo-irradiation is a good
method for reducing GO [36, 37]. Matsumoto et al. used a 500 W Xenon lamp to study
the photoreaction of GO in water. Note Xenon lamps generally emit light below the
solar spectrum, down to about 280 nm. Matsumoto et al. observed that irradiation of
GO aqueous dispersions resulted in production of reduced GO (RGO), CO2 and H2 [38].
In addition, more defects were produced. These defects (i.e., non-aromatic carbon)
provided “sites” for either H2 or CO2 formation. Hou et al. recently reported that
intermediate photoproducts are of smaller size with fewer oxygen functionalities, which
obviously then would have different photo-reactivity compared to the unreacted GO
[39] (mechanism can be summarized as eq 1.2).
9
GO hϑ→ CO2 + rGO species + low MW PAH species (O2 dependent process) eq 1.2
Here, rGO: reduced graphene oxide; MW: molecular weight;
PAH: Polycyclic aromatic hydrocarbons)
Chowdhury et al. showed that direct photo-irradiation had an effect on GO aggregation
under both oxic and anoxic conditions; however, they noted negligible effects occurred
with respect to the overall surface of the material [40].
Chowdhury et al. also showed that pH, ion composition (including counter-ion valence),
and NOM concentration played significant roles in the overall stability of reduced
graphene oxide [41]. Under sunlight, nitrate and NOM in the natural aqueous
environment are known to generate hydroxyl radicals, which could further react with
graphene materials.
1.3.5 High Electron Transfer Ability of Graphene Oxide
Due to its high electron transfer ability, GO has been used in a variety of electrochemical
applications [42, 43]. Previous studies indicate that GO could enhance the
electrochemical reactivity of biomolecules, and has a remarkable electron transfer rate
compared to many other materials [44]. Based on its open surface and extensive length
of edges compared to other carbon-based nanomaterials (i.e., carbon nanotubes), GO
might be able to provide more active sites for electron transfer to biological chemical
10
species, promoting the reactivity of GO toward oxidation and or reduction of small
biomolecules such as NADH [45].
1.4 Chapter Outline
The goal of this dissertation is to investigate environmental reactions of two types
of carbon nano-materials, C60 and graphene oxide, under relevant environmental
conditions. With this goal in mind, studies were conducted to further elucidate whether
photo mineralization of aqu/nC60 clusters occurrs, to determine whether reactive
oxygen species are generated on the surface of GO under simulated sunlight, to explore
mechanisms of light-independent reactions of GO in water, and to determine how GO
behaves in the presence of hydroxyl radicals that are photochemically generated under
environmentally simulated light conditions.
In Chapter 2, the photochemical transformation of single-layered GO under lamps
that only emit light in the solar spectrum (λ =350 ± 50 nm) was investigated. Reduced
graphene oxide (RGO) was produced, evidenced by Raman Spectra measurements.
Color of GO suspension transitioned from pale to dark brown during the photoreaction
process, consistent with changes in measured light absorbance (i.e., attenuation)
spectra. Additionally, reactive oxygen species (ROS) including superoxide radical anion
(O2·−) and hydrogen peroxide (H2O2) were produced under oxic conditions.
Understanding the photochemical reactivity of GO in aqueous solutions will provide
information on evaluating the environmental impacts and cytotoxicity of this
nanomaterial.
11
In Chapter 3, mechanisms of light-independent reactions of graphene oxide with
β-nicotinamide adenine dinucleotide (NADH) in water is introduced. Reactive oxygen
species (ROS) were produced by electron transfer from the electron donor (NADH) to
GO, which shuttled these electrons to O2 in water. The addition of GO was found to
oxidize NADH to NAD+, evidenced by the decreased intensity of the 340 nm absorption
band of NADH and the increased intensity of the 260 nm absorption band of NAD+.
Tetrazolium salts (NBT2+ and XTT) were used as scavengers to indicate the production of
superoxide anion radicals. H2O2 was produced in the process. In the experimental
systems containing GO, NADH and O2, pBR322 DNA plasmid was cleaved, in spite of
finding no other evidence of ·OH formation. Similar processes involving GO in biological
cells may be the mechanism through which GO causes oxidative stress and cytotoxicity.
In Chapter 4, the indirect photochemical oxidation of GO was followed by
generating hydroxyl radical from hydrogen peroxide (H2O2) under solar wavelength
light. Light attenuation spectra in the UV and visible regions and visible color changes
suggested decomposition was occurring in the process. Total organic carbon (TOC) was
also found to decrease, which suggested mineralization of GO. This study indicates that
photochemical transformation is likely a significant fate pathway for
GO in the aquatic environment.
In Chapter 5, photo-mineralization of aqu/nC60 clusters is examined under
simulated sunlight. The volume of CO2 in the headspace increased for irradiation
samples, while the dark control samples showed no such increase. Photoproducts were
characterized also by using UV-Vis spectroscopy and HPLC.
12
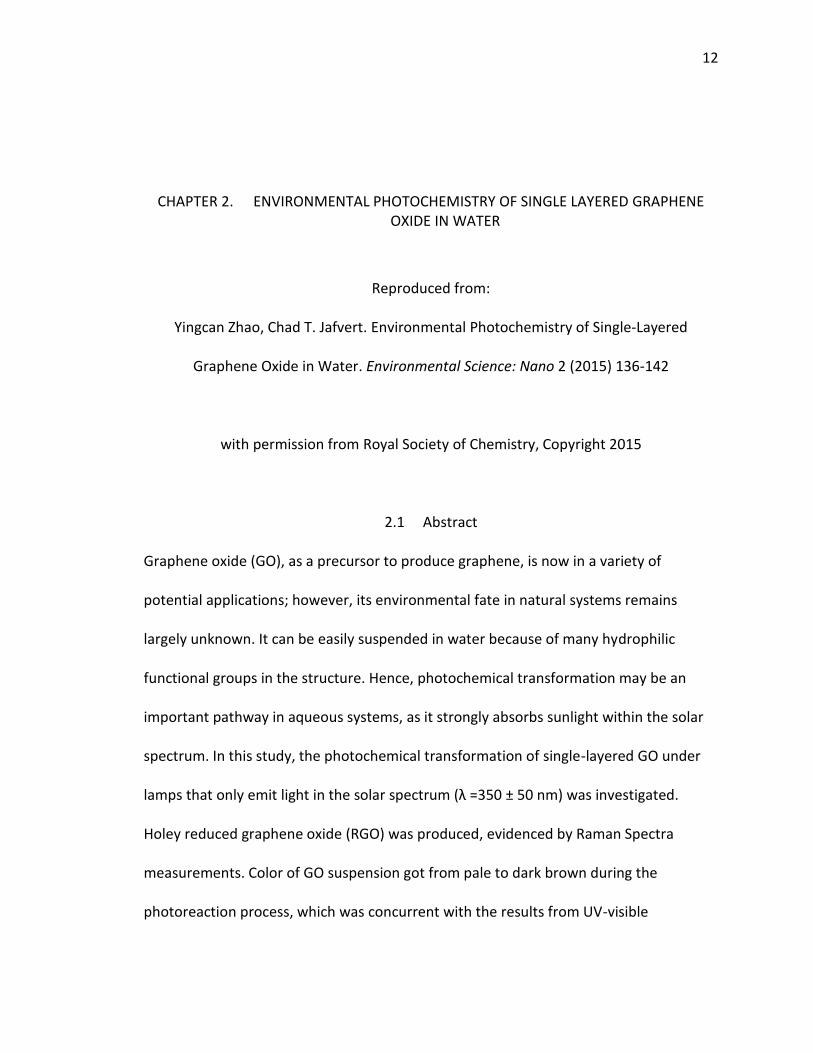
CHAPTER 2. ENVIRONMENTAL PHOTOCHEMISTRY OF SINGLE LAYERED GRAPHENE OXIDE IN WATER
Reproduced from:
Yingcan Zhao, Chad T. Jafvert. Environmental Photochemistry of Single-Layered
Graphene Oxide in Water. Environmental Science: Nano 2 (2015) 136-142
with permission from Royal Society of Chemistry, Copyright 2015
2.1 Abstract
Graphene oxide (GO), as a precursor to produce graphene, is now in a variety of
potential applications; however, its environmental fate in natural systems remains
largely unknown. It can be easily suspended in water because of many hydrophilic
functional groups in the structure. Hence, photochemical transformation may be an
important pathway in aqueous systems, as it strongly absorbs sunlight within the solar
spectrum. In this study, the photochemical transformation of single-layered GO under
lamps that only emit light in the solar spectrum (λ =350 ± 50 nm) was investigated.
Holey reduced graphene oxide (RGO) was produced, evidenced by Raman Spectra
measurements. Color of GO suspension got from pale to dark brown during the
photoreaction process, which was concurrent with the results from UV-visible
13
absorption spectra. Additionally, reactive oxygen species (ROS) including superoxide
radical anion (O2·−) and hydrogen peroxide (H2O2) were produced under oxic conditions.
Understanding the photochemical reactivity of GO in aqueous solution will provide
information on evaluating environmental impact and cytotoxicity of this nanomaterial.
Keywords: graphene oxide, reactive oxygen species, photochemistry, ROS,
environmental fate.
2.2 Introduction
Many efforts are underway to discovery new ways to use graphene materials and
their derivative in electronic devices, for drug delivery, in biosensors, in solar energy
conversion, as catalysts, and in many other types of applications [23-26, 46-48]. Due to
the variety of industrial sectors in which manufactured graphene materials may find
application and due to expected future production rates, release and exposure to
graphene-based materials in natural and built environments may be anticipated, raising
concerns over their potential negative effects on human and ecosystem health if
precautions are not taken to control exposure. Unfortunately, knowledge regarding the
fate, transport, and toxicity of graphene and its derivatives, currently is limited,
especially with respect to aquatic environments. Graphene oxide (GO) is a precursor
material in the preparation of graphene, and despite its name, it has on its surface
several different types of functional groups, including epoxy, hydroxyl, and carboxyl
groups [21]. The presence of these functional groups on GO makes it hydrophilic and
easy to disperse in water [22].
14
Because it is easy to disperse in water, its toxicity to human cells has been
studied both as a potential aquatic pollutant, and as a potential material to selectively
kill cancer cells [26, 27]. For example, Liao et al. observed that sonicated (smaller) GO
exhibited greater hemolytic activity to human cells compared to larger GO materials.
Viability assay experiments revealed that both graphene and GO have toxic effects to
human skin fibroblasts [32]. Another research group reported that single-layer GO had
dose-dependent toxicity to human lung epithelial cells and fibroblasts and caused
obvious toxicity when doses were above 50 mg/L, indicating risk to human health [33].
Hu et al. found that GO could destroy cell membranes by direct interactions occurring
between cell membranes and GO nanosheets [34]. In contrast, another research group
used different sized GO and found that all the different sized materials showed no
toxicity to A549 cells, which are typical human lung cells [35]. The variability among the
results might be attributed to the various methods by which GO and graphene were
produced or suspended in water. However, there is little doubt that GO might cause
some toxicological effects to humans, motivating further study on the fate and effects of
GO in the natural environment. Environmental effects may include toxicity to micro-
organisms and other organisms up the food chain. Indeed, Akahaen et al. showed that
hydrazine-reduced GO was more toxic to bacteria than the parent GO, and suggested
this resulted from “sharper” nanowalls on the reduced GO (RGO) [31].
Because the disrupted π-bond structure in GO absorbs significant light within the
solar spectrum, environmental fate processes acting on GO are expected to include
photochemical processes. Indeed, it is well known that photo-irradiation is a good
15
method for “reducing” GO, at least with lamp light that occurs in UV regions that may or
may not occur solely within the solar spectrum. For example, in a study reporting on
photo-reduction of GO conducted by Matsumoto et al. [38], experiments were
performed used a Xenon lamp of unknown spectral output, although this type of lamp
generally emits light down to 280 nm, approximately 20 nm below the spectral limit of
solar light measured at earth’s surface. Matsumoto et al., however did measure CO2
and H2 generation from aqueous GO suspensions and noted a drastic decrease in H2
production if the Xenon lamp light was filtered through a 390 nm cutoff filter. While not
reported, it seems likely that a similar decrease in CO2 production would occur under a
390 nm cutoff filter. It is somewhat interesting that while the overall reaction can be
termed photo-reduction of GO, it is not clear if any of the remaining carbon on the GO
has actually been reduced, as simple loss of CO2 from carboxyl groups on GO is the
result of a rearrangement reaction, where the carbon-carboxylic acid bond is broken
and replaced with a carbon-hydrogen bond. Hence, although the average oxidation
state of the carbon in the GO is lower, it may result from loss of carbon that was already
highly oxidized, as previously reported to occur during photolysis of carboxylated multi-
walled carbon nanotubes [49], and not from any oxidation of specific carbon atoms in
the GO. Similar to information in the literature regarding photochemical carbonaceous
products, there is a general lack of information on the generation of reactive oxygen
species (ROS) by GO under solar light. Hou et al. irradiated an aqueous dispersion of
single layer GO with light not strictly within the solar spectrum (at energies in the range
3.94-4.43 eV; i.e., at λ = 280-315 nm), and similar to Matsumoto et al. [38], noted that
16
the GO became visibly darker over the irradiation period, but suggested through XPS
analysis that this occurred due to loss of hydroxyl groups through hemolytic removal of
·OH groups and formation of more conjugated π-bonds, rather than through
decarboxylation alone. Further, through electron paramagnetic resonance spectroscopy,
dose-dependent exponential growth in radical production on the GO surface was shown
to occur, presumably after loss of ·OH; however, it was reported that ·OH were not
observed, and a methodology of ·OH detection was not reported.
For other carbon-based nanomaterials, several reactive oxygen species have been
shown to be generated under sunlight conditions (λ > 300 nm). For example, singlet
oxygen (1O2) was generated in aqueous suspensions of C60 clusters (i.e., nano-
precipitates), oxidizing the C60 to more polar water soluble products [14-16]. Aqueous
dispersions of carboxylated and PEGylated single walled carbon nanotubes (SWCNTs)
produced significant ROS, including singlet oxygen (1O2), superoxide anion (O2·−), and
hydroxyl radial (·OH) [50, 51]. As a result, in this study the ability of aqueous dispersion
of single-layered GO to generate reactive oxygen species (ROS), including O2·− and H2O2
upon exposure to light within solar spectrum (λ =300-410 nm) was investigated. Based
on experimental results of this study and the previous work cited above, a mechanism
for ROS generation by photosensitized GO in water is proposed. Information of ROS
generation during solar irradiation is significant not only to evaluate ecological risks
associated with GO, but also to better understand the transformation pathways of
carbon within GO.
17
2.3 Materials and Methods
2.3.1 Materials
An aqueous dispersion of single layer graphene oxide (GO), synthesized by a
modified Hummer’s method, was purchased from Advanced Chemical Supplier (ACS)
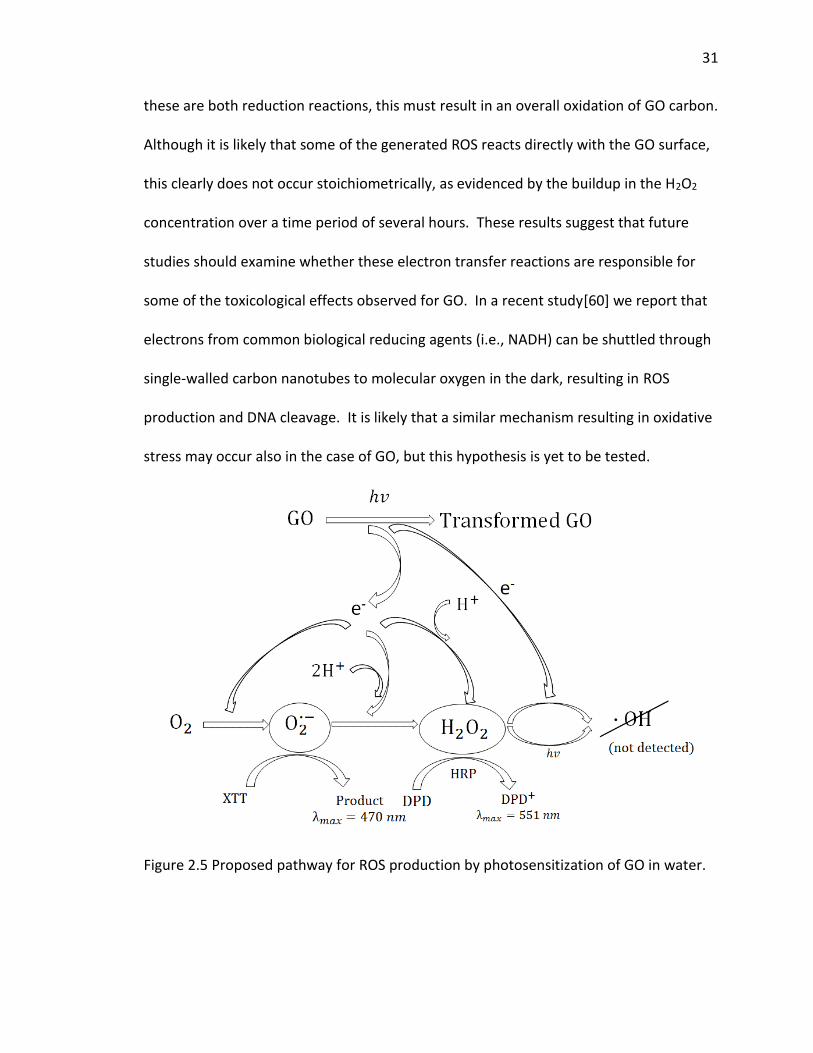
Material, LLC (Medford, MA) and used as received. According to the manufacturer, the
material is approximately 80% single-layer GO (with the remainder being multi-layered)
and in the size range of 0.5 to 2.0 µm, with a thickness of 0.6 to 1.2 nm. More
information on the GO material is provided in the Supporting Information (SI). Furfuryl
alcohol (FFA), 2,3-bis(2-methoxy-4-nitro-5-sulfophenyl)-2H-tetrazolium-5-carboxanilide
(XTT), p-chlorobenzoic acid (pCBA), N,N-diethyl-p-phenylenediamine hemioxalate (DPD),
horseradish peroxidase (HRP), and superoxide dismutase (SOD) were purchased from
Sigma-Aldrich (St. Louis, MO). All other chemicals were with the highest purity and used
as received. All aqueous samples were prepared with water purified with a Barnstead
Nanopure system (Dubuque, IA) after R/O pretreatment.
2.3.2 Preparation of Aqueous Graphene Oxide
The stock GO dispersion (10 mg/mL) was diluted with water (1:100), and
sonicated under low energy (8890R-MT ultrasonic bath from Cole-Parmer, Vernon Hills,
IL) for 2 hours to make a uniform dispersion of 100 mg/L GO. When not in use, the GO
suspensions were stored in the dark at room temperature. In most experiments,
samples were buffered to pH 7 with final phosphate buffer concentrations of 5 mM.
Buffers were prepared with phosphate salts (i.e., KH2PO4 and K2HPO4).
18
2.3.3 Irradiation and GO Analysis
For all irradiation experiments, samples were placed in a series of borosilicate
glass tubes sealed with PTFE-lined caps and exposed to sixteen 24 W black-light
phosphor lamps (RPR-3500Å lamps from Southern New England Ultraviolet, Branford,
CT) that emit light from 300 to 410 nm, with the maximum intensity occurring near 350
nm. A figure regarding to spectral density of irradiance as a function of wavelength was
provided (SI Figure 2.7), thus comparing the solar sunlight with our employed lamp light
source. All samples were irradiated in a Rayonet merry-go-round photochemical reactor
that rotated the samples at 5 rpm to ensure uniform light exposure of all samples over
the irradiation period. Dark control samples were prepared at the same time as
irradiated samples and were wrapped with aluminum foil and kept in a dark
environment over the same time period. All experiments were performed in duplicate
or triplicate. At specific times during the irradiation period, irradiated samples and dark
control samples were recovered for analysis. The UV-visible light absorbance spectra
were recorded with a Varian Cary 50 UV/Vis Spectrophotometer using quartz cuvettes
with 1 cm path lengths. The Raman spectra of samples were monitored by using an
excitation wavelength of 633 nm, and scanning from 1000 -3000 cm-1 to obtain
information on the characteristic D, G and 2D band intensities of GO. For all Raman
spectra measurements, irradiated and dark control samples were prepared and
analyzed in the absence of the phosphate buffers.
19
2.3.4 ROS Measurement
Reactive oxygen species (ROS) were detected by using specific chemical probes
that selectively react with each ROS at near diffusion-limited rates. Only one probe was
used at a time, as those for singlet oxygen (1O2 ) superoxide anion (O2·−), and hydroxyl
radical (·OH) require that they be added before the irradiation period, as the measured
response is due to accumulative ROS production; whereas analysis of hydrogen peroxide
(H2O2) was performed on samples by adding the necessary reagents after irradiation.
1O2 was monitored by the loss of FFA [52]. FFA was chosen to detect whether 1O2 was
produced. The FFA concentration at specific irradiation time was determined by
separation using HPLC (Varian 9012 gradient pump, 9050 UV/Vis detector and Prostar
autosampler) on a C18 column with the detection wavelength set at 219 nm. The mobile
phase was consisted of 50% methanol and 50% water at a flow rate of 1 mL/min. The
run time was 6 min and the injection volume was 100 μL. Previously, we used a nitro
blue tetrazolium salt (referred to as NBT2+) as a scavenger for O2·−, produced upon solar
light irradiation of functionalized carbon nanotubes (CNTs) [50]. However, in the
presence of NBT2+, GO was found to flocculate and settle; hence experiments using XTT
as a scavenging probe for O2·− were attempted with success. The reaction between XTT
and O2·− leads to a soluble product that was detected spectrophotometrically at 470 nm
after filtering samples through a 0.2 μm membrane filters to remove the GO which also
absorbances significant light at 470 nm. To confirm that transformation of XTT was
through reaction with O2·−, in some GO + XTT samples, superoxide dismutase (SOD) was
added, as it significantly decreases the steady-state concentration of O2·− by
20
enzymatically catalyzing its disproportionation to hydrogen peroxide (H2O2), confirming
any transformation of XTT was due to O2·−. p-Chlorobenzoic acid (pCBA) was added to
some samples to determine if ·OH was generated during irradiation.[50] pCBA reacts
rapidly ·OH resulting in loss of pCBA from the system. To detect the highly reactive
hydroxyl radical, pCBA was used as a scavenger. The concentration of pCBA was
determined by HPLC analysis using a C18 column and a UV detector set at 234 nm. The
mobile phase was 70% methanol and 30% water, with the water containing 20 mM
H3PO4, at a flow rate of 0.8 mL/min. The run time was 10 min and the injection volume
was 100 μL. All samples were filtered through 0.2-μm filter membranes before HPLC
analysis. H2O2 temporal concentrations were measured by horseradish peroxidase (HRP)
catalyzed oxidation of DPD, with the HRP and DPD added to samples after irradiation or
incubation in the dark.[53] Before analyzing samples for H2O2, irradiated and dark
control samples were filtered through 0.2-μm membrane filters to remove the GO,
which otherwise would interfere with DPD spectrophotometric detection. After
filtration, 1 mL of each sample was added to 1 mL phosphate buffer (pH=6), followed
sequentially followed by additions of 50 μL 30 mM DPD solution and 50 μL 30 U/mL
HRP. H2O2 concentrations were determined by comparing sample absorbances at 551
nm to that of know standards (i.e., from a standard curve).
2.4 Results and Discussion
Upon irradiation of an aqueous dispersion of single layer GO with light in the solar
spectrum, the GO dispersion become visibly darker as shown in Figure 2.1a. This is
consistent to previous observations noted in the introduction section that reported on
21
exposure of GO to shorter wavelength UV light [38, 54]. Similarly, light attenuation
(Figure 2.1b) of the GO suspension increased across the whole spectrum from 220 to
820 nm. Note that although the figure reports “absorbance”, the response is due to
both light absorbance and scatter because the samples are nanoparticle suspensions
that not only absorb light within this wavelength range, but also scatter the light, with
presumably much of the light attenuation at the higher wavelengths occurring due to
light scattering. The GO spectra before irradiation does exhibit two characteristic peaks:
A maximum at approximately 230 nm, which corresponds to π → π* transitions of the
aromatic C–C bonds, and a shoulder at 303 nm, which is due to n → π* transitions of C
O bonds [55]. Over the course of a 2 hr irradiation period, the absorption peak at
230 nm was gradually red-shifted to approximate 255 nm and the shoulder at 303 nm
disappeared, potentially indicating that some of the electronic conjugation within the
graphene sheets was restored as previously suggest upon reduction of GO with light at
shorter wavelengths [54, 56].
22
Figure 2.1 (a) Photograph of 5 mg/L GO at pH 7, before (left vial) and after (right vial) irradiation for 2 hours under lamp light irradiation; and (b) the change in the UV-visible
light absorption spectra of GO suspensions with increasing time of irradiation.
23
Raman spectroscopy is often used to probe differences in the electronic properties
of carbon nanomaterials [57]. Figure 2.2 shows the Raman spectral changes in GO as a
function of irradiation time. The spectra shows the D, G, and 2D bands, which are three
characteristic peaks of GO. The G band occurs at 1580 cm-1 and results from the
vibration of sp2-bonded carbon, and is an indication of the relative extent of aromaticity.
The D band at 1350 cm-1 is assigned to the vibration of sp3 carbon atoms (i.e.,
nonaromatic carbon). The relative intensities, or ratio of the D to G band intensities
(ID/IG) is often used as a qualitative measure for the degree of disorder caused by
nonaromatic sp3 carbon defects, that often occur at edges or as ripples or holes within
the GO structure [58]. Figure 2.2 shows that after 24 hrs of irradiation, the ID/IG ratio
increased from 0.451 (0 hr) to 0.678 (24 hr). This increase suggests an increase in the
number of defects (e.g., functionalized carbon) on the already functionalized graphene
oxide sheets. These defects may be sites for ROS production, which is discussed
subsequently.
24
Figure 2.2 The Raman spectra of GO before and after irradiating an aqueous GO suspension (100 mg/L) for 24 hours, where the spectra have been normalized to the
intensity of the G band.
By monitoring ROS production with the selective and highly reactive chemical
probes, formation of O2·−, but not 1O2 or ·OH, was detected. Irradiated samples
containing furfuryl alcohol as a scavenging probe for 1O2, showed no decay in furfuryl
alcohol after 24 hrs of irradiation (SI Figure 2.8). However, in GO suspensions
containing XTT, a significance increase in light absorbance at 470 nm occurred over time
upon irradiation and after filtering out the GO after irradiation. This increase in
absorbance occurs where the reaction product between XTT and O2·− as an absorbance
maximum [50] (Figure 2.3). Figure 2.3a also indicates that the addition of SOD almost
completely inhibited XTT reduction, further suggesting that XTT product formation was
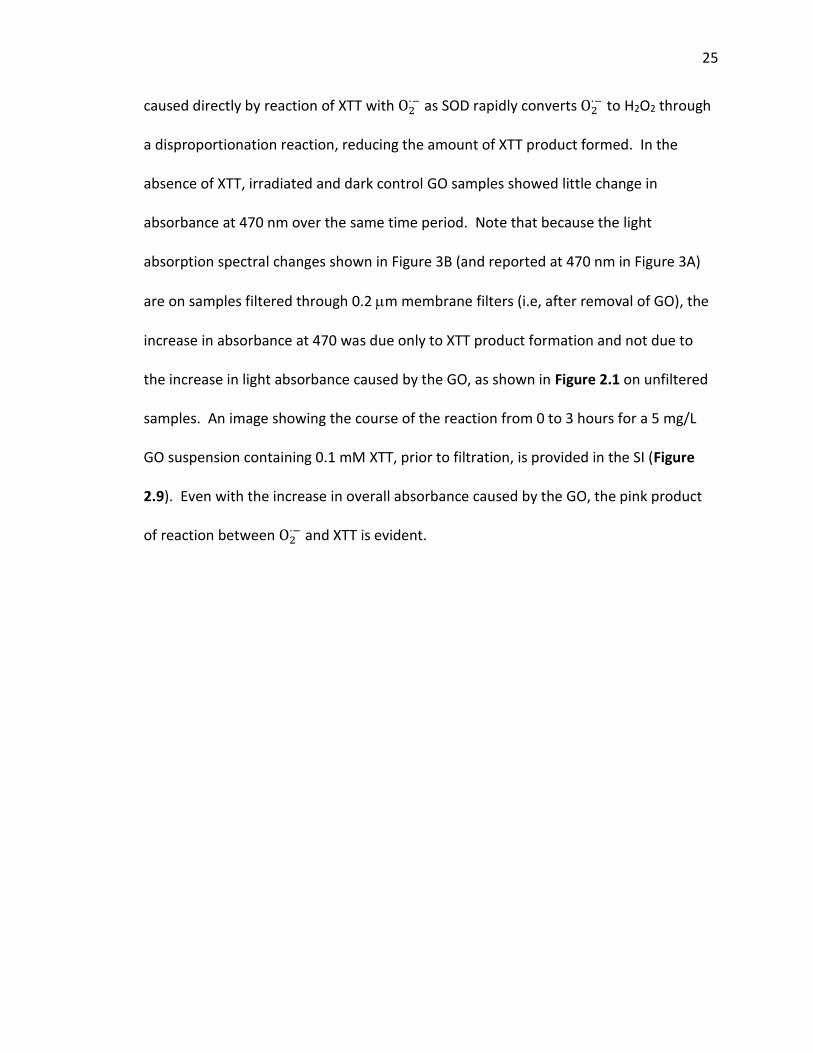
25
caused directly by reaction of XTT with O2·− as SOD rapidly converts O2
·− to H2O2 through
a disproportionation reaction, reducing the amount of XTT product formed. In the
absence of XTT, irradiated and dark control GO samples showed little change in
absorbance at 470 nm over the same time period. Note that because the light
absorption spectral changes shown in Figure 3B (and reported at 470 nm in Figure 3A)
are on samples filtered through 0.2 m membrane filters (i.e, after removal of GO), the
increase in absorbance at 470 was due only to XTT product formation and not due to
the increase in light absorbance caused by the GO, as shown in Figure 2.1 on unfiltered
samples. An image showing the course of the reaction from 0 to 3 hours for a 5 mg/L
GO suspension containing 0.1 mM XTT, prior to filtration, is provided in the SI (Figure
2.9). Even with the increase in overall absorbance caused by the GO, the pink product
of reaction between O2·− and XTT is evident.
26
Figure 2.3 (a) Evidence of superoxide anion formation by reaction with XTT at 470 nm, upon lamp light irradiation of a 5 mg/L GO suspension at pH 7. (b) The change in the UV-visible light absorption spectra for a suspension of GO (5 mg/L) and XTT (0.1 mM).
Note: The symbols represent samples containing XTT (0.1 mM) alone (); GO (5 mg/L) alone (); GO (5 mg/L) and XTT (0.1 mM) (); GO (5 mg/L), XTT (0.1 mM) and SOD (40 U/mL) (); and the corresponding dark control samples of GO (5 mg/L) and XTT (0.1 mM) ().
27
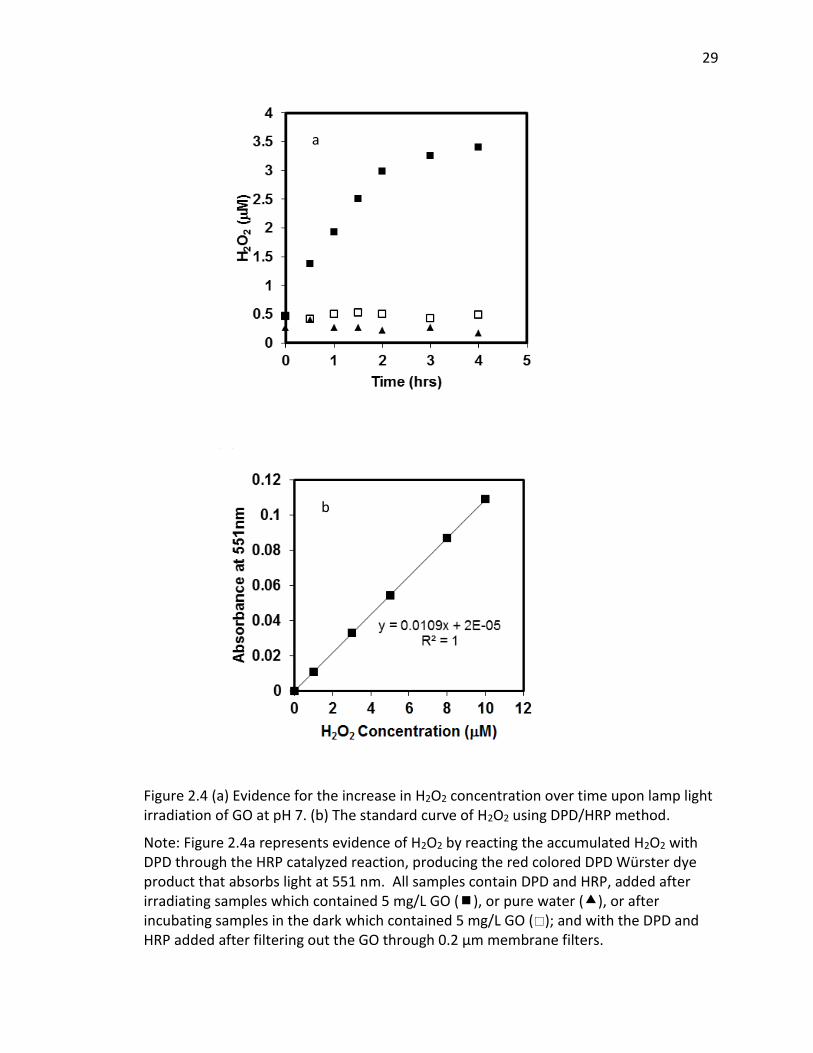
With significant O2·− formation, there is a high probability that hydrogen peroxide
will form also, and potentially accumulate in solution. As noted above, H2O2 can be
formed by the disproportionation of O2·− with enzymes such as SOD accelerating the rate
of the reaction considerably. As the disproportionation reaction suggests, conversion
can occur also through transfer of another electron to the protonated form of
superoxide anion, HO2 · (hydroperoxyl radical), which upon the electron transfer,
extracts a proton from solution to form H2O2. Whether it occurs by disproportionation
or another electron transfer process, both electrons must originate from the GO in the
absence of an additional electron donor. Hence, accumulation of H2O2 was measured
by using the DPD-horseradish peroxidase (HRP) assay, with the DPD/HRP added to the
aqueous samples after irradiating the GO dispersions, and then after removing the GO
by filtration. Although H2O2 is somewhat reactive in this system, it has a much longer
half-live that the other ROS, even under solar light irradiation. Figure 2.4a clearly shows
that the H2O2 concentration within the GO dispersion increases over an irradiation
period of 4 hrs, whereas no increase occurred in dark control samples or in the absence
of GO. The H2O2 concentrations shown on Figure 2.4a were calculated from sample
absorbance valued measured at 551 nm after filtration, using the H2O2 standard curve
shown on Figure 2.4b. Hence, the initial values at time zero of 0.2-0.5 M are due to
absorbance reading at or below 0.005, and likely due to trace contamination resulting in
a small positive interference. Despite this, the results indicate that H2O2 was indeed
produced and accumulated during irradiation of 5 mg/L GO with light in the solar

28
spectrum, accumulating to over 3 M after an irradiation period of 4 hrs. Assuming a
carbon content of 80% in the original GO, the 5 mg/L GO concentration translates to a
molar concentration of 3 mM carbon. Hence, over the 4 hr irradiation period,
approximately 1 molecule of H2O2 was produced for every 1,000 carbon atoms in the
GO.
29
Figure 2.4 (a) Evidence for the increase in H2O2 concentration over time upon lamp light irradiation of GO at pH 7. (b) The standard curve of H2O2 using DPD/HRP method.
Note: Figure 2.4a represents evidence of H2O2 by reacting the accumulated H2O2 with DPD through the HRP catalyzed reaction, producing the red colored DPD Würster dye product that absorbs light at 551 nm. All samples contain DPD and HRP, added after irradiating samples which contained 5 mg/L GO (), or pure water (), or after incubating samples in the dark which contained 5 mg/L GO (); and with the DPD and HRP added after filtering out the GO through 0.2 μm membrane filters.
a
b
30
Although it is known that sunlight can cleave the oxygen-oxygen bond in H2O2 to form
·OH, the reaction is slow [51, 59]. Alternatively, ·OH may be formed more rapidly if
transfer of an addition electron from GO to H2O2 occurs, as was found to be the case for
carboxylated single walled carbon nanotubes under solar irradiation.[51] In order to
determine whether there is hydroxyl radical produced by GO, pCBA was added to some
samples, as it rapidly scavenges ·OH resulting in loss of pCBA. However, no pCBA decay
was observed for both irradiated and dark control samples over the 4 hour time period
of the experiments (SI Figure 10), suggesting that negligible ·OH was produced, or that
·OH scavenging by the GO was rapid and significant, reducing its pseudo-steady-state
concentration. Although scavenging of ·OH by GO is likely to occur, as the initial
electron transfer that results in its formation would occur at the GO surface such that
the site of its generation would be in close proximity to GO π bonds at which it could be
consumed, it is also likely that not much is produced, otherwise the concentration of its
precursor, H2O2 would not accumulate to such a degree, and the chromophore content
of the GO would not because enhanced as irradiation proceeds.
2.5 Conclusion
In summary, when exposed to light within the solar spectrum, aqueous
dispersions of single layered GO do become darker, indicating an increase in
chromophore content, or at least an increasing absorptivity by the existing
chromophores within GO, yet Raman spectroscopy indicates an increase in nonaromatic
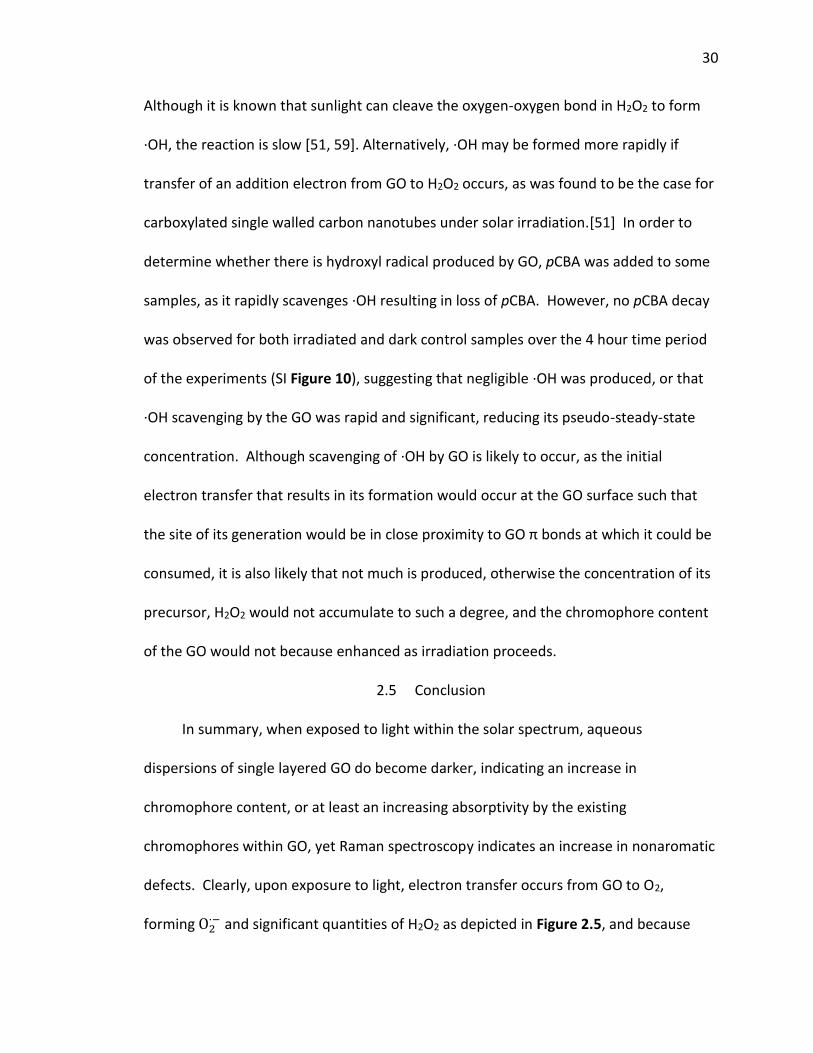
defects. Clearly, upon exposure to light, electron transfer occurs from GO to O2,
forming O2·− and significant quantities of H2O2 as depicted in Figure 2.5, and because
31
these are both reduction reactions, this must result in an overall oxidation of GO carbon.
Although it is likely that some of the generated ROS reacts directly with the GO surface,
this clearly does not occur stoichiometrically, as evidenced by the buildup in the H2O2
concentration over a time period of several hours. These results suggest that future
studies should examine whether these electron transfer reactions are responsible for
some of the toxicological effects observed for GO. In a recent study[60] we report that
electrons from common biological reducing agents (i.e., NADH) can be shuttled through
single-walled carbon nanotubes to molecular oxygen in the dark, resulting in ROS
production and DNA cleavage. It is likely that a similar mechanism resulting in oxidative
stress may occur also in the case of GO, but this hypothesis is yet to be tested.
Figure 2.5 Proposed pathway for ROS production by photosensitization of GO in water.
32
2.6 Supporting Information
Figure 2.6 Images of GO (Provided by ACS Material LLC.).
33
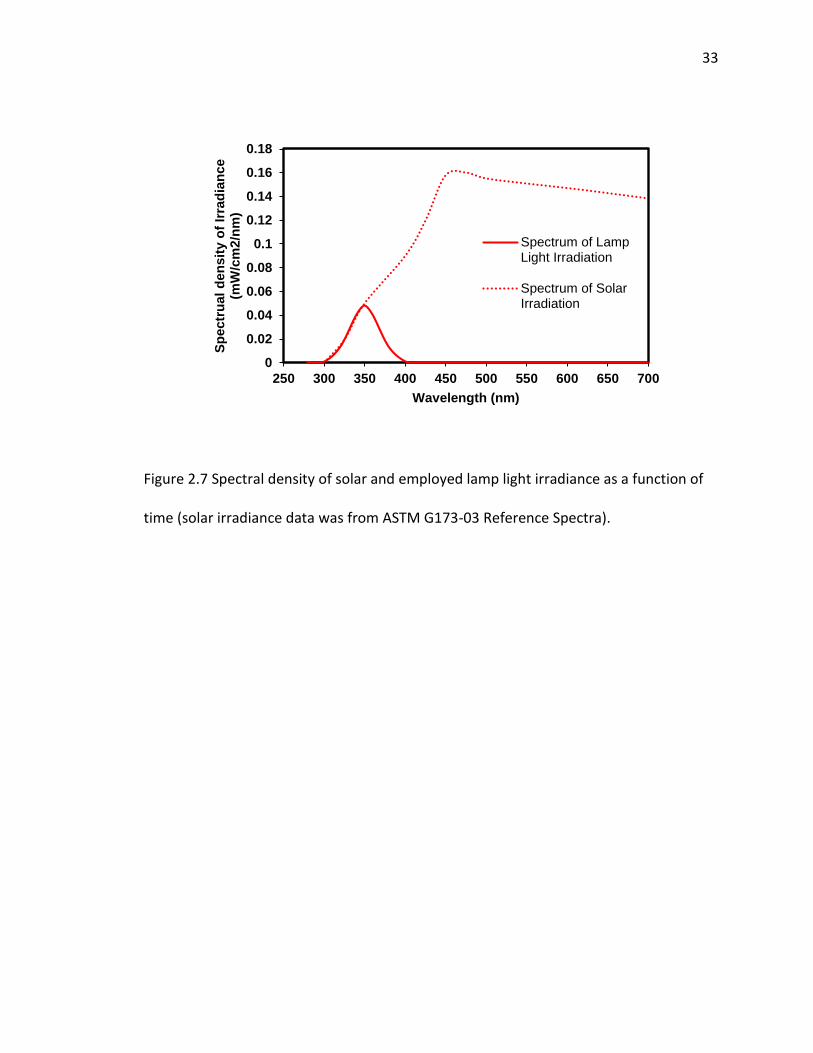
Figure 2.7 Spectral density of solar and employed lamp light irradiance as a function of
time (solar irradiance data was from ASTM G173-03 Reference Spectra).
0
0.02
0.04
0.06
0.08
0.1
0.12
0.14
0.16
0.18
250 300 350 400 450 500 550 600 650 700
Sp
ectr
ual
den
sit
y o
f Ir
rad
ian
ce
(mW
/cm
2/n
m)
Wavelength (nm)
Spectrum of LampLight Irradiation
Spectrum of SolarIrradiation
34
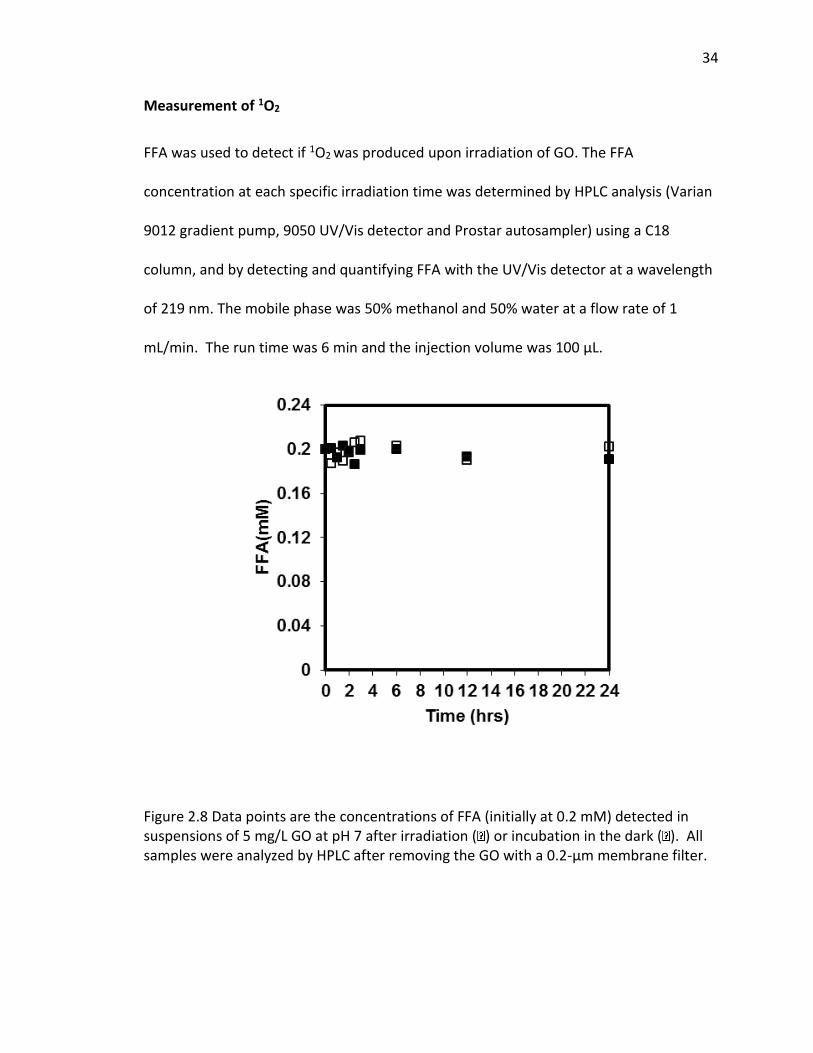
Measurement of 1O2
FFA was used to detect if 1O2 was produced upon irradiation of GO. The FFA
concentration at each specific irradiation time was determined by HPLC analysis (Varian
9012 gradient pump, 9050 UV/Vis detector and Prostar autosampler) using a C18
column, and by detecting and quantifying FFA with the UV/Vis detector at a wavelength
of 219 nm. The mobile phase was 50% methanol and 50% water at a flow rate of 1
mL/min. The run time was 6 min and the injection volume was 100 μL.
Figure 2.8 Data points are the concentrations of FFA (initially at 0.2 mM) detected in suspensions of 5 mg/L GO at pH 7 after irradiation ( ) or incubation in the dark ( ). All samples were analyzed by HPLC after removing the GO with a 0.2-μm membrane filter.
35
No FFA loss was observed as irradiation time increased, indicating negligible
production of singlet oxygen. There are two possible reasons for this observation: Either
little 1O2 was generated, or after production it may have been rapidly quenched by the
GO. Both explanations lead to no net production of 1O2.
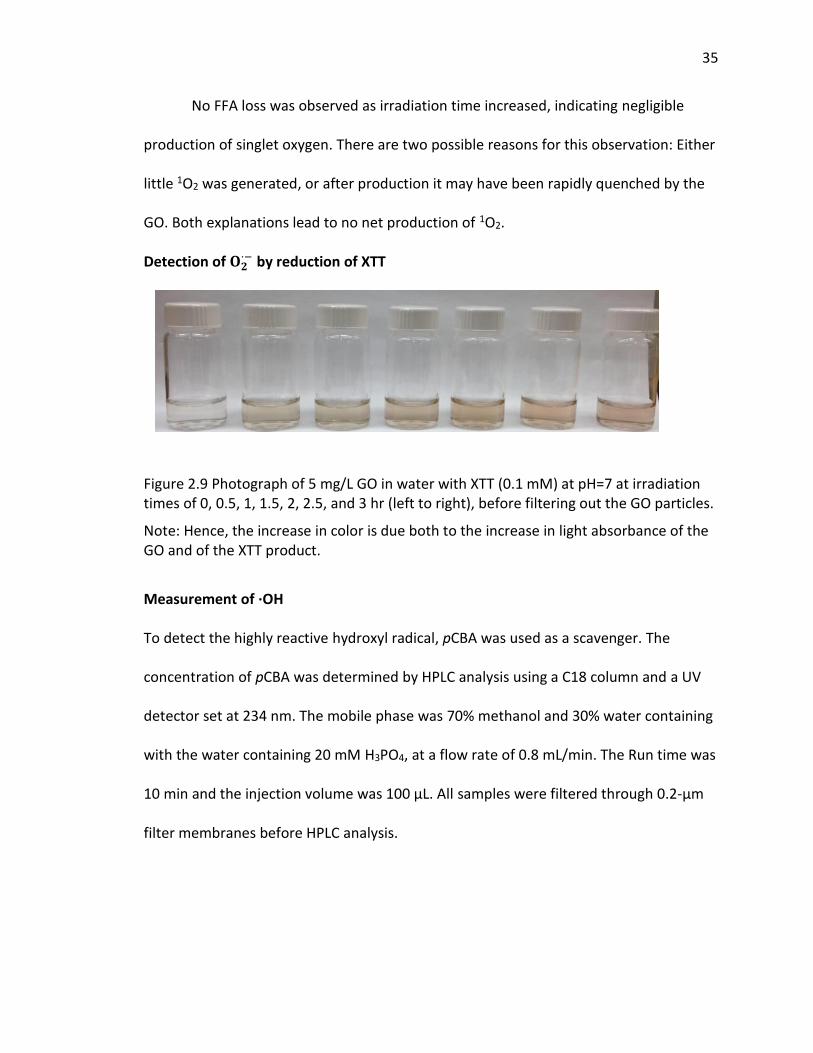
Detection of 𝐎𝟐·− by reduction of XTT
Figure 2.9 Photograph of 5 mg/L GO in water with XTT (0.1 mM) at pH=7 at irradiation times of 0, 0.5, 1, 1.5, 2, 2.5, and 3 hr (left to right), before filtering out the GO particles.
Note: Hence, the increase in color is due both to the increase in light absorbance of the GO and of the XTT product.
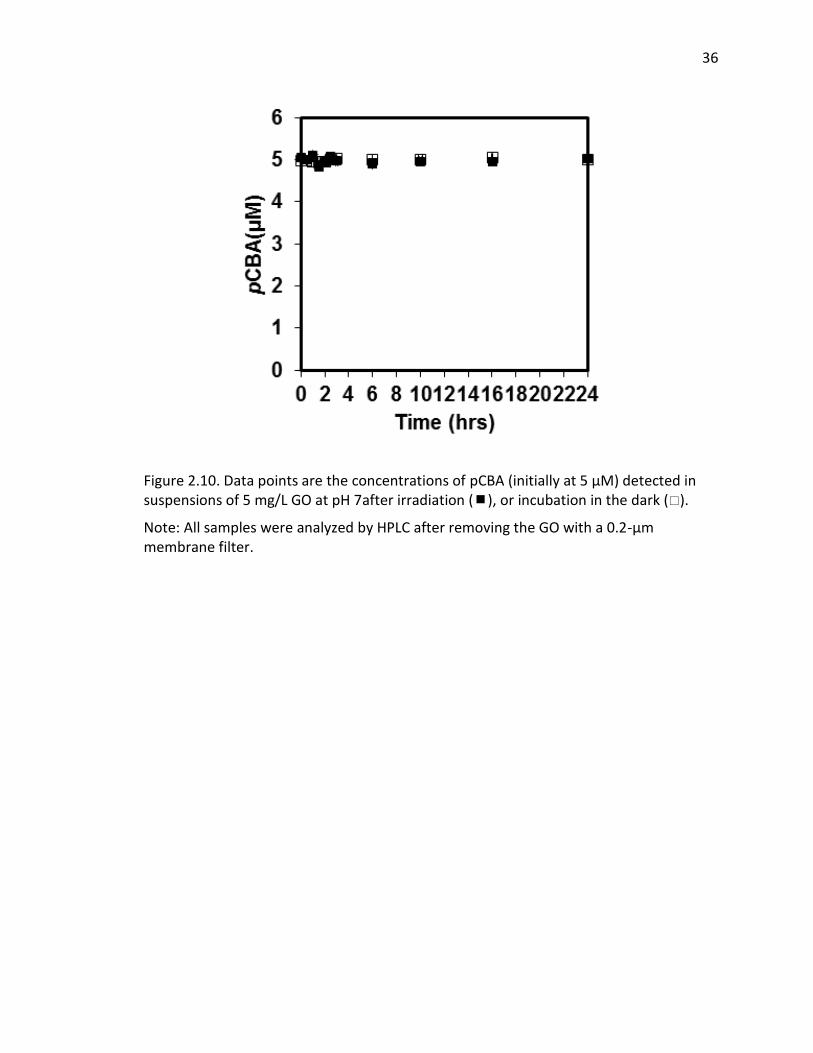
Measurement of ·OH
To detect the highly reactive hydroxyl radical, pCBA was used as a scavenger. The
concentration of pCBA was determined by HPLC analysis using a C18 column and a UV
detector set at 234 nm. The mobile phase was 70% methanol and 30% water containing
with the water containing 20 mM H3PO4, at a flow rate of 0.8 mL/min. The Run time was
10 min and the injection volume was 100 μL. All samples were filtered through 0.2-μm
filter membranes before HPLC analysis.
36
Figure 2.10. Data points are the concentrations of pCBA (initially at 5 μM) detected in suspensions of 5 mg/L GO at pH 7after irradiation (), or incubation in the dark ().
Note: All samples were analyzed by HPLC after removing the GO with a 0.2-μm membrane filter.
37
CHAPTER 3. LIGHT-INDEPENDENT REDOX REACTIONS OF GRAPHENE OXIDE IN WATER: ELECTRON TRANSFER FROM NADH TO MOLECULAR OXYGEN PRODUCING REACTIVE
OXYGENM SPECIES (ROS)
3.1 Abstract
There is growing interest in finding industrial and commercial uses for graphene oxide
(GO) because of this material’s unique properties. As with other micro-pollutants and
nanomaterials, increased production and use generally leads to increased
environmental exposure. However, very limited information exists on how GO is further
functionalized or mineralized in natural aquatic environments, or whether GO can
participate in reactions involving other natural or manmade chemicals. Because
generation of reactive oxygen species (ROS) by carbon-based nanomaterials previously
has been shown to occur, the hypothesis of this study was that ROS can be generated by
electron transfer from a common biological electron donor (NADH) to GO, which then
acts as an electron shuttle forming ROS from dissolved molecular oxygen (O2) in water.
Indeed, aqueous suspensions of 5 mg/L GO were found to oxidize 0.2 mM β-
nicotinamide adenine dinucleotide (NADH), evidenced by a decrease in absorbed light at
340 nm where NADH has an absorbance maxima, and by the increased absorbance at
260 nm where NAD+ has an absorbance maxima. Using tetrazolium salts (NBT2+ andXTT)
to scavenge superoxide anion radicals, production of O2∙− was shown to occur over a
38
period of about 30 hrs, and by using another colorimetric assay, H2O2 was shown to
accumulate. Hence, in the absence of light, GO can act as an electron shuttle, catalyzing
the oxidation of NADH (i.e., transfer of electrons to GO) and then pass these electrons
to molecular oxygen (O2), forming ROS in water. Although hydroxyl radicals (·OH) were
not detected, pBR322 DNA plasmid was cleaved in aqueous suspensions of GO
containing NADH and O2.
3.2 Introduction
Graphene has been intensely studied since it was first isolated in 2004 [61].
Graphene oxide (GO) is a graphene derivative, having a large number of oxygen atoms
covalently bound to its surface in the form of epoxy, hydroxyl, and carboxyl functional
groups. Because it is hydrophilic, GO is easy to disperse in water, and as a result of this
and other unique properties, GO has been studied for potential use in a number of
commercial applications, including as a drug delivery agent [62], in biosensor
development [23] and as a catalyst [63]. As a result, production rates and uses of GO
are expected to grow in the future. As with many other new materials and chemicals,
high production rates often lead to accidental or other unintended releases to the
environmental, yet little is known about the environmental fate and effects of GO in the
natural environment. To manage potential risks associated with this nanomaterial to
both humans and the environment, a much better understanding of the reactivity and
fate of GO in the environmental is needed.
39
The number of previous studies on environmental fate and health related effects of GO
are limited. In one study, GO was shown to exhibit dose-dependent toxicity by inducing
cell apoptosis and lung granuloma formation to human fibroblast cells and mice [64].
Dose-dependent hemolytic activity to GO also was shown by human red blood cells [32].
GO particle size has been inferred to be a major factor in hemolysis activity, as sonicated
(smaller) GO nanoparticles exhibited higher hemolytic activity than untreated (larger)
GO. Contrary to these studies, Chang et al. found that GO had no obvious toxicity to
A549 cells (a human lung carcinoma epithelial cell line), regardless of the size or dose of
GO [35]. Clearly, more information regarding the toxicity of GO is needed, with the
need for these new studies carefully documenting material characterization, including
the method of GO production, particle size, and level of oxidation.
Researchers generally agreed that production of reactive oxygen species (ROS)
upon exposure to carbon-based nanomaterials is a potential cause of toxicity. Indeed,
our recent studies revealed that carboxylated single-walled carbon nanotubes (C-CNT)
can shuttle electrons from common cellular reducing agents to molecular oxygen
produce ROS, including superoxide anion (O2∙−) and hydrogen peroxide (H2O2), and also
can result in DNA cleavage [60]. GO, similar to C-CNT, has a large proportion of defects
(i.e., partially oxidized carbon) which may somehow facilitate electron transfer. Zhang
et al. showed that electrochemically modified GO coated on a pre-anodized screen-
printed carbon electrode (SPCE) greatly enhanced electrocatalytic oxidation of NADH
compared to uncoated pre-anodized SPCEs. He proposed this as a way of quantifying
NADH in aqueous solution [65]. Under sunlight conditions, we have shown previously
40
that GO can act as an electron donor to form ROS from O2 [66], with these results
consistent to our other studies that have shown generation of ROS from functionalized
carbon nanotubes under solar light [50, 51]. However, whether ROS can be produced
through the reaction of molecular oxygen on the surface of GO in water without an
applied voltage or without photosensitization (i.e., in the dark, through chemical
reduction) has not been reported.
In this paper, we report on electron transfer from a well know biological
chemical reducing agent to GO, which in turn shuttles the electrons to molecular
oxygen, in the absence of light or an applied voltage. As in previous studies using C-
CNTs [60], β-nicotinamide adenine dinucleotide (NADH) was used as the reducing agent
because of its importance in living systems and because its oxidation to NAD+ is easy to
follow spectrophotometrically. A concentration of 0.2 mM NADH was employed in
experiments because it is similar in the concentration found in cells [51]. And finally,
because production of some reactive oxygen species was found to occur in these
systems, the ability of these ROS products to damage DNA was accessed in a simple
assay using pBR322, a double-stranded circular DNA plasmid containing 4,361 base
pairs.
3.3 Materials and Method
3.3.1 Materials
A water dispersion of graphene oxide, synthesized by a modified Hummer’s
method, was purchased from Advanced Chemical Supplier (ACS) Material, LLC (Medford,
41
MA) and used as received. According to the information provided by the manufacturer,
the single-layer ratio of GO was above 80%, the flake size was 0.5 to 2.0 µm, and the
thickness of the flakes was 0.6 to 1.2 nm. β-Nicotinamide adenine dinucleotide (NADH)
was obtained from EMD Chemical, Inc. (Gibbstown, NJ). Nitro blue tetrazolium salt
(NBT2+), 2,3-bis(2-methoxy-4-nitro-5-sulfophenyl)-2H-tetrazolium-5-carboxanilide (XTT),
N,N-diethyl-p-phenylenediamine hemioxalate (DPD), horseradish peroxidase (HRP),
superoxide dismutase (SOD), catalase, and p-chlorobenzoic acid (pCBA) were purchased
from Sigma-Aldrich (St. Louis, MO). A 0.5 µg/µL solution of pBR322 DNA plasmid (4361
base pairs) was obtained from Thermo Fisher Scientific Inc. (Waltham, MA). UltraPureTM
agarose and SYBR Safe DNA gel stain were purchased from Life Technologies
Corporation (now part of Thermo-Fisher). Gel loading dye (6x) was obtained from New
England Biolabs, Inc.
3.3.2 Oxidation of NADH
The ability of GO to oxidize NADH to NAD+ was determined by monitoring over time the
UV-visible light absorbance spectra of a suspension of GO containing NADH. Data were
recorded with a Varian Cary-300 UV-Vis spectrophotometer with a 1 cm path length
quartz cuvette at room temperature.
3.3.3 ROS Detection
Nitro blue tetrazolium salt (NBT2+) was employed as a scavenger for detecting
superoxide anion (O2∙−), as the reaction between NBT2+ and O2
∙− produces a fairly stable
42
reduced product that absorbs light at 530 nm [67]. NBT2+, NADH, and GO were mixed in
a 5 mM phosphate buffered solution at pH 7, and the light absorbance at 530 nm was
monitored over time. Buffers were prepared with phosphate salts (i.e., KH2PO4 and
K2HPO4). To examine the effect of GO on superoxide generation, experiments were
conducted at different concentrations of GO while holding all other chemical
concentrations (i.e., NADH or NBT2+) constant. XTT also was used to detect superoxide
anion [68]. To ensure that reduction of NBT2+ and XTT occurred through electron
transfer from O2∙−, superoxide dismutase (SOD) was added, as it very effectively
scavenges O2∙− from solution (i.e., competes for O2
∙−), stabilizing the concentration of
NBT2+ or XTT (i.e., the less effective scavenger), if their decay only occurs through
reaction with O2∙−. In the presence of superoxide dismutase, O2
∙− is converted rapidly
into hydrogen peroxide (H2O2) with a reactant-to-product stoichiometric mole ratio of
2:1. In the absence of the enzyme, this same disproportionation reaction proceeds
slowly; however, H2O2 may also be produced if additional electron transfer occurs from
GO to the protonated form of O2∙− (the hydroperoxyl radical, HO2
∙ ). To measure the
concentration of H2O2, we used the same DPD/HRP method as previously reported [60].
And finally, because further electron transfer to H2O2 can produce hydroxyl radical
(∙OH), pCBA was added in some experiments as it is a well-known hydroxyl radical
scavenger, whose decay can be used to determine the steady-state concentration of
∙OH. The methods for detecting all reactive oxygen species were the same as reported
before [50, 66]. Unless noted otherwise, all experiments were conducted at pH 7 with a
43
final phosphate buffer concentration of 5 mM, and all reported datum points are the
average of duplicate or triplicate samples.
3.3.4 Gel Electrophoresis
Whether the type and amount of ROS production under our experimental
conditions was sufficient to damage DNA was accessed using pBR322 DNA. In
experiments, mixtures were prepared containing some of the following components:
PBR322 DNA (0.015 µg/µL), GO (5 mg/L), phosphate buffer (5 mM), SOD (40 U/mL),
NADH (0.2 mM), methanol (0.5 M), ethanol (0.5 M) catalase (400 U/mL). The total
volume of each sample was held at 40 µL and incubated in the dark for 8 hr at room
temperature. After incubation, 8 μL 6x gel loading dye was mixed with each sample
prior to loading 10 μL onto an agarose gel. Gel electrophoresis was performed at 80 V
for 30 min in 1×Tris-borate-EDTA (TBE) solutions with a PowerPacTM Basic Power Supply
(Bio-Rad Laboratories Inc., CA). GelDocTM XR and Gel Imaging System with Image LabTM
Software (Bio-Rad Laboratories Inc., CA) were used for capturing images. Quantitative
analyses of gel images were performed.
3.4 Results and Discussion
Oxidation of NADH. NADH has two specific light absorption bands between 240 and 400
nm, with absorption maxima located at 260 nm and 340 nm. The maximum absorbance
at 340 nm is due to the n-π* transition of the dihydronicotinamide moiety which is
coplanar with the carboxamide moiety, resulting in electron orbital conjugation
between these two parts [69, 70], with this maxima being stronger for NADH than NAD+.
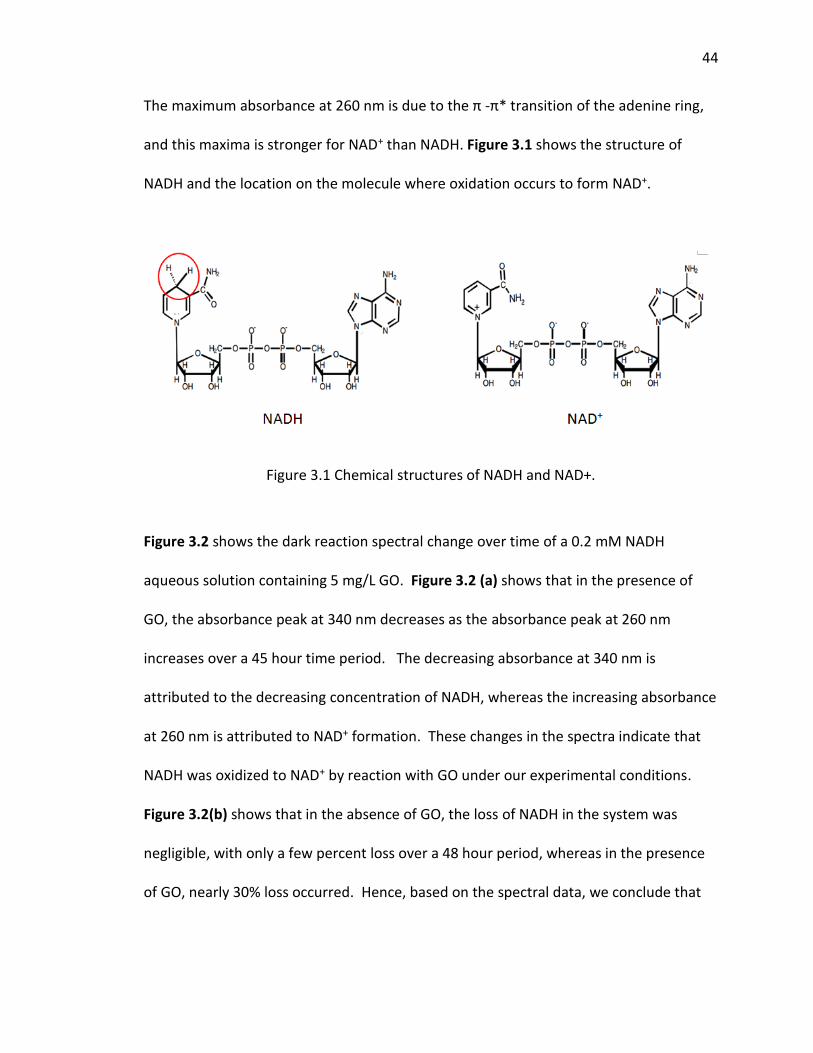
44
The maximum absorbance at 260 nm is due to the π -π* transition of the adenine ring,
and this maxima is stronger for NAD+ than NADH. Figure 3.1 shows the structure of
NADH and the location on the molecule where oxidation occurs to form NAD+.
Figure 3.1 Chemical structures of NADH and NAD+.
Figure 3.2 shows the dark reaction spectral change over time of a 0.2 mM NADH
aqueous solution containing 5 mg/L GO. Figure 3.2 (a) shows that in the presence of
GO, the absorbance peak at 340 nm decreases as the absorbance peak at 260 nm
increases over a 45 hour time period. The decreasing absorbance at 340 nm is
attributed to the decreasing concentration of NADH, whereas the increasing absorbance
at 260 nm is attributed to NAD+ formation. These changes in the spectra indicate that
NADH was oxidized to NAD+ by reaction with GO under our experimental conditions.
Figure 3.2(b) shows that in the absence of GO, the loss of NADH in the system was
negligible, with only a few percent loss over a 48 hour period, whereas in the presence
of GO, nearly 30% loss occurred. Hence, based on the spectral data, we conclude that

45
GO was reduced chemically through an overall two-electron transfer reaction involving
each NADH molecule,
x
2(NADH + H+) + GO →
x
2(NAD+ + 2H+) + GOx− eq 3.1
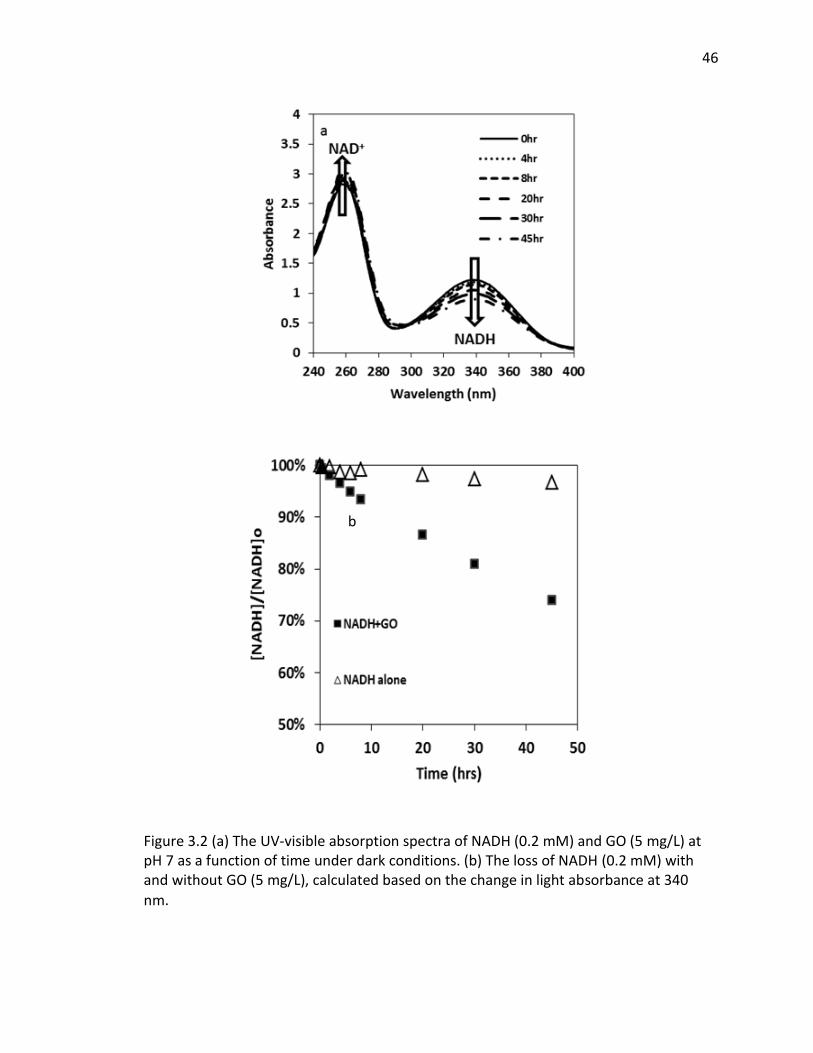
46
Figure 3.2 (a) The UV-visible absorption spectra of NADH (0.2 mM) and GO (5 mg/L) at pH 7 as a function of time under dark conditions. (b) The loss of NADH (0.2 mM) with and without GO (5 mg/L), calculated based on the change in light absorbance at 340
nm.
b
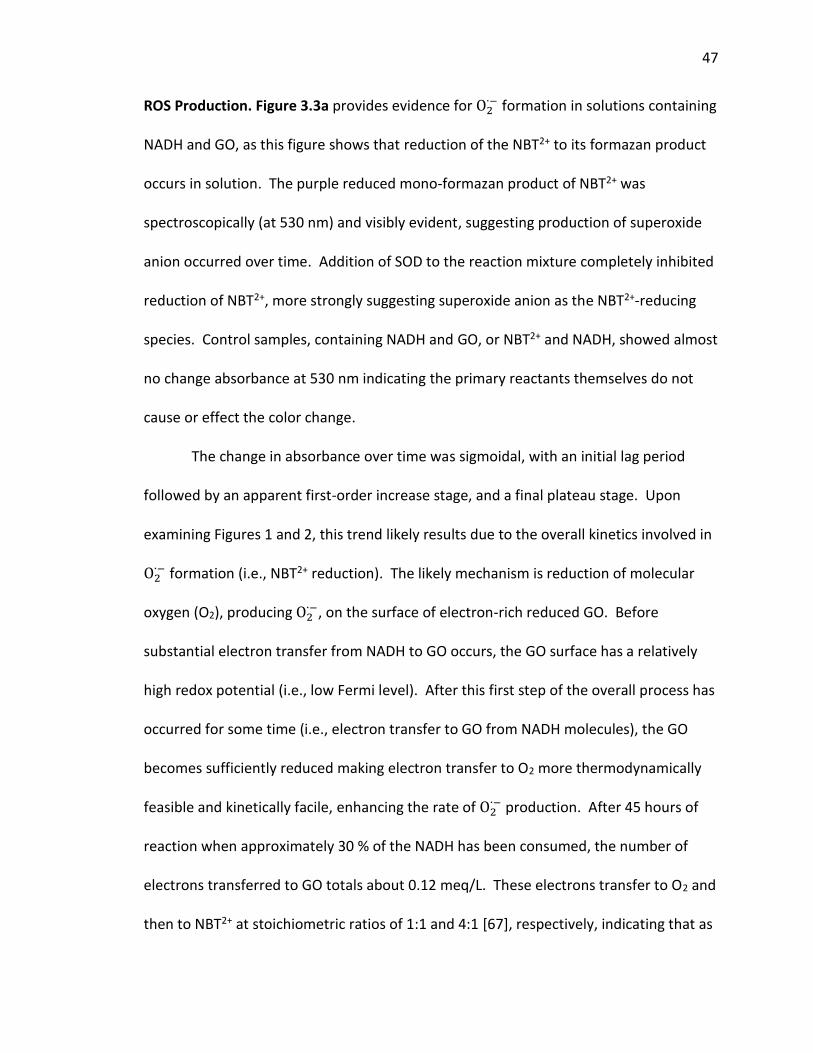
47
ROS Production. Figure 3.3a provides evidence for O2∙− formation in solutions containing
NADH and GO, as this figure shows that reduction of the NBT2+ to its formazan product
occurs in solution. The purple reduced mono-formazan product of NBT2+ was
spectroscopically (at 530 nm) and visibly evident, suggesting production of superoxide
anion occurred over time. Addition of SOD to the reaction mixture completely inhibited
reduction of NBT2+, more strongly suggesting superoxide anion as the NBT2+-reducing
species. Control samples, containing NADH and GO, or NBT2+ and NADH, showed almost
no change absorbance at 530 nm indicating the primary reactants themselves do not
cause or effect the color change.
The change in absorbance over time was sigmoidal, with an initial lag period
followed by an apparent first-order increase stage, and a final plateau stage. Upon
examining Figures 1 and 2, this trend likely results due to the overall kinetics involved in
O2∙− formation (i.e., NBT2+ reduction). The likely mechanism is reduction of molecular
oxygen (O2), producing O2∙−, on the surface of electron-rich reduced GO. Before
substantial electron transfer from NADH to GO occurs, the GO surface has a relatively
high redox potential (i.e., low Fermi level). After this first step of the overall process has
occurred for some time (i.e., electron transfer to GO from NADH molecules), the GO
becomes sufficiently reduced making electron transfer to O2 more thermodynamically
feasible and kinetically facile, enhancing the rate of O2∙− production. After 45 hours of
reaction when approximately 30 % of the NADH has been consumed, the number of
electrons transferred to GO totals about 0.12 meq/L. These electrons transfer to O2 and
then to NBT2+ at stoichiometric ratios of 1:1 and 4:1 [67], respectively, indicating that as
48
much as 0.48 mM NBT2+ could be reduced assuming 100% transfer efficiency. However,
because the initial concentration of NBT2+ was only 0.2 mM, the plateau stage on Figure
1 primarily results from the reduced rate of the final reaction (i.e., NBT2+ + O2∙−) at lower
NBT2+ concentrations. Figure 3.3b shows that the rate of accumulation of the formazan
product is dependent on the GO concentration as expected [71].
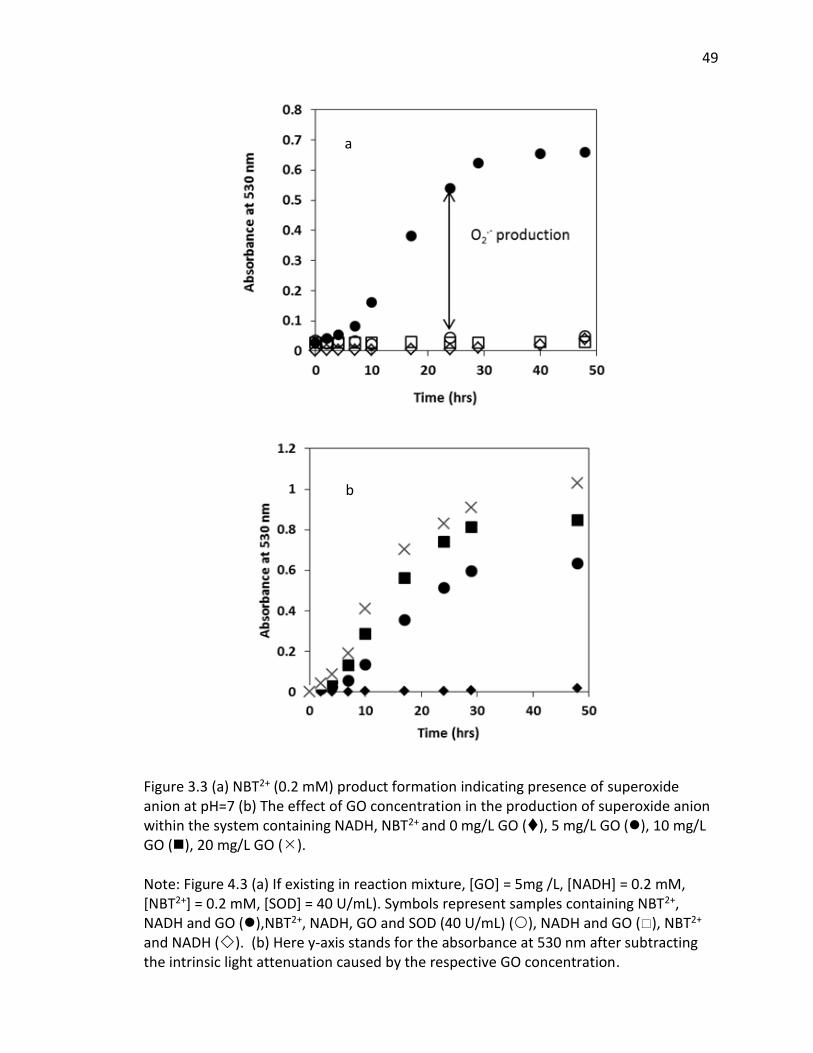
49
Figure 3.3 (a) NBT2+ (0.2 mM) product formation indicating presence of superoxide anion at pH=7 (b) The effect of GO concentration in the production of superoxide anion within the system containing NADH, NBT2+ and 0 mg/L GO (), 5 mg/L GO (), 10 mg/L GO (), 20 mg/L GO (). Note: Figure 4.3 (a) If existing in reaction mixture, [GO] = 5mg /L, [NADH] = 0.2 mM, [NBT2+] = 0.2 mM, [SOD] = 40 U/mL). Symbols represent samples containing NBT2+, NADH and GO (),NBT2+, NADH, GO and SOD (40 U/mL) (), NADH and GO (), NBT2+ and NADH (). (b) Here y-axis stands for the absorbance at 530 nm after subtracting the intrinsic light attenuation caused by the respective GO concentration.
a
b
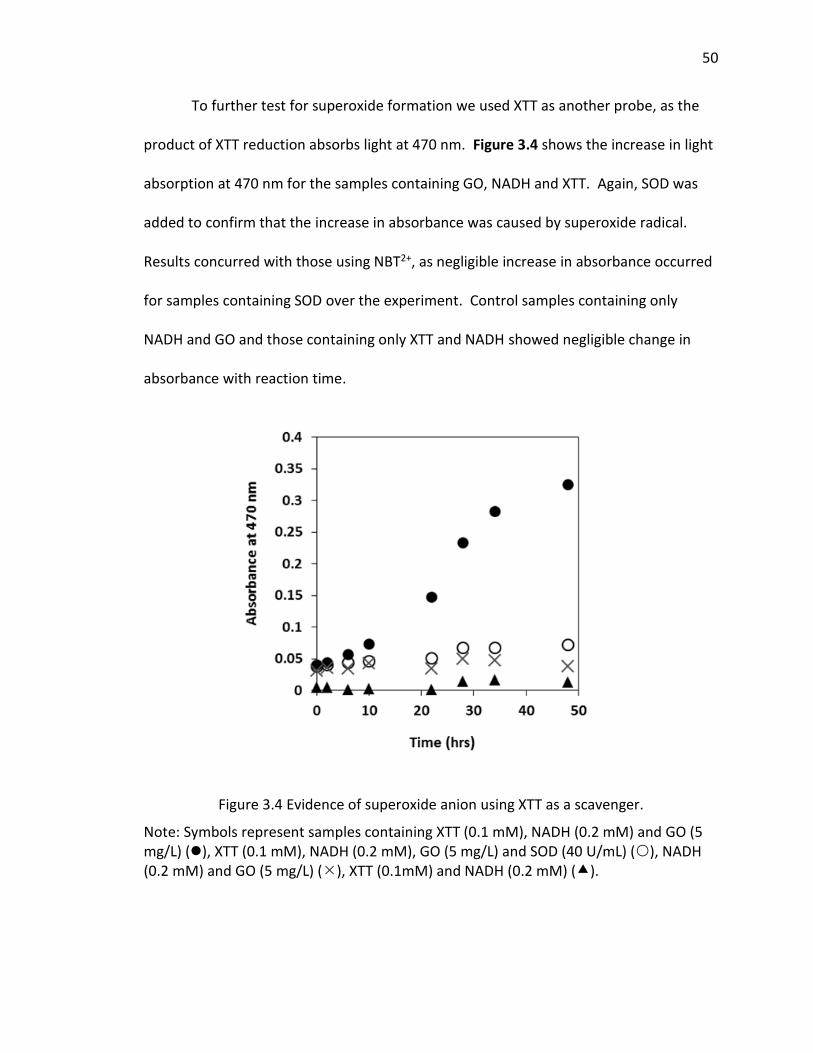
50
To further test for superoxide formation we used XTT as another probe, as the
product of XTT reduction absorbs light at 470 nm. Figure 3.4 shows the increase in light
absorption at 470 nm for the samples containing GO, NADH and XTT. Again, SOD was
added to confirm that the increase in absorbance was caused by superoxide radical.
Results concurred with those using NBT2+, as negligible increase in absorbance occurred
for samples containing SOD over the experiment. Control samples containing only
NADH and GO and those containing only XTT and NADH showed negligible change in
absorbance with reaction time.
Figure 3.4 Evidence of superoxide anion using XTT as a scavenger.
Note: Symbols represent samples containing XTT (0.1 mM), NADH (0.2 mM) and GO (5 mg/L) (), XTT (0.1 mM), NADH (0.2 mM), GO (5 mg/L) and SOD (40 U/mL) (), NADH (0.2 mM) and GO (5 mg/L) (), XTT (0.1mM) and NADH (0.2 mM) ().
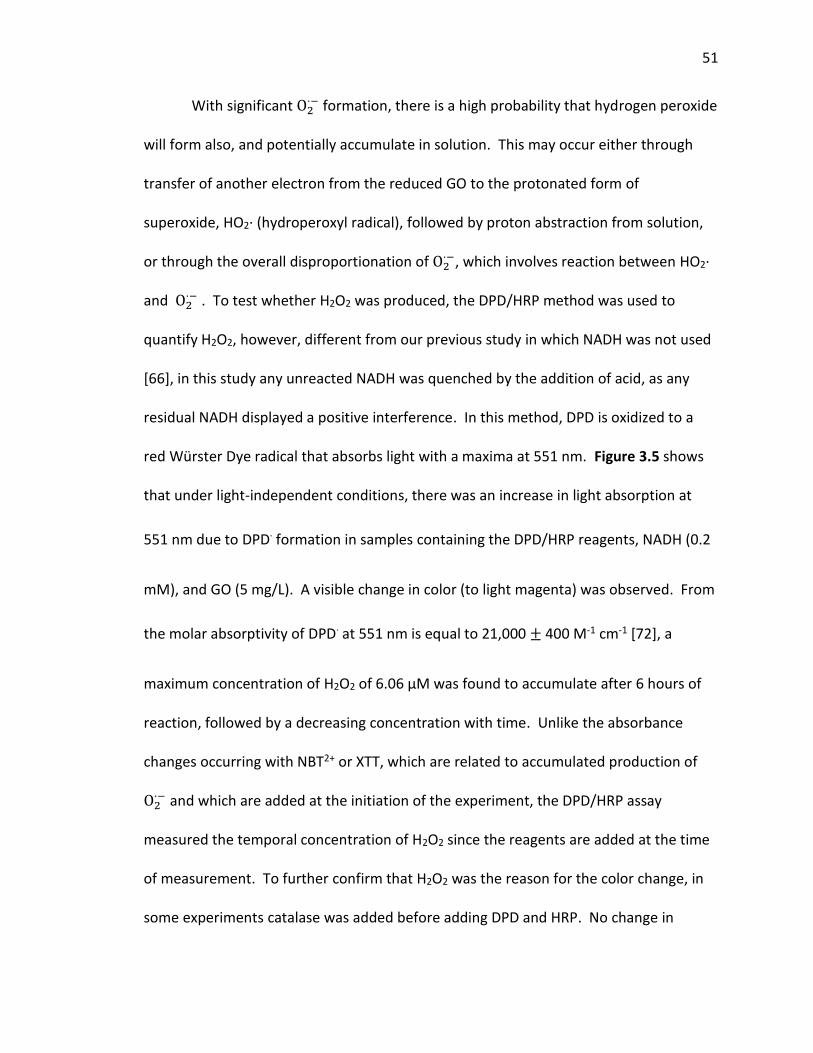
51
With significant O2·− formation, there is a high probability that hydrogen peroxide
will form also, and potentially accumulate in solution. This may occur either through
transfer of another electron from the reduced GO to the protonated form of
superoxide, HO2· (hydroperoxyl radical), followed by proton abstraction from solution,
or through the overall disproportionation of O2·−, which involves reaction between HO2·
and O2·− . To test whether H2O2 was produced, the DPD/HRP method was used to
quantify H2O2, however, different from our previous study in which NADH was not used
[66], in this study any unreacted NADH was quenched by the addition of acid, as any
residual NADH displayed a positive interference. In this method, DPD is oxidized to a
red Würster Dye radical that absorbs light with a maxima at 551 nm. Figure 3.5 shows
that under light-independent conditions, there was an increase in light absorption at
551 nm due to DPD· formation in samples containing the DPD/HRP reagents, NADH (0.2
mM), and GO (5 mg/L). A visible change in color (to light magenta) was observed. From
the molar absorptivity of DPD· at 551 nm is equal to 21,000 ± 400 M-1 cm-1 [72], a
maximum concentration of H2O2 of 6.06 μM was found to accumulate after 6 hours of
reaction, followed by a decreasing concentration with time. Unlike the absorbance
changes occurring with NBT2+ or XTT, which are related to accumulated production of
O2·− and which are added at the initiation of the experiment, the DPD/HRP assay
measured the temporal concentration of H2O2 since the reagents are added at the time
of measurement. To further confirm that H2O2 was the reason for the color change, in
some experiments catalase was added before adding DPD and HRP. No change in
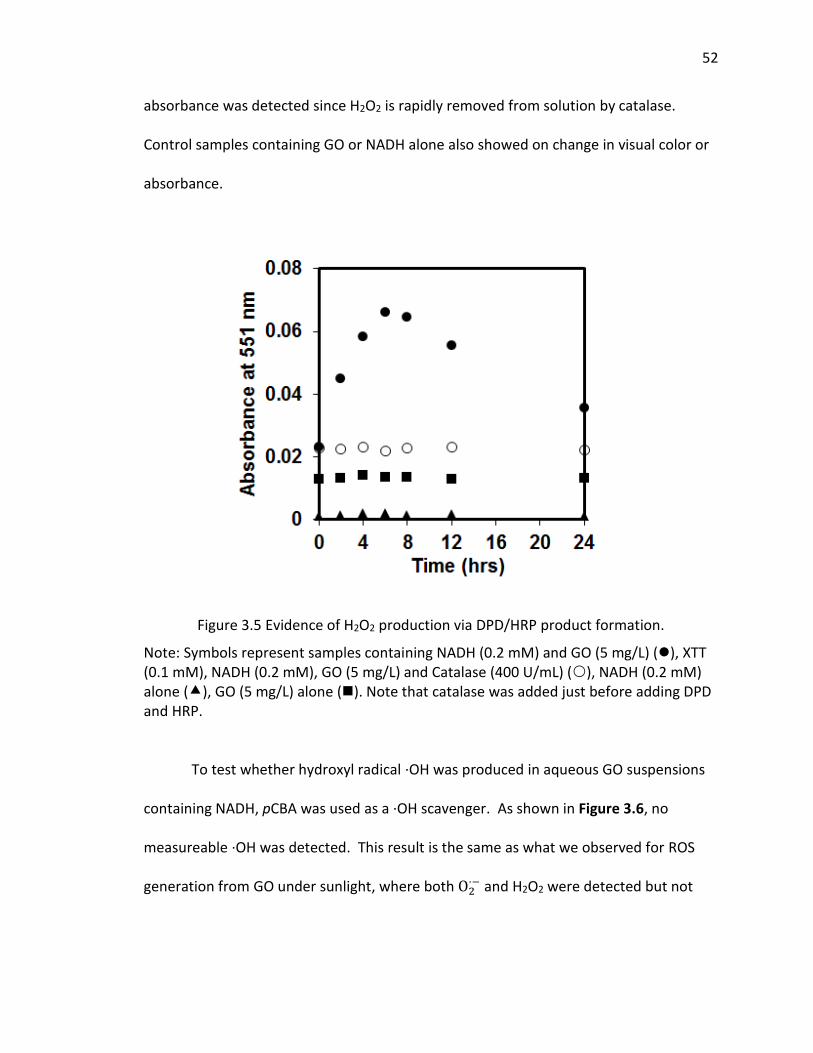
52
absorbance was detected since H2O2 is rapidly removed from solution by catalase.
Control samples containing GO or NADH alone also showed on change in visual color or
absorbance.
Figure 3.5 Evidence of H2O2 production via DPD/HRP product formation.
Note: Symbols represent samples containing NADH (0.2 mM) and GO (5 mg/L) (), XTT (0.1 mM), NADH (0.2 mM), GO (5 mg/L) and Catalase (400 U/mL) (), NADH (0.2 mM) alone (), GO (5 mg/L) alone (). Note that catalase was added just before adding DPD and HRP.
To test whether hydroxyl radical ·OH was produced in aqueous GO suspensions
containing NADH, pCBA was used as a ·OH scavenger. As shown in Figure 3.6, no
measureable ·OH was detected. This result is the same as what we observed for ROS
generation from GO under sunlight, where both O2·− and H2O2 were detected but not
53
·OH [66]. However, it is very possible that any ·OH formed on the surface of the GO is
rapidly consumed by the same surface, leading to a undetectable concentration in the
bulk aqueous phase [54].
Figure 3.6. Scavenging for ·OH with pCBA (5 µM) in pH 7 phosphate buffered solutions.
Note: Symbols stand for systems containing: pCBA (5 µM), NADH (0.2 mM), and GO (5 mg/L) (); pCBA (5 µM) and NADH (0.2 mM) (○), pCBA (5 µM), NADH (0.2 mM), and GO (5 mg/L) ().
Finally, as a way of assessing potential biological effects caused by ROS
production in the presence of GO and NADH, the ability of the ROS generated in these
experiments to cleave the pBR322 supercoiled DNA plasmid was assessed [60]. pBR322
DNA was used since it is a circular strand of double helix DNA which is often used for
evaluating chemicals thought to promote DNA damage. Figure 3.7 indicates that no
significant DNA cleavage was observed for samples containing DNA alone (0.015 µg/µL);
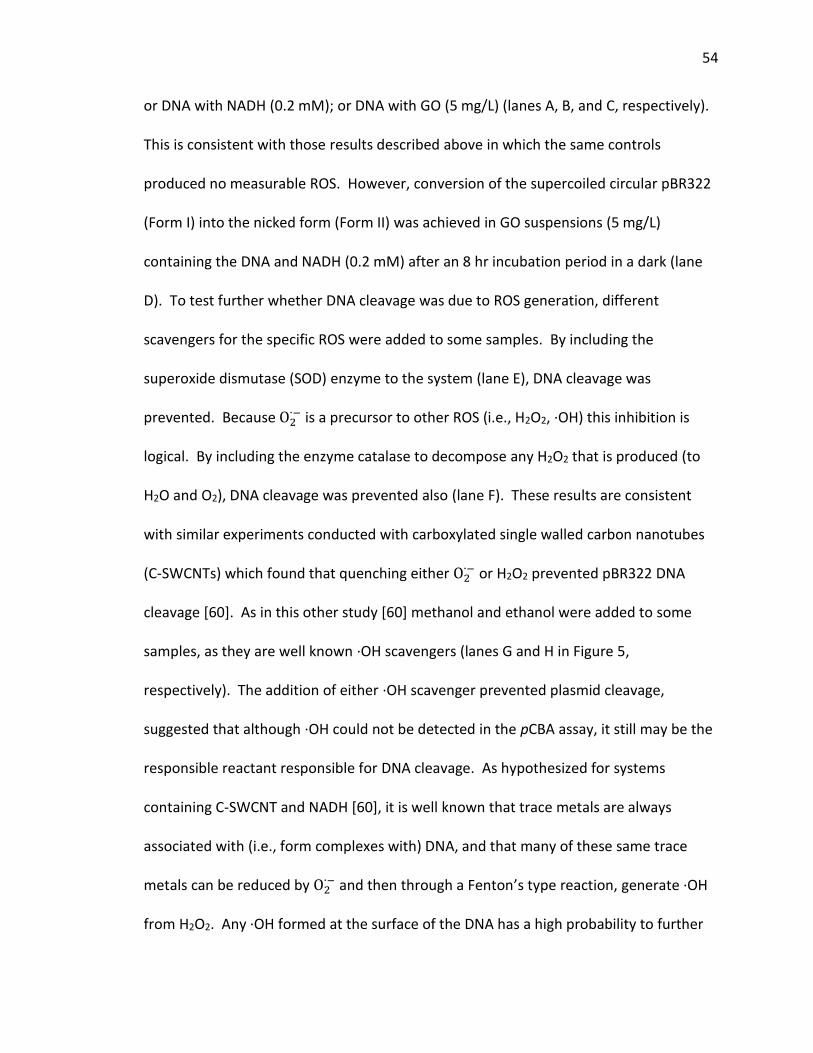
54
or DNA with NADH (0.2 mM); or DNA with GO (5 mg/L) (lanes A, B, and C, respectively).
This is consistent with those results described above in which the same controls
produced no measurable ROS. However, conversion of the supercoiled circular pBR322
(Form I) into the nicked form (Form II) was achieved in GO suspensions (5 mg/L)
containing the DNA and NADH (0.2 mM) after an 8 hr incubation period in a dark (lane
D). To test further whether DNA cleavage was due to ROS generation, different
scavengers for the specific ROS were added to some samples. By including the
superoxide dismutase (SOD) enzyme to the system (lane E), DNA cleavage was
prevented. Because O2∙− is a precursor to other ROS (i.e., H2O2, ·OH) this inhibition is
logical. By including the enzyme catalase to decompose any H2O2 that is produced (to
H2O and O2), DNA cleavage was prevented also (lane F). These results are consistent
with similar experiments conducted with carboxylated single walled carbon nanotubes
(C-SWCNTs) which found that quenching either O2∙− or H2O2 prevented pBR322 DNA
cleavage [60]. As in this other study [60] methanol and ethanol were added to some
samples, as they are well known ·OH scavengers (lanes G and H in Figure 5,
respectively). The addition of either ·OH scavenger prevented plasmid cleavage,
suggested that although ·OH could not be detected in the pCBA assay, it still may be the
responsible reactant responsible for DNA cleavage. As hypothesized for systems
containing C-SWCNT and NADH [60], it is well known that trace metals are always
associated with (i.e., form complexes with) DNA, and that many of these same trace
metals can be reduced by O2∙− and then through a Fenton’s type reaction, generate ·OH
from H2O2. Any ·OH formed at the surface of the DNA has a high probability to further

55
react with this surface, as it is generally known that ·OH can induce DNA cleavage by
hydrogen abstraction before diffusion into the bulk solution [73-75]. Consistent with
the experiments above in which ROS generation was observed to continue over time,
the amount of DNA damage was found to increase with incubation time (Figure 3.8).
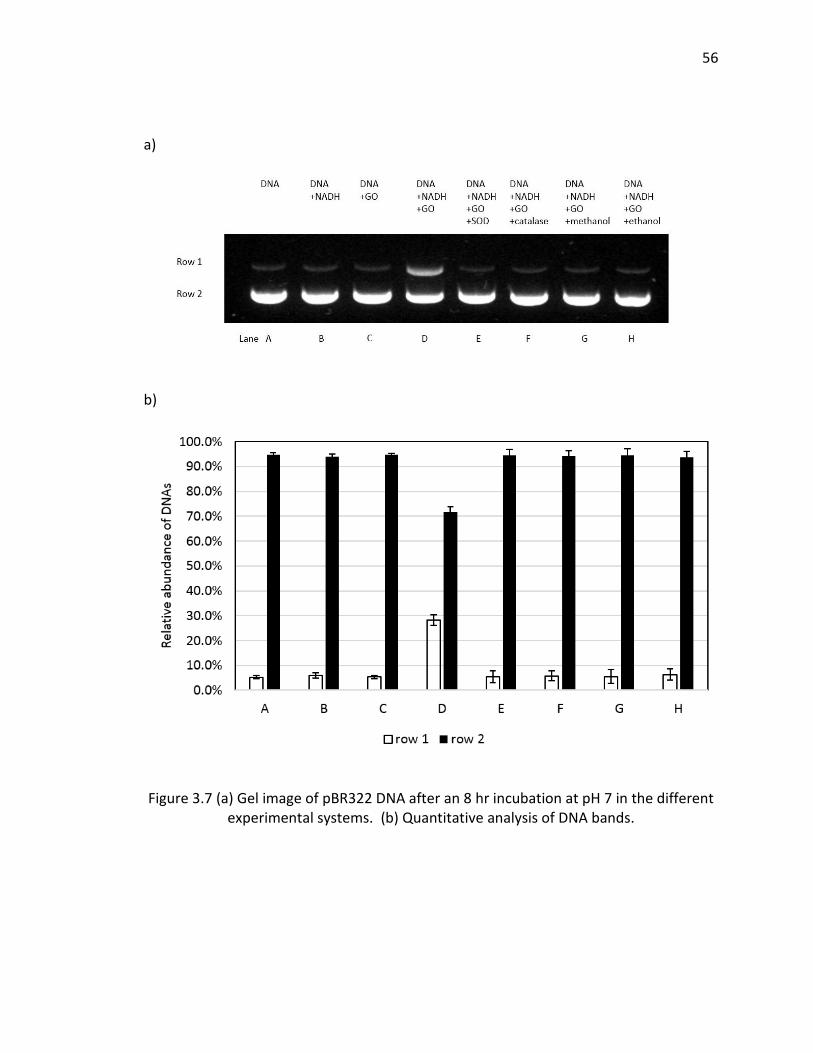
56
a)
b)
Figure 3.7 (a) Gel image of pBR322 DNA after an 8 hr incubation at pH 7 in the different experimental systems. (b) Quantitative analysis of DNA bands.
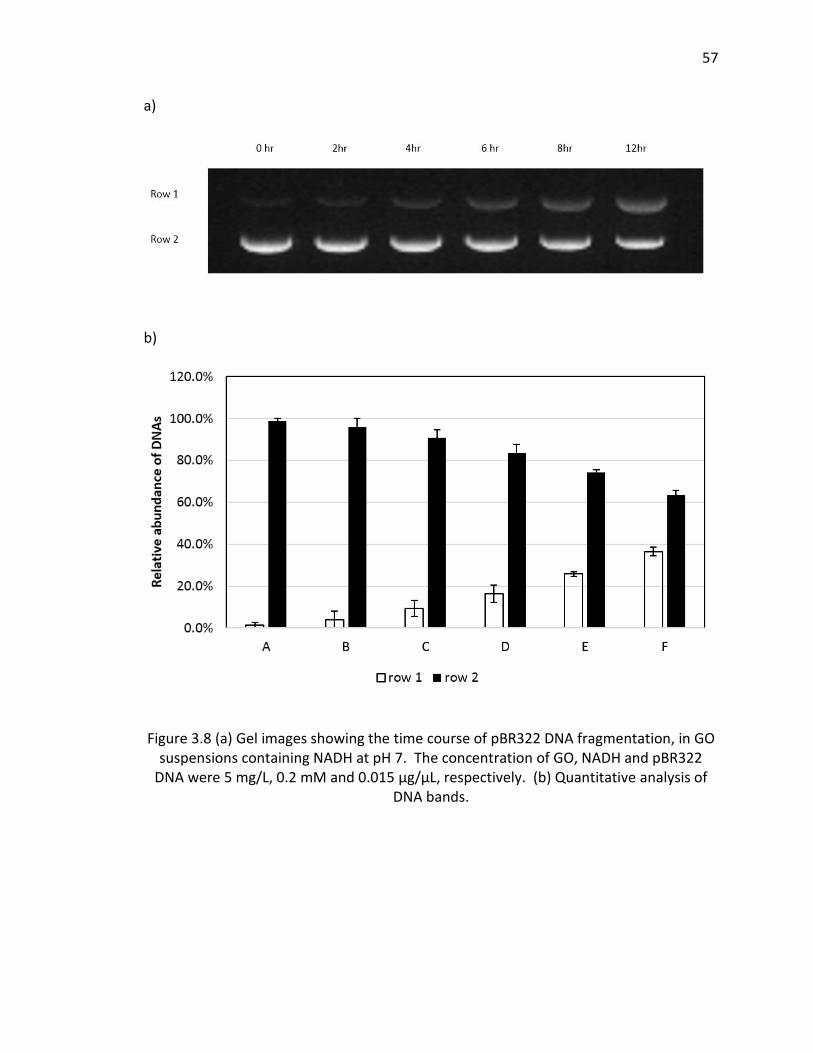
57
a)
b)
Figure 3.8 (a) Gel images showing the time course of pBR322 DNA fragmentation, in GO suspensions containing NADH at pH 7. The concentration of GO, NADH and pBR322
DNA were 5 mg/L, 0.2 mM and 0.015 µg/µL, respectively. (b) Quantitative analysis of DNA bands.
58
3.5 Conclusion
This study shows that GO can act as a catalytic intermediate, shuttling electrons from
NADH to molecular oxygen forming O2∙− Additional electron transfer or
disproportionation of O2∙− produces H2O2. Although ·OH was not detected, DNA
cleavage was observed in air-saturated GO suspensions containing NADH. This result
raises concern regarding potential biological risk of GO. Based on The proposed scheme
is shown in Figure 3.9.
Figure 3.9 Proposed mechanism of GO acting as an electron shuttle to produce reactive oxygen species(ROS) and subsequent DNA cleavage.
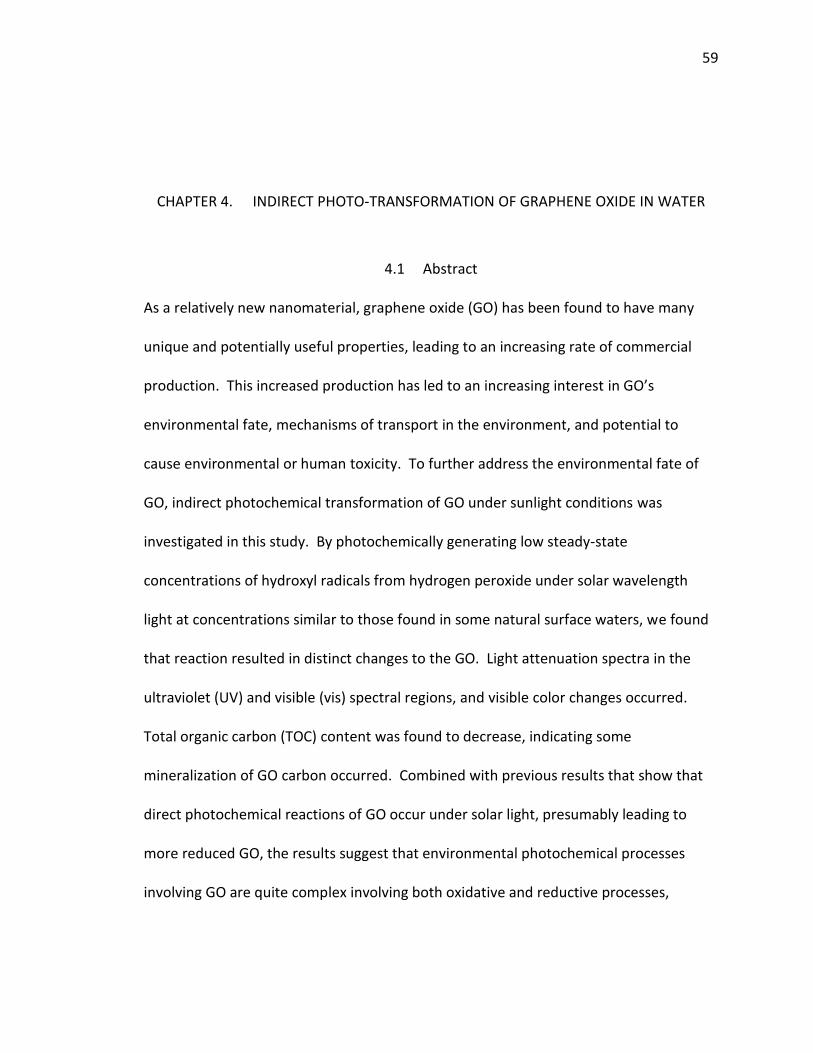
59
CHAPTER 4. INDIRECT PHOTO-TRANSFORMATION OF GRAPHENE OXIDE IN WATER
4.1 Abstract
As a relatively new nanomaterial, graphene oxide (GO) has been found to have many
unique and potentially useful properties, leading to an increasing rate of commercial
production. This increased production has led to an increasing interest in GO’s
environmental fate, mechanisms of transport in the environment, and potential to
cause environmental or human toxicity. To further address the environmental fate of
GO, indirect photochemical transformation of GO under sunlight conditions was
investigated in this study. By photochemically generating low steady-state
concentrations of hydroxyl radicals from hydrogen peroxide under solar wavelength
light at concentrations similar to those found in some natural surface waters, we found
that reaction resulted in distinct changes to the GO. Light attenuation spectra in the
ultraviolet (UV) and visible (vis) spectral regions, and visible color changes occurred.
Total organic carbon (TOC) content was found to decrease, indicating some
mineralization of GO carbon occurred. Combined with previous results that show that
direct photochemical reactions of GO occur under solar light, presumably leading to
more reduced GO, the results suggest that environmental photochemical processes
involving GO are quite complex involving both oxidative and reductive processes,
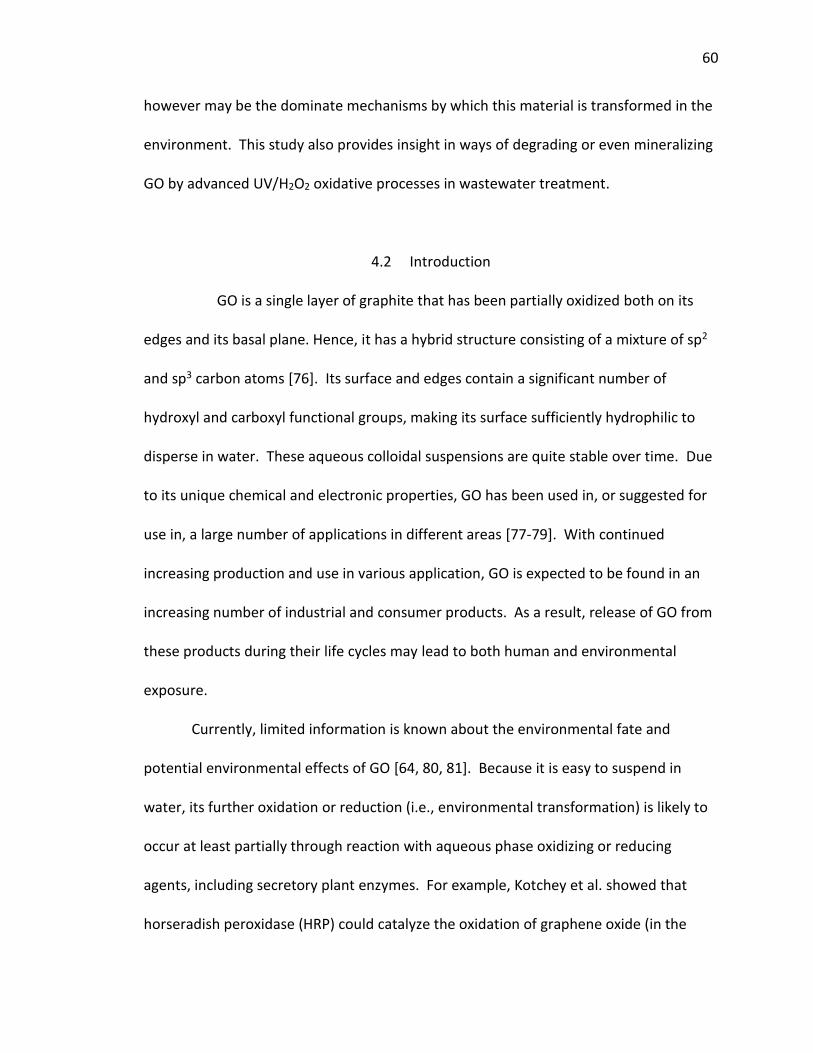
60
however may be the dominate mechanisms by which this material is transformed in the
environment. This study also provides insight in ways of degrading or even mineralizing
GO by advanced UV/H2O2 oxidative processes in wastewater treatment.
4.2 Introduction
GO is a single layer of graphite that has been partially oxidized both on its
edges and its basal plane. Hence, it has a hybrid structure consisting of a mixture of sp2
and sp3 carbon atoms [76]. Its surface and edges contain a significant number of
hydroxyl and carboxyl functional groups, making its surface sufficiently hydrophilic to
disperse in water. These aqueous colloidal suspensions are quite stable over time. Due
to its unique chemical and electronic properties, GO has been used in, or suggested for
use in, a large number of applications in different areas [77-79]. With continued
increasing production and use in various application, GO is expected to be found in an
increasing number of industrial and consumer products. As a result, release of GO from
these products during their life cycles may lead to both human and environmental
exposure.
Currently, limited information is known about the environmental fate and
potential environmental effects of GO [64, 80, 81]. Because it is easy to suspend in
water, its further oxidation or reduction (i.e., environmental transformation) is likely to
occur at least partially through reaction with aqueous phase oxidizing or reducing
agents, including secretory plant enzymes. For example, Kotchey et al. showed that
horseradish peroxidase (HRP) could catalyze the oxidation of graphene oxide (in the
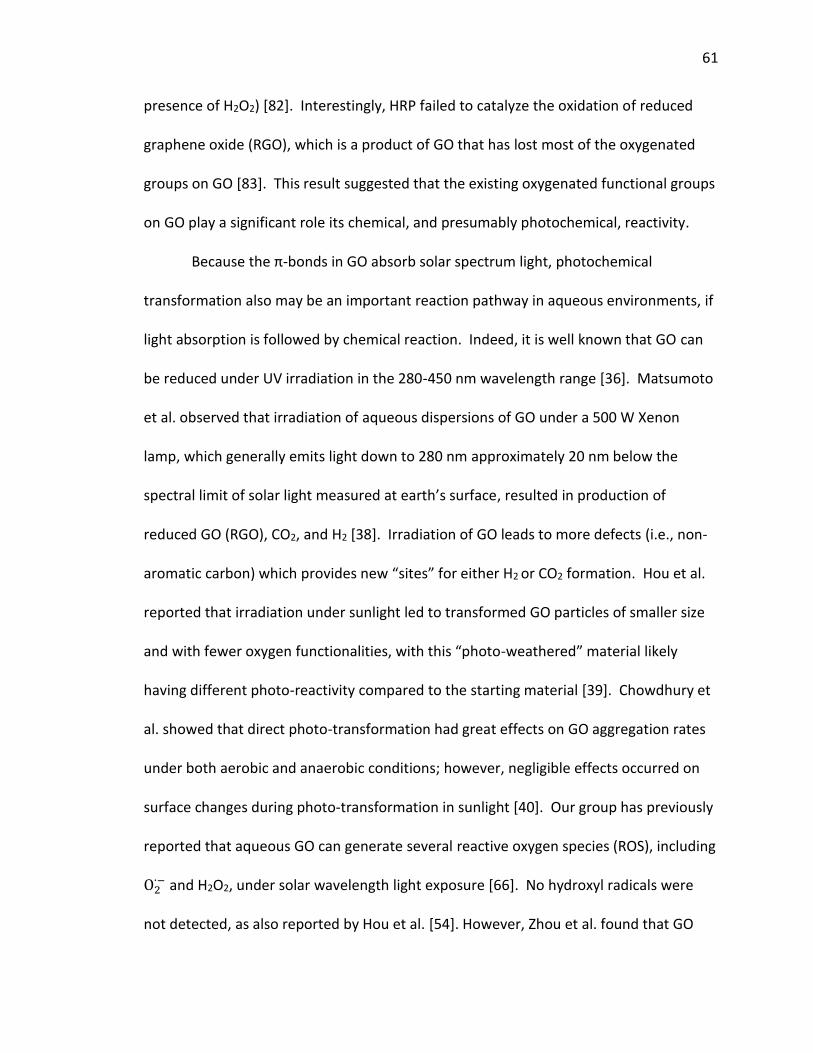
61
presence of H2O2) [82]. Interestingly, HRP failed to catalyze the oxidation of reduced
graphene oxide (RGO), which is a product of GO that has lost most of the oxygenated
groups on GO [83]. This result suggested that the existing oxygenated functional groups
on GO play a significant role its chemical, and presumably photochemical, reactivity.
Because the π-bonds in GO absorb solar spectrum light, photochemical
transformation also may be an important reaction pathway in aqueous environments, if
light absorption is followed by chemical reaction. Indeed, it is well known that GO can
be reduced under UV irradiation in the 280-450 nm wavelength range [36]. Matsumoto
et al. observed that irradiation of aqueous dispersions of GO under a 500 W Xenon
lamp, which generally emits light down to 280 nm approximately 20 nm below the
spectral limit of solar light measured at earth’s surface, resulted in production of
reduced GO (RGO), CO2, and H2 [38]. Irradiation of GO leads to more defects (i.e., non-
aromatic carbon) which provides new “sites” for either H2 or CO2 formation. Hou et al.
reported that irradiation under sunlight led to transformed GO particles of smaller size
and with fewer oxygen functionalities, with this “photo-weathered” material likely
having different photo-reactivity compared to the starting material [39]. Chowdhury et
al. showed that direct photo-transformation had great effects on GO aggregation rates
under both aerobic and anaerobic conditions; however, negligible effects occurred on
surface changes during photo-transformation in sunlight [40]. Our group has previously
reported that aqueous GO can generate several reactive oxygen species (ROS), including
O2∙− and H2O2, under solar wavelength light exposure [66]. No hydroxyl radicals were
not detected, as also reported by Hou et al. [54]. However, Zhou et al. found that GO
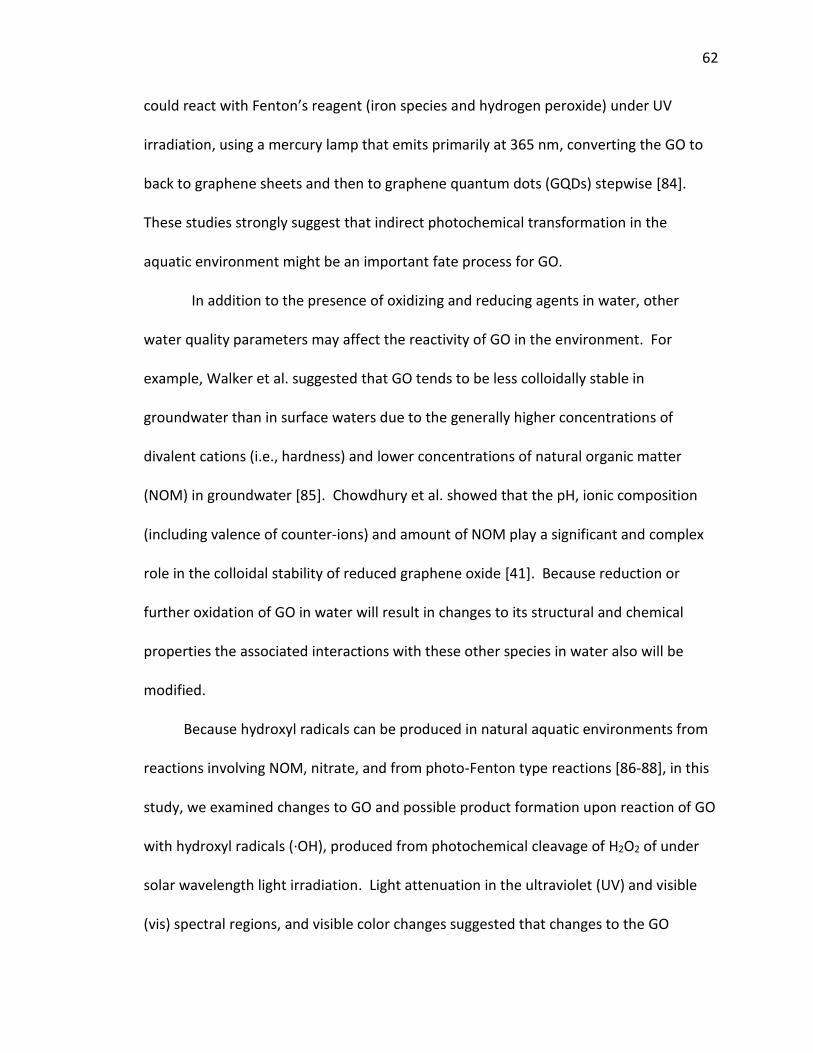
62
could react with Fenton’s reagent (iron species and hydrogen peroxide) under UV
irradiation, using a mercury lamp that emits primarily at 365 nm, converting the GO to
back to graphene sheets and then to graphene quantum dots (GQDs) stepwise [84].
These studies strongly suggest that indirect photochemical transformation in the
aquatic environment might be an important fate process for GO.
In addition to the presence of oxidizing and reducing agents in water, other
water quality parameters may affect the reactivity of GO in the environment. For
example, Walker et al. suggested that GO tends to be less colloidally stable in
groundwater than in surface waters due to the generally higher concentrations of
divalent cations (i.e., hardness) and lower concentrations of natural organic matter
(NOM) in groundwater [85]. Chowdhury et al. showed that the pH, ionic composition
(including valence of counter-ions) and amount of NOM play a significant and complex
role in the colloidal stability of reduced graphene oxide [41]. Because reduction or
further oxidation of GO in water will result in changes to its structural and chemical
properties the associated interactions with these other species in water also will be
modified.
Because hydroxyl radicals can be produced in natural aquatic environments from
reactions involving NOM, nitrate, and from photo-Fenton type reactions [86-88], in this
study, we examined changes to GO and possible product formation upon reaction of GO
with hydroxyl radicals (·OH), produced from photochemical cleavage of H2O2 of under
solar wavelength light irradiation. Light attenuation in the ultraviolet (UV) and visible
(vis) spectral regions, and visible color changes suggested that changes to the GO
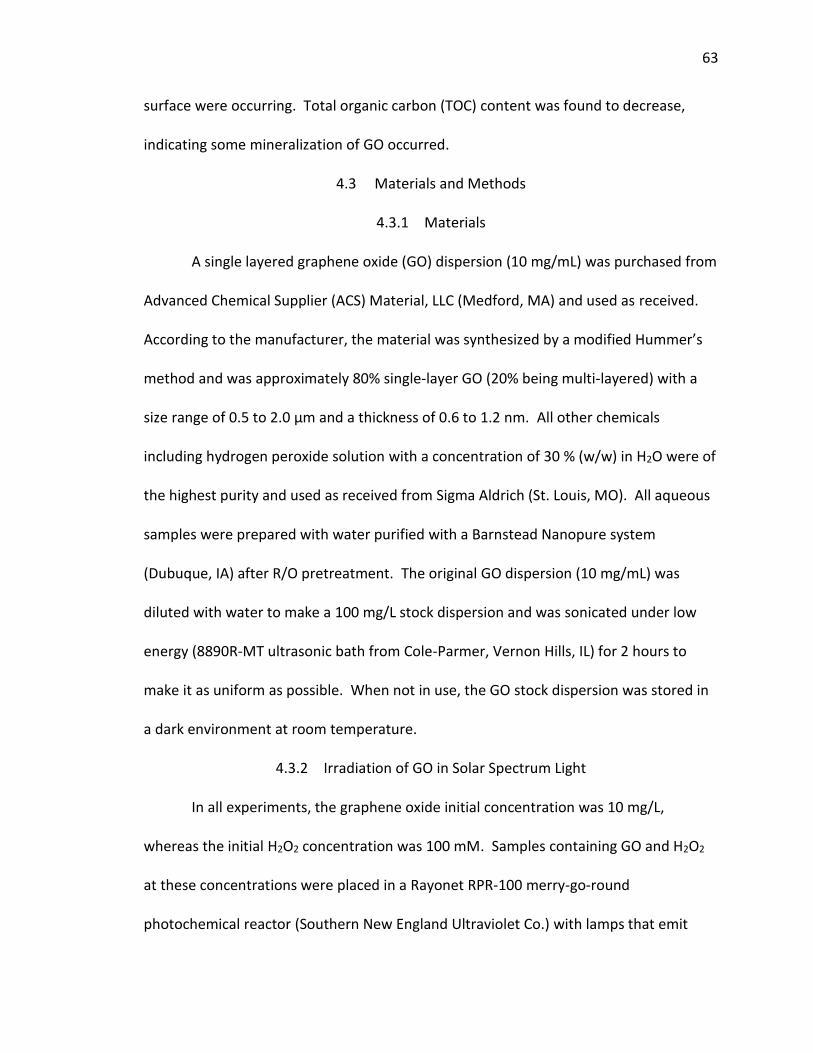
63
surface were occurring. Total organic carbon (TOC) content was found to decrease,
indicating some mineralization of GO occurred.
4.3 Materials and Methods
4.3.1 Materials
A single layered graphene oxide (GO) dispersion (10 mg/mL) was purchased from
Advanced Chemical Supplier (ACS) Material, LLC (Medford, MA) and used as received.
According to the manufacturer, the material was synthesized by a modified Hummer’s
method and was approximately 80% single-layer GO (20% being multi-layered) with a
size range of 0.5 to 2.0 µm and a thickness of 0.6 to 1.2 nm. All other chemicals
including hydrogen peroxide solution with a concentration of 30 % (w/w) in H2O were of
the highest purity and used as received from Sigma Aldrich (St. Louis, MO). All aqueous
samples were prepared with water purified with a Barnstead Nanopure system
(Dubuque, IA) after R/O pretreatment. The original GO dispersion (10 mg/mL) was
diluted with water to make a 100 mg/L stock dispersion and was sonicated under low
energy (8890R-MT ultrasonic bath from Cole-Parmer, Vernon Hills, IL) for 2 hours to
make it as uniform as possible. When not in use, the GO stock dispersion was stored in
a dark environment at room temperature.
4.3.2 Irradiation of GO in Solar Spectrum Light
In all experiments, the graphene oxide initial concentration was 10 mg/L,
whereas the initial H2O2 concentration was 100 mM. Samples containing GO and H2O2
at these concentrations were placed in a Rayonet RPR-100 merry-go-round
photochemical reactor (Southern New England Ultraviolet Co.) with lamps that emit
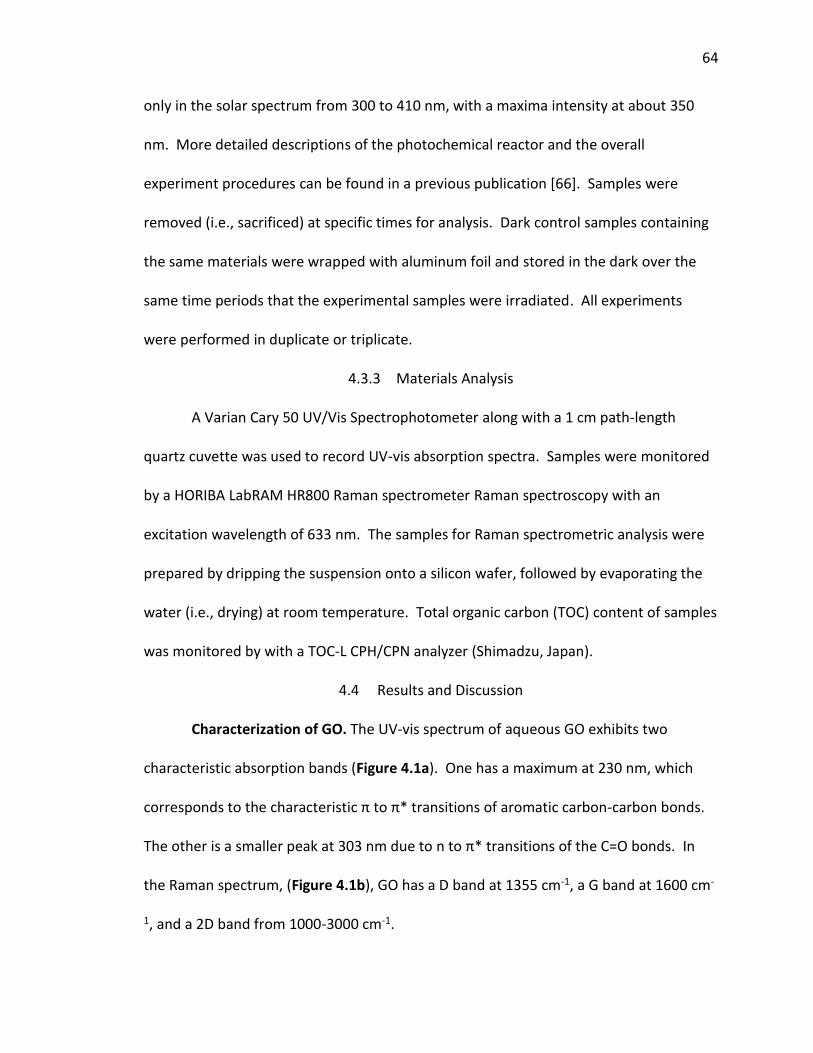
64
only in the solar spectrum from 300 to 410 nm, with a maxima intensity at about 350
nm. More detailed descriptions of the photochemical reactor and the overall
experiment procedures can be found in a previous publication [66]. Samples were
removed (i.e., sacrificed) at specific times for analysis. Dark control samples containing
the same materials were wrapped with aluminum foil and stored in the dark over the
same time periods that the experimental samples were irradiated. All experiments
were performed in duplicate or triplicate.
4.3.3 Materials Analysis
A Varian Cary 50 UV/Vis Spectrophotometer along with a 1 cm path-length
quartz cuvette was used to record UV-vis absorption spectra. Samples were monitored
by a HORIBA LabRAM HR800 Raman spectrometer Raman spectroscopy with an
excitation wavelength of 633 nm. The samples for Raman spectrometric analysis were
prepared by dripping the suspension onto a silicon wafer, followed by evaporating the
water (i.e., drying) at room temperature. Total organic carbon (TOC) content of samples
was monitored by with a TOC-L CPH/CPN analyzer (Shimadzu, Japan).
4.4 Results and Discussion
Characterization of GO. The UV-vis spectrum of aqueous GO exhibits two
characteristic absorption bands (Figure 4.1a). One has a maximum at 230 nm, which
corresponds to the characteristic π to π* transitions of aromatic carbon-carbon bonds.
The other is a smaller peak at 303 nm due to n to π* transitions of the C=O bonds. In
the Raman spectrum, (Figure 4.1b), GO has a D band at 1355 cm-1, a G band at 1600 cm-
1, and a 2D band from 1000-3000 cm-1.
65
Figure 4.1 Characterization of GO. a) UV/Vis absorption spectra. b) Raman spectra.
Photo Degradation of GO with H2O2 in Water. Figure 4.2a showed the changes
in the light attenuation spectrum of a 10 mg/L suspension of GO containing 100 mM
H2O2 under lamp light irradiation. The spectrum is referred to as a light attenuation
spectrum, rather than an absorbance spectrum because the observed response
measured by the instrument is caused by both the amount of light that is absorbed by
the GO and by the amount of light that is scattered by the GO nanoparticles. The
response over the entire spectrum from 300 to 800 nm is underlain by a wide light
scattering band, as also evident on Figure 4.1(a). Over the course of the first 4 hours of
irradiation, there was a general increase in light attenuation across the UV-visible
spectrum, likely resulting from direct photochemical reduction of the GO, as occurs in
the absence of H2O2. In contrast, from 4 hours to 48 hours, a continual decrease in light
attenuation occurred, suggesting that the reaction of ·OH with GO was reducing the
66
number of aromatic functional groups within the GO nanoparticles. In contrast, for the
dispersion containing only GO (no H2O2), light attenuation across the spectrum
continued to increase from 0 to 18 hours, and remained relatively constant from 18 to
48 hours (Figure 4.2b). These results suggest that in the presence of 100 mM H2O2, the
resulting hydroxyl radical-mediated oxidation out-competes the direct photochemical
reduction process. The dark control samples containing GO and H2O2 showed negligible
difference in the UV-vis spectra over the total reaction period of zero to 48 hours
(Figure 4.2c).
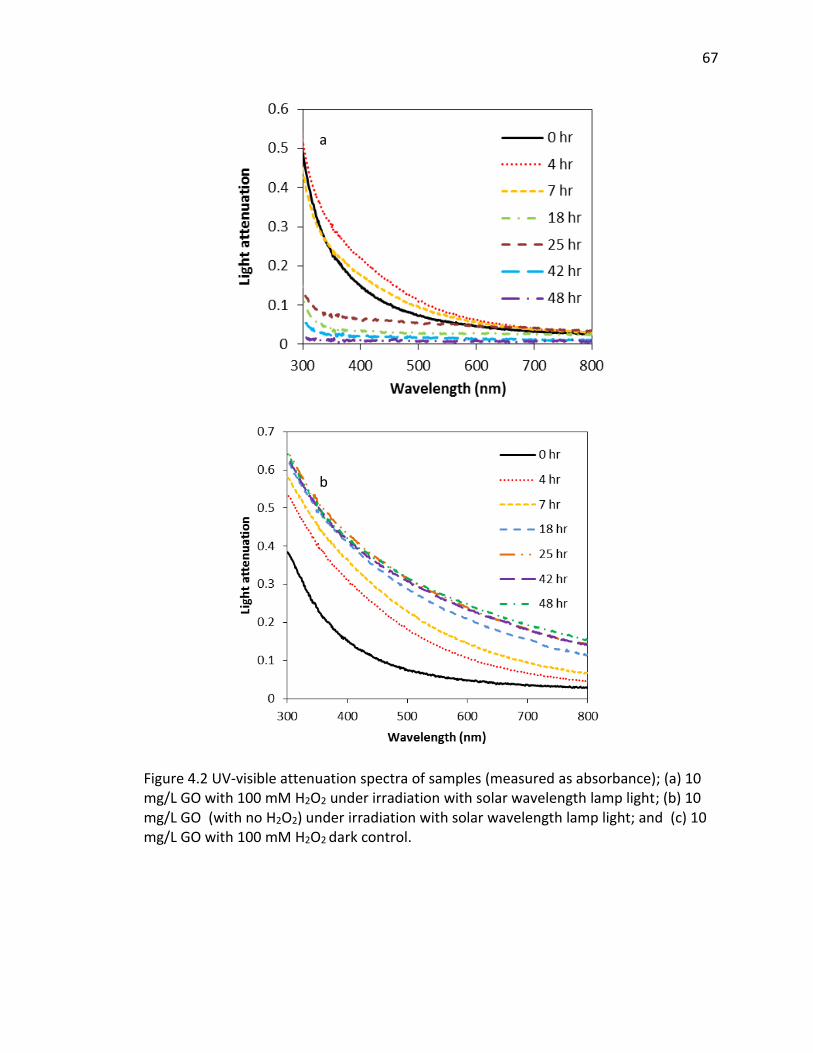
67
Figure 4.2 UV-visible attenuation spectra of samples (measured as absorbance); (a) 10 mg/L GO with 100 mM H2O2 under irradiation with solar wavelength lamp light; (b) 10 mg/L GO (with no H2O2) under irradiation with solar wavelength lamp light; and (c) 10 mg/L GO with 100 mM H2O2 dark control.
a
b
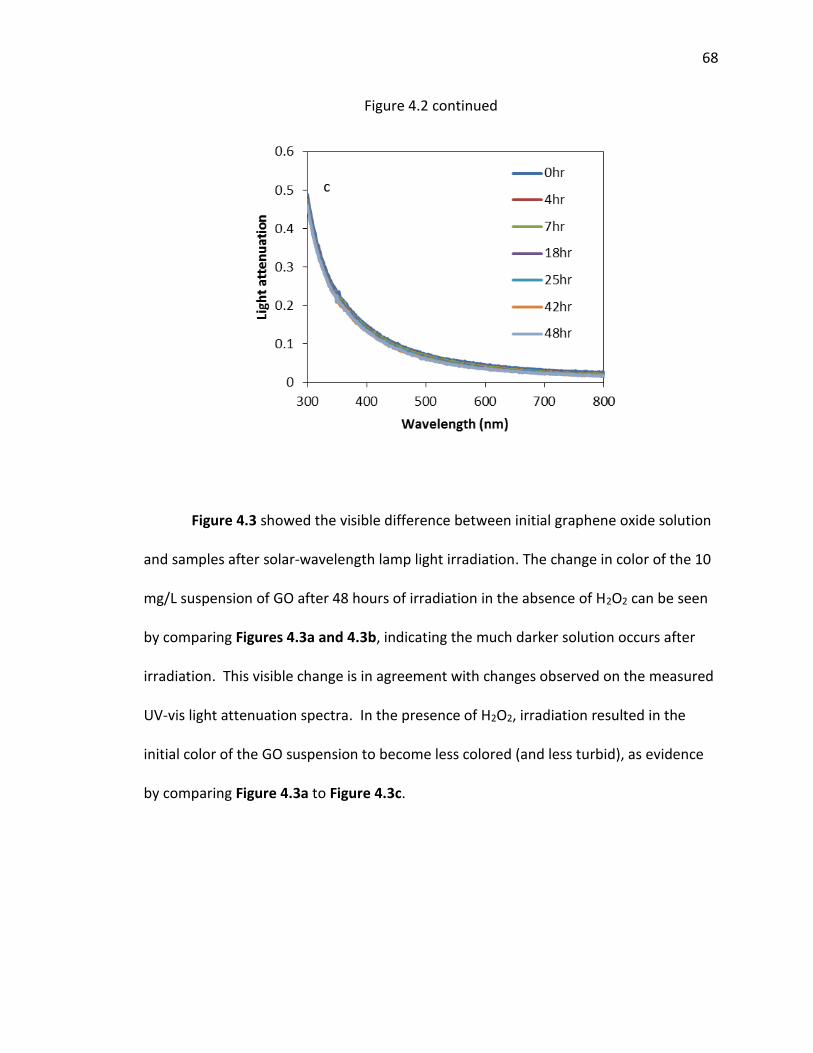
68
Figure 4.2 continued
Figure 4.3 showed the visible difference between initial graphene oxide solution
and samples after solar-wavelength lamp light irradiation. The change in color of the 10
mg/L suspension of GO after 48 hours of irradiation in the absence of H2O2 can be seen
by comparing Figures 4.3a and 4.3b, indicating the much darker solution occurs after
irradiation. This visible change is in agreement with changes observed on the measured
UV-vis light attenuation spectra. In the presence of H2O2, irradiation resulted in the
initial color of the GO suspension to become less colored (and less turbid), as evidence
by comparing Figure 4.3a to Figure 4.3c.
c
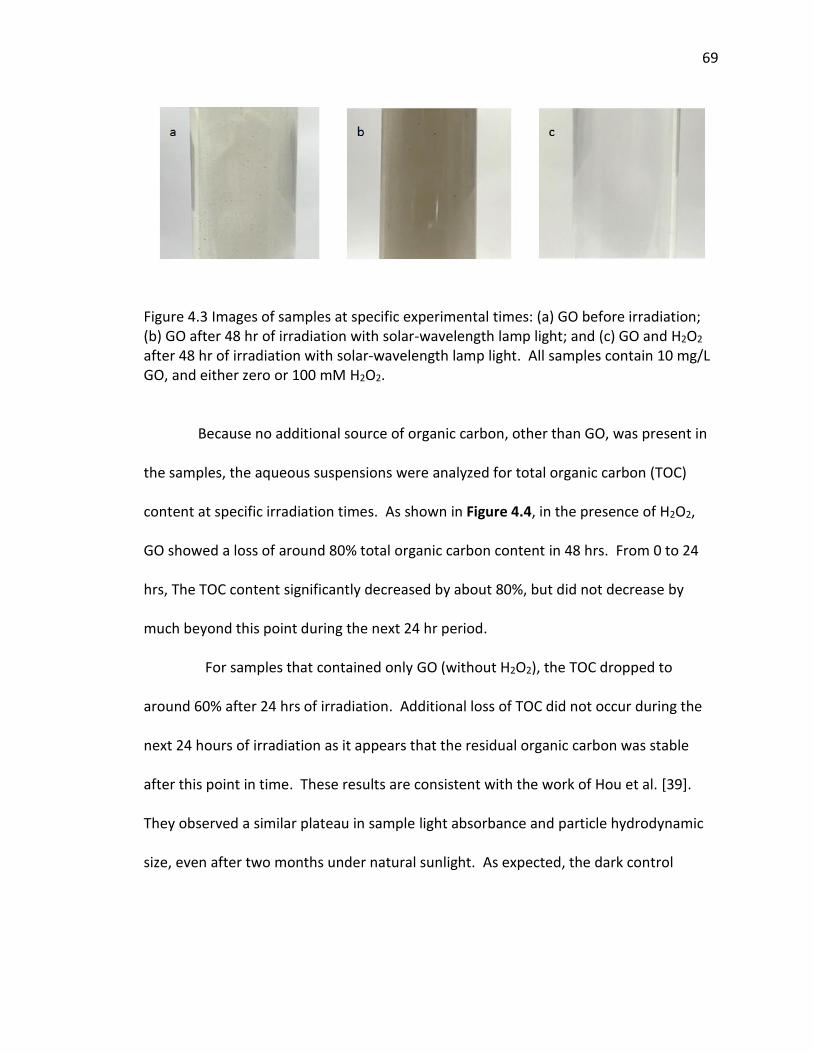
69
Figure 4.3 Images of samples at specific experimental times: (a) GO before irradiation; (b) GO after 48 hr of irradiation with solar-wavelength lamp light; and (c) GO and H2O2 after 48 hr of irradiation with solar-wavelength lamp light. All samples contain 10 mg/L GO, and either zero or 100 mM H2O2.
Because no additional source of organic carbon, other than GO, was present in
the samples, the aqueous suspensions were analyzed for total organic carbon (TOC)
content at specific irradiation times. As shown in Figure 4.4, in the presence of H2O2,
GO showed a loss of around 80% total organic carbon content in 48 hrs. From 0 to 24
hrs, The TOC content significantly decreased by about 80%, but did not decrease by
much beyond this point during the next 24 hr period.
For samples that contained only GO (without H2O2), the TOC dropped to
around 60% after 24 hrs of irradiation. Additional loss of TOC did not occur during the
next 24 hours of irradiation as it appears that the residual organic carbon was stable
after this point in time. These results are consistent with the work of Hou et al. [39].
They observed a similar plateau in sample light absorbance and particle hydrodynamic
size, even after two months under natural sunlight. As expected, the dark control
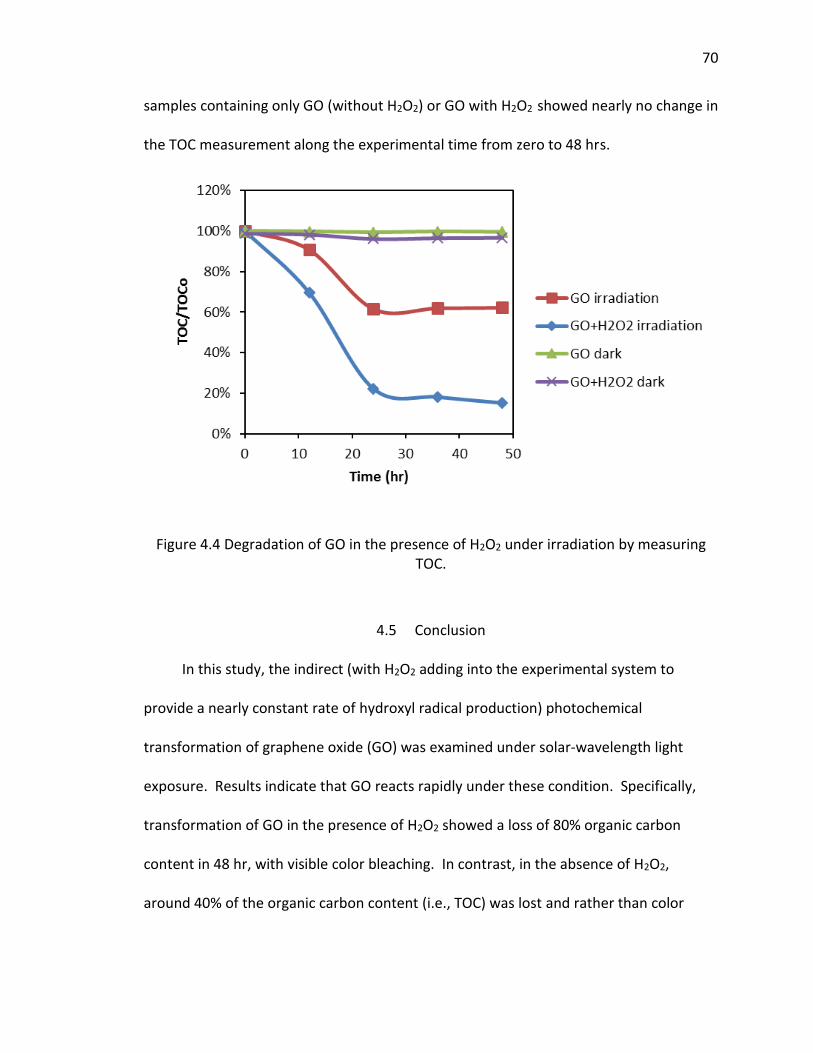
70
samples containing only GO (without H2O2) or GO with H2O2 showed nearly no change in
the TOC measurement along the experimental time from zero to 48 hrs.
Figure 4.4 Degradation of GO in the presence of H2O2 under irradiation by measuring TOC.
4.5 Conclusion
In this study, the indirect (with H2O2 adding into the experimental system to
provide a nearly constant rate of hydroxyl radical production) photochemical
transformation of graphene oxide (GO) was examined under solar-wavelength light
exposure. Results indicate that GO reacts rapidly under these condition. Specifically,
transformation of GO in the presence of H2O2 showed a loss of 80% organic carbon
content in 48 hr, with visible color bleaching. In contrast, in the absence of H2O2,
around 40% of the organic carbon content (i.e., TOC) was lost and rather than color
71
bleaching, the GO suspension became darker in color. In the presence of H2O2, we
postulate that the dominate reaction involved hydroxyl radical attach on the GO carbon;
however this reaction was likely occurring simultaneously with some, and less rapid
photoreduction on the same particles.
4.6 Environmental Significance
This study indicates that as expected, GO is fairly reactive towards ·OH, which is
often photo-chemically produced in natural waters. The finding suggested that reaction
with ·OH might be an important transformation process of GO in the natural aquatic
environment. Also, this study provides insight into ways of degrading GO or even
mineralizing it during H2O2/UV processes in wastewater treatment systems.
72
CHAPTER 5. PHOTOREACTIONS OF AQU/NC60 CLUSTERS UNDER SIMULATED SUNLIGHT: PHOTO MINERALIZATION AND PRODUCT CHARACTERIZATION
5.1 Abstract
C60 is emerging in various applications, however, much remains to be learned regarding
its properties in aqueous systems in the natural environment. In this study,
mineralization of aqueous C60 clusters (aqu/nC60) was examined under simulated
sunlight in merry-go-round photo-reactor. CO2 was observed to be produced from
aqu/nC60 suspensions, indicating that some mineralization did occur. Additionally,
Ultraviolet-visible (UV- vis) absorbance spectra and HPLC analysis were performed to
follow the overall transformation process. This study shows that CO2 is one of the
products formed from aqu/nC60 clusters under solar irradiation, suggesting that major
changes occur to the overall structure of C60 upon exposure to sunlight.
5.2 Introduction
Many studies have evaluated the properties of C60 in order to discover how this
material can be used in more applications, including biomedical and electronic
applications [2, 4, 89]. One of the more interesting applications was to use it in a gel
formulation, where it was found to help control acne, and to provide other skin care
benefits by inhibition of neutrophil infiltration and sebum production [90]. Clearly, large
73
scale production of C60 and other fullerenes is likely to occur to meet industrial and
customers’ needs now and into the near future. Frontier Carbon Cooperation (FCC),
reported that nearly 1,500 tons/year carbon buckminsterfullerene were produced in
2007 [2]. Therefore, if this production rate continues to increase over the next few
decades, fullerenes will appear in the natural environment through live cycle release
and also possibly through accidental release without doubt. Many toxicity studies have
shown that C60 can induce oxidative stress to the brain of juvenile largemouth bass and
may also be responsible for cytotoxicity, resulting in DNA cleavage and other cellular
structure damage [11-13]. Hence, clearly there are concerns over negative effects of C60
on human and animal health motivating much research directed at providing data for a
more thorough risk assessment analysis of C60 and other fullerenes.
C60 is very hydrophobic [5, 6]. However, it is well known that clusters (i.e.,
nano-sized precipitates) of C60, termed nC60, form stable colloidal suspensions in water.
These colloidal suspensions can be easily formed by adding solid C60 to water, and then
stirring the mixture for an extended period of time, or by sonicating the mixture in
water for a shorter period of time [7-9]. If released to the aqueous environment, C60 will
no doubt influence the water quality of the receiving stream, and it found in water at
high concentrations, it will exist as these clusters. Photo-chemical transformation has
been proposed to be a possible transformation pathway of nC60 clusters. Our group first
reported that C60 underwent photochemical transformation in sunlight and under
simulated solar lamp lights [14]. The color of the nC60 suspensions transitioned from
yellow brown to light yellow, to nearly clear upon exposure to light for extended periods
74
of time (i.e., weeks). The process involves the photoexcitation from ground-state C60 to
singlet C60 (1C60 where one of the 60 carbons in the molecule has one electron in the
excited state), followed by the fast conversion of 1C60 to triplet C60 (3C60) by intersystem
crossing. Finally, 3C60 is quenched by O2 through energy transfer from 3C60 to O2,
resulting in the formation of the reactive oxygen species (ROS) singlet oxygen, 1O2 [15].
More work has been done in our group to show that ROS species (including
1O2 , O2∙− and ·OH) are formed upon irradiation of nC60 [14-16]. Lee et al. also
characterized major photochemical transformation products of nC60 under UVC (254
nm), mainly including water-soluble products with oxygen functional groups [18]. The
studies in which solar wavelength light has been used collectively suggest that photo-
transformation in sunlight is a potentially important process controlling the
environmental fate of C60, and that the photoproducts have properties distinct from the
original material.
One of the measurements not previously made on C60 photochemical
experiments under solar light conditions has been the determination of CO2 evolution to
indicate the degree of mineralization that may occur from direct photolysis of C60, alone.
Hou et al. [14]first suggested that C60 may undergo significant mineralization to CO2 by
monitoring the total organic carbon (TOC) concentration in 65 mg/L nC60 samples upon
exposure to lamp light (8 UVA lamps, that emit from 300 to 410 nm), with the TOC
decreasing from 65 mg/L to 11.3 mg/L after 65 days of continuous exposure. Other
studies have not been able to assess mineralization, mainly because the time period of
irradiation was relatively short, or the concentration of nC60 was too low to detect an
75
increase in CO2 above background [19, 20]. Su was the first to perform photo-
mineralization studies of nC60 clusters over long time periods, indicating some
mineralization did occur in sunlight [91]; however, these results were somewhat
ambiguous, as dark control samples also showed an increase in CO2 as a function of
time.
In this effort, the photochemical reaction of aqueous C60 clusters (Aqu/nC60),
was studied, focusing on mineralization to CO2, pH changes, and photoproduct
characterization under simulated sunlight irradiation conditions. This effort should help
to better understand the overall photochemical transformation process of nC60 in the
natural aqueous environments.
5.3 Materials and Methods
5.3.1 Materials
Sublimed C60 fullerene (99%) was purchased from the MER Corporation (Tucson,
AZ, USA). The 85% H3PO4 solution for acidification was obtained from Mallinchrodt
Chemicals. Toluene and methanol that were used for liquid chromatography were
HPLC grade with over 99.99% purity (Advantor Performance Materials Inc.,
Philipsburg, NJ). Other chemicals were of the highest purity available and used as
received. All aqueous samples were prepared using water produced by a Barnstead
Nanopure system (Dubuque, IA).
76
5.3.2 Aqu/nC60 Suspension Preparation
Aqu/nC60 clusters were prepared following a reported method [92]. Purchased C60
powder was pulverized using an agate mortar and pestle for around 10 min, producing a
fine black powder. The C60 pulverized power was added to water at a given mass to
volume ratio (i.e., C60 600 mg/L). The solution was sonicated in a bath sonicator
(Branson Ultrasonics Corporation, Danbury, CT) for approximately 5 hours, and then
mixed continuously for 10 days on an orbital shaker (New Brunswick Scientific Co., Inc.,
Edison, NJ) to obtain a relatively homogeneous Aqu/nC60 cluster suspension. After the
extensive mixing, the suspension was allowed to sit for 4 days to settle large particle
aggregates, and the supernatant (around 90% of the solution by volume) was removed
and stored in the dark when not in use. Filtration was not used, however the
concentration of this stock suspension was determined by HPLC to be 12.8 mg/L. The
stock suspension was buffered to pH 7 with a final concentration of 5 mM phosphate
buffer (the measured pH was 7.08).
For lamp light irradiation studies, 10 mL Aqu/nC60 stock solution subsamples
were placed in 16 mL borosilicate glass vials. These vials were tested and were shown
not to absorb solar-wavelength light. The headspace to liquid ratio was 3 to 5, to
ensure sufficient oxygen was available for complete oxidation of the C60 to CO2 to
theoretically occur. Each vial was sealed with a natural rubber sleeve stopper (13 × 20
mm I.D. × O.D., VWR Inc.) and two tight-ties (5.6”, VWR Inc.) to prevent gas leakage.
Samples were irradiated with sixteen 24 Watt black-light phosphor lamps (RPR-3500Å
lamps from Southern New England Ultraviolet, Branford, CT) that emit light from 300 to
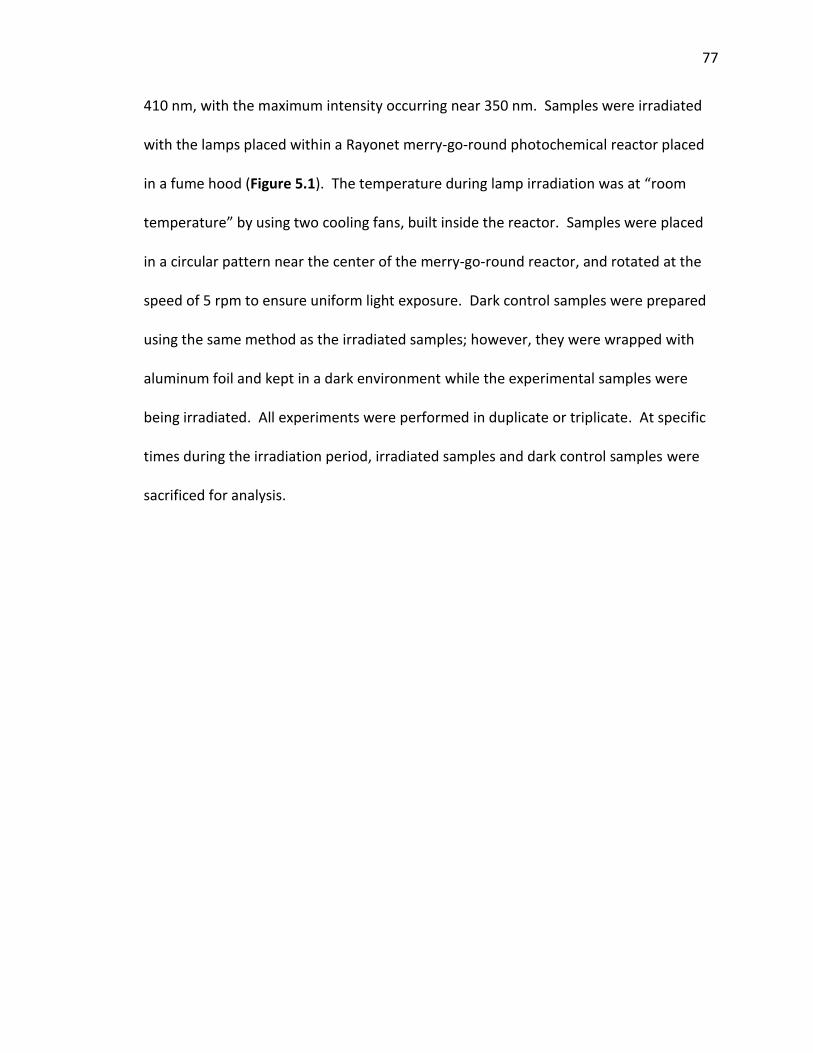
77
410 nm, with the maximum intensity occurring near 350 nm. Samples were irradiated
with the lamps placed within a Rayonet merry-go-round photochemical reactor placed
in a fume hood (Figure 5.1). The temperature during lamp irradiation was at “room
temperature” by using two cooling fans, built inside the reactor. Samples were placed
in a circular pattern near the center of the merry-go-round reactor, and rotated at the
speed of 5 rpm to ensure uniform light exposure. Dark control samples were prepared
using the same method as the irradiated samples; however, they were wrapped with
aluminum foil and kept in a dark environment while the experimental samples were
being irradiated. All experiments were performed in duplicate or triplicate. At specific
times during the irradiation period, irradiated samples and dark control samples were
sacrificed for analysis.
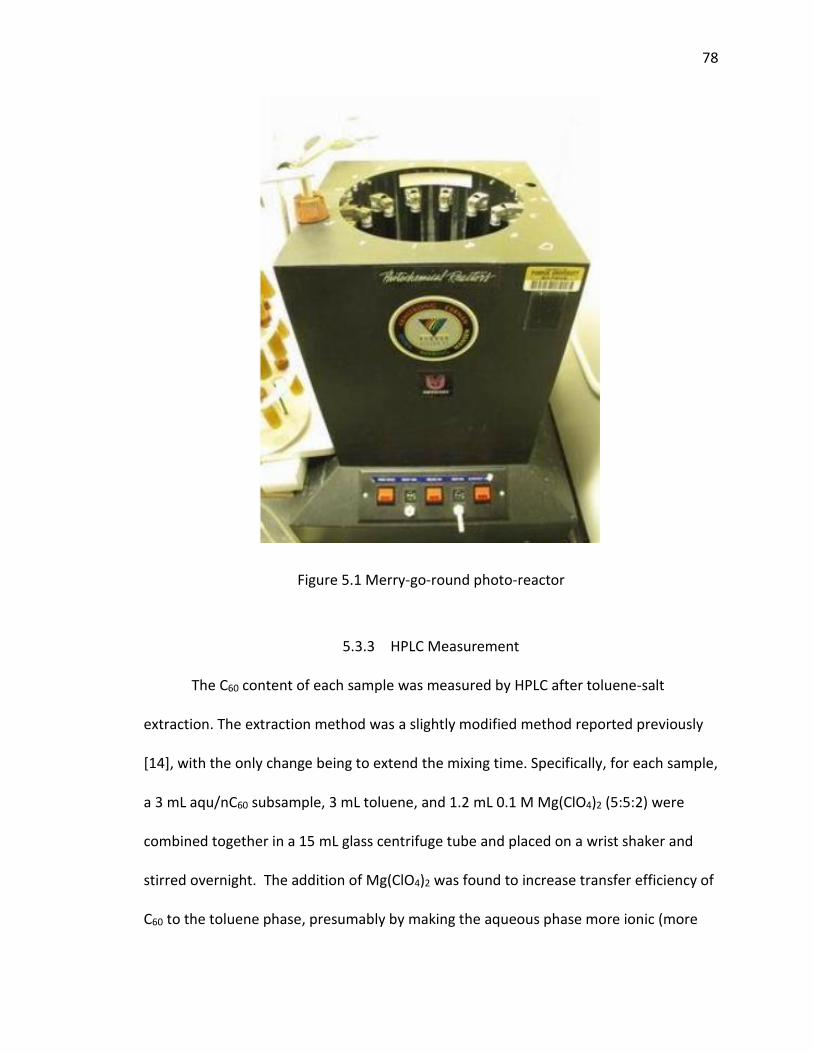
78
Figure 5.1 Merry-go-round photo-reactor
5.3.3 HPLC Measurement
The C60 content of each sample was measured by HPLC after toluene-salt
extraction. The extraction method was a slightly modified method reported previously
[14], with the only change being to extend the mixing time. Specifically, for each sample,
a 3 mL aqu/nC60 subsample, 3 mL toluene, and 1.2 mL 0.1 M Mg(ClO4)2 (5:5:2) were
combined together in a 15 mL glass centrifuge tube and placed on a wrist shaker and
stirred overnight. The addition of Mg(ClO4)2 was found to increase transfer efficiency of
C60 to the toluene phase, presumably by making the aqueous phase more ionic (more
79
hydrophilic). The C60 concentrations in the toluene extracts were determined by HPLC
analysis using a Cosmosil Buckprep column and photodiode array (PDA) detector,
monitoring absorbance at 336 nm. Pure toluene (HPLC grade) was used as the mobile
phase at a flow rate of 1 mL/min. The run time was 12 min and the injection volume was
100 μL.
5.3.4 UV-Vis spectroscopy and pH measurement
The UV-visible light absorbance spectra were recorded with a Varian Cary 50
UV/Vis
Spectrophotometer using quartz cuvettes with 1 cm path lengths. The pH value of all
samples were measured with an Accumet 925 pH/ion Meter (Fisher Scientific Inc.).
5.3.5 Headspace CO2 measurement
After irradiation or incubation in the dark, all samples were acidified before
analyzing the CO2 content in the headspace. The purpose of acidification was to
decrease the pH so that the total inorganic carbon (TIC) was essentially all CO2 under
equilibrium conditions at low pH (eq 5.1).
𝐻2𝐶𝑂3⇔𝐻+ + 𝐻𝐶𝑂3−; 𝐻𝐶𝑂3
−⇔𝐻+ + 𝐶𝑂32− eq 5.1
Below pH 3, essentially all the inorganic carbon in the samples exists as CO2 either in the
aqueous phase (CO2,aq) or in the headspace (CO2,g). Henry’s constant (𝐾𝐻 =𝐶𝑂2,𝑎𝑞
𝐶𝑂2,𝑔 )can
80
be applied to calculated the distribution of CO2,aq and CO2,g. Once the gas phase CO2
concentration has been measured, the total inorganic carbon (TIC) in the sample can be
calculated by adding the amount of CO2 measured in the gas phase to the amount
calculated in the aqueous phase (calculated by Henry’s constant).
For acidification, concentrated H3PO4 (60 μL/10mL) was injected into each vial.
Then samples were placed on a vortex mixer for 5 minutes. To ensure complete
equilibrium was achieved, the acidified samples were stored in the dark overnight
before performing headspace analysis. An overpressure method (OPM) was applied
when removing headspace gas for analysis, by first adding 3 mL of pure nitrogen gas to
the headspace, followed by immediately removing 3 mL from the headspace, to ensure
pressure equalization of the syringe needle with the surrounding air upon removal of
the needle from the tube septa. The added volume of gas was accounted for in mass
calculations. The CO2 in the headspace was measured using a PDZ-Europa trace gas
analyzer in conjunction with a 20/20 PDZ-Europa isotope ratio mass spectrometer.
More details regarding the methods can be found in Su’s master’s thesis [91].
5.4 Results and Discussion
C60 concentrations were measured by HPLC in samples at specific times after
initiating irradiation (Figure 5.2). HPLC analysis of samples revealed an obvious
response at a retention time of approximately 8.5 min, measuring absorbance at 336
nm [93]. As reported previously, this peak corresponds to molecular C60. In the
irradiated samples, the C60 concentration decreased rapidly, with greater than 70% of
81
original C60 response lost after 15 days of irradiation. This result is consistent with
studies by Hou et al. [14] which also showed a significant loss over time. One study has
suggested that much of the loss may be due to a decreasing extraction efficiency as
intermediate products are generated over time, decreasing the extraction efficiency of
any remaining C60 remaining in the clusters [20]. However, Hou has clearly shown this is
not the case for the nC60 clusters he used (prepared with tetrahydrofuran (THF), and
subsequently concluded at the addition of Mg(ClO4)2 to Aqu/nC60 also resulted in nearly
complete extraction of the molecular C60 to the toluene phase. Additional peaks
appeared on the chromatograms at retention times of 2 to 3 min after 15-days of
irradiation, indicating potential organic intermediate products of C60 were accumulating.
The dark control samples were almost the same over the entire incubation period,
indicating the stability of C60 in the dark over this time period.
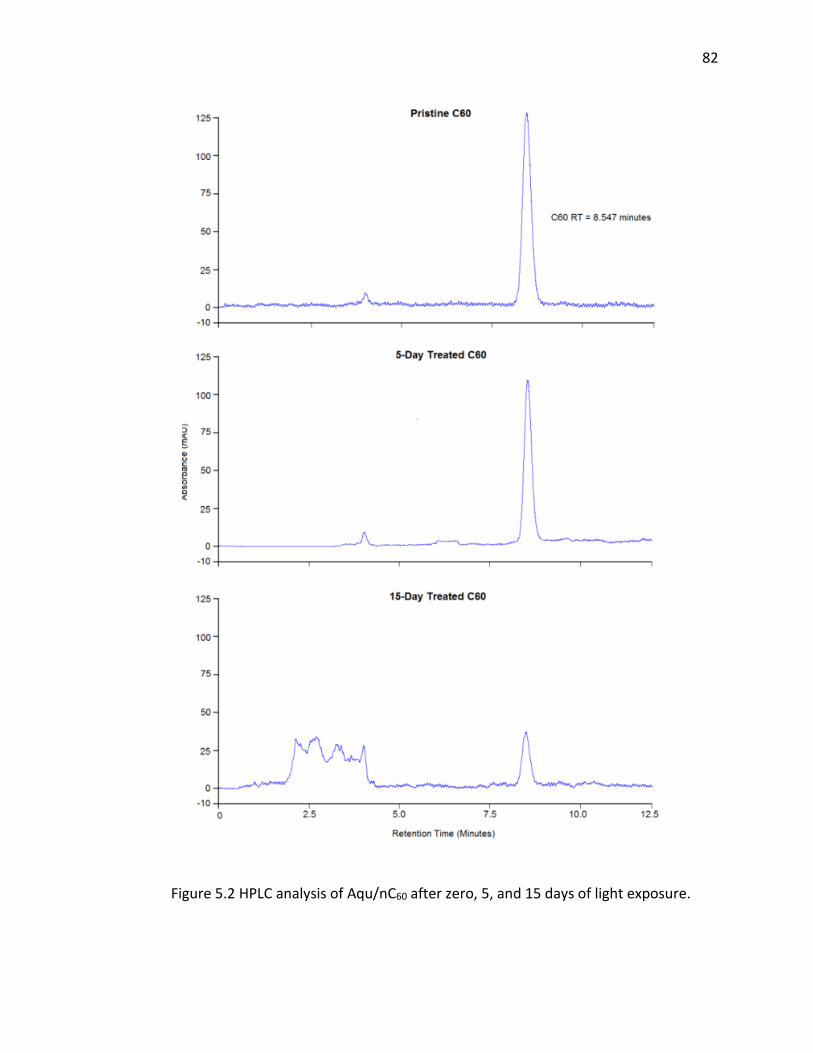
82
Figure 5.2 HPLC analysis of Aqu/nC60 after zero, 5, and 15 days of light exposure.
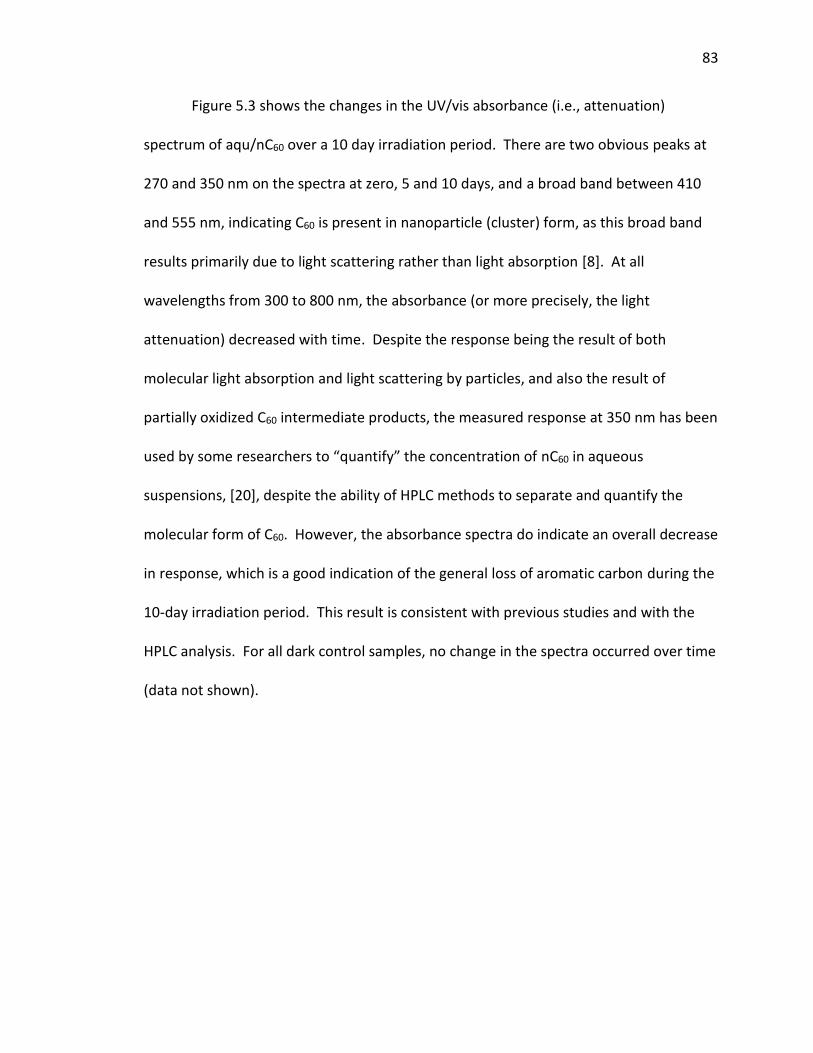
83
Figure 5.3 shows the changes in the UV/vis absorbance (i.e., attenuation)
spectrum of aqu/nC60 over a 10 day irradiation period. There are two obvious peaks at
270 and 350 nm on the spectra at zero, 5 and 10 days, and a broad band between 410
and 555 nm, indicating C60 is present in nanoparticle (cluster) form, as this broad band
results primarily due to light scattering rather than light absorption [8]. At all
wavelengths from 300 to 800 nm, the absorbance (or more precisely, the light
attenuation) decreased with time. Despite the response being the result of both
molecular light absorption and light scattering by particles, and also the result of
partially oxidized C60 intermediate products, the measured response at 350 nm has been
used by some researchers to “quantify” the concentration of nC60 in aqueous
suspensions, [20], despite the ability of HPLC methods to separate and quantify the
molecular form of C60. However, the absorbance spectra do indicate an overall decrease
in response, which is a good indication of the general loss of aromatic carbon during the
10-day irradiation period. This result is consistent with previous studies and with the
HPLC analysis. For all dark control samples, no change in the spectra occurred over time
(data not shown).
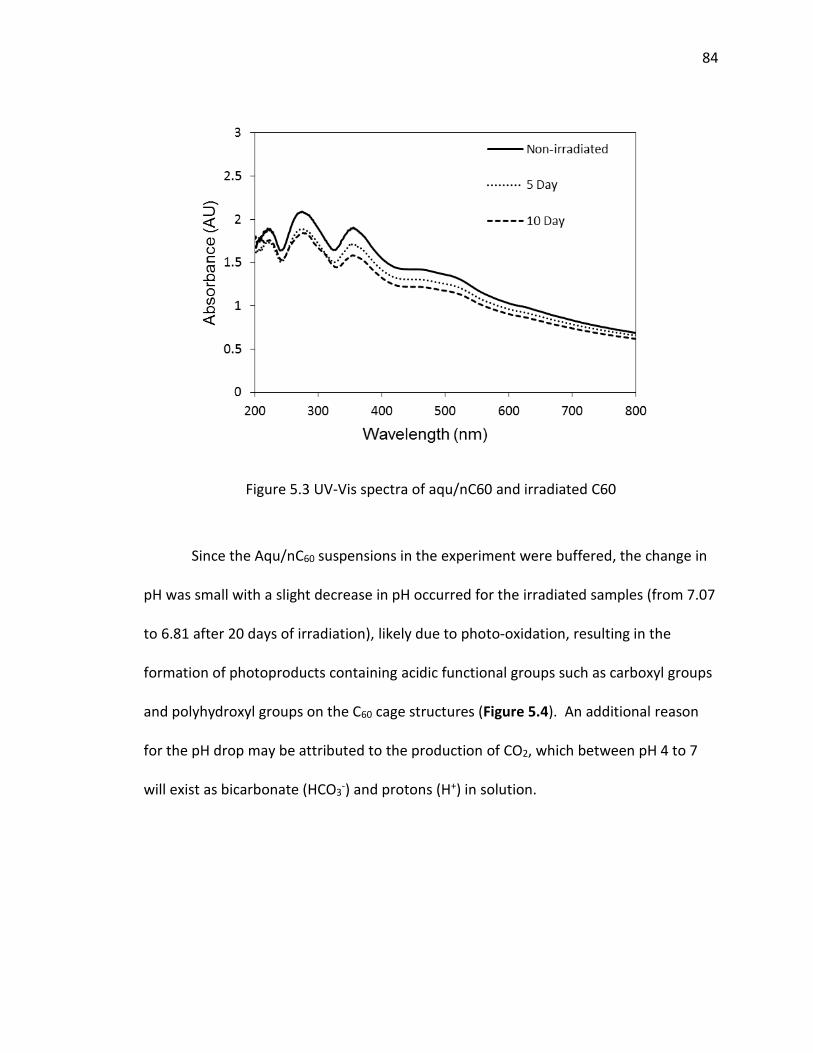
84
Figure 5.3 UV-Vis spectra of aqu/nC60 and irradiated C60
Since the Aqu/nC60 suspensions in the experiment were buffered, the change in
pH was small with a slight decrease in pH occurred for the irradiated samples (from 7.07
to 6.81 after 20 days of irradiation), likely due to photo-oxidation, resulting in the
formation of photoproducts containing acidic functional groups such as carboxyl groups
and polyhydroxyl groups on the C60 cage structures (Figure 5.4). An additional reason
for the pH drop may be attributed to the production of CO2, which between pH 4 to 7
will exist as bicarbonate (HCO3-) and protons (H+) in solution.
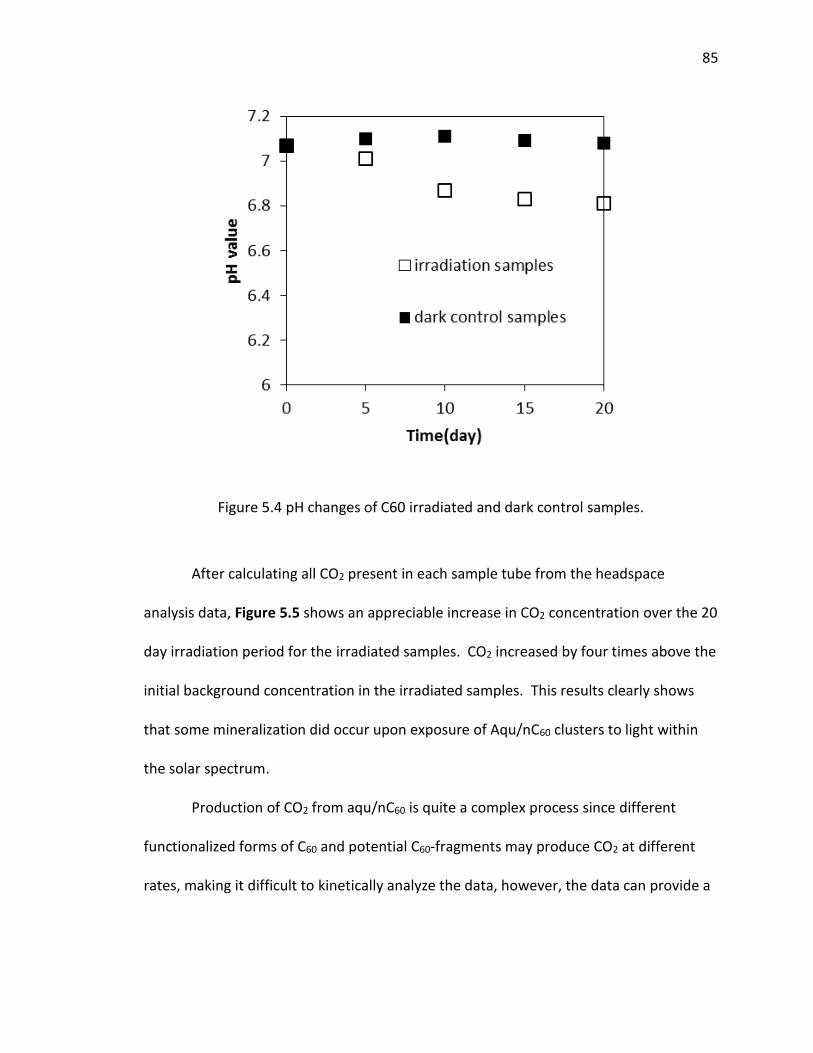
85
Figure 5.4 pH changes of C60 irradiated and dark control samples.
After calculating all CO2 present in each sample tube from the headspace
analysis data, Figure 5.5 shows an appreciable increase in CO2 concentration over the 20
day irradiation period for the irradiated samples. CO2 increased by four times above the
initial background concentration in the irradiated samples. This results clearly shows
that some mineralization did occur upon exposure of Aqu/nC60 clusters to light within
the solar spectrum.
Production of CO2 from aqu/nC60 is quite a complex process since different
functionalized forms of C60 and potential C60-fragments may produce CO2 at different
rates, making it difficult to kinetically analyze the data, however, the data can provide a
86
good estimate on the temporal mass balance conversion of parent C60 to the final
product, CO2. Because each sample initially contained 12.8 mg/L C60, the initial total
organic carbon mass in each tube as 10.7 moles. Hence, with a net increase in CO2 of
0.08 moles, approximately 7% of the C60 carbon had been mineralized after 20 days of
constant light exposure.
Figure 5.5 CO2 measurements as a function of time.
Tables 5.1 and 5.2 show the details regarding the calculated mass recoveries of
inorganic carbon in the headspace and aqueous phase. Because the CO2 concentration
is diluted during the over-pressurization step, the final concentration is adjusted by
multiplying by 3/2 using the following equation:
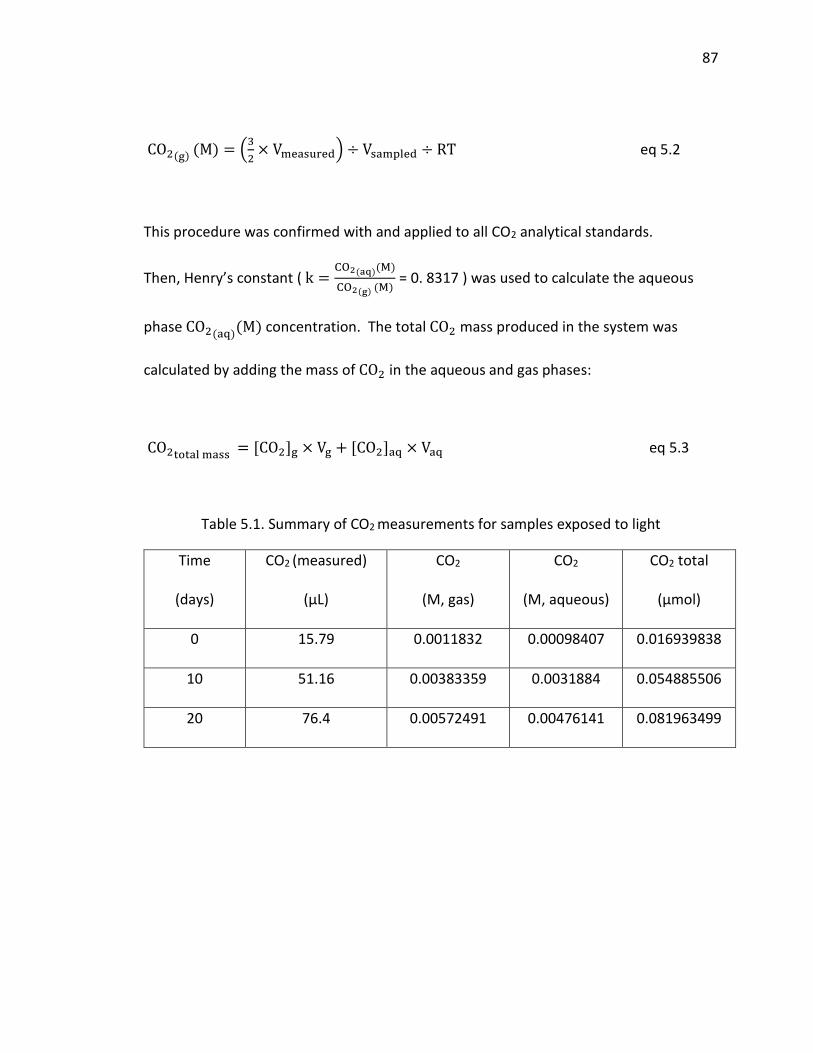
87
CO2(g) (M) = (3
2× Vmeasured) ÷ Vsampled ÷ RT eq 5.2
This procedure was confirmed with and applied to all CO2 analytical standards.
Then, Henry’s constant ( k =CO2(aq)(M)
CO2(g) (M) = 0. 8317 ) was used to calculate the aqueous
phase CO2(aq)(M) concentration. The total CO2 mass produced in the system was
calculated by adding the mass of CO2 in the aqueous and gas phases:
CO2total mass = [CO2]g × Vg + [CO2]aq × Vaq eq 5.3
Table 5.1. Summary of CO2 measurements for samples exposed to light
Time
(days)
CO2 (measured)
(μL)
CO2
(M, gas)
CO2
(M, aqueous)
CO2 total
(μmol)
0 15.79 0.0011832 0.00098407 0.016939838
10 51.16 0.00383359 0.0031884 0.054885506
20 76.4 0.00572491 0.00476141 0.081963499
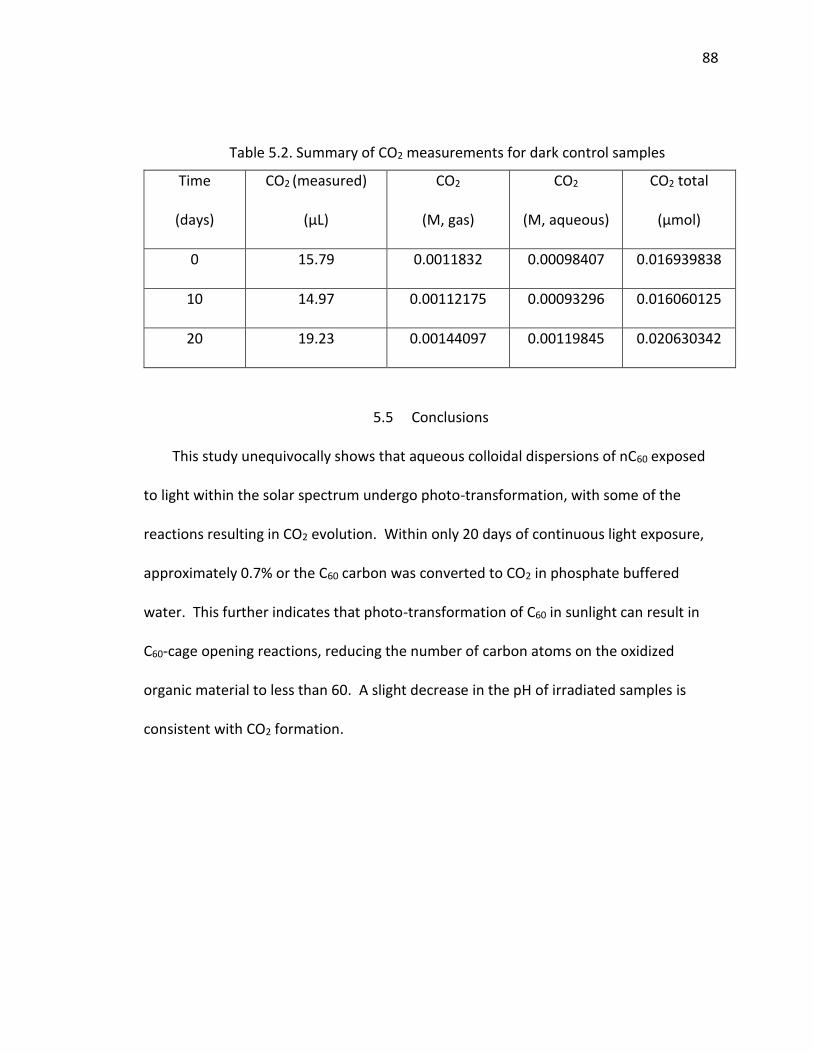
88
Table 5.2. Summary of CO2 measurements for dark control samples
Time
(days)
CO2 (measured)
(μL)
CO2
(M, gas)
CO2
(M, aqueous)
CO2 total
(μmol)
0 15.79 0.0011832 0.00098407 0.016939838
10 14.97 0.00112175 0.00093296 0.016060125
20 19.23 0.00144097 0.00119845 0.020630342
5.5 Conclusions
This study unequivocally shows that aqueous colloidal dispersions of nC60 exposed
to light within the solar spectrum undergo photo-transformation, with some of the
reactions resulting in CO2 evolution. Within only 20 days of continuous light exposure,
approximately 0.7% or the C60 carbon was converted to CO2 in phosphate buffered
water. This further indicates that photo-transformation of C60 in sunlight can result in
C60-cage opening reactions, reducing the number of carbon atoms on the oxidized
organic material to less than 60. A slight decrease in the pH of irradiated samples is
consistent with CO2 formation.
89
CHAPTER 6. OVERALL SUMMARY AND RECOMMENDATION
6.1 Summary
This study focused on photochemistry and light-independent reactions of carbon-
based nanomaterials (i.e. C60 and graphene oxide), as environmental processes could
significantly affect the environmental fate and transport of these materials in the
aquatic environment. Similar research reports and papers focusing on the
environmental fate, transport, and toxicity of these carbon nanomaterials is few
compared to studies on the potential applications of them. The data presented in this
thesis shows for the first time: (i) Photo-mineralization of aqueous nC60 occurs. This
work on CO2 generation recently was included in a paper authored by Berry et al [94]
that included the author of this dissertation as a coauthor for this contribution. (ii)
Under sunlight, GO dispersed in water results in significant ROS formation, with
chemical changes occurring on the GO surface. This work on the photochemistry of GO
was recently published with the author of this dissertation as the first author [66]. (iii)
Chemically mediated reduction reactions of aqueous suspensions of single-layered GO
lead to the production of ROS in oxygenated water. The data presented on ROS
generation by GO under sunlight conditions, and under dark reducing conditions, should
inform regulators and policymakers regarding potential environmental impacts of GO.
90
First, by measuring reactive oxygen species (ROS), the photochemical
transformation of single-layered GO under lamps that only emit light in the solar
spectrum (λ =350 ± 50 nm) was investigated. ROS including superoxide radical anion
(O2·−) and hydrogen peroxide (H2O2) were found to be produced under oxic conditions.
Raman Spectra measurements, indicated in increase in the ratio of the ID/IG absorption
bands, suggesting the GO was becoming more reduced. UV-visible absorption spectra
measurements also indicated that GO was undergoing reduction, and the changes in the
spectra obviously were consistent with visible color changes to the GO suspension (i.e.,
from pale to dark brown).
Second, the light-independent reaction of graphene oxide with β-nicotinamide
adenine dinucleotide (NADH) in water was examined. In GO suspensions, oxidation of
NADH to NAD+, evidenced by the decreased intensity of the 340 nm absorption band of
NADH and the increased intensity of the 260 nm absorption band of NAD+. In the
presence of NADH, GO acted as an electron shuttle in water to produce reactive oxygen
species (ROS) by accepting electrons from NADH, transferring these electrons to
molecular oxygen. The production of superoxide anion radical was confirmed by using
tetrazolium salts (NBT2+ and XTT) as scavengers. A DPD/HRP assay was used to detect
H2O2, and was shown to accumulate over time. In GO suspensions containing NADH and
O2, cleavage of the pBR322 DNA plasmid occurred, in spite of finding no detectable ·OH.
Third, the reaction of GO with hydroxyl radicals, produced from the photolytic
cleavage of H2O2 under simulated sunlight was studied. In the presence of 100 mM
H2O2 and light, GO decomposition was evident by following the change in the light
91
attenuation spectra with the UV and visible regions, and also by simple visual changes in
the suspension color. It may be deduced that significant mineralization of GO occurred,
as evidenced by the decrease in the total organic carbon (TOC) content. This research
study indicates that photochemical transformation is likely a significant reaction
pathway for GO in surface waters. This study also provided insight into potential ways of
degrading GO, or even completely mineralizing it, through the use of UV/H2O2 advanced
oxidation methods in wastewater treatment systems.
Finally, mineralization of C60 carbon in aqueous dispersion of aqu/nC60 clusters
was found to occur by simple exposure to light within the solar spectrum. The volume of
CO2 in the headspace increased for light irradiated samples, while the CO2 content in the
dark control samples stayed almost the same. After 20 days under continuous light
exposure approximately 0.7% of the initial C60 carbon was converted to CO2.
6.2 Recommendations
To better understand the mineralization process of aqu/nC60 clusters under
sunlight exposure, 13C labeled C60 should be used. The 13C/12C ratio would further
confirm that the measured CO2 was derived from C60.
Graphene oxide (GO) is usually prepared by a modified Hummer’s method.
However, even a small change in the procedure can make a large difference in the
properties of the GO product with respect to the content of the specific number and
types of functional groups. In the future studies, different types of GO (with different
functional group content) could be studied to more completely understand the fate and
92
reactivity of GO in the environment. Using this approach, the environmental chemistry
of GO, and potentially other functionalized nanomaterials, will be better understood,
including how the weathering of GO proceeds in the environment. Considering that
graphene oxide currently is used for industry processes, it is expected that it, and
materials that contain it, will be eventually disposed in landfills. In landfills, the
environment is considerably different that those environmental conditions studied here.
For example, reduced conditions over a wide range of pH conditions may occur. Thus, is
critical that reactions involving GO under many other environmental conditions (i.e.,
landfills, sediments, soils, etc.) be explored to identify environmental compartments
were GO may be more problematic. In Chapter 3, GO was found to induce DNA damage
by producing reactive oxygen species (ROS) in the absence of light, but in the presence
of a well-known biological reducing agent (NADH). Addition work such as this on the
mechanisms of potential adverse biological effects at the molecular level within cells is
warranted.

8
REFERENCES
93
REFERENCES
1. Diederich F, Whetten RL: Beyond C60: the higher fullerenes. Accounts of chemical research 1992, 25(3):119-126.
2. Murayama H, Tomonoh S, Alford JM, Karpuk ME: Fullerene production in tons
and more: from science to industry. Fullerenes, Nanotubes and Carbon Nanostructures 2005, 12(1-2):1-9.
3. Mauter MS, Elimelech M: Environmental applications of carbon-based
nanomaterials. Environmental Science & Technology 2008, 42(16):5843-5859. 4. Osawa E: Perspectives of fullerene nanotechnology: Springer Science & Business
Media; 2002. 5. Heymann D: Solubility of fullerenes C60 and C70 in seven normal alcohols and
their deduced solubility in water. Fullerene Science & Technology 1996, 4(3):509-515.
6. Jafvert CT, Kulkarni PP: Buckminsterfullerene’s (C60) octanol− water partition
coefficient (K ow) and aqueous solubility. Environmental science & technology 2008, 42(16):5945-5950.
7. Deguchi S, Alargova RG, Tsujii K: Stable dispersions of fullerenes, C60 and C70,
in water. Preparation and characterization. Langmuir 2001, 17(19):6013-6017. 8. Fortner J, Lyon D, Sayes C, Boyd A, Falkner J, Hotze E, Alemany L, Tao Y, Guo W,
Ausman K: C60 in water: nanocrystal formation and microbial response. Environmental Science & Technology 2005, 39(11):4307-4316.
94
9. Andrievsky GV, Kosevich MV, Vovk M, Shelkovsky VS, Vashchenko LA: On the production of an aqueous colloidal solution of fullerenes. J Chem Soc, Chem Commun 1995(12):1281-1282.
10. Kroto HW, Heath JR, O'Brien SC, Curl RF, Smalley RE: C 60: buckminsterfullerene.
Nature 1985, 318(6042):162-163. 11. Dhawan A, Taurozzi JS, Pandey AK, Shan W, Miller SM, Hashsham SA, Tarabara
VV: Stable colloidal dispersions of C60 fullerenes in water: evidence for genotoxicity. Environmental science & technology 2006, 40(23):7394-7401.
12. Oberdörster E: Manufactured nanomaterials (fullerenes, C60) induce oxidative
stress in the brain of juvenile largemouth bass. Environmental health perspectives 2004, 112(10):1058.
13. Sayes CM, Fortner JD, Guo W, Lyon D, Boyd AM, Ausman KD, Tao YJ, Sitharaman
B, Wilson LJ, Hughes JB: The differential cytotoxicity of water-soluble fullerenes. Nano letters 2004, 4(10):1881-1887.
14. Hou W-C, Jafvert CT: Photochemical transformation of aqueous C60 clusters in
sunlight. Environmental science & technology 2009, 43(2):362-367. 15. Hou W-C, Jafvert CT: Photochemistry of aqueous C60 clusters: evidence of 1O2
formation and its role in mediating C60 phototransformation. Environmental science & technology 2009, 43(14):5257-5262.
16. Hou W-C, Kong L, Wepasnick KA, Zepp RG, Fairbrother DH, Jafvert CT:
Photochemistry of aqueous C60 clusters: wavelength dependency and product characterization. Environmental science & technology 2010, 44(21):8121-8127.
17. Arbogast JW, Darmanyan AP, Foote CS, Diederich FN, Whetten R, Rubin Y,
Alvarez MM, Anz SJ: Photophysical properties of sixty atom carbon molecule (C60). The Journal of Physical Chemistry 1991, 95(1):11-12.
95
18. Lee J, Cho M, Fortner JD, Hughes JB, Kim J-H: Transformation of aggregated C60 in the aqueous phase by UV irradiation. Environmental science & technology 2009, 43(13):4878-4883. 19. Hartmann NB, Buendia IM, Bak J, Baun A: Degradability of aged aquatic
suspensions of C< sub> 60</sub> nanoparticles. Environmental Pollution 2011, 159(10):3134-3137.
20. Hwang YS, Li Q: Characterizing photochemical transformation of aqueous nC60
under environmentally relevant conditions. Environmental science & technology 2010, 44(8):3008-3013.
21. Dreyer DR, Park S, Bielawski CW, Ruoff RS: The chemistry of graphene oxide.
Chemical Society Reviews 2010, 39(1):228-240. 22. Barroso-Bujans F, Cerveny S, Verdejo R, del Val J, Alberdi J, Alegría A, Colmenero
J: Permanent adsorption of organic solvents in graphite oxide and its effect on the thermal exfoliation. Carbon 2010, 48(4):1079-1087.
23. Jung JH, Cheon DS, Liu F, Lee KB, Seo TS: A Graphene Oxide Based Immuno‐
biosensor for Pathogen Detection. Angewandte Chemie International Edition 2010, 49(33):5708-5711.
24. Lightcap IV, Kosel TH, Kamat PV: Anchoring semiconductor and metal
nanoparticles on a two-dimensional catalyst mat. storing and shuttling electrons with reduced graphene oxide. Nano letters 2010, 10(2):577-583.
25. Song Y, Qu K, Zhao C, Ren J, Qu X: Graphene oxide: intrinsic peroxidase catalytic
activity and its application to glucose detection. Advanced Materials 2010, 22(19):2206-2210.
26. Sun X, Liu Z, Welsher K, Robinson JT, Goodwin A, Zaric S, Dai H: Nano-graphene
oxide for cellular imaging and drug delivery. Nano research 2008, 1(3):203-212.
96
27. Yang K, Wan J, Zhang S, Tian B, Zhang Y, Liu Z: The influence of surface chemistry and size of nanoscale graphene oxide on photothermal therapy of cancer using ultra-low laser power. Biomaterials 2012, 33(7):2206-2214.
28. Liu J-Y, Bai Y, Luo P-Y, Wang P-Q: One-pot synthesis of graphene–BiOBr
nanosheets composite for enhanced photocatalytic generation of reactive oxygen species. Catalysis Communications 2013, 42:58-61.
29. Morales-Torres S, Pastrana-Martínez LM, Figueiredo JL, Faria JL, Silva AM: Design
of graphene-based TiO2 photocatalysts—a review. Environmental Science and Pollution Research 2012, 19(9):3676-3687.
30. Moon G-h, Kim D-h, Kim H-i, Bokare AD, Choi W: Platinum-like behavior of
reduced graphene oxide as a cocatalyst on TiO2 for the efficient photocatalytic oxidation of arsenite. Environmental Science & Technology Letters 2014, 1(2):185-190.
31. Akhavan O, Ghaderi E: Toxicity of graphene and graphene oxide nanowalls
against bacteria. Acs Nano 2010, 4(10):5731-5736. 32. Liao K-H, Lin Y-S, Macosko CW, Haynes CL: Cytotoxicity of graphene oxide and
graphene in human erythrocytes and skin fibroblasts. ACS applied materials & interfaces 2011, 3(7):2607-2615.
33. Wang K, Ruan J, Song H, Zhang J, Wo Y, Guo S, Cui D: Biocompatibility of
graphene oxide. Nanoscale Res Lett 2011, 6(8). 34. Hu W, Peng C, Lv M, Li X, Zhang Y, Chen N, Fan C, Huang Q: Protein corona-
mediated mitigation of cytotoxicity of graphene oxide. Acs Nano 2011, 5(5):3693-3700.
35. Chang Y, Yang S-T, Liu J-H, Dong E, Wang Y, Cao A, Liu Y, Wang H: In vitro toxicity
evaluation of graphene oxide on A549 cells. Toxicology letters 2011, 200(3):201-210.
97
36. Guardia L, Villar-Rodil S, Paredes J, Rozada R, Martínez-Alonso A, Tascón J: UV light exposure of aqueous graphene oxide suspensions to promote their direct reduction, formation of graphene–metal nanoparticle hybrids and dye degradation. Carbon 2012, 50(3):1014-1024.
37. Kim SR, Parvez MK, Chhowalla M: UV-reduction of graphene oxide and its
application as an interfacial layer to reduce the back-transport reactions in dye-sensitized solar cells. Chemical Physics Letters 2009, 483(1):124-127.
38. Matsumoto Y, Koinuma M, Ida S, Hayami S, Taniguchi T, Hatakeyama K, Tateishi
H, Watanabe Y, Amano S: Photoreaction of graphene oxide nanosheets in water. The Journal of Physical Chemistry C 2011, 115(39):19280-19286.
39. Hou W-C, Chowdhury I, Goodwin Jr DG, Henderson WM, Fairbrother DH,
Bouchard D, Zepp RG: Photochemical transformation of graphene oxide in sunlight. Environmental science & technology 2015, 49(6):3435-3443.
40. Chowdhury I, Hou W-C, Goodwin D, Henderson M, Zepp RG, Bouchard D:
Sunlight affects aggregation and deposition of graphene oxide in the aquatic environment. Water research 2015, 78:37-46.
41. Chowdhury I, Mansukhani ND, Guiney LM, Hersam MC, Bouchard D: Aggregation
and Stability of Reduced Graphene Oxide: Complex Roles of Divalent Cations, pH, and Natural Organic Matter. Environmental science & technology 2015, 49(18):10886-10893.
42. McCreery RL: Advanced carbon electrode materials for molecular
electrochemistry. Chem Rev 2008, 108(7):2646-2687. 43. Dumitrescu I, Unwin PR, Macpherson JV: Electrochemistry at carbon nanotubes:
perspective and issues. Chemical Communications 2009(45):6886-6901. 44. Tang L, Wang Y, Li Y, Feng H, Lu J, Li J: Preparation, structure, and
electrochemical properties of reduced graphene sheet films. Advanced Functional Materials 2009, 19(17):2782-2789.
98
45. Shao Y, Wang J, Wu H, Liu J, Aksay IA, Lin Y: Graphene based electrochemical sensors and biosensors: a review. Electroanalysis 2010, 22(10):1027-1036. 46. Geim AK, Novoselov KS: The rise of graphene. Nature materials 2007, 6(3):183-
191. 47. Geim AK: Graphene: status and prospects. science 2009, 324(5934):1530-1534. 48. Wang X, Zhi L, Müllen K: Transparent, conductive graphene electrodes for dye-
sensitized solar cells. Nano letters 2008, 8(1):323-327. 49. Bitter JL, Yang J, BeigzadehMilani S, Jafvert CT, Fairbrother DH: Transformations
of oxidized multiwalled carbon nanotubes exposed to UVC (254 nm) irradiation. Environ Sci Nano 2014, 1:324-337.
50. Chen C-Y, Jafvert CT: Photoreactivity of Carboxylated Single-Walled Carbon
Nanotubes in Sunlight: Reactive Oxygen Species Production in Water. Environmental Science & Technology 2010, 44(17):6674-6679.
51. Chen C-Y, Jafvert CT: The role of surface functionalization in the solar light-
induced production of reactive oxygen species by single-walled carbon nanotubes in water. Carbon 2011, 49(15):5099-5106.
52. Haag WR, Hoigne J: Singlet oxygen in surface waters. 3. Photochemical
formation and steady-state concentrations in various types of waters. Environmental science & technology 1986, 20(4):341-348.
53. Bader H, Sturzenegger V, Hoigne J: Photometric method for the determination
of low concentrations of hydrogen peroxide by the peroxidase catalyzed oxidation of N, N-diethyl-< i> p</i>-phenylenediamine (DPD). Water Research 1988, 22(9):1109-1115.
99
54. Hou X-L, Li J-L, Drew SC, Tang B, Sun L, Wang X-G: Tuning radical species in graphene oxide in aqueous solution by photoirradiation. The Journal of Physical Chemistry C 2013, 117(13):6788-6793.
55. Paredes J, Villar-Rodil S, Martinez-Alonso A, Tascon J: Graphene oxide
dispersions in organic solvents. Langmuir 2008, 24(19):10560-10564. 56. Radich JG, Kamat PV: Making graphene holey. Gold-nanoparticle-mediated
hydroxyl radical attack on reduced graphene oxide. ACS nano 2013, 7(6):5546-5557.
57. Dresselhaus MS, Jorio A, Hofmann M, Dresselhaus G, Saito R: Perspectives on
carbon nanotubes and graphene Raman spectroscopy. Nano letters 2010, 10(3):751-758.
58. Eda G, Chhowalla M: Chemically Derived Graphene Oxide: Towards Large‐Area
Thin‐Film Electronics and Optoelectronics. Advanced Materials 2010, 22(22):2392-2415.
59. Hou W-C, BeigzadehMilani S, Jafvert CT, Zepp RG: Photoreactivity of
Unfunctionalized Single-Walled Carbon Nanotubes Involving Hydroxyl Radical: Chiral Dependency and Surface Coating Effect. Environ Sci Technol 2014, 48:3875-3882.
60. Hsieh H-S, Wu R, Jafvert CT: Light-independent reactive oxygen species (ROS)
formation through electron transfer from carboxylated single-walled carbon nanotubes in water. Environmental science & technology 2014, 48(19):11330-11336.
61. Novoselov KS, Geim AK, Morozov S, Jiang D, Zhang Y, Dubonos S, Grigorieva I,
Firsov A: Electric field effect in atomically thin carbon films. science 2004, 306(5696):666-669.
100
62. Liu Z, Robinson JT, Sun X, Dai H: PEGylated nanographene oxide for delivery of water-insoluble cancer drugs. Journal of the American Chemical Society 2008, 130(33):10876-10877.
63. Pyun J: Graphene oxide as catalyst: application of carbon materials beyond
nanotechnology. Angewandte Chemie International Edition 2011, 50(1):46-48. 64. Wang K, Ruan J, Song H, Zhang J, Wo Y, Guo S, Cui D: Biocompatibility of
graphene oxide. Nanoscale Res Lett 2011, 6(8):1. 65. Zhang L, Li Y, Zhang L, Li D-W, Karpuzov D, Long Y-T: Electrocatalytic oxidation of
NADH on graphene oxide and reduced graphene oxide modified screen-printed electrode. Int J Electrochem Sci 2011, 6(3):819-829.
66. Zhao Y, Jafvert CT: Environmental photochemistry of single layered graphene
oxide in water. Environmental Science: Nano 2015, 2(2):136-142. 67. Bartosz G: Use of spectroscopic probes for detection of reactive oxygen species.
Clinica Chimica Acta 2006, 368(1):53-76. 68. Sutherland MW, Learmonth BA: The tetrazolium dyes MTS and XTT provide new
quantitative assays for superoxide and superoxide dismutase. Free radical research 1997, 27(3):283-289.
69. Baumgarten B, Hones J: Spectroscopic investigation of dihydronicotinamides‐II.
dihydronicotinamide adenine dinucleotide complexes with dehydrogenases. Photochemistry and photobiology 1988, 47(2):201-205.
70. Fisher P, Fleckenstein J, Hönes J: Spectroscopic investigation of
dihydronicotinamides‐I: conformation, absorption, and fluorescence. Photochemistry and photobiology 1988, 47(2):193-199.
101
71. Fu H, Zhu D: Graphene oxide-facilitated reduction of nitrobenzene in sulfide-containing aqueous solutions. Environmental science & technology 2013, 47(9):4204-4210.
72. Zuo Y, Hoigne J: Formation of hydrogen peroxide and depletion of oxalic acid in
atmospheric water by photolysis of iron (III)-oxalato complexes. Environmental Science & Technology 1992, 26(5):1014-1022.
73. Pogozelski WK, Tullius TD: Oxidative strand scission of nucleic acids: routes
initiated by hydrogen abstraction from the sugar moiety. Chemical reviews 1998, 98(3):1089-1108.
74. Chevion M: A site-specific mechanism for free radical induced biological
damage: the essential role of redox-active transition metals. Free Radical Biology and Medicine 1988, 5(1):27-37.
75. Cooke MS, Evans MD, Dizdaroglu M, Lunec J: Oxidative DNA damage:
mechanisms, mutation, and disease. The FASEB Journal 2003, 17(10):1195-1214. 76. Dikin DA, Stankovich S, Zimney EJ, Piner RD, Dommett GH, Evmenenko G,
Nguyen ST, Ruoff RS: Preparation and characterization of graphene oxide paper. Nature 2007, 448(7152):457-460.
77. Williams G, Kamat PV: Graphene− semiconductor nanocomposites: excited-
state interactions between ZnO nanoparticles and graphene oxide†. Langmuir 2009, 25(24):13869-13873.
78. Krishnamurthy S, Lightcap IV, Kamat PV: Electron transfer between methyl
viologen radicals and graphene oxide: Reduction, electron storage and discharge. Journal of Photochemistry and Photobiology A: Chemistry 2011, 221(2):214-219.
79. Fan W, Lai Q, Zhang Q, Wang Y: Nanocomposites of TiO2 and reduced graphene
oxide as efficient photocatalysts for hydrogen evolution. The Journal of Physical Chemistry C 2011, 115(21):10694-10701.
102
80. Zhang W, Wang C, Li Z, Lu Z, Li Y, Yin JJ, Zhou YT, Gao X, Fang Y, Nie G: Unraveling Stress‐Induced Toxicity Properties of Graphene Oxide and the Underlying Mechanism. Advanced Materials 2012, 24(39):5391-5397.
81. Duch M, Budinger G, Urich D, Soberanes S, Chiarella S, Gonzalez A, Radigan K,
Chandel N, Hersam M, Mutlu G: Graphene oxide but not graphene causes severe acute lung injury and pulmonary fibrosis in mice. Am J Respir Crit Care Med 2011, 183:A2283.
82. Kotchey GP, Allen BL, Vedala H, Yanamala N, Kapralov AA, Tyurina YY, Klein-
Seetharaman J, Kagan VE, Star A: The enzymatic oxidation of graphene oxide. ACS nano 2011, 5(3):2098-2108.
83. Gómez-Navarro C, Weitz RT, Bittner AM, Scolari M, Mews A, Burghard M, Kern K:
Electronic transport properties of individual chemically reduced graphene oxide sheets. Nano letters 2007, 7(11):3499-3503.
84. Zhou X, Zhang Y, Wang C, Wu X, Yang Y, Zheng B, Wu H, Guo S, Zhang J: Photo-
Fenton reaction of graphene oxide: a new strategy to prepare graphene quantum dots for DNA cleavage. Acs Nano 2012, 6(8):6592-6599.
85. Lanphere JD, Rogers B, Luth C, Bolster CH, Walker SL: Stability and transport of
graphene oxide nanoparticles in groundwater and surface water. Environmental engineering science 2014, 31(7):350-359.
86. Page SE, Arnold WA, McNeill K: Assessing the contribution of free hydroxyl
radical in organic matter-sensitized photohydroxylation reactions. Environmental science & technology 2011, 45(7):2818-2825.
87. Zepp RG, Hoigne J, Bader H: Nitrate-induced photooxidation of trace organic
chemicals in water. Environmental science & technology 1987, 21(5):443-450. 88. Zepp RG, Faust BC, Hoigne J: Hydroxyl radical formation in aqueous reactions
(pH 3-8) of iron (II) with hydrogen peroxide: the photo-Fenton reaction. Environmental Science & Technology 1992, 26(2):313-319.
103
89. Colvin VL: The potential environmental impact of engineered nanomaterials. Nature biotechnology 2003, 21(10):1166-1170.
90. Inui S, Aoshima H, Nishiyama A, Itami S: Improvement of acne vulgaris by
topical fullerene application: unique impact on skin care. Nanomedicine: Nanotechnology, Biology and Medicine 2011, 7(2):238-241.
91. Su D: Product characterization and headspace analysis of solar irradiated
aqueous C60 clusters. 2013. 92. Duncan LK, Jinschek JR, Vikesland PJ: C60 colloid formation in aqueous systems:
effects of preparation method on size, structure, and surface charge. Environmental science & technology 2007, 42(1):173-178.
93. Bachilo SM, Benedetto AF, Weisman RB: Triplet state dissociation of C120, the
dimer of C60. The Journal of Physical Chemistry A 2001, 105(43):9845-9850. 94. Berry TD, Clavijo AP, Zhao Y, Jafvert CT, Turco RF, Filley TR: Soil microbial
response to photo-degraded C 60 fullerenes. Environmental Pollution 2016, 211:338-345.

13
VITA
104
VITA
Yingcan Zhao, a single child of Honglai Zhao and Wenyan Zhang, was born in
Heilongjiang Province, China in 1990. She received her B.S. in environmental science
from Shandong University in China in June 2012. After coming to Purdue for Ph.D. study
in Fall 2012, she developed a special interest in environmental nanotechnology
including photo mineralization of Aqu/nC60 clusters and environmental reactions of
graphene oxide. She has already published two papers in scientific journals on the topic.
Her paper “Environmental Photochemistry of Graphene Oxide in Water” was selected as
the cover of the journal “Environmental Science: Nano”. She was also a recipient of
Joseph P. Chu Fellowship, Ron Wukasch Environmental Engineering Scholarship, Pai Tao
Yeh Fellowship (twice) while at Purdue.
Personally, she likes traveling, swimming and playing instruments. She hopes to
travel all over the world.