re: toronto hydro-electric system limited (“thesl”) oeb ... · updated interrogatory responses...
TRANSCRIPT
Amanda Klein Director, Regulatory Affairs Telephone: 416.542.2729 Toronto Hydro-Electric System Limited Facsimile: 416.542.3024 14 Carlton Street [email protected] Toronto, Ontario M5B 1K5 www.torontohydro.com
November 16, 2012 via RESS e-filing – signed original to follow by courier Ms. Kirsten Walli Board Secretary Ontario Energy Board PO Box 2319 2300 Yonge Street, 27th floor Toronto, ON M4P 1E4 Dear Ms. Walli: Re: Toronto Hydro-Electric System Limited (“THESL”) OEB File No. EB-2012-0064 (the “Application”)
Updated Interrogatory Responses
We write in respect of the above-noted matter. Please find enclosed revisions THESL’s interrogatory responses originally filed on October 5, 2012. These updates are consequential to THESL’s evidentiary update filed on October 31, 2012. The following interrogatory responses have been updated:
Issue No. Revised Interrogatory Responses
Issue 1.2 CUPE 5 a
Issue 2.2 OEB Staff 29 OEB Staff 32 a,b OEB Staff 36 a OEB Staff 37 a,b OEB Staff 38 f OEB Staff 62 a,c OEB Staff 73 a AMPCO 30 a AMPCO 31 PP 3 SEC 17 VECC 55
Issue 4.2 CCC 24
page 2
In addition, THESL encloses a revised Appendix 1 to the Manager’s Summary (Tab 2 of THESL’s pre-filed evidence). This revision is limited to a formatting adjustment; the substance of the document is identical to the version filed on October 31, 2012. Please do not hesitate to contact me if you have any questions. Yours truly, [original signed by] Amanda Klein Director, Regulatory Affairs Toronto Hydro-Electric System Limited [email protected] :AK/RB cc: Fred Cass of Aird & Berlis LLP, Counsel for THESL, by electronic mail only
Intervenors of Record for EB-2012-0064 by electronic mail only

Toronto Hydro‐Electric System LimitedEB‐2012‐0064
Tab 2Appendix 1
Filed: 2012 May 10Corrected and Updated: 2012 Oct 31
page 1 of 2
CapEx Approved 2011 378.8Funded through Depreciation ‐138.8Fixed Assets Impact 240.0Closing Rate Base in 2011 120.0Opening Rate Base in 2012 120.0
Rate Base 2012 2013 2014 TotalOpening Rate Base 120.0 116.3 112.5Depreciation for the year ‐3.8 ‐3.8 ‐3.8Closing Balance 116.3 112.5 108.8Average Balance 118.1 114.4 110.6
Revenue RequirementDepreciation 3.8 3.8 3.8 11.3Cost of capital (6.94%)
Interest (5.18% x 60%) 3.7 3.6 3.4 10.7Return on Equity (9.58% x 40%) 4.5 4.4 4.2 13.1
PILs 1.0 1.0 0.9 3.0
Total Revenue Requirement 13.0 12.7 12.4 38.0
PILs CalculationTarget Net Income 4.5 4.4 4.2 13.1Add: Depreciation 3.8 3.8 3.8 11.3Less: CCA ‐5.4 ‐5.4 ‐5.4 ‐16.1Income for PILs purposes 2.9 2.8 2.6 8.3PILs 0.8 0.7 0.7 2.2Gross‐up PILs 1.0 1.0 0.9 3.0
AssumptionsDepreciation vs CCA ratio 1.43 1.43 1.43Average life of Assets 32 years 32 years 32 yearsTax rate 26.40% 26.40% 26.40%
APPENDIX 1 TO MANAGER'S SUMMARY($ millions)
Toronto Hydro-Electric System Limited EB-2012-0064
Tab 6B Schedule 4-5
Filed: 2012 Oct 5 Updated: 2012 Nov 16
Page 1 of 2
RESPONSES TO CANADIAN UNION OF PUBLIC EMPLOYEES, LOCAL ONE INTERROGATORIES ON ISSUE 1.2
Panel: Capital Planning Process
INTERROGATORY 5: 1
Reference(s): Section C / Schedule C2 – 2011 Carryover Projects, Pages 4 2
and 5 3
4
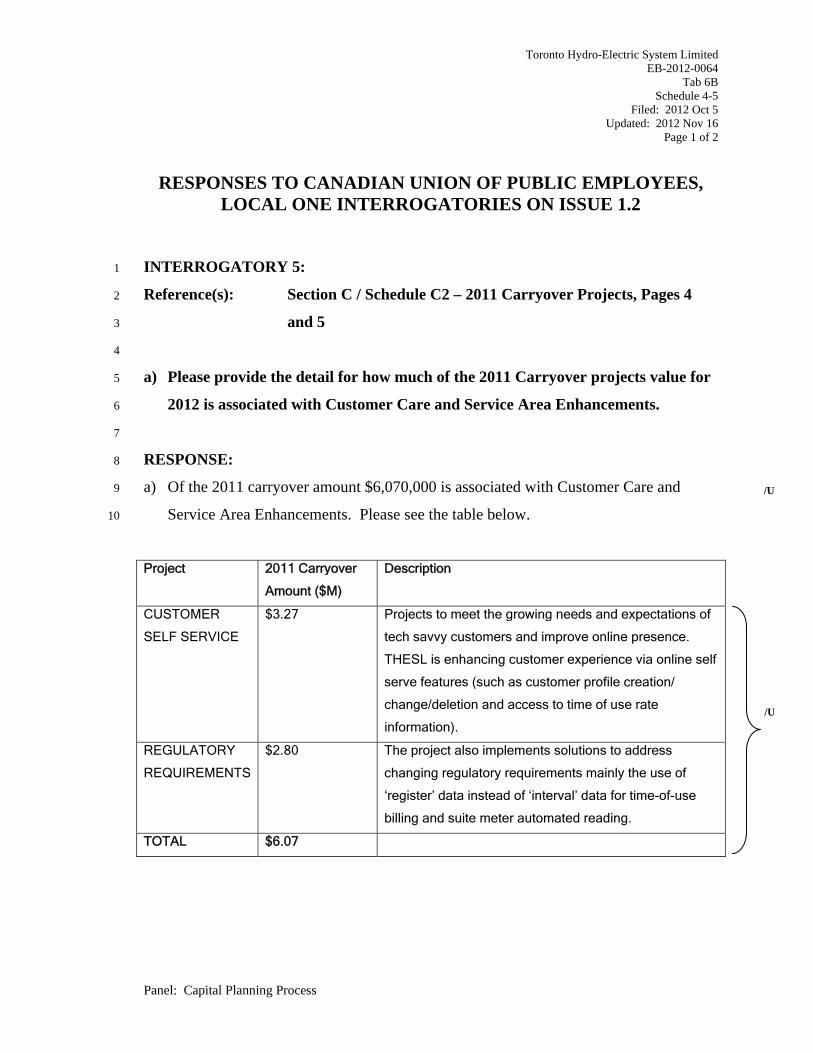
a) Please provide the detail for how much of the 2011 Carryover projects value for 5
2012 is associated with Customer Care and Service Area Enhancements. 6
7
RESPONSE: 8
a) Of the 2011 carryover amount $6,070,000 is associated with Customer Care and 9
Service Area Enhancements. Please see the table below. 10
Project 2011 Carryover
Amount ($M)
Description
CUSTOMER
SELF SERVICE
$3.27 Projects to meet the growing needs and expectations of
tech savvy customers and improve online presence.
THESL is enhancing customer experience via online self
serve features (such as customer profile creation/
change/deletion and access to time of use rate
information).
REGULATORY
REQUIREMENTS
$2.80 The project also implements solutions to address
changing regulatory requirements mainly the use of
‘register’ data instead of ‘interval’ data for time-of-use
billing and suite meter automated reading.
TOTAL $6.07
/U
/U

Toronto Hydro-Electric System Limited EB-2012-0064
Tab 6B Schedule 4-5
Filed: 2012 Oct 5 Updated: 2012 Nov 16
Page 2 of 2
RESPONSES TO CANADIAN UNION OF PUBLIC EMPLOYEES, LOCAL ONE INTERROGATORIES ON ISSUE 1.2
Panel: Capital Planning Process
b) Please provide specific details of the costs within that above-referenced total. 1
Please identify if any of those projects include self-service enhancements to the 2
call centre telephone system. 3
4
RESPONSE: 5
b) None of the 2011 carryover projects include self-service enhancements to the call 6
centre telephone system. 7
Toronto Hydro-Electric System Limited EB-2012-0064
Tab 6F Schedule 1-29
Filed: 2012 Oct 5 Updated: 2012 Nov 16
Page 1 of 1
RESPONSES TO ONTARIO ENERGY BOARD STAFF INTERROGATORIES ON ISSUE 2.2
Panel: Capital Planning Process
INTERROGATORY 29: 1
Reference(s): T4/S B1/pp. 2-3/Table 1 2
3
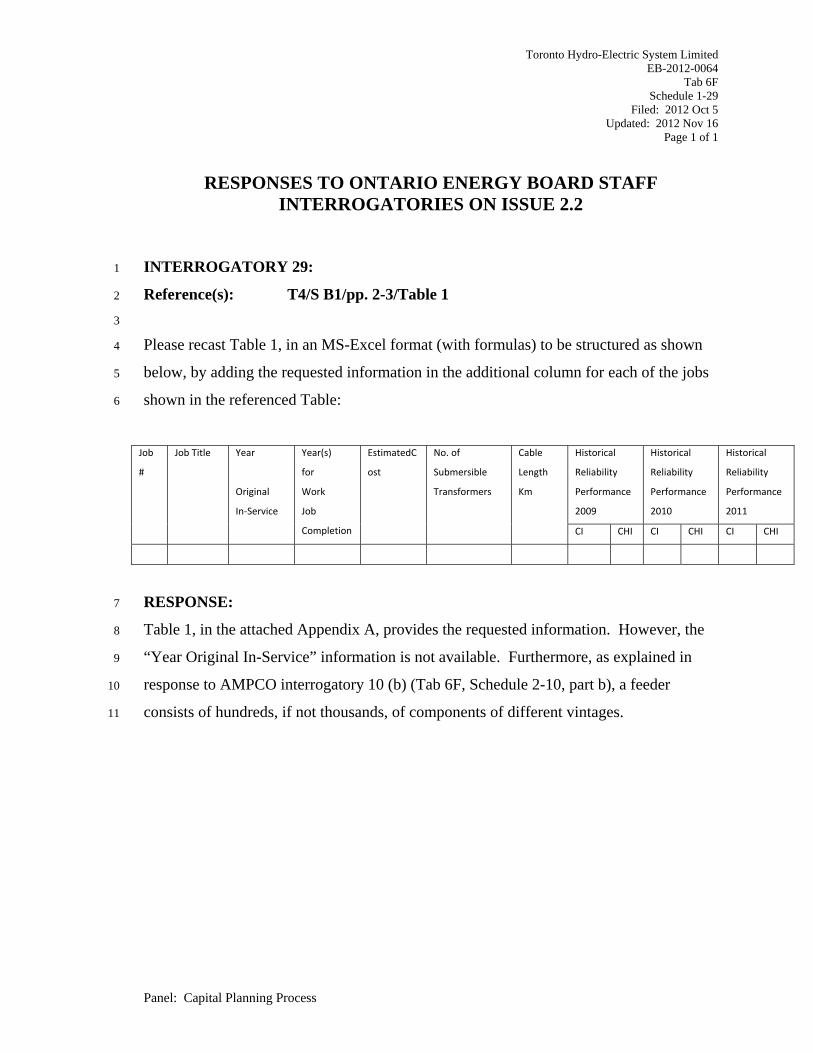
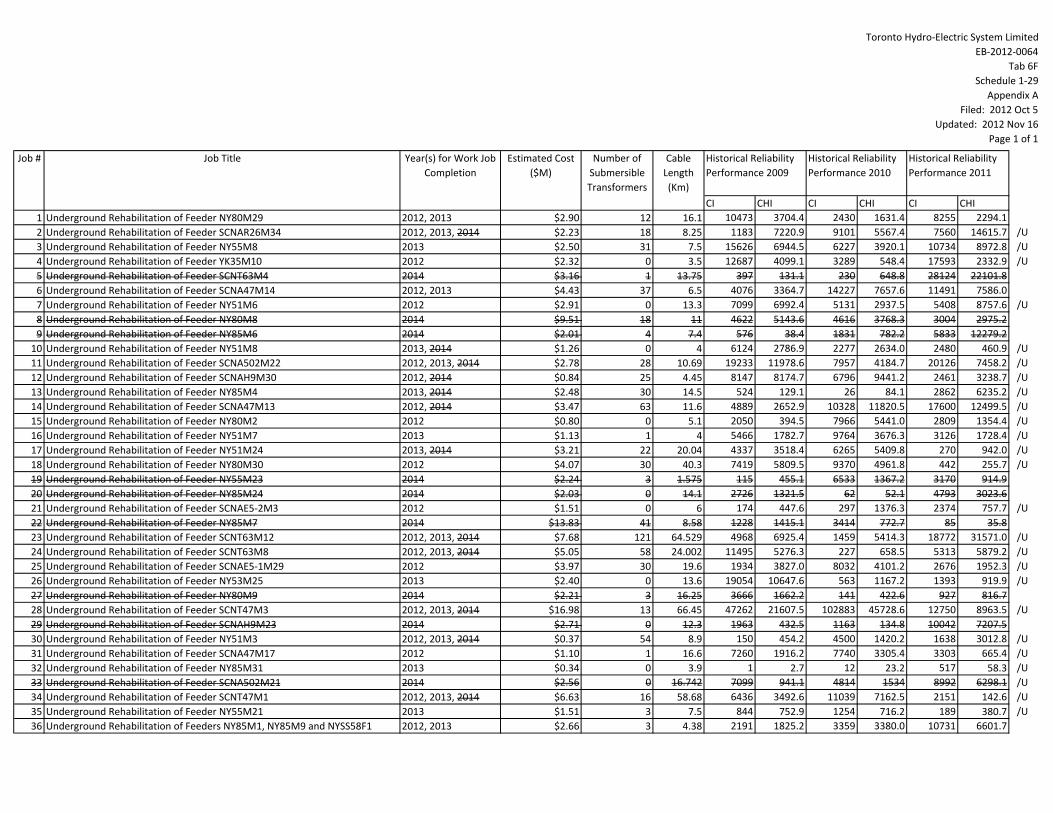
Please recast Table 1, in an MS-Excel format (with formulas) to be structured as shown 4
below, by adding the requested information in the additional column for each of the jobs 5
shown in the referenced Table: 6
Job
#
Job Title Year
Original
In‐Service
Year(s)
for
Work
Job
Completion
EstimatedC
ost
No. of
Submersible
Transformers
Cable
Length
Km
Historical
Reliability
Performance
2009
Historical
Reliability
Performance
2010
Historical
Reliability
Performance
2011
CI CHI CI CHI CI CHI
RESPONSE: 7
Table 1, in the attached Appendix A, provides the requested information. However, the 8
“Year Original In-Service” information is not available. Furthermore, as explained in 9
response to AMPCO interrogatory 10 (b) (Tab 6F, Schedule 2-10, part b), a feeder 10
consists of hundreds, if not thousands, of components of different vintages. 11
Toronto Hydro‐Electric System LimitedEB‐2012‐0064
Tab 6FSchedule 1‐29
Appendix AFiled: 2012 Oct 5
Updated: 2012 Nov 16Page 1 of 1
CI CHI CI CHI CI CHI1 Underground Rehabilitation of Feeder NY80M29 2012, 2013 $2.90 12 16.1 10473 3704.4 2430 1631.4 8255 2294.12 Underground Rehabilitation of Feeder SCNAR26M34 2012, 2013, 2014 $2.23 18 8.25 1183 7220.9 9101 5567.4 7560 14615.7 /U3 Underground Rehabilitation of Feeder NY55M8 2013 $2.50 31 7.5 15626 6944.5 6227 3920.1 10734 8972.8 /U4 Underground Rehabilitation of Feeder YK35M10 2012 $2.32 0 3.5 12687 4099.1 3289 548.4 17593 2332.9 /U5 Underground Rehabilitation of Feeder SCNT63M4 2014 $3.16 1 13.75 397 131.1 230 648.8 28124 22101.86 Underground Rehabilitation of Feeder SCNA47M14 2012, 2013 $4.43 37 6.5 4076 3364.7 14227 7657.6 11491 7586.07 Underground Rehabilitation of Feeder NY51M6 2012 $2.91 0 13.3 7099 6992.4 5131 2937.5 5408 8757.6 /U8 Underground Rehabilitation of Feeder NY80M8 2014 $9.51 18 11 4622 5143.6 4616 3768.3 3004 2975.29 Underground Rehabilitation of Feeder NY85M6 2014 $2.01 4 7.4 576 38.4 1831 782.2 5833 12279.2
10 Underground Rehabilitation of Feeder NY51M8 2013, 2014 $1.26 0 4 6124 2786.9 2277 2634.0 2480 460.9 /U11 Underground Rehabilitation of Feeder SCNA502M22 2012, 2013, 2014 $2.78 28 10.69 19233 11978.6 7957 4184.7 20126 7458.2 /U12 Underground Rehabilitation of Feeder SCNAH9M30 2012, 2014 $0.84 25 4.45 8147 8174.7 6796 9441.2 2461 3238.7 /U13 Underground Rehabilitation of Feeder NY85M4 2013, 2014 $2.48 30 14.5 524 129.1 26 84.1 2862 6235.2 /U14 Underground Rehabilitation of Feeder SCNA47M13 2012, 2014 $3.47 63 11.6 4889 2652.9 10328 11820.5 17600 12499.5 /U15 Underground Rehabilitation of Feeder NY80M2 2012 $0.80 0 5.1 2050 394.5 7966 5441.0 2809 1354.4 /U16 Underground Rehabilitation of Feeder NY51M7 2013 $1.13 1 4 5466 1782.7 9764 3676.3 3126 1728.4 /U17 Underground Rehabilitation of Feeder NY51M24 2013, 2014 $3.21 22 20.04 4337 3518.4 6265 5409.8 270 942.0 /U18 Underground Rehabilitation of Feeder NY80M30 2012 $4.07 30 40.3 7419 5809.5 9370 4961.8 442 255.7 /U19 Underground Rehabilitation of Feeder NY55M23 2014 $2.24 3 1.575 115 455.1 6533 1367.2 3170 914.920 Underground Rehabilitation of Feeder NY85M24 2014 $2.03 0 14.1 2726 1321.5 62 52.1 4793 3023.621 Underground Rehabilitation of Feeder SCNAE5‐2M3 2012 $1.51 0 6 174 447.6 297 1376.3 2374 757.7 /U22 Underground Rehabilitation of Feeder NY85M7 2014 $13.83 41 8.58 1228 1415.1 3414 772.7 85 35.823 Underground Rehabilitation of Feeder SCNT63M12 2012, 2013, 2014 $7.68 121 64.529 4968 6925.4 1459 5414.3 18772 31571.0 /U24 Underground Rehabilitation of Feeder SCNT63M8 2012, 2013, 2014 $5.05 58 24.002 11495 5276.3 227 658.5 5313 5879.2 /U25 Underground Rehabilitation of Feeder SCNAE5‐1M29 2012 $3.97 30 19.6 1934 3827.0 8032 4101.2 2676 1952.3 /U26 Underground Rehabilitation of Feeder NY53M25 2013 $2.40 0 13.6 19054 10647.6 563 1167.2 1393 919.9 /U27 Underground Rehabilitation of Feeder NY80M9 2014 $2.21 3 16.25 3666 1662.2 141 422.6 927 816.728 Underground Rehabilitation of Feeder SCNT47M3 2012, 2013, 2014 $16.98 13 66.45 47262 21607.5 102883 45728.6 12750 8963.5 /U29 Underground Rehabilitation of Feeder SCNAH9M23 2014 $2.71 0 12.3 1963 432.5 1163 134.8 10042 7207.530 Underground Rehabilitation of Feeder NY51M3 2012, 2013, 2014 $0.37 54 8.9 150 454.2 4500 1420.2 1638 3012.8 /U31 Underground Rehabilitation of Feeder SCNA47M17 2012 $1.10 1 16.6 7260 1916.2 7740 3305.4 3303 665.4 /U32 Underground Rehabilitation of Feeder NY85M31 2013 $0.34 0 3.9 1 2.7 12 23.2 517 58.3 /U33 Underground Rehabilitation of Feeder SCNA502M21 2014 $2.56 0 16.742 7099 941.1 4814 1534 8992 6298.1 /U34 Underground Rehabilitation of Feeder SCNT47M1 2012, 2013, 2014 $6.63 16 58.68 6436 3492.6 11039 7162.5 2151 142.6 /U35 Underground Rehabilitation of Feeder NY55M21 2013 $1.51 3 7.5 844 752.9 1254 716.2 189 380.7 /U36 Underground Rehabilitation of Feeders NY85M1, NY85M9 and NYSS58F1 2012, 2013 $2.66 3 4.38 2191 1825.2 3359 3380.0 10731 6601.7
Historical Reliability Performance 2009
Historical Reliability Performance 2010
Historical Reliability Performance 2011
Job TitleJob # Cable Length (Km)
Number of Submersible Transformers
Estimated Cost ($M)
Year(s) for Work Job Completion
Toronto Hydro-Electric System Limited EB-2012-0064
Tab 6F Schedule 1-32
Filed: 2012 Oct 5 Updated: 2012 Nov 16
Page 1 of 4
RESPONSES TO ONTARIO ENERGY BOARD STAFF INTERROGATORIES ON ISSUE 2.2
Panel: Capital Projects
INTERROGATORY 32: 1
Reference(s): T4/S B1/pp. 2-3/Table 1 and T4/S B1/p. 111/l 22 - 27 2
3
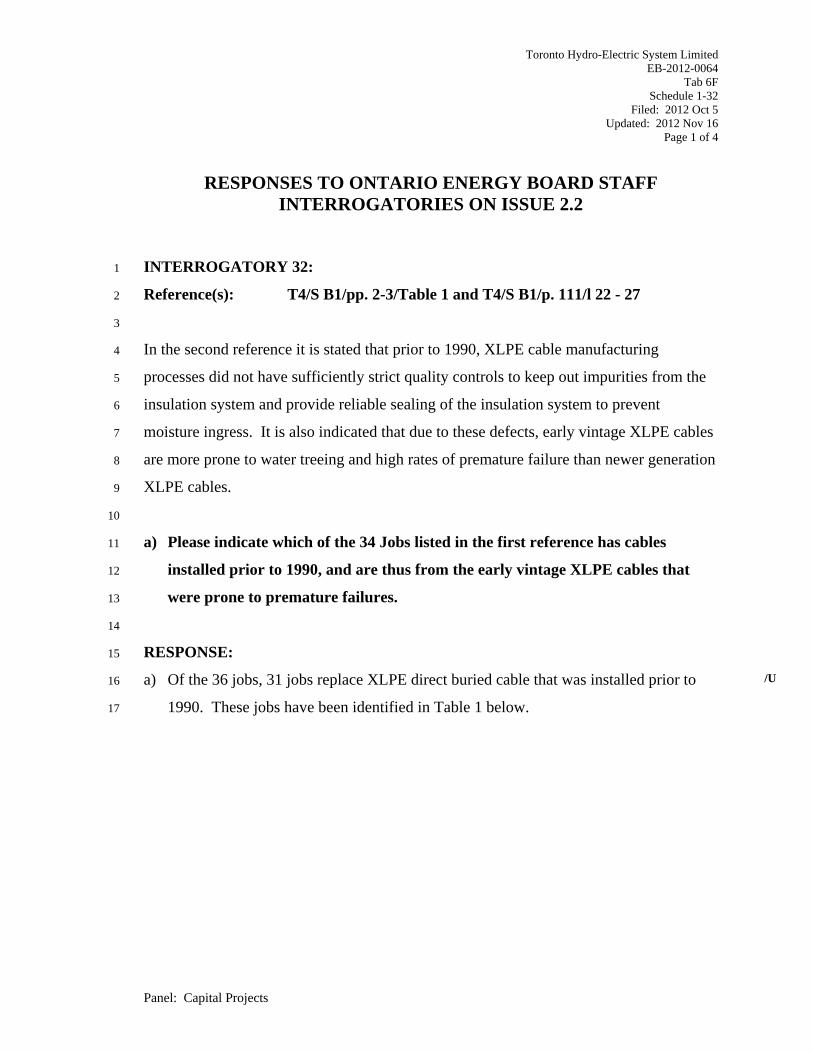
In the second reference it is stated that prior to 1990, XLPE cable manufacturing 4
processes did not have sufficiently strict quality controls to keep out impurities from the 5
insulation system and provide reliable sealing of the insulation system to prevent 6
moisture ingress. It is also indicated that due to these defects, early vintage XLPE cables 7
are more prone to water treeing and high rates of premature failure than newer generation 8
XLPE cables. 9
10
a) Please indicate which of the 34 Jobs listed in the first reference has cables 11
installed prior to 1990, and are thus from the early vintage XLPE cables that 12
were prone to premature failures. 13
14
RESPONSE: 15
a) Of the 36 jobs, 31 jobs replace XLPE direct buried cable that was installed prior to 16
1990. These jobs have been identified in Table 1 below. 17
/U

Toronto Hydro-Electric System Limited EB-2012-0064
Tab 6F Schedule 1-32
Filed: 2012 Oct 5 Updated: 2012 Nov 16
Page 2 of 4
RESPONSES TO ONTARIO ENERGY BOARD STAFF INTERROGATORIES ON ISSUE 2.2
Panel: Capital Projects
RESPONSE: 1
Table 1: Jobs with direct buried cable that was installed prior to 1990 2
Job Title
Underground Rehabilitation of Feeder NY80M29
Underground Rehabilitation of Feeder SCNAR26M34
Underground Rehabilitation of Feeder NY55M8
Underground Rehabilitation of Feeder SCNT63M4
Underground Rehabilitation of Feeder SCNA47M14
Underground Rehabilitation of Feeder NY51M6
Underground Rehabilitation of Feeder NY80M8
Underground Rehabilitation of Feeder NY85M6
Underground Rehabilitation of Feeder NY51M8
Underground Rehabilitation of Feeder SCNA502M22
Underground Rehabilitation of Feeder SCNAH9M30
Underground Rehabilitation of Feeder NY85M4
Underground Rehabilitation of Feeder SCNA47M13
Underground Rehabilitation of Feeder NY80M2
Underground Rehabilitation of Feeder NY51M24
Underground Rehabilitation of Feeder NY80M30
Underground Rehabilitation of Feeder NY85M24
Underground Rehabilitation of Feeder SCNAE5-2M3
Underground Rehabilitation of Feeder NY85M7
Underground Rehabilitation of Feeder SCNT63M12
Underground Rehabilitation of Feeder SCNT63M8
Underground Rehabilitation of Feeder SCNAE5-1M29
Underground Rehabilitation of Feeder NY53M25
Underground Rehabilitation of Feeder SCNT47M3
Toronto Hydro-Electric System Limited EB-2012-0064
Tab 6F Schedule 1-32
Filed: 2012 Oct 5 Updated: 2012 Nov 16
Page 3 of 4
RESPONSES TO ONTARIO ENERGY BOARD STAFF INTERROGATORIES ON ISSUE 2.2
Panel: Capital Projects
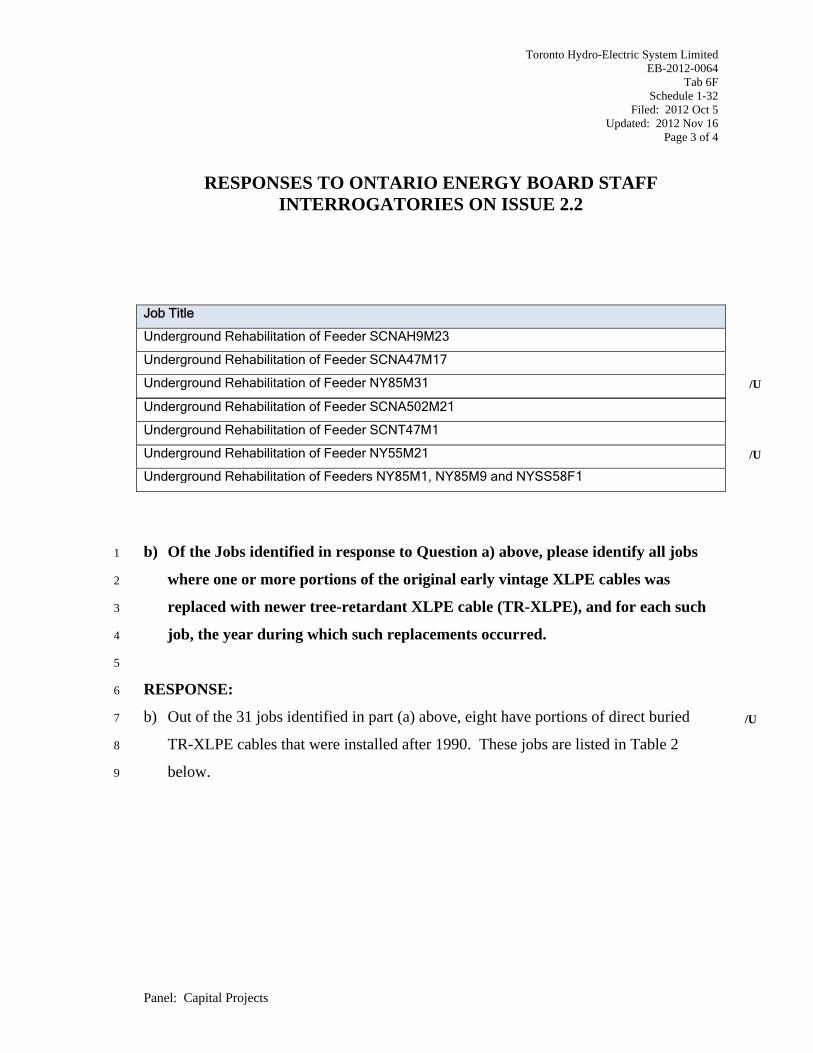
b) Of the Jobs identified in response to Question a) above, please identify all jobs 1
where one or more portions of the original early vintage XLPE cables was 2
replaced with newer tree-retardant XLPE cable (TR-XLPE), and for each such 3
job, the year during which such replacements occurred. 4
5
RESPONSE: 6
b) Out of the 31 jobs identified in part (a) above, eight have portions of direct buried 7
TR-XLPE cables that were installed after 1990. These jobs are listed in Table 2 8
below. 9
Job Title
Underground Rehabilitation of Feeder SCNAH9M23
Underground Rehabilitation of Feeder SCNA47M17
Underground Rehabilitation of Feeder NY85M31
Underground Rehabilitation of Feeder SCNA502M21
Underground Rehabilitation of Feeder SCNT47M1
Underground Rehabilitation of Feeder NY55M21
Underground Rehabilitation of Feeders NY85M1, NY85M9 and NYSS58F1
/U
/U
/U

Toronto Hydro-Electric System Limited EB-2012-0064
Tab 6F Schedule 1-32
Filed: 2012 Oct 5 Updated: 2012 Nov 16
Page 4 of 4
RESPONSES TO ONTARIO ENERGY BOARD STAFF INTERROGATORIES ON ISSUE 2.2
Panel: Capital Projects
Table 2: Jobs replacing TR-XLPE cable 1
Job Title Year of XLPE Replacement with
TR-XLPE
Underground Rehabilitation of Feeder SCNA502M22 1998
Underground Rehabilitation of Feeder NY51M7 2006
Underground Rehabilitation of Feeder SCNT63M12 1998
Underground Rehabilitation of Feeder SCNT63M8 2011
Underground Rehabilitation of Feeder SCNT47M3 1991, 1993, 2010
Underground Rehabilitation of Feeder NY51M3 1993
Underground Rehabilitation of Feeder SCNA502M21 1998
Underground Rehabilitation of Feeder NY55M21 2001
/U
Toronto Hydro-Electric System Limited EB-2012-0064
Tab 6F Schedule 1-36
Filed: 2012 Oct 5 Updated: 2012 Nov 16
Page 1 of 4
RESPONSES TO ONTARIO ENERGY BOARD STAFF INTERROGATORIES ON ISSUE 2.2
Panel: Capital Projects
INTERROGATORY 36: 1
Reference(s): T4/S B2/p. 1, p. 10, p. 15, p. 19, p. 26 2
3
At page 1 of the reference, it is indicated that THESL has approximately 1,305 kilometers 4
of PILC cables; 5
6
The two tables, Table 2 at page 10 and Table 3 at page 15, of the reference do not include 7
the length of cables that will be replaced. 8
9
At page 19 of the reference it is stated that “Currently there are 91 identified cable 10
chambers that are severely congested…” 11
12
At page 26 of the reference it is stated that “In 2011, there were 28,576 cable chambers 13
and vaults entered by THESL workers”. 14
15
a) Please provide a recast of both Tables 2 and Table 3, noted above, adding in 16
each the length of cable for each “Job” in kilometre which is proposed for 17
replacement. 18
Toronto Hydro-Electric System Limited EB-2012-0064
Tab 6F Schedule 1-36
Filed: 2012 Oct 5 Updated: 2012 Nov 16
Page 2 of 4
RESPONSES TO ONTARIO ENERGY BOARD STAFF INTERROGATORIES ON ISSUE 2.2
Panel: Capital Projects
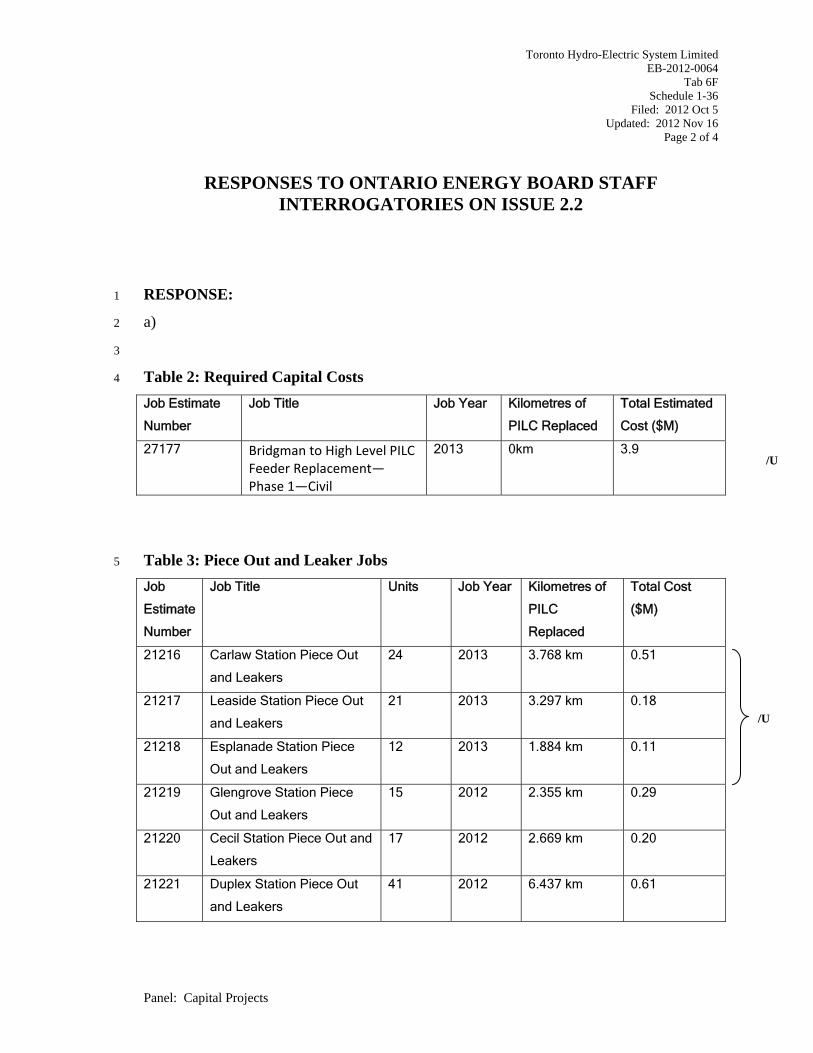
RESPONSE: 1
a) 2
3
Table 2: Required Capital Costs 4
Job Estimate
Number
Job Title Job Year Kilometres of
PILC Replaced
Total Estimated
Cost ($M)
27177 Bridgman to High Level PILC Feeder Replacement—Phase 1—Civil
2013 0km 3.9
Table 3: Piece Out and Leaker Jobs 5
Job
Estimate
Number
Job Title Units Job Year Kilometres of
PILC
Replaced
Total Cost
($M)
21216 Carlaw Station Piece Out
and Leakers
24 2013 3.768 km 0.51
21217 Leaside Station Piece Out
and Leakers
21 2013 3.297 km 0.18
21218 Esplanade Station Piece
Out and Leakers
12 2013 1.884 km 0.11
21219 Glengrove Station Piece
Out and Leakers
15 2012 2.355 km 0.29
21220 Cecil Station Piece Out and
Leakers
17 2012 2.669 km 0.20
21221 Duplex Station Piece Out
and Leakers
41 2012 6.437 km 0.61
/U
/U
Toronto Hydro-Electric System Limited EB-2012-0064
Tab 6F Schedule 1-36
Filed: 2012 Oct 5 Updated: 2012 Nov 16
Page 3 of 4
RESPONSES TO ONTARIO ENERGY BOARD STAFF INTERROGATORIES ON ISSUE 2.2
Panel: Capital Projects
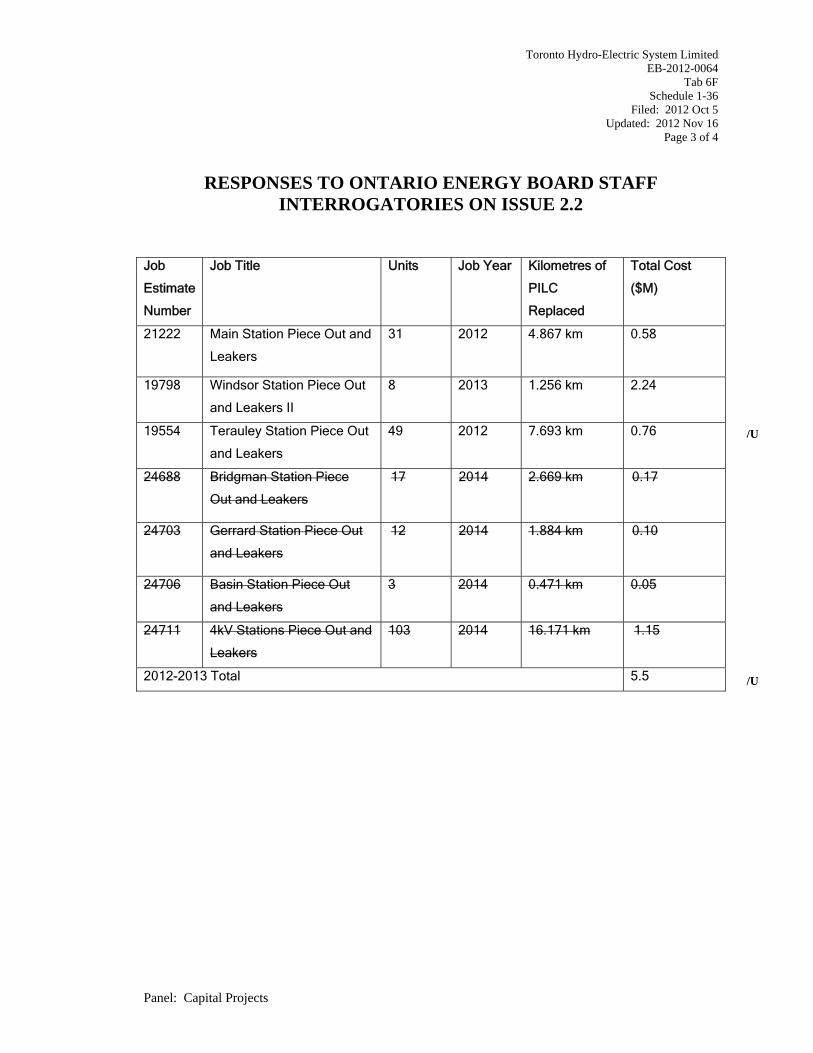
Job
Estimate
Number
Job Title Units Job Year Kilometres of
PILC
Replaced
Total Cost
($M)
21222 Main Station Piece Out and
Leakers
31 2012 4.867 km 0.58
19798 Windsor Station Piece Out
and Leakers II
8 2013 1.256 km 2.24
19554 Terauley Station Piece Out
and Leakers
49 2012 7.693 km 0.76
24688 Bridgman Station Piece
Out and Leakers
17 2014 2.669 km 0.17
24703 Gerrard Station Piece Out
and Leakers
12 2014 1.884 km 0.10
24706 Basin Station Piece Out
and Leakers
3 2014 0.471 km 0.05
24711 4kV Stations Piece Out and
Leakers
103 2014 16.171 km 1.15
2012-2013 Total 5.5
/U
/U

Toronto Hydro-Electric System Limited EB-2012-0064
Tab 6F Schedule 1-36
Filed: 2012 Oct 5 Updated: 2012 Nov 16
Page 4 of 4
RESPONSES TO ONTARIO ENERGY BOARD STAFF INTERROGATORIES ON ISSUE 2.2
Panel: Capital Projects
b) Please provide the total number of Chambers and total number of Vaults that 1
THESL has on its system that have PILC cables. 2
3
RESPONSE: 4
b) There are 5,081 cable chambers containing PILC cable, and 1,710 vaults (both 5
customer-owned and THESL-owned) that contain PILC cable. 6
7
c) Please state whether or not THESL has a plan for replacement of the total 1,305 8
kilometres of PILC cables? If yes, please provide a copy of such a plan outlining 9
the amount of cables to be replaced each of the years in that plan. 10
11
RESPONSE: 12
c) THESL has no plan at this time for the replacement of all the 1,305 km of PILC 13
cable. 14
Toronto Hydro-Electric System Limited EB-2012-0064
Tab 6F Schedule 1-37
Filed: 2012 Oct 5 Updated: 2012 Nov 16
Page 1 of 3
RESPONSES TO ONTARIO ENERGY BOARD STAFF INTERROGATORIES ON ISSUE 2.2
Panel: Capital Projects
INTERROGATORY 37: 1
Reference(s): T4/S B 3/pp. 1 – 14 2
3
At the reference, on page 1, lines 14 – 28, it is indicated that: 4
• of the approximately 11,700 handwells on the THESL system, by 2011, 5,600 5
existing units were replaced by new non-conducting units; 6
• these 5,600 units were concentrated in the downtown core because that is where 7
both the number of handwells and the potential exposure to contact voltage are 8
greatest; 9
• for the remaining handwells (4,900 units, as stated on page 13), THESL will target 10
for replacement first the downtown core, and then North York, East York, 11
Etobicoke, and Scarborough. 12
13
On pages 9 – 10, Figures 6 & 7 indicate that there have been marked improvements since 14
2009 in terms of “Historical Contact Voltage Hits identified by Mobile Surveying” 15
(Figure 6), and “Average Level of Contact Voltage Detected” (Figure 7). 16
17
On pages 11 – 12, Tables 1 and 2 indicate marked reduction in the “Number of Energized 18
Handwells” (Table 1) and that the “Contact Voltage Incidents on Handwells (2011)” 19
(Table 2) were within the priority area targeted by THESL for handwell replacement 20
before it replaces handwells in North York, East York, Etobicoke, and Scarborough. 21
22
a) Please provide the number of handwells and the cost for units that still need 23
replacement located in the downtown core. 24

Toronto Hydro-Electric System Limited EB-2012-0064
Tab 6F Schedule 1-37
Filed: 2012 Oct 5 Updated: 2012 Nov 16
Page 2 of 3
RESPONSES TO ONTARIO ENERGY BOARD STAFF INTERROGATORIES ON ISSUE 2.2
Panel: Capital Projects
RESPONSE: 1
a) The number of handwells that remain to be replaced in the downtown core is 2587. 2
The estimated cost to replace these handwells is $15,851,238 3
4
b) Please provide a recast of Table 3 on page 14 assuming THESL’s 5
implementation of the handwell replacement and their costs is spread over a 6
longer period of six years (2012 – 2017), instead of three years. In providing this 7
recast, the number and cost of handwells in 2012 and 2013 should include those 8
identified in the response to part a) above. 9
10
RESPONSE: 11
b) The following table is a recast of Table 3 assuming an implementation of the 12
handwell replacement from 2012-2017. 13
Project Title Project Year Cost Estimate
Handwell Standardization & Remediation 2012 $15,851,238
Handwell Standardization & Remediation 2013 $11,536,662
Handwell Standardization & Remediation 2014 $2,884,166
Handwell Standardization & Remediation 2015 $2,867,912
Handwell Standardization & Remediation 2016 $2,007,538
Handwell Standardization & Remediation 2017 $2,294,330
Total: $37,441,846
/U
/U
/U
Toronto Hydro-Electric System Limited EB-2012-0064
Tab 6F Schedule 1-37
Filed: 2012 Oct 5 Updated: 2012 Nov 16
Page 3 of 3
RESPONSES TO ONTARIO ENERGY BOARD STAFF INTERROGATORIES ON ISSUE 2.2
Panel: Capital Projects
c) Please state how the experience gained from the early phases of the handwell 1
Replacement program has been incorporated into the current (and future) 2
programs. 3
4
RESPONSE: 5
c) Some of the experiences gained in the early phases include: developing the contract 6
management relationship between THESL and construction contractors, working with 7
City of Toronto permit staff to determine how best to issue permits for handwell 8
replacements (such as by individual handwell versus by street), increasing the pace of 9
construction during the second and subsequent years of construction, informing 10
stakeholders such as the Electrical Safety Authority or other utilities of the program 11
through discussions and presentations at industry meetings, and creating and 12
enhancing the new materials, Construction Standards, Standard Practices and 13
Standard Design Practices described on page 9, lines 10-19. 14
Toronto Hydro-Electric System Limited EB-2012-0064
Tab 6F Schedule 1-38
Filed: 2012 Oct 5 Updated: 2012 Nov 16
Page 1 of 5
RESPONSES TO ONTARIO ENERGY BOARD STAFF INTERROGATORIES ON ISSUE 2.2
Panel: Capital Projects
INTERROGATORY 38: 1
Reference(s): T 4/S B 4 and Kinectrics Inc. Report Toronto Hydro-Electric 2
System Limited 2012 Asset Condition Assessment Audit, May 7, 3
2012 4
5
At the first reference at page 40 it is indicated that there are approximately 2,200 6
Completely Self-Protected (CSP) Transformers, and on page 42, that THESL plans to 7
replace 35 CSP transformers with standard non-CSP transformers as part of conversion 8
and rehabilitation work from 2012 to 2014. The same page also appears to suggest that 9
THESL intends to replace all 2,200 CSP transformers between 2012 and 2014. 10
11
At page 58 of the first reference in regard to “Porcelain Overhead Switches”, it is 12
indicated that there are 8,774 manual in-line switch locations, 7,442 porcelain SMD-20 13
switch locations, and 1,200 manual ganged switch locations. At page 67 it is indicated 14
that of the 8,774 in-line disconnect switches, 1,629 are over 50 years old, and 25 are over 15
60 years old – both categories need to be changed urgently and the units over 60 years 16
old need to be replaced in 2012. On page 77, Option (a), is to replace in-line disconnect 17
and manual air-break gang-operated switches in 238 locations in 2012, 547 in 2013 and 18
114 in 2014. On page 81, THESL is proposing to replace 400 porcelain insulators yearly 19
in each of 2012, 2013, and 2014. 20
21
At the second reference in regard to “Section 16 Three Phase Overhead Gang (Rem.) 22
Switches “, in Table 16-1, for a population of 263 and a sample size of about 52%, it is 23
reported in Table 16-2 that the switches conditions approximately are 30% “Very Good” 24
condition, 63% in “Good” condition and 7% in “Fair” condition. 25

Toronto Hydro-Electric System Limited EB-2012-0064
Tab 6F Schedule 1-38
Filed: 2012 Oct 5 Updated: 2012 Nov 16
Page 2 of 5
RESPONSES TO ONTARIO ENERGY BOARD STAFF INTERROGATORIES ON ISSUE 2.2
Panel: Capital Projects
1
At the second reference in regard to “Section 17 Three Phase Overhead Gang (Man.) 2
Switches “, in Table 17-1, for a population of 1069 and a sample size of about 6%, it is 3
reported in Table 17-2 that the switches conditions approximately are 39% “Very Good” 4
condition, 56% in “Good” condition and 5% in “Fair” condition. 5
6
a) Please provide the cost (labour and equipment) of installing a standard 7
transformer for each CSP transformer replaced. 8
9
RESPONSE: 10
a) The unit cost of installing a non-CSP transformer on the 27.6 kV system (including 11
the necessary 45-foot cedar pole and all associated equipment) is approximately 12
$7,150 for materials and $12,450 for labour, which totals $19,600. 13
14
b) Please explain why THESL cannot modify the CSP design by simply having an 15
external fuse installed outside of each CSP transformer, and solid connect the 16
terminals inside to bypass the internal fuse. Please comment on the view that the 17
proposed modification can be implemented on units that are still in good 18
condition regardless of age, in order to effect savings. 19
20
RESPONSE: 21
b) THESL does not refurbish or modify transformers using in-house resources. The 22
manufacturer does not recommend a retrofit of CSP transformer units in the proposed 23
manner. If the suggested alteration were to be pursued, any modification of internal 24
parts should be done in a controlled environment by qualified transformer technicians 25
Toronto Hydro-Electric System Limited EB-2012-0064
Tab 6F Schedule 1-38
Filed: 2012 Oct 5 Updated: 2012 Nov 16
Page 3 of 5
RESPONSES TO ONTARIO ENERGY BOARD STAFF INTERROGATORIES ON ISSUE 2.2
Panel: Capital Projects
and not on the field. However, the estimated cost of shipping a CSP transformer for 1
modification is greater than a non-CSP transformer itself. 2
3
Furthermore, CSP transformers are on shorter poles than those required to provide 4
adequate clearance between an external switch with the cut out fuse and the top of the 5
transformer bushing. The proposed modification thus would require a new, larger 6
pole to accommodate the external cut out fuse, which represents a substantial portion 7
of the cost of installing non-CSP transformers. As a result, although it is technically 8
viable, the estimated costs of modifying a CSP transformer in the manner suggested 9
are greater than installing a new standard transformer, which has the additional 10
benefit of an extended life span. 11
12
c) It is understood that THESL uses three” Single-Phase Switches” to form Three 13
Phase Overhead Gang Switches. Please indicate how many of the 8,774 in-line 14
disconnect switches reported at the first reference, are installed as single phase 15
switches installed on laterals. 16
17
RESPONSE: 18
c) Of the 8,774 in-line disconnect switches reported at the first reference, 6,625 are 19
installed as single-phase switches installed on laterals. 20
21
d) Please comment on the view that the condition of the single phase switches would 22
not be any different than those reported at the second reference at sections 16 23
and 17. 24
25
Toronto Hydro-Electric System Limited EB-2012-0064
Tab 6F Schedule 1-38
Filed: 2012 Oct 5 Updated: 2012 Nov 16
Page 4 of 5
RESPONSES TO ONTARIO ENERGY BOARD STAFF INTERROGATORIES ON ISSUE 2.2
Panel: Capital Projects
RESPONSE: 1
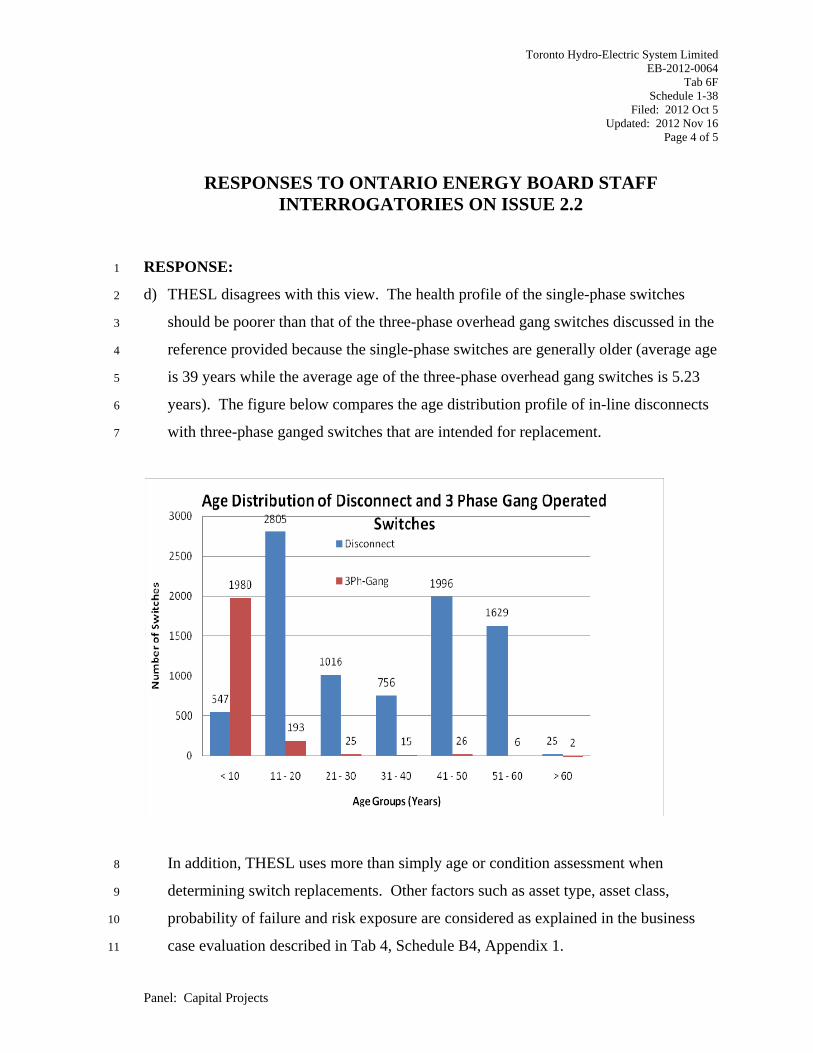
d) THESL disagrees with this view. The health profile of the single-phase switches 2
should be poorer than that of the three-phase overhead gang switches discussed in the 3
reference provided because the single-phase switches are generally older (average age 4
is 39 years while the average age of the three-phase overhead gang switches is 5.23 5
years). The figure below compares the age distribution profile of in-line disconnects 6
with three-phase ganged switches that are intended for replacement. 7
In addition, THESL uses more than simply age or condition assessment when 8
determining switch replacements. Other factors such as asset type, asset class, 9
probability of failure and risk exposure are considered as explained in the business 10
case evaluation described in Tab 4, Schedule B4, Appendix 1. 11
Toronto Hydro-Electric System Limited EB-2012-0064
Tab 6F Schedule 1-38
Filed: 2012 Oct 5 Updated: 2012 Nov 16
Page 5 of 5
RESPONSES TO ONTARIO ENERGY BOARD STAFF INTERROGATORIES ON ISSUE 2.2
Panel: Capital Projects
e) Please comment on the view that age is not a determinant for replacing switches, 1
but rather the condition assessment of such switches. 2
3
RESPONSE: 4
e) THESL uses more than simply age or condition assessment when determining switch 5
replacements. Other factors such as asset type, asset class, probability of failure and 6
risk exposure are considered as explained in the business case evaluation described in 7
the Overhead portfolio at Tab 4, Schedule B4, Appendix 1. 8
9
f) Please indicate how many “Three Phase Overhead Gang (Man.) Switches “ and 10
how many “Three Phase Overhead Gang (Rem.) Switches “ are intended to be 11
replaced in the 238 locations in 2012, 547 in 2013 and 114 in 2014 as reported on 12
pages 76-77 of the first reference under Option (a). 13
14
RESPONSE: 15
f) Based on THESL’s updated evidence, the new numbers for 2012 and 2013 switch 16
replacements are 210 locations and 473 locations respectively. Of the 210 switch 17
locations in 2012, there will be zero manual three-phase overhead ganged switches 18
and 25 remotely operated three-phase overhead ganged switches replaced. Of the 473 19
switch locations in 2013, there will be 24 manual three-phase overhead ganged 20
switches and five remotely operated three-phase overhead ganged switches replaced. 21
/U
Toronto Hydro-Electric System Limited EB-2012-0064
Tab 6F Schedule 1-62
Filed: 2012 Oct 5 Updated: 2012 Nov 16
Page 1 of 7
RESPONSES TO ONTARIO ENERGY BOARD STAFF INTERROGATORIES ON ISSUE 2.2
Panel: Capital Projects
INTERROGATORY 62: 1
Reference(s): T4/S. B20/pp. 1- 3, 4 2
3
The table on page 3 of the reference indicates a total of $22.9 million of metering 4
expenses will be incurred from 2012-2014. About 71% of the total is for metering 5
expenses related to Wholesale Metering Market Settlement Compliance (“WMMSC”) 6
and the remainder is for seal expiring meters. 7
8
Page 1 of the reference indicates that the 2012-2014 replacements are needed in order to 9
remain in compliance with the IESO Market Rules and Measurement Canada 10
requirements. 11
12
Page 3 indicates that the proposed WMMSC replacements are necessary to complete full 13
meter upgrades at all applicable delivery points by 2021 in accordance with THESL’s 14
IESO approved proposal. 15
16
a) Please explain how the proposed capital expenditures shown in the table on page 17
3 of the reference were arrived at, including appropriate cost breakdowns. 18
19
RESPONSE: 20
a) The Wholesale Metering Market Settlement Compliance cost estimates comprise of 21
quotes from Hydro One (HONI) and cost estimates from THESL for work that each 22
party will be responsible for. HONI work includes: 23
• replacement of switchgear within the Hydro One Transformer Substation; 24
• upgrading of the instrument transformers to meet IESO regulations; and 25
Toronto Hydro-Electric System Limited EB-2012-0064
Tab 6F Schedule 1-62
Filed: 2012 Oct 5 Updated: 2012 Nov 16
Page 2 of 7
RESPONSES TO ONTARIO ENERGY BOARD STAFF INTERROGATORIES ON ISSUE 2.2
Panel: Capital Projects
• de-commissioning and deregistering of HONI Metering Points and where 1
required, relocation of the metering plant outside HONI’s building to allow for 2
THESL access. 3
4
THESL work includes: 5
• replacement of the main and alternate metering points; 6
• commissioning, engineering, and decommissioning of the old meter point; and 7
• installation of new WAN communication technology to enable daily and on-8
demand readings. 9
10
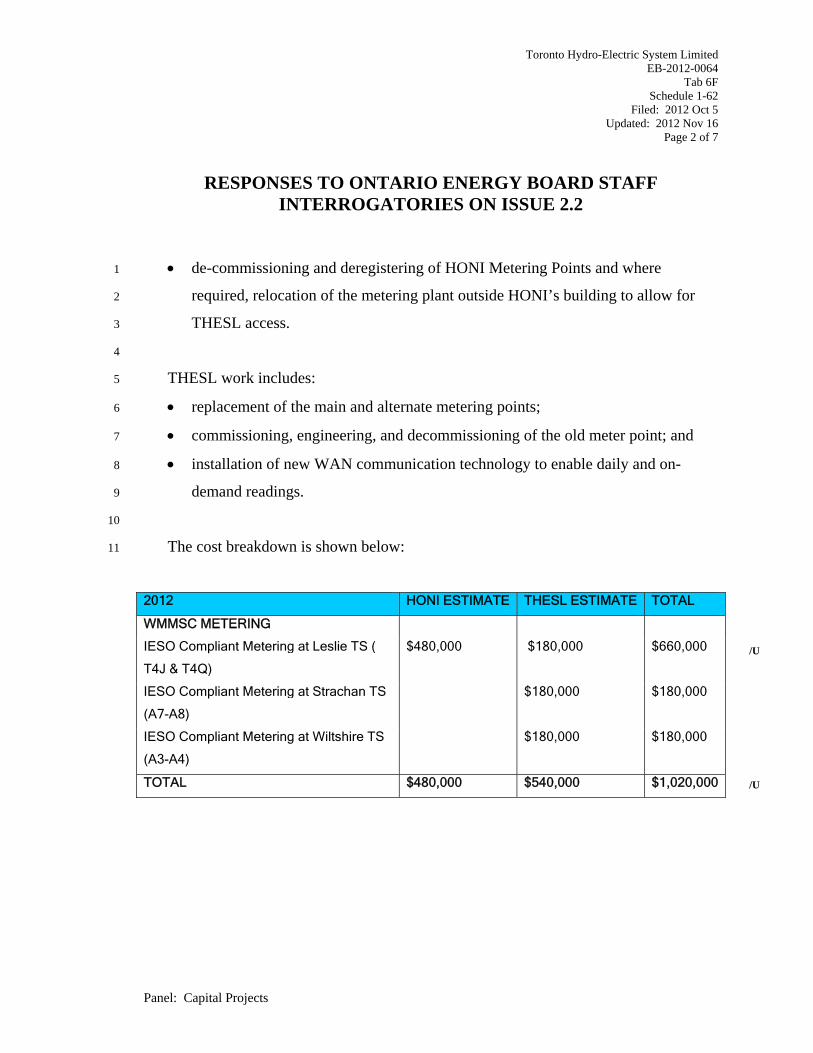
The cost breakdown is shown below: 11
2012 HONI ESTIMATE THESL ESTIMATE TOTAL
WMMSC METERING
IESO Compliant Metering at Leslie TS (
T4J & T4Q)
$480,000 $180,000 $660,000
IESO Compliant Metering at Strachan TS
(A7-A8)
$180,000 $180,000
IESO Compliant Metering at Wiltshire TS
(A3-A4)
$180,000 $180,000
TOTAL $480,000 $540,000 $1,020,000
/U
/U
Toronto Hydro-Electric System Limited EB-2012-0064
Tab 6F Schedule 1-62
Filed: 2012 Oct 5 Updated: 2012 Nov 16
Page 3 of 7
RESPONSES TO ONTARIO ENERGY BOARD STAFF INTERROGATORIES ON ISSUE 2.2
Panel: Capital Projects
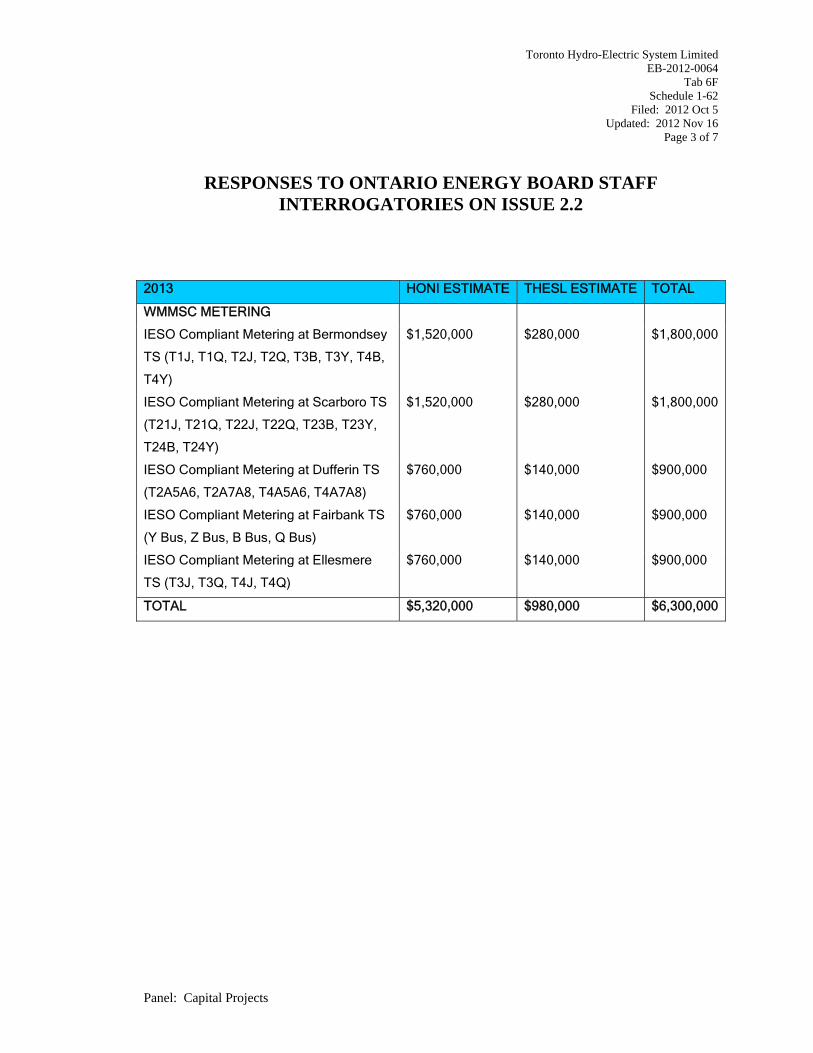
2013 HONI ESTIMATE THESL ESTIMATE TOTAL
WMMSC METERING
IESO Compliant Metering at Bermondsey
TS (T1J, T1Q, T2J, T2Q, T3B, T3Y, T4B,
T4Y)
$1,520,000 $280,000 $1,800,000
IESO Compliant Metering at Scarboro TS
(T21J, T21Q, T22J, T22Q, T23B, T23Y,
T24B, T24Y)
$1,520,000 $280,000 $1,800,000
IESO Compliant Metering at Dufferin TS
(T2A5A6, T2A7A8, T4A5A6, T4A7A8)
$760,000 $140,000 $900,000
IESO Compliant Metering at Fairbank TS
(Y Bus, Z Bus, B Bus, Q Bus)
$760,000 $140,000 $900,000
IESO Compliant Metering at Ellesmere
TS (T3J, T3Q, T4J, T4Q)
$760,000 $140,000 $900,000
TOTAL $5,320,000 $980,000 $6,300,000
Toronto Hydro-Electric System Limited EB-2012-0064
Tab 6F Schedule 1-62
Filed: 2012 Oct 5 Updated: 2012 Nov 16
Page 4 of 7
RESPONSES TO ONTARIO ENERGY BOARD STAFF INTERROGATORIES ON ISSUE 2.2
Panel: Capital Projects
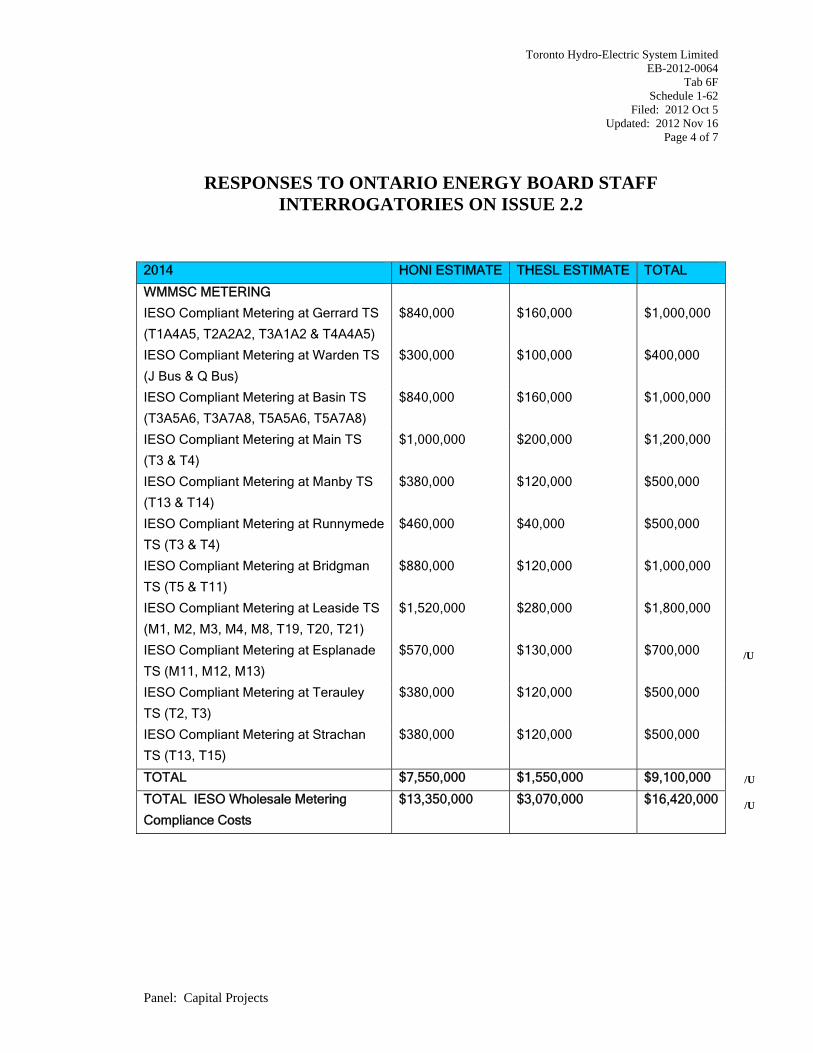
2014 HONI ESTIMATE THESL ESTIMATE TOTAL
WMMSC METERING
IESO Compliant Metering at Gerrard TS
(T1A4A5, T2A2A2, T3A1A2 & T4A4A5)
$840,000 $160,000 $1,000,000
IESO Compliant Metering at Warden TS
(J Bus & Q Bus)
$300,000 $100,000 $400,000
IESO Compliant Metering at Basin TS
(T3A5A6, T3A7A8, T5A5A6, T5A7A8) $840,000 $160,000 $1,000,000
IESO Compliant Metering at Main TS
(T3 & T4) $1,000,000 $200,000 $1,200,000
IESO Compliant Metering at Manby TS
(T13 & T14) $380,000 $120,000 $500,000
IESO Compliant Metering at Runnymede
TS (T3 & T4) $460,000 $40,000 $500,000
IESO Compliant Metering at Bridgman
TS (T5 & T11) $880,000 $120,000 $1,000,000
IESO Compliant Metering at Leaside TS
(M1, M2, M3, M4, M8, T19, T20, T21) $1,520,000 $280,000 $1,800,000
IESO Compliant Metering at Esplanade
TS (M11, M12, M13) $570,000 $130,000 $700,000
IESO Compliant Metering at Terauley
TS (T2, T3) $380,000 $120,000 $500,000
IESO Compliant Metering at Strachan
TS (T13, T15) $380,000 $120,000 $500,000
TOTAL $7,550,000 $1,550,000 $9,100,000
TOTAL IESO Wholesale Metering
Compliance Costs $13,350,000 $3,070,000 $16,420,000
/U
/U
/U
Toronto Hydro-Electric System Limited EB-2012-0064
Tab 6F Schedule 1-62
Filed: 2012 Oct 5 Updated: 2012 Nov 16
Page 5 of 7
RESPONSES TO ONTARIO ENERGY BOARD STAFF INTERROGATORIES ON ISSUE 2.2
Panel: Capital Projects
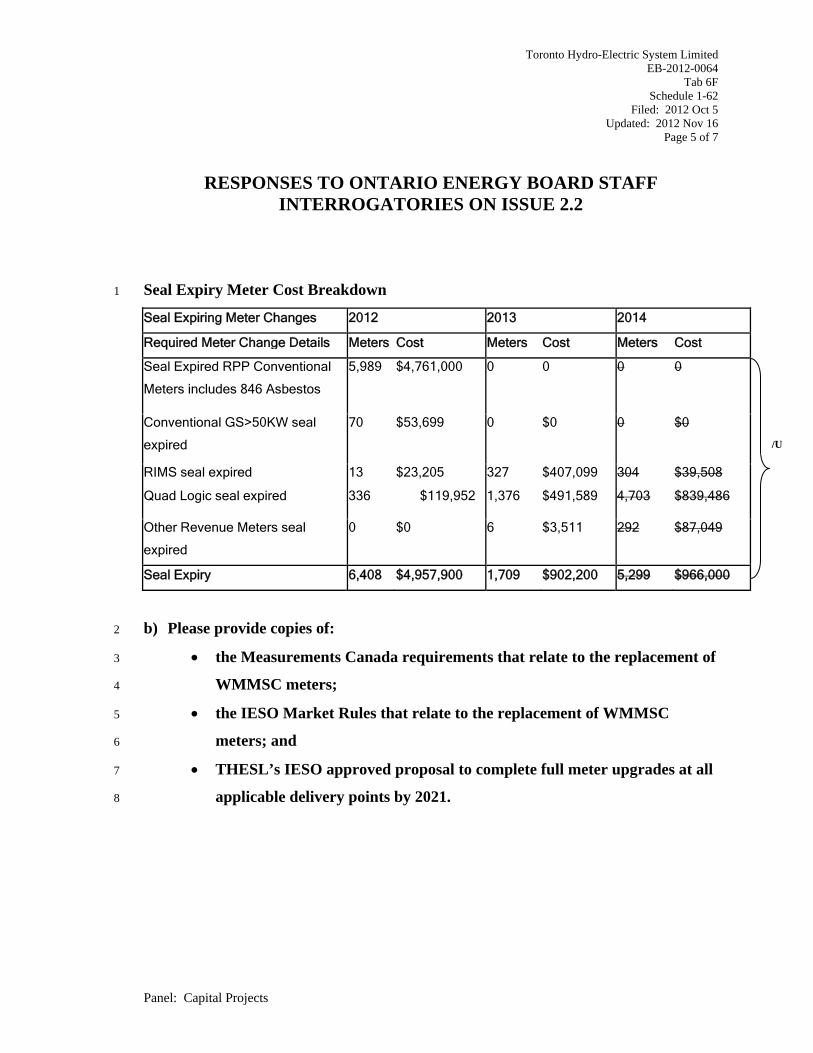
Seal Expiry Meter Cost Breakdown 1
Seal Expiring Meter Changes 2012 2013 2014
Required Meter Change Details Meters Cost Meters Cost Meters Cost
Seal Expired RPP Conventional
Meters includes 846 Asbestos
5,989 $4,761,000 0 0 0 0
Conventional GS>50KW seal
expired
70 $53,699 0 $0 0 $0
RIMS seal expired 13 $23,205 327 $407,099 304 $39,508
Quad Logic seal expired 336 $119,952 1,376 $491,589 4,703 $839,486
Other Revenue Meters seal
expired
0 $0 6 $3,511 292 $87,049
Seal Expiry 6,408 $4,957,900 1,709 $902,200 5,299 $966,000
b) Please provide copies of: 2
• the Measurements Canada requirements that relate to the replacement of 3
WMMSC meters; 4
• the IESO Market Rules that relate to the replacement of WMMSC 5
meters; and 6
• THESL’s IESO approved proposal to complete full meter upgrades at all 7
applicable delivery points by 2021. 8
/U
Toronto Hydro-Electric System Limited EB-2012-0064
Tab 6F Schedule 1-62
Filed: 2012 Oct 5 Updated: 2012 Nov 16
Page 6 of 7
RESPONSES TO ONTARIO ENERGY BOARD STAFF INTERROGATORIES ON ISSUE 2.2
Panel: Capital Projects
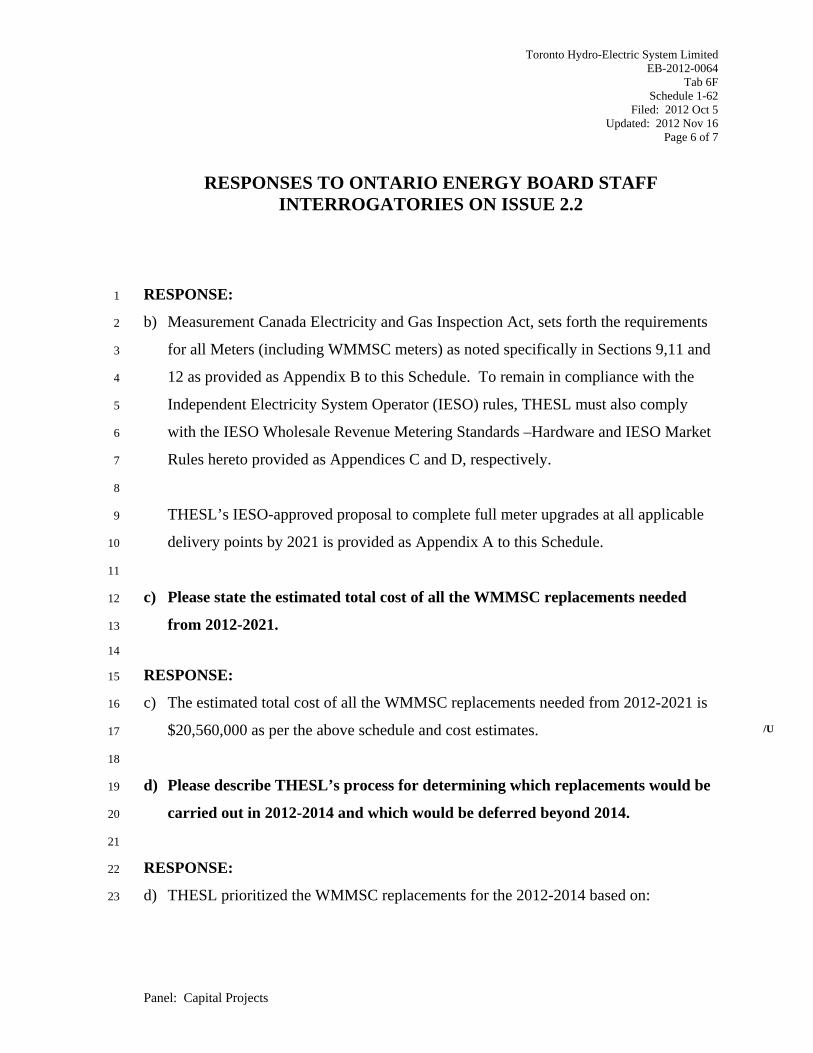
RESPONSE: 1
b) Measurement Canada Electricity and Gas Inspection Act, sets forth the requirements 2
for all Meters (including WMMSC meters) as noted specifically in Sections 9,11 and 3
12 as provided as Appendix B to this Schedule. To remain in compliance with the 4
Independent Electricity System Operator (IESO) rules, THESL must also comply 5
with the IESO Wholesale Revenue Metering Standards –Hardware and IESO Market 6
Rules hereto provided as Appendices C and D, respectively. 7
8
THESL’s IESO-approved proposal to complete full meter upgrades at all applicable 9
delivery points by 2021 is provided as Appendix A to this Schedule. 10
11
c) Please state the estimated total cost of all the WMMSC replacements needed 12
from 2012-2021. 13
14
RESPONSE: 15
c) The estimated total cost of all the WMMSC replacements needed from 2012-2021 is 16
$20,560,000 as per the above schedule and cost estimates. 17
18
d) Please describe THESL’s process for determining which replacements would be 19
carried out in 2012-2014 and which would be deferred beyond 2014. 20
21
RESPONSE: 22
d) THESL prioritized the WMMSC replacements for the 2012-2014 based on: 23
/U

Toronto Hydro-Electric System Limited EB-2012-0064
Tab 6F Schedule 1-62
Filed: 2012 Oct 5 Updated: 2012 Nov 16
Page 7 of 7
RESPONSES TO ONTARIO ENERGY BOARD STAFF INTERROGATORIES ON ISSUE 2.2
Panel: Capital Projects
1) Regulatory compliance (seal expiry, IT’s that do not meet current accuracy 1
requirements) – these meters must be replaced to remain in compliance with 2
Measurement Canada and IESO Regulations. 3
2) Planned switchgear replacements – the metering upgrades are more cost 4
effective in conjunction with switch gear replacement. 5
3) Availability of HONI resources – HONI is eager to transfer the responsibility 6
of being the MSP to Toronto Hydro and has committed resources for 2013 7
and 2014 to expedite the process. 8
9
Complicated replacements, that are more effectively done in conjunction with 10
switchgear replacements or more resource intensive replacements, were deferred until 11
past 2014. 12

Toronto Hydro-Electric System Limited EB-2012-0064
Tab 6F Schedule 1-73
Filed: 2012 Oct 5 Updated: 2012 Nov 16
Page 1 of 2
RESPONSES TO ONTARIO ENERGY BOARD STAFF INTERROGATORIES ON ISSUE 2.2
Panel: Capital Projects
INTERROGATORY 73: 1
Reference(s): T4/S C3/pp. 1-2 2
3
Page 1 of the reference states that THESL’s Fleet is currently composed of 749 motor 4
vehicles, including cars, pickups, bucket trucks and other vehicles (such as sweepers, 5
backhoes and forklifts). Table 1 shows the various vehicle types, number of 6
replacements and capital expenditures for each of 2012, 2013 and 2014. Based on 7
Table1, the numbers of vehicles proposed for replacement are 21, 14 and 9 in 2012, 2013 8
and 2014 respectively at a cost of $2.00M per year. 9
10
a) Please add a column to Table 1 to indicate the total number of vehicles in 11
THESL’s fleet for each of the vehicle categories listed. 12
13
RESPONSE: 14
a) Please see the table below, which forecasts categories of THESL’s fleet in which 15
replacement vehicles are required. 16
Number Cost Number Cost Number CostCar/Light Truck 5 0.14 ‐ ‐ ‐ ‐ 322Derrick 2 0.35 ‐ ‐ ‐ ‐ 43Forklift 1 0.11 ‐ ‐ ‐ ‐ 28Bucket Truck (Various Designs) ‐ ‐ ‐ ‐ 6 1.69 135Cube Van ‐ ‐ 18 1.90 3 0.31 64Vehicle Sub‐Total 8 0.60 18 1.90 9 2.00
On‐Vehicle EquipmentRubber Power Line Covers 0.20 0.10 ‐ Total 0.80 2.00 2.00
2012 Current No. of Vehicles in Service*Vehicle Description
2013 2014
*Vehicle count information is as of Sept. 14, 2012.
/U

Toronto Hydro-Electric System Limited EB-2012-0064
Tab 6F Schedule 1-73
Filed: 2012 Oct 5 Updated: 2012 Nov 16
Page 2 of 2
RESPONSES TO ONTARIO ENERGY BOARD STAFF INTERROGATORIES ON ISSUE 2.2
Panel: Capital Projects
b) Please state whether or not the numbers of vehicle replacements proposed for 1
2012-2014 (average of 11 replacements peer year) typical of the number of 2
replacements in the last 5 years. Please explain. 3
4
RESPONSE: 5
b) The number of vehicles proposed for replacement for 2012 to 2014 is lower than the 6
numbers proposed in recent years. For the period 2009 to 2011, THESL purchased an 7
average of 115 vehicles per year. The decrease in the planned vehicle replacements 8
for 2012 to 2014 is due to THESL’s decision to significantly reduce planned capital 9
expenditures for the period 2012 to 2014. 10
11
The information presented in Table 1 represents the vehicles that have the most 12
urgent need of replacement, as determined through the analysis of historical 13
maintenance costs, and the use of predictive modelling to estimate future operating 14
costs. THESL anticipates that fleet vehicle maintenance and operating costs will 15
increase during the period 2012 to 2014 as the average age of the fleet increases 16
significantly through year 2014. 17

Toronto Hydro-Electric System Limited EB-2012-0064
Tab 6F Schedule 2-30
Filed: 2012 Oct 5 Updated: 2012 Nov 16
Page 1 of 3
RESPONSES TO ASSOCIATION OF MAJOR POWER CONSUMERS IN ONTARIO INTERROGATORIES ON ISSUE 2.2
Panel: Capital Projects
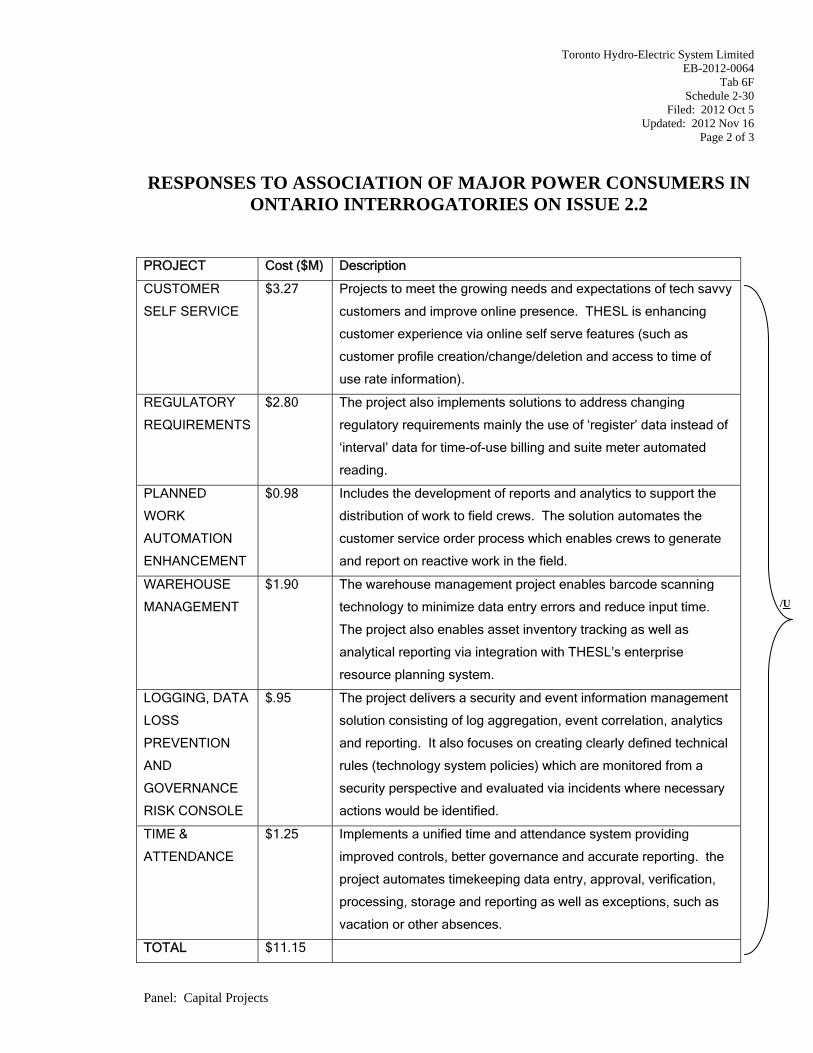
INTERROGATORY 30: 1
Reference(s): Tab 4, Schedule C2 2
3
a) Please provide a breakdown of the 2011 Carryover Projects into 2012 in Table 1 on 4
Page 1. 5
6
RESPONSE: 7
a) Please see the table below. 8
Toronto Hydro-Electric System Limited EB-2012-0064
Tab 6F Schedule 2-30
Filed: 2012 Oct 5 Updated: 2012 Nov 16
Page 2 of 3
RESPONSES TO ASSOCIATION OF MAJOR POWER CONSUMERS IN ONTARIO INTERROGATORIES ON ISSUE 2.2
Panel: Capital Projects
PROJECT Cost ($M) Description
CUSTOMER
SELF SERVICE
$3.27 Projects to meet the growing needs and expectations of tech savvy
customers and improve online presence. THESL is enhancing
customer experience via online self serve features (such as
customer profile creation/change/deletion and access to time of
use rate information).
REGULATORY
REQUIREMENTS
$2.80 The project also implements solutions to address changing
regulatory requirements mainly the use of ‘register’ data instead of
‘interval’ data for time-of-use billing and suite meter automated
reading.
PLANNED
WORK
AUTOMATION
ENHANCEMENT
$0.98 Includes the development of reports and analytics to support the
distribution of work to field crews. The solution automates the
customer service order process which enables crews to generate
and report on reactive work in the field.
WAREHOUSE
MANAGEMENT
$1.90 The warehouse management project enables barcode scanning
technology to minimize data entry errors and reduce input time.
The project also enables asset inventory tracking as well as
analytical reporting via integration with THESL’s enterprise
resource planning system.
LOGGING, DATA
LOSS
PREVENTION
AND
GOVERNANCE
RISK CONSOLE
$.95 The project delivers a security and event information management
solution consisting of log aggregation, event correlation, analytics
and reporting. It also focuses on creating clearly defined technical
rules (technology system policies) which are monitored from a
security perspective and evaluated via incidents where necessary
actions would be identified.
TIME &
ATTENDANCE
$1.25 Implements a unified time and attendance system providing
improved controls, better governance and accurate reporting. the
project automates timekeeping data entry, approval, verification,
processing, storage and reporting as well as exceptions, such as
vacation or other absences.
TOTAL $11.15
/U

Toronto Hydro-Electric System Limited EB-2012-0064
Tab 6F Schedule 2-30
Filed: 2012 Oct 5 Updated: 2012 Nov 16
Page 3 of 3
RESPONSES TO ASSOCIATION OF MAJOR POWER CONSUMERS IN ONTARIO INTERROGATORIES ON ISSUE 2.2
Panel: Capital Projects
b) Please provide the useful life for IT hardware assets. 1
2
RESPONSE: 3
b) Please see the table below. 4
Please also refer to response to OEB Staff interrogatory 72 (Tab 6F, Schedule 1-72). 5
IT Hardware Asset Category Asset Useful Life (Years)
Servers 6
Storage and Backup 6
Network and Telephony 6
Printers and Plotters 5
User Endpoints (e.g., desktops, laptops etc.) 4
Security Appliances (e.g., Firewall System, Enterprise Data
Warehouse, etc.)
4
Toronto Hydro-Electric System Limited EB-2012-0064
Tab 6F Schedule 2-31
Filed: 2012 Oct 5 Updated: 2012 Nov 16
Page 1 of 2
RESPONSES TO ASSOCIATION OF MAJOR POWER CONSUMERS IN ONTARIO INTERROGATORIES ON ISSUE 2.2
Panel: Capital Projects
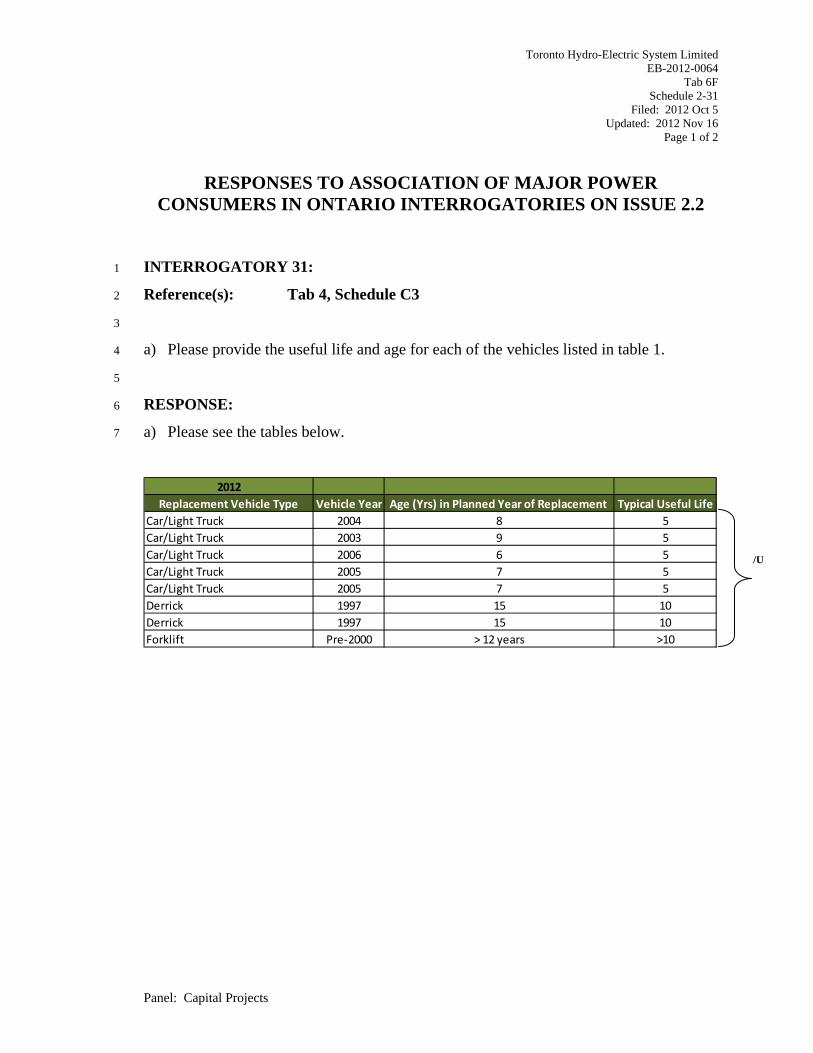
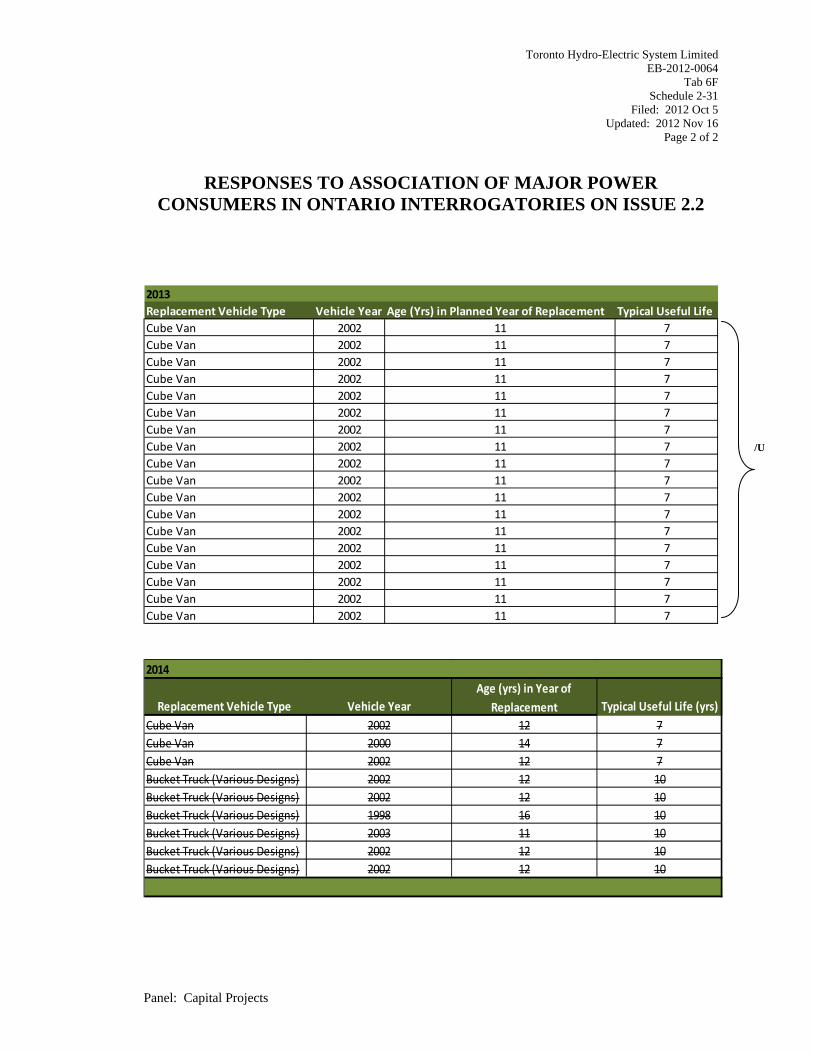
INTERROGATORY 31: 1
Reference(s): Tab 4, Schedule C3 2
3
a) Please provide the useful life and age for each of the vehicles listed in table 1. 4
5
RESPONSE: 6
a) Please see the tables below. 7
2012Replacement Vehicle Type Vehicle Year Age (Yrs) in Planned Year of Replacement Typical Useful Life
Car/Light Truck 2004 8 5Car/Light Truck 2003 9 5Car/Light Truck 2006 6 5Car/Light Truck 2005 7 5Car/Light Truck 2005 7 5Derrick 1997 15 10Derrick 1997 15 10Forklift Pre‐2000 > 12 years >10
/U
Toronto Hydro-Electric System Limited EB-2012-0064
Tab 6F Schedule 2-31
Filed: 2012 Oct 5 Updated: 2012 Nov 16
Page 2 of 2
RESPONSES TO ASSOCIATION OF MAJOR POWER CONSUMERS IN ONTARIO INTERROGATORIES ON ISSUE 2.2
Panel: Capital Projects
2013Replacement Vehicle Type Vehicle Year Age (Yrs) in Planned Year of Replacement Typical Useful LifeCube Van 2002 11 7Cube Van 2002 11 7Cube Van 2002 11 7Cube Van 2002 11 7Cube Van 2002 11 7Cube Van 2002 11 7Cube Van 2002 11 7Cube Van 2002 11 7Cube Van 2002 11 7Cube Van 2002 11 7Cube Van 2002 11 7Cube Van 2002 11 7Cube Van 2002 11 7Cube Van 2002 11 7Cube Van 2002 11 7Cube Van 2002 11 7Cube Van 2002 11 7Cube Van 2002 11 7
2014
Replacement Vehicle Type Vehicle YearAge (yrs) in Year of
Replacement Typical Useful Life (yrs)Cube Van 2002 12 7Cube Van 2000 14 7Cube Van 2002 12 7Bucket Truck (Various Designs) 2002 12 10Bucket Truck (Various Designs) 2002 12 10Bucket Truck (Various Designs) 1998 16 10Bucket Truck (Various Designs) 2003 11 10Bucket Truck (Various Designs) 2002 12 10Bucket Truck (Various Designs) 2002 12 10
/U
Toronto Hydro-Electric System Limited EB-2012-0064
Tab 6F Schedule 9-3
Filed: 2012 Oct 5 Updated: 2012 Nov 16
Page 1 of 1
RESPONSES TO POLLUTION PROBE INTERROGATORIES ON ISSUE 2.2
Panel: Capital Projects
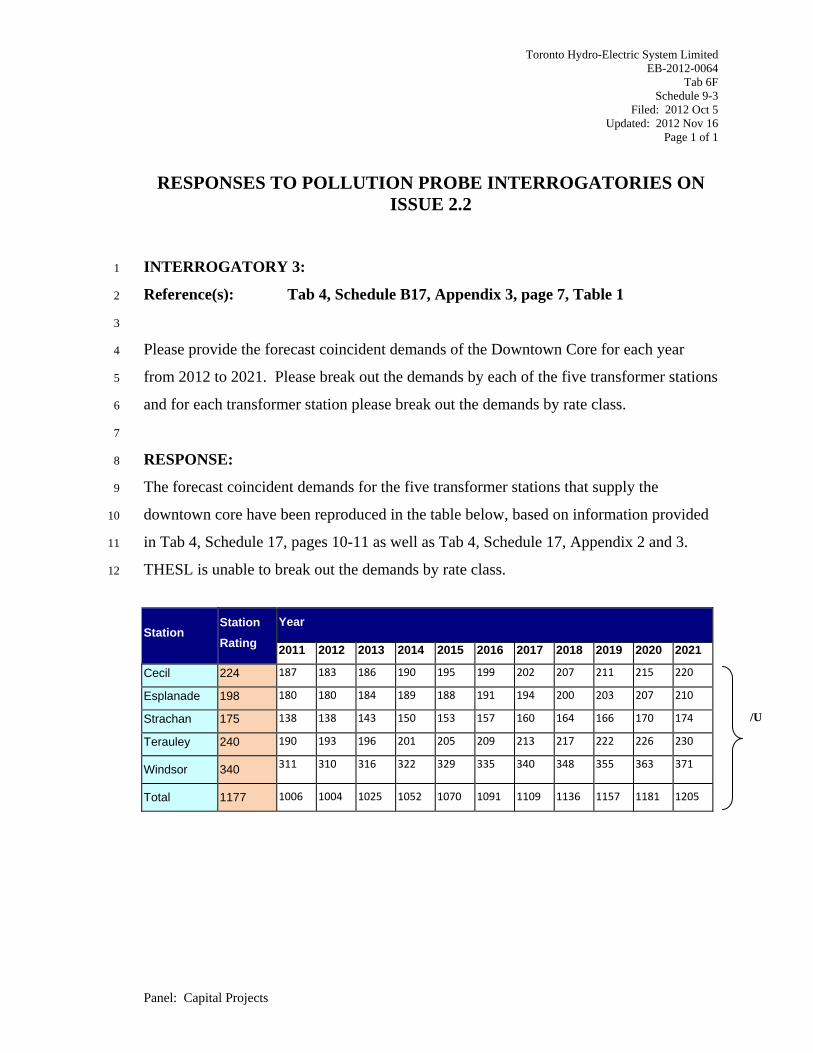
INTERROGATORY 3: 1
Reference(s): Tab 4, Schedule B17, Appendix 3, page 7, Table 1 2
3
Please provide the forecast coincident demands of the Downtown Core for each year 4
from 2012 to 2021. Please break out the demands by each of the five transformer stations 5
and for each transformer station please break out the demands by rate class. 6
7
RESPONSE: 8
The forecast coincident demands for the five transformer stations that supply the 9
downtown core have been reproduced in the table below, based on information provided 10
in Tab 4, Schedule 17, pages 10-11 as well as Tab 4, Schedule 17, Appendix 2 and 3. 11
THESL is unable to break out the demands by rate class. 12
Station Station Rating
Year
2011 2012 2013 2014 2015 2016 2017 2018 2019 2020 2021
Cecil 224 187 183 186 190 195 199 202 207 211 215 220
Esplanade 198 180 180 184 189 188 191 194 200 203 207 210
Strachan 175 138 138 143 150 153 157 160 164 166 170 174
Terauley 240 190 193 196 201 205 209 213 217 222 226 230
Windsor 340 311 310 316 322 329 335 340 348 355 363 371
Total 1177 1006 1004 1025 1052 1070 1091 1109 1136 1157 1181 1205
/U

Toronto Hydro-Electric System Limited EB-2012-0064
Tab 6F Schedule 10-17
Filed: 2012 Oct 5 Updated: 2012 Nov 16
Page 1 of 1
RESPONSES TO SCHOOL ENERGY COALITION INTERROGATORIES ON ISSUE 2.2
Panel: Capital Projects
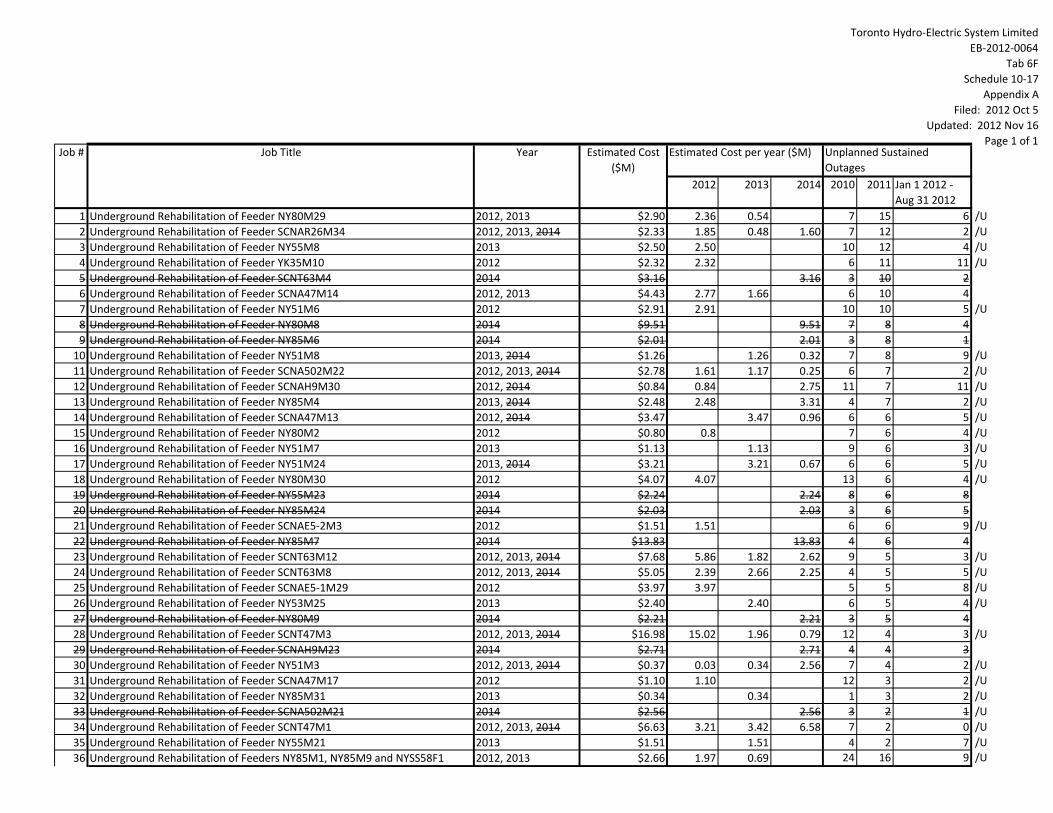
INTERROGATORY 17: 1
Reference(s): Tab 4/B1/p.3 2
3
Please expand Table 1 to include: 4
a. Estimated cost per year 5
b. Unplanned sustained outages for 2010 6
c. Unplanned sustained outages for 2011 7
d. Unplanned sustained outages year to date 8
9
RESPONSE: 10
The requested information is provided in the attached table in Appendix A. 11
Toronto Hydro‐Electric System LimitedEB‐2012‐0064
Tab 6FSchedule 10‐17
Appendix AFiled: 2012 Oct 5
Updated: 2012 Nov 16Page 1 of 1
2012 2013 2014 2010 2011 Jan 1 2012 ‐ Aug 31 2012
1 Underground Rehabilitation of Feeder NY80M29 2012, 2013 $2.90 2.36 0.54 7 15 6 /U2 Underground Rehabilitation of Feeder SCNAR26M34 2012, 2013, 2014 $2.33 1.85 0.48 1.60 7 12 2 /U3 Underground Rehabilitation of Feeder NY55M8 2013 $2.50 2.50 10 12 4 /U4 Underground Rehabilitation of Feeder YK35M10 2012 $2.32 2.32 6 11 11 /U5 Underground Rehabilitation of Feeder SCNT63M4 2014 $3.16 3.16 3 10 26 Underground Rehabilitation of Feeder SCNA47M14 2012, 2013 $4.43 2.77 1.66 6 10 47 Underground Rehabilitation of Feeder NY51M6 2012 $2.91 2.91 10 10 5 /U8 Underground Rehabilitation of Feeder NY80M8 2014 $9.51 9.51 7 8 49 Underground Rehabilitation of Feeder NY85M6 2014 $2.01 2.01 3 8 110 Underground Rehabilitation of Feeder NY51M8 2013, 2014 $1.26 1.26 0.32 7 8 9 /U11 Underground Rehabilitation of Feeder SCNA502M22 2012, 2013, 2014 $2.78 1.61 1.17 0.25 6 7 2 /U12 Underground Rehabilitation of Feeder SCNAH9M30 2012, 2014 $0.84 0.84 2.75 11 7 11 /U13 Underground Rehabilitation of Feeder NY85M4 2013, 2014 $2.48 2.48 3.31 4 7 2 /U14 Underground Rehabilitation of Feeder SCNA47M13 2012, 2014 $3.47 3.47 0.96 6 6 5 /U15 Underground Rehabilitation of Feeder NY80M2 2012 $0.80 0.8 7 6 4 /U16 Underground Rehabilitation of Feeder NY51M7 2013 $1.13 1.13 9 6 3 /U17 Underground Rehabilitation of Feeder NY51M24 2013, 2014 $3.21 3.21 0.67 6 6 5 /U18 Underground Rehabilitation of Feeder NY80M30 2012 $4.07 4.07 13 6 4 /U19 Underground Rehabilitation of Feeder NY55M23 2014 $2.24 2.24 8 6 820 Underground Rehabilitation of Feeder NY85M24 2014 $2.03 2.03 3 6 521 Underground Rehabilitation of Feeder SCNAE5‐2M3 2012 $1.51 1.51 6 6 9 /U22 Underground Rehabilitation of Feeder NY85M7 2014 $13.83 13.83 4 6 423 Underground Rehabilitation of Feeder SCNT63M12 2012, 2013, 2014 $7.68 5.86 1.82 2.62 9 5 3 /U24 Underground Rehabilitation of Feeder SCNT63M8 2012, 2013, 2014 $5.05 2.39 2.66 2.25 4 5 5 /U25 Underground Rehabilitation of Feeder SCNAE5‐1M29 2012 $3.97 3.97 5 5 8 /U26 Underground Rehabilitation of Feeder NY53M25 2013 $2.40 2.40 6 5 4 /U27 Underground Rehabilitation of Feeder NY80M9 2014 $2.21 2.21 3 5 428 Underground Rehabilitation of Feeder SCNT47M3 2012, 2013, 2014 $16.98 15.02 1.96 0.79 12 4 3 /U29 Underground Rehabilitation of Feeder SCNAH9M23 2014 $2.71 2.71 4 4 330 Underground Rehabilitation of Feeder NY51M3 2012, 2013, 2014 $0.37 0.03 0.34 2.56 7 4 2 /U31 Underground Rehabilitation of Feeder SCNA47M17 2012 $1.10 1.10 12 3 2 /U32 Underground Rehabilitation of Feeder NY85M31 2013 $0.34 0.34 1 3 2 /U33 Underground Rehabilitation of Feeder SCNA502M21 2014 $2.56 2.56 3 2 1 /U34 Underground Rehabilitation of Feeder SCNT47M1 2012, 2013, 2014 $6.63 3.21 3.42 6.58 7 2 0 /U35 Underground Rehabilitation of Feeder NY55M21 2013 $1.51 1.51 4 2 7 /U36 Underground Rehabilitation of Feeders NY85M1, NY85M9 and NYSS58F1 2012, 2013 $2.66 1.97 0.69 24 16 9 /U
Estimated Cost per year ($M) Unplanned Sustained Outages
Job # YearJob Title Estimated Cost ($M)

Toronto Hydro-Electric System Limited EB-2012-0064
Tab 6F Schedule 11-55
Filed: 2012 Oct 5 Updated: 2012 Nov 16
Page 1 of 2
RESPONSES TO VULNERABLE ENERGY CONSUMERS COALITION INTERROGATORIES ON ISSUE 2.2
Panel: Capital Projects
INTERROGATORY 55: 1
Reference(s): Tab 4, Schedule B5, Section V (Description of Work) 2
3
a) For many of the jobs, the stated objective is to prepare the MS for conversion from 4
4.16kV to 13.8kV. When will these conversions actually occur? If within the 2012-5
2014 period, where are the decommissioning costs reflected? 6
7
RESPONSE: 8
a) “Conversion” from 4kV to 13.8kV refers to the 4kV feeders themselves, rather than 9
the 4kV municipal stations (MS). Once all 4kV feeders from a given MS are 10
converted to 13.8kV, the MS will no longer have any load and can be de-11
energized/decommissioned. Assuming all projects in this portfolio will be executed, 12
the following stations will have no load and will be ready for de-energization and 13
eventual decommissioning by the following years: 14
• Hazelwood MS – 2014 15
• College MS – 2013 16
• Keele & St Clair – 2013 17
• Merton MS – 2014 18
• Millwood MS – 2014 19
• Dufferin MS – 2014 20
21
The cost of decommissioning the stations was not included. The high level estimate 22
for station decommissioning cost is relatively small at ~$50k per station. However, 23
potential savings from spare parts inventory from station equipment deemed in 24
reusable condition (which avoids purchasing legacy spares) could potentially offset 25
/U
Toronto Hydro-Electric System Limited EB-2012-0064
Tab 6F Schedule 11-55
Filed: 2012 Oct 5 Updated: 2012 Nov 16
Page 2 of 2
RESPONSES TO VULNERABLE ENERGY CONSUMERS COALITION INTERROGATORIES ON ISSUE 2.2
Panel: Capital Projects
the station decommissioning cost to some degree. As result, station decommissioning 1
costs were not included. 2

Toronto Hydro-Electric System Limited EB-2012-0064
Tab 6L Schedule 6-24
Filed: 2012 Oct 5 Updated: 2012 Nov 16
Page 1 of 2
RESPONSES TO CONSUMERS COUNCIL OF CANADA INTERROGATORIES ON ISSUE 4.2
Panel: Rates and Revenue Requirement
INTERROGATORY 24: 1
Reference(s): none provided 2
3
Assuming THESL’s application, as filed, is accepted by the Board, please set out the 4
distribution rate increase for a typical residential customer for each year 2012-2014. In 5
addition, please provide the total bill impact for a typical residential customer for each 6
year. 7
8
RESPONSE: 9
The updated information requested can be found in Tab 3, Schedule C1.2, page 1 and 10
Tab 3, Schedule C2.2, page 1. For convenience, the information is summarized below. 11
Monthly Bill Change ($) Change (%)
2011 Approved Rates
2012 Interim Rates
2013 Proposed
2012 over 2011
2013 over 2012
2012 over 2011
2013 over 2012
Distribution (incldg. rate riders) $29.50 $31.33 $35.37 $1.83 $4.04 6.2% 12.9%Transmission $10.09 $10.09 $11.36 $0.00 $1.27 0.0% 12.5%Regulatory, DRC and Energy $72.94 $76.33 $76.33 $3.39 $0.00 4.6% 0.0%Total bill (before taxes) $112.53 $117.75 $123.05 $5.22 $5.30 4.6% 4.5%
Evidence Reference
Tab 3, Schedule C1.2, p.1
Tab 3, Schedule C2.2, p.1
Tab 3, Schedule C2.2, p.1
/U

Toronto Hydro-Electric System Limited EB-2012-0064
Tab 6L Schedule 6-24
Filed: 2012 Oct 5 Updated: 2012 Nov 16
Page 2 of 2
RESPONSES TO CONSUMERS COUNCIL OF CANADA INTERROGATORIES ON ISSUE 4.2
Panel: Rates and Revenue Requirement
As described in its cover letter, dated October 31, 2012, THESL has asked the OEB to 1
consider the work programs identified for 2012 and 2013 together, and to defer 2
consideration of the work program for 2014 to a later date. In light of this requested 3
bifurcation of the proceeding and THESL’s obligation to update the 2014 information for 4
any material changes prior to it being reviewed, it would not assist the OEB or 5
intervenors to provide the 2014 information requested in this interrogatory during the first 6
phase of this application. 7