re-inversion of surface electrical resistivity tomography data from
TRANSCRIPT

PNNL-22520
Prepared for the U.S. Department of Energy under Contract DE-AC05-76RL01830
RPT-DVZ-AFRI-014
Re-inversion of Surface Electrical Resistivity Tomography Data from the Hanford Site B-Complex TC Johnson DM Wellman May 2013

PNNL-22520
Re-inversion of Surface Electrical Resistivity Tomography Data from the Hanford Site B-Complex TC Johnson DM Wellman May 2013 Prepared for the U.S. Department of Energy under Contract DE-AC05-76RL01830 Pacific Northwest National Laboratory Richland, Washington 99352


iii
Executive Summary
This report documents the three-dimensional (3D) inversion results of surface electrical resistivity tomography (ERT) data collected over the Hanford Site B-Complex. The data were collected to image the subsurface distribution of electrically conductive vadose zone contamination resulting from both planned releases of contamination into subsurface infiltration galleries (cribs, trenches, and tile fields) and unplanned releases from the B, BX, and BY tank farms and/or associated facilities. Electrically conductive contaminants are those that increase the ionic strength of pore fluids relative to native conditions. Most types of solutes released into the subsurface B-Complex were electrically conductive.
The ERT data were collected and originally inverted as described in the 2007 report Surface Geophysical Exploration of the B, BX, and BY Tank Farms at the Hanford Site,1 which provides detailed description of data collection and waste disposal history. Although the ERT imaging results presented in that report successfully delineated the footprint of vadose zone contamination in areas outside of the tank farms, imaging resolution was not optimized because the available inversion codes could not optimally process the massive ERT data set collected at the site. Recognizing these limitations and the potential for enhanced ERT characterization and time-lapse imaging at contaminated sites, a joint effort was initiated in 2007 by the U.S. Department of Energy (DOE) Office of Science, with later support from the DOE Office of Environmental Management and the U.S. Department of Defense, to develop a high-performance distributed memory parallel 3D ERT inversion code capable of optimally processing large ERT data sets. The culmination of this effort was the development of E4D.2,3
In 2012, under the Deep Vadose Zone Applied Field Research Initiative, the DOE Richland Operations Office and CH2M HILL Plateau Remediation Company commissioned an effort for Pacific Northwest National Laboratory to re-invert the ERT data collected over the B-Complex using E4D, with the objective to improve imaging resolution and better understand the distribution of vadose zone contamination at the B-Complex. The details and results of that effort as documented in this report display a significant improvement in ERT image resolution, revealing the nature and orientation of contaminant plumes originating in former infiltration galleries and extending toward the water table. In particular, large plumes originating in the BY-Cribs area appear to have intercepted, or are close to intercepting, the water table after being diverted eastward, possibly by the same low permeability unit causing perched water north of the B Tank Farm boundary. Contaminant plumes are also evident beneath the BX-Trenches, but do not appear to have intercepted the water table. Imaging results within the tank farms themselves are highly biased by the dense network of electrically conductive tanks and dry wells, and are therefore inconclusive concerning contaminant distributions beneath tanks. However, beneath the diversion boxes, the results do reveal highly conductive anomalies that are not associated with metallic infrastructure, and may be diagnostic of extensive contamination. Overall, the parallel ERT inversion provides additional detail concerning contaminated zones in terms of conductive anomalies. These 1 Rucker et al. 2007. Surface Geophysical Exploration of the B, BX, and BY Tank Farms at the Hanford Site. RPP-34690, Rev 0, CH2M HILL Hanford Group, Inc., Richland, WA. 2 Johnson et al. 2012. Characterization of a contaminated wellfield using 3D electrical resistivity tomography implemented with geostatistical, discontinuous boundary, and known conductivity constraints. Geophysics 77(6):11, DOI: 10.1190/GEO2012-0121.1. 3 Johnson et al. 2010. Improved hydrogeophysical characterization and monitoring through parallel modeling and inversion of time-domain resistivity and induced-polarization data. Geophysics 75(4):Wa27-Wa41, DOI: 10.1190/1.3475513.

iv
anomalies are consistent with waste disposal histories, and in several cases reveal lateral contaminant transport caused by heterogeneity within the vadose zone.

v
Acknowledgments
Surface electrical resistivity tomography data used in this report were collected and provided by hydroGEOPHYSICS, Inc. The data were inverted on the Olympus cluster at the Pacific Northwest National Laboratory Institutional Computing Center. This document was prepared by the Deep Vadose Zone-Applied Field Research Initiative at Pacific Northwest National Laboratory. Coding developments for E4D used in the B-Complex inversion were funded by the U.S. Department of Energy (DOE) Office of Science, DOE Office of Environmental Management, and the U.S. Department of Defense under the Environmental Security Certification Program. Funding for this work was provided by the DOE Office of Environmental Management and Richland Operations Office. Pacific Northwest National Laboratory is operated by Battelle Memorial Institute for DOE under contract DE-AC05-76RL01830.

vi
Acronyms and Abbreviations
3D three-dimensional 4D four-dimensional DOE U.S. Department of Energy ERT electrical resistivity tomography LiDAR Light Detection and Ranging ML million liters PNNL Pacific Northwest National Laboratory S/m siemens per meter

vii
Contents
Executive Summary ..................................................................................................................................... iii Acknowledgments ......................................................................................................................................... v Acronyms and Abbreviations ...................................................................................................................... vi 1.0 Introduction .......................................................................................................................................... 1 2.0 B-Complex ERT Data Set .................................................................................................................... 3 3.0 ERT Computational Mesh .................................................................................................................... 5 4.0 Inversion Statistics ................................................................................................................................ 7 5.0 Imaging Results .................................................................................................................................... 8
5.1 B, BX, and BY Tank Farms ......................................................................................................... 9 5.2 BX-Trenches, B7-B8 Cribs and Tile Field ................................................................................. 11 5.3 BY-Cribs .................................................................................................................................... 14
6.0 Conclusions ........................................................................................................................................ 17 7.0 References .......................................................................................................................................... 18 Appendix A Supplemental BY-Cribs ERT Image Sections ..................................................................... A.1

viii
Figures
Figure 1. A) Plan view of Hanford B-Complex showing locations of storage tanks, infiltration galleries, wells, and electrodes. B) Summary of the major disposal inventories within B-Complex infiltration galleries in terms of volume in millions of liters and approximate ionic strength. Unplanned waste releases within the tank farms are not represented. ................................................................................................................................... 4
Figure 2. B-Complex ERT computational mesh. A) Full mesh showing boundary locations and refinement about remote electrodes and B-Complex area. B) Mesh surface in B-Complex area showing LiDAR-derived surface topography and surface electrode locations with respect to tank farms and infiltration galleries. C) Transparent view of mesh surface revealing tank boundaries incorporated into mesh. ................................................ 6
Figure 3. Plan view of 3D bulk conductivity distribution beneath the B-Complex with elevated regions outlined by transparent isosurfaces. Elevated bulk conductivity regions originating from the infiltration galleries outside of the tank farms are diagnostic of high ionic strength (e.g., contaminated) pore water in the vadose zone. Bulk conductivity within the tank farm boundaries is largely dominated by the metallic tanks and dry wells, and is therefore inconclusive concerning contaminant distribution. The exception to this includes the regions beneath the diversion boxes, where deep metallic infrastructure is minimal and elevated conductivities are indicative of vadose zone contamination. .............................................................................................................................. 8
Figure 4. Plan view of B Tank Farm ERT inversion results at selected depths. The high conductivities beneath the tanks are likely caused by the dense network of monitoring wells, which mask the conductivity of contaminated soil. The anomaly beneath the diversion box (shown within white oval) is not associated with metallic infrastructure, and may indicate high-level soil contamination due to waste releases from the diversion box. ............................................................................................................................................. 10
Figure 5. Plan view of BX and BY Tank Farms ERT inversion results at selected depths. The high conductivities beneath the tanks are likely caused by the dense network of monitoring wells, which mask the conductivity of contaminated soil. The anomalies beneath the diversion boxes (shown within white ovals) are not associated with metallic infrastructure, and may indicate high-level soil contamination due to waste releases from diversion boxes. ................................................................................................................. 11
Figure 6. A) ERT inversion results in the BX-Trenches area suggesting a relatively diffuse plume resulting primarily from vertical contaminant migration centered at Northing = 137330 m trench. This is consistent with disposal loading shown in Figure 1B. B) ERT inversion results in the Tile-Field area suggesting vertical migration from the B8 infiltration crib in the upper elevations, followed by horizontal migration at depth. ................. 13
Figure 7. ERT inversion results in the BY-Cribs area suggesting three distinct plumes: 1) a central plume resulting from vertical migration beneath the cribs, 2) an eastward trending plume apparently originating at the northeastern-most crib, and oriented at approximately 30 degrees from horizontal moving downward through the vadose zone, and 3) a southeast trending plume that apparently originates from the central plume at depth, and is oriented horizontally in the 130 to 160 m elevation range. ................................... 15
Figure 8. Comparison between E4D inversion (left column) and the original inversion (right column) shown in Rucker et al. (2007) over the BY-Cribs area. Results are shown as depth sections. ............................................................................................................................ 16

ix
Tables
Table 1. Memory and run time statistics for forward computations. ........................................................... 7 Table 2. Memory and run time statics for Jacobian matrix construction. .................................................... 7 Table 3. Run time statistics for inverse solutions. ....................................................................................... 7


1
1.0 Introduction
This report documents the three-dimensional (3D) inversion results of surface electrical resistivity tomography (ERT) data collected over the Hanford Site B-Complex. The data were collected to image the subsurface distribution of electrically conductive vadose zone contamination resulting from both planned releases of contamination into subsurface infiltration galleries (cribs, trenches, and tile fields) and unplanned releases from the B, BX, and BY tank farms and/or associated facilities. Electrically conductive contaminants are those that increase the ionic strength of pore fluids relative to native conditions. Most types of solutes released into the subsurface B-Complex were electrically conductive.
The ERT data were collected and originally inverted as described in the 2007 report Surface Geophysical Exploration of the B, BX, and BY Tank Farms at the Hanford Site (Rucker et al. 2007), which provides detailed description of data collection and waste disposal history. Although the ERT imaging results presented in that report successfully delineated the footprint of vadose zone contamination in areas outside of the tank farms, imaging resolution was not optimized because the available inversion codes could not optimally process the massive ERT data set collected at the site. Recognizing these limitations and the potential for enhanced ERT characterization and time-lapse imaging at contaminated sites, a joint effort was initiated in 2007 by the U.S. Department of Energy (DOE) Office of Science, with later support from the DOE Office of Environmental Management and the U.S. Department of Defense, to develop a high-performance distributed memory parallel 3D ERT inversion code capable of optimally processing large ERT data sets. The culmination of this effort was the development of E4D (Johnson et al. 2010, 2012).
In 2012, under the Deep Vadose Zone Applied Field Research Initiative, the DOE Richland Operations Office and CH2M HILL Plateau Remediation Company commissioned an effort for Pacific Northwest National Laboratory (PNNL) to re-invert the ERT data collected over the B-Complex using E4D, with the objective to improve imaging resolution and better understand the distribution of vadose zone contamination at the B-Complex. The details and results of that effort are documented in this report.
The Hanford Site is a former weapons grade plutonium production facility that was initiated in 1942 as part of the Manhattan Project, and was operated until the early 1990s. Waste management practices at the Hanford Site included storing high-level nuclear waste in underground tanks and discharging lower level waste streams into engineered subsurface infiltration galleries, resulting in widespread contamination of the vadose zone and underlying groundwater (DOE-RL 2010, p. 185). The B-Complex is a former waste disposal facility consisting of 40 single-shell high-level waste storage tanks, many of which have leaked or experienced accidental overfill episodes, and several outlying subsurface infiltration galleries. The waste streams introduced into the vadose zone were highly saline and created contaminated zones of elevated bulk electrical conductivity in contrast to the native low conductivity sands and gravels (Serne et al. 2002; Lindenmeier et al. 2002). The waste poses a significant risk to groundwater quality, and determining the distribution of vadose zone contamination remains one of the most significant challenges limiting remediation and closure of Hanford Site waste disposal facilities (DOE-RL 2010, p. 185).
The chemistry of disposed waste varied across the B-Complex infiltration galleries and among the tank farms, as well as among individual tanks in a single tank farm, based on the processes used to chemically strip plutonium from uranium fuel rods. Both weapons grade and fuel grade plutonium were

2
produced from 1944 to 1990, and five different plants were constructed to facilitate plutonium production. In total, Hanford processed nearly 97 × 103 metric tons of uranium using chemical precipitation and solvent extraction techniques (Gephart 2010). Wastes resulting from these techniques were highly saline and included both heavy metal and radiological constituents. At tank concentrations, these wastes have a fluid conductivity of about 10.0 siemens per meter (S/m) (Rucker et al. 2012). Although infiltrated wastes were more dilute, their introduction typically increased the bulk conductivity of Hanford sediments by several orders of magnitude over the native value of approximately 0.7 × 10⁻³ S/m.
Owing to the electrical conductivity contrast between contaminated and pristine soils at the B-Complex, a large-scale surface resistivity survey was conducted with the intent of utilizing ERT to map the distribution of subsurface contamination resulting from past waste disposal operations (Rucker et al. 2007). Data were collected along 36 lines using a pole-pole survey configuration with 4,859 electrodes to produce a data set consisting of 208,411 transfer resistance measurements, covering an area of approximately 0.4 km2. Effectively inverting a data set of this size with optimal imaging resolution is a significant computational challenge. Johnson et al. (2010) presented a scalable ERT inversion algorithm, E4D, which enables large ERT data sets to be inverted on parallel distributed memory computing systems. The algorithm is based on a finite element solution to the Poisson equation on an unstructured tetrahedral mesh (Gunther et al. 2006), enabling optimal mesh configurations that honor surface topography, known boundaries or subsurface structures, and with efficient refinement around the electrodes.
The entire B-Complex ERT data set was inverted simultaneously on a high-quality mesh of more than 1 million elements that incorporates the water table and single-shell tank boundaries, as well as surface topography extracted from airborne Light Detection and Ranging (LiDAR) data. Regularization was customized by removing smoothness constraints across known conductivity boundaries at the tank-soil interfaces and water table boundary, enabling the inversion to place sharp conductivity contrasts where they’re known to exist naturally without penalty.

3
2.0 B-Complex ERT Data Set
Figure 1A shows the relative locations of major B-Complex features, including the tank farms, infiltration galleries, wells, and electrodes. Stainless steel electrodes were laid out in lines parallel and perpendicular to the tanks at a separation of approximately 30 m with an intra-electrode spacing of 6 m and 3 m inside and outside of the tank farm boundaries, respectively. The 36 lines across the site varied in length from 417 to 816 m. Data acquisition commenced in November 2006 and lasted approximately 4 months. A SuperSting R8 resistivity meter was used for data collection using a pole-pole survey configuration. A base spread of 224 electrodes was used with four 56-electrode switchboxes. Remote electrodes were placed orthogonally to the northeast and northwest approximately 1,900 m from the center of the domain in either direction. The final data set consists of 208,411 pole-pole measurements collected on 4,859 electrodes.
Figure 1B shows the locations of the primary waste releases into B-Complex infiltration galleries (CH2M HILL 2003; Westinghouse 1996). The area of the circles represents the volume of waste released in millions of liters (ML), and the color scale represents the approximate ionic strength of the waste. Regions where more than 18.9 ML were released are indicated in text. Higher disposal volumes were generally accompanied by more dilute waste. The exception occurred in the BY-Cribs area, which was subjected to high waste volumes with high ionic strengths. Note that Figure 1B does not include unplanned releases that occurred within the tank farm boundaries. Unplanned releases include spills, leaks, or tank overflow events that are of significantly lower volume than the planned releases in the galleries.

4
Figure 1. A) Plan view of Hanford B-Complex showing locations of storage tanks, infiltration galleries,
wells, and electrodes. B) Summary of the major disposal inventories within B-Complex infiltration galleries in terms of volume in millions of liters and approximate ionic strength. Unplanned waste releases within the tank farms are not represented.

5
3.0 ERT Computational Mesh
E4D uses the finite element method to compute the forward solution about an unstructured tetrahedral mesh, constructed using the TetGen software package (Si 2006). The B-Complex computational mesh is shown in Figure 2. Figure 2A shows the entire mesh including the extended boundaries to reduce boundary effects in the forward modeling, and refined regions about the remote and B-Complex electrode locations. Figure 2B shows the surface topography and electrode line locations. Figure 2C is a transparent version of Figure 2B showing the tank boundaries, which are modeled into the mesh at the correct dimensions according to historical drawings.
Electrode elevations range from 169.0 m at the northeast remote electrode to 206.7 m at the highest electrode, a difference of 37.6 m. The topography generally slopes downward to the northeast, with significant man-made topographic variations occurring within the B-Complex. To remove modeling errors and inversion artifacts associated with surface topography (Gunther et al. 2006), topographic variations extracted from airborne LiDAR data were incorporated into the mesh as shown in Figure 2. In addition, the mesh was refined around electrode locations to reduce modeling errors resulting from the large potential gradients that occur near current source electrodes (Lowry et al. 1989).
As shown in Figure 2A, the tank farms and associated monitoring wells comprise a dense network of metallic infrastructure likely to influence the ERT results and mask the locations of conductive contaminated soil zones. The most prominent metallic structures are the tanks themselves. Several researchers have noted improved ERT imaging results when regularization constraints are removed across known conductivity boundaries, enabling the inversion to place a sharp contrast in conductivity where one occurs in reality (Coscia et al. 2011; Doetsch et al. 2010). To enable this capability for the B-Complex inversion, tank boundaries were explicitly modeled into the mesh as shown in Figure 2C. In addition, a horizontal mesh boundary was placed at the water table elevation of approximately 127 m to remove regularization constraints across the sharp conductivity contrast associated with the increase in saturation (Wallin et al. 2013). In all, the mesh consists of 195,651 nodes and 1,087,585 elements ranging in volume from 1e-4 to 1e+9 m3. The maximum radius-edge ratio of any element is 1.3 (Si 2006), indicating a high-quality mesh.

6
Figure 2. B-Complex ERT computational mesh. A) Full mesh showing boundary locations and
refinement about remote electrodes and B-Complex area. B) Mesh surface in B-Complex area showing LiDAR-derived surface topography and surface electrode locations with respect to tank farms and infiltration galleries. C) Transparent view of mesh surface revealing tank boundaries incorporated into mesh.

7
4.0 Inversion Statistics
The data were inverted on 1,024 processors of the PNNL Institutional Computing Olympus computer. Olympus is a distributed memory parallel cluster with AMD Opteron 2.1 GHz processors, each processor having 2 GB of local memory. The inversion required approximately 11.5 hours of computation time and 21 iterations to converge to a normalized chi-squared value of 0.89, which was chosen using the L-curve criteria (Hansen and O’Leary 1993). Given the relatively small standard deviations chosen for the observed data (5% of the transfer resistance magnitude), this value indicates high-quality ERT data and a corresponding small data misfit. Details concerning the memory requirements and run times for the forward runs, Jacobian matrix computations, and inverse solutions are shown in Table 1, Table 2, and Table 3 respectively.
Table 1. Memory and run time statistics for forward computations.
Total # Pole
Solutions
Pole Solutions per
Processor
Total Memory
(GB)
Memory per Processor
(GB)
Mean / St. Dev. Run Time per
Forward Solution (min)
Mean / St. Dev. Run Time per
Pole (min)
Total Forward
Run Time (min)
4,859 4 to 5 3.803 0.003 to 0.004 3.25 / 0.89 0.65 / 0.25 68.25
Table 2. Memory and run time statics for Jacobian matrix construction.
Total Rows / Columns
Rows per Processor
Total Memory (GB)
Memory per Processor
(GB)
Mean / St. Dev. Build Time per Iteration
(min)
Total build time (min)
208,411 / 1,087,585 204 to 205 906.659 0.883 to 0.887 18.44 / 4.10 387.24
Table 3. Run time statistics for inverse solutions.
Inner Iterations per Outer Iteration
Mean / Std. Dev. Run Time per Outer Iteration
(min)
Total Run Time (min)
30-50 10.34 / 2.04 217.14

8
5.0 Imaging Results
Figure 3 shows a plan view of the inversion results over the entire B-Complex in terms of transparent bulk conductivity isosurfaces. Outside of the tank farms, these isosurfaces outline the 3D extent of elevated bulk conductivity regions that are diagnostic of vadose zone pore water contamination beneath the BX-Trenches, BY-Cribs, B7 and B8 Cribs, and the Tile Field.
Figure 3. Plan view of 3D bulk conductivity distribution beneath the B-Complex with elevated regions
outlined by transparent isosurfaces. Elevated bulk conductivity regions originating from the infiltration galleries outside of the tank farms are diagnostic of high ionic strength (e.g., contaminated) pore water in the vadose zone. Bulk conductivity within the tank farm boundaries is largely dominated by the metallic tanks and dry wells, and is therefore inconclusive concerning contaminant distribution. The exception to this includes the regions beneath the diversion boxes, where deep metallic infrastructure is minimal and elevated conductivities are indicative of vadose zone contamination.

9
As noted, elevated conductivities within the tank farm boundaries are primarily dominated by the metallic tanks and wells. The high conductivity regions beneath the diversion boxes in the tank farms are well below the depth of metallic transfer pipes, and given the magnitude of the conductive anomalies, are likely associated with highly contaminated pore water.
Figure 4 through Figure 8 focus on targeted areas of the B-Complex, showing the inversion results in plan view sections at 10 m intervals from near the surface at the 200 m elevation to approximately 3 m above the water table at the 130 m elevation. Each of these figures shows the locations of relevant features such as tanks, wells, infiltration gallery outlines, waste diversion boxes, and area boundaries as shown as a whole in Figure 3. Figure 4 focuses on the B Tank Farm, and Figure 5 focuses on the BX and BY Tank Farms. For Figure 4 and Figure 5, the tank outlines are shown on each section. However, only the 190 m section actually intersects the tanks and displays the tank conductivity values chosen by the inversion. Figure 6A and Figure 6B focus on the BX-Trenches and Tile Field areas, respectively (see Figure 3). Figure 7 focuses on the BY-Cribs area. Figure 8 compares the E4D imaging results with those of the previous analysis presented by Rucker et al. (2007), focusing on the BY-Cribs. Figure 4 through Figure 8 are shown at the mesh element scale, meaning that there is no post-inversion smoothing or interpolation applied to the ERT images.
5.1 B, BX, and BY Tank Farms
Figure 3 through Figure 5 display elevated bulk conductivity throughout the tank farms that increases with depth. These high conductivity regions cannot be attributed to contamination because of the dense network of conductive steel-cased monitoring wells surrounding the tanks, which mask the effects of high conductivity contaminated soils. The exception to the metallic interference issue may occur beneath the waste diversion boxes at the southern ends of the B and BX Tank Farms (see regions circled in white in Figure 4 and Figure 5). Waste diversion boxes were used to divert waste from source streams to specific tanks, and were exposed to high volumes of high-level wastes. In the B and BX farms, these boxes contain significant metallic infrastructure, but that infrastructure does not penetrate deep into the vadose zone. Conductive anomalies in excess of 1 S/m originating from each box at the surface (~200 m elevation) to an elevation of approximately 150 m suggest these boxes may have leaked in the past, resulting in high-level vadose zone contamination.

10
Figure 4. Plan view of B Tank Farm ERT inversion results at selected depths. The high conductivities
beneath the tanks are likely caused by the dense network of monitoring wells, which mask the conductivity of contaminated soil. The anomaly beneath the diversion box (shown within white oval) is not associated with metallic infrastructure, and may indicate high-level soil contamination due to waste releases from the diversion box.

11
Figure 5. Plan view of BX and BY Tank Farms ERT inversion results at selected depths. The high
conductivities beneath the tanks are likely caused by the dense network of monitoring wells, which mask the conductivity of contaminated soil. The anomalies beneath the diversion boxes (shown within white ovals) are not associated with metallic infrastructure, and may indicate high-level soil contamination due to waste releases from diversion boxes.
5.2 BX-Trenches, B7-B8 Cribs and Tile Field
Figure 6A shows a relatively diffuse high conductivity plume resulting from primarily vertical contamination beneath BX-Trenches. The highest conductivity occurs beneath the trench lying along the 137330 easting coordinate, which is consistent with the discharge summary shown in Figure 1B and results presented in Rucker et al. (2012). The distribution of conductivity beneath the trenches suggests that waste release points were located toward the eastern edges of the trenches. Waste appears to have migrated vertically for the most part, the exception being some apparent lateral movement from the western-most trench, evident from the 150–190 m elevation cross-sections. There is also a shallow high

12
conductivity north-south trending anomaly east of the trenches, evident in the 170-190 m elevation sections.
In contrast to the vertical migration beneath the BX-Trenches shown in Figure 6A, the ERT imaging results beneath the tile field shown in Figure 6B suggest significant lateral migration of contaminants at depth. Figure 1 shows a high volume of moderately concentrated waste was released into the infiltration crib at the southern end of the tile field (B8 Crib). The ERT image further suggests the waste migrated vertically through the upper section of the vadose zone and spread laterally in the lower section. Lateral spreading at depth would be consistent with site geology in that perched water has been identified in a test well approximately 90 m south of the B8 Crib, and approximately 6 m above the water table (~133 m elevation). If the vertical flow boundary causing the perched water extends northward to the infiltration crib, lateral migration of wastes released into the crib at the flow boundary is plausible. Although not as dense as the wells in the tank farms, it is important to note the wells in tile field area, which may have influenced the ERT image.

13
Figure 6. A) ERT inversion results in the BX-Trenches area suggesting a relatively diffuse plume
resulting primarily from vertical contaminant migration centered at Northing = 137330 m trench. This is consistent with disposal loading shown in Figure 1B. B) ERT inversion results in the Tile-Field area suggesting vertical migration from the B8 infiltration crib in the upper elevations, followed by horizontal migration at depth.

14
5.3 BY-Cribs
According to the waste release inventories shown in Figure 1B, the BY-Cribs area was subjected to high release volumes at elevated concentrations. The majority of these releases were derived directly from tank wastes, and were executed over a 2-year period from 1954-1955 in an effort to create tank storage capacity (DOE-RL 1999, p. 251). Consequently, the BY-Cribs area is the most contaminated infiltration gallery within the B-Complex. The discharge inventory into the BY-Cribs is consistent with the ERT inversion results (Figure 7), which show bulk conductivities ranging over approximately 4 orders of magnitude.
The ERT image suggests that, in addition to vertical migration beneath the cribs, wastes released into the cribs migrated laterally approximately 100 m in one eastward trending plume and also in a second south-east trending plume. The eastward trending lobe appears to originate from the northeastern-most crib, and is oriented at an angle of approximately 30 degrees from horizontal downward through the vadose zone. In contrast, the south-east trending plume appears to originate at depth from the main plume directly beneath the cribs, and is oriented horizontally between 130-160 m in elevation. The horizontal orientation of this lobe may be caused by a vertical flow barrier at depth as has been observed to cause perched water in other parts of the B-Complex. The main plume, which is oriented directly beneath the cribs, appears to have migrated vertically, merging at depth from more discrete plumes occurring shallow in the section. These observations are all consistent with the disposal history shown in Figure 1B. For instance, high volumes of relatively dilute waste were discharged into the northwestern-most crib. This may be the source of the lower conductivity anomaly in the northwest section of the BY-Cribs area apparent in the 130-170 m elevation sections. Additional cross sections of the inversion results within the BY-Cribs are shown in Appendix A.

15
Figure 7. ERT inversion results in the BY-Cribs area suggesting three distinct plumes: 1) a central plume
resulting from vertical migration beneath the cribs, 2) an eastward trending plume apparently originating at the northeastern-most crib, and oriented at approximately 30 degrees from horizontal moving downward through the vadose zone, and 3) a southeast trending plume that apparently originates from the central plume at depth, and is oriented horizontally in the 130 to 160 m elevation range.
In addition to leveraging parallel computing resources, E4D was implemented with unstructured meshing, enabling shape conformance with tanks and land topography as well custom regularization and water table constraints (Robinson et al. 2013), all of which were used for the B-Complex inversion. To demonstrate the overall improvement in image resolution, Figure 8 shows a comparison between the E4D inversion and that of the original inversion given by Rucker et al. (2007), focusing on the BY-Cribs area. The previous inversion delineates the general footprint of the contaminated region, but cannot resolve the

16
eastward lobes of the plume, and poorly resolves the vertical dimensions of the plume. Also, due to the computational demands of inverting the B-Complex ERT data set, the previous inversion process inverts data in parts; in this case, the data collected directly only over the BY-Cribs. The E4D inversion processed all data simultaneously. An updated comparison to results from leading commercial inversion software produced in 2012 is shown in Johnson (2013), and displays similar results.
Figure 8. Comparison between E4D inversion (left column) and the original inversion (right column)
shown in Rucker et al. (2007) over the BY-Cribs area. Results are shown as depth sections.

17
6.0 Conclusions
Former waste disposal practices at the Hanford Site B-Complex resulted in ubiquitous vadose zone contamination. Understanding the distribution of contamination resulting from planned releases into infiltration galleries and from unplanned releases from single-shell tanks is critical for efficient and effective remediation, and for understanding the origin of groundwater plumes that are emerging from the B-Complex. ERT has proven useful in this regard. In particular, the advent of ERT imaging codes capable of accommodating the geometric features of complex systems and utilizing distributed memory parallel computing resources enable more information to be extracted from large ERT data sets, which is manifest with improved imaging resolution.
Parallel inversion of the B-Complex surface ERT data set presented herein significantly improves imaging resolution, revealing previously unrealized detail concerning the distribution of vadose zone contamination beneath B-Complex infiltration galleries. However, except for the region beneath waste transfer boxes, parallel inversion did not resolve vadose zone contamination within the tank farm boundaries, where inversion results are dominated by the electrically conductive tanks and dry wells. To enable imaging in the presence of metallic features of known location and dimension such as the tank farms, modeling approaches are needed that can accommodate large conductivity contrasts at the soil/metal boundary, which will ultimately enable the removal of metallic effects from imaging results. Without such developments, ERT imaging capabilities will remain hindered in environments with highly conductive features such as the tank farms. To remove the effects of metallic infrastructure in ERT images, efforts are underway to include the capability to model metallic infrastructure within E4D.

18
7.0 References
CH2M HILL. 2003. Field Investigation Report for Waste Management Area B-BX-BY. RPP-34690, Rev 0, CH2M HILL Hanford Group, Inc., Richland WA.
Coscia I, SA Greenhalgh, N Linde, J Doetsch, L Marescot, T Gunther, and AG Green. 2011. 3D crosshole ERT for aquifer characterization and monitoring of infiltrating river water. Geophysics 76(2):G49-G59, DOI: 10.1190/1.3553003.
DOE-RL. 1999. Groundwater/Vadose Zone Integration Project Background Information and State of Knowledge, Vol. II. U.S. Department of Energy, Richland Operations Office, Richland, WA.
DOE-RL. 2010. Long Range Deep Vadose Zone Program Plan. U.S. Department of Energy, Richland Operations Office, Richland, WA.
Doetsch JA, I Coscia, S Greenhalgh, N Linde, A Green, and T Gunther. 2010. The borehole-fluid effect in electrical resistivity imaging. Geophysics 75(4):F107-F114, DOI: 10.1190/1.3467824.
Gephart RE. 2010. A short history of waste management at the Hanford Site. Physics and Chemistry of the Earth 35(6-8):298-306, DOI: 10.1016/j.pce.2010.03.032.
Gunther T, C Rucker, and K Spitzer. 2006. Three-dimensional modelling and inversion of dc resistivity data incorporating topography - II. Inversion. Geophysical Journal International 166(2):506-517. DOI: 10.1111/j.1365-246X.2006.03011.x.
Hansen PC and DP O’Leary. 1993. The Use of the L-Curve in the Regularization of Discrete Iii-Posed Problems. Siam Journal on Scientific Computing 14(6):1487-1503.
Johnson TC, RJ Versteeg, A Ward, FD Day-Lewis, and A Revil. 2010. Improved hydrogeophysical characterization and monitoring through parallel modeling and inversion of time-domain resistivity and induced-polarization data. Geophysics 75(4):Wa27-Wa41, DOI: 10.1190/1.3475513.
Johnson TC, RJ Versteeg, M Rockhold, LD Slater, D Ntarlagiannis, WJ Greenwood, and J Zachara. 2012. Characterization of a contaminated wellfield using 3D electrical resistivity tomography implemented with geostatistical, discontinuous boundary, and known conductivity constraints. Geophysics 77(6):11, DOI: 10.1190/GEO2012-0121.1. Johnson TC. 2013. Applications for Subsurface Cleanup and Closure: High-Performance Subsurface Imaging for Characterization and Monitoring of Contaminated Sites. PNNL-SA-94312, Pacific Northwest National Laboratory, Richland, WA.
Lindenmeier CW, RJ Serne, BN Bjornstad, GV Last, DC Lanigan, MJ Lindberg, RE Clayton, VL Legore, IV Kutnyakov, SR Baum, KN Geiszler, MM Valenta, and TS Vickerman. 2002. Characterization of Vadose Zone Sediment: Borehole C3103 Located in the 216-B-7A Crib Near the B Tank Farm. PNNL-14128, Pacific Northwest National Laboratory, Richland, WA.

19
Lowry T, MB Allen, and PN Shive. 1989. Singularity Removal - a Refinement of Resistivity Modeling Techniques. Geophysics 54(6):766-774.
Robinson J, T Johnson, and L Slater. 2013. Evaluation of known-boundary and resistivity constraints for improving cross-borehole DC electrical resistivity imaging of discrete fractures. Geophysics 78:D115-D127, DOI:10.1190/geo2012-0333.1.
Rucker D, M Levitt, M Bergeron, J Greenwood, G O’Brien, M McNeill, and C Henderson. 2007. Surface Geophysical Exploration of the B, BX, and BY Tank Farms at the Hanford Site. RPP-34690, Rev 0, CH2M HILL, Richland, WA.
Rucker DF, DA Myers, BD Cubbage, MT Levitt, GE Noonan, M McNeill, C Henderson, and RW Lober. 2012. Surface Geophysical Exploration: Developing Noninvasive Tools to Monitor Past Leaks around Hanford’s Tank Farms. Environmental Monitoring and Assessment (in press), DOI: 10.1007/s10661-012-2609-x.
Serne RJ, BN Bjornstad, GW Gee, HT Schaef, DC Lanigan, RG McCain, CW Lindenmeier, RD Orr, VL Legore, RE Clayton, MJ Lindberg, IV Kutnyakov, SR Baum, KN Geiszler, MM Valenta, TS Vickerman, and LJ Royack. 2002. Characterization of Vadose Zone Sediment: Borehole 299-E33-46 Near Tank B-110 in the B-BX-BY Waste Management Area. PNNL-14119, Pacific Northwest National Laboratory, Richland, WA.
Si H. 2006. TetGen: A Quality Tetrahedral Mesh Generator and Three-Dimensional Delaunay Triangulator. Weierstrass Institute for Applied Analysis and Stochastics (WIAS), Berlin, Germany.
Wallin EL, TC Johnson, WJ Greenwood, and JZ Zachara. 2013. Imaging high stage river-water intrusion into a contaminated aquifer along a major river corridor using 2-D time-lapse surface electrical resistivity tomography. Water Resources Research 49(3):1693-1708, DOI: 10.1002/wrcr.20119.
Westinghouse. 1996. Liquid Radioactive Waste Discharges from B-Plant to Crib. Rev 0, Westinghouse Hanford Company, Richland, WA.


Appendix A
Supplemental BY-Cribs ERT Image Sections


A.1
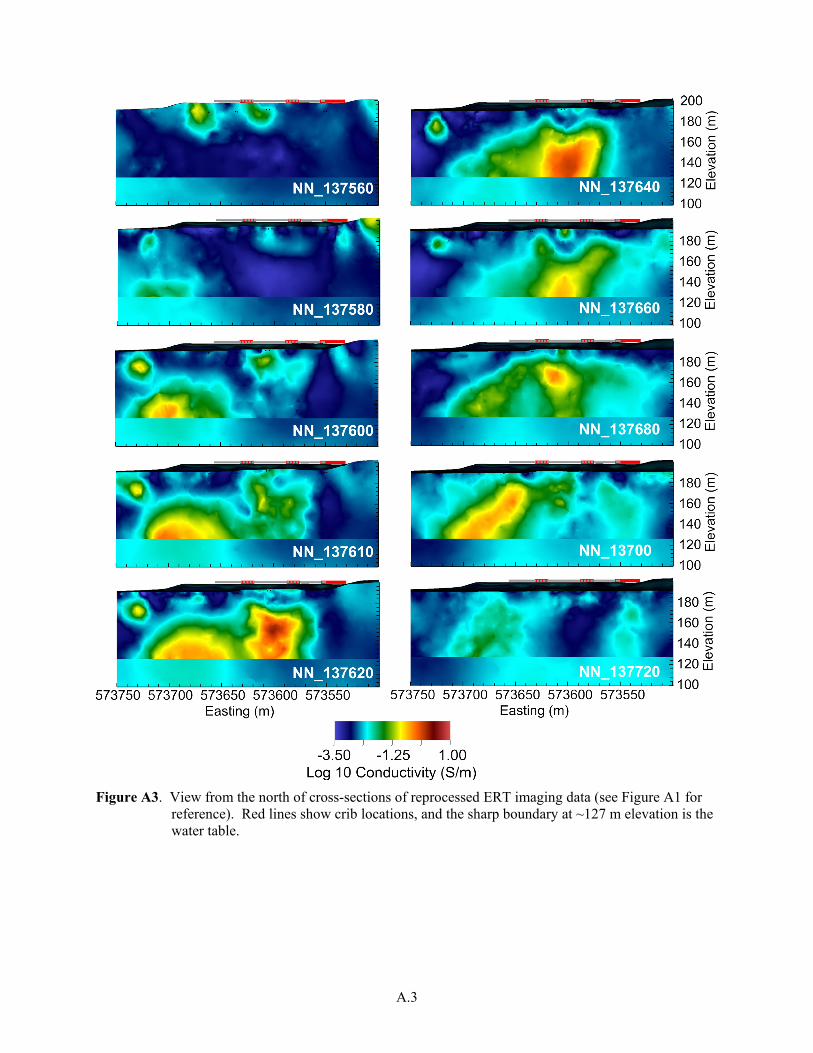
Figure A1. (top) 3D plan view of reprocessed surface ERT collected over the BY-Cribs showing vadose zone contaminant plumes in terms of transparent isosurfaces. Red outlines show crib locations. The northing-normal section lines show the locations of the cross-sections shown in Figure A3. The easting-normal section lines show the locations of the cross-sections shown in Figure A6. (bottom) Oblique view.

A.2
Figure A2. View from the north of reprocessed 3D ERT inversion results over the B-Complex in terms
of transparent isosurfaces. Dashed lines are wells, and the elevated western surface is the barrier.
A.3
Figure A3. View from the north of cross-sections of reprocessed ERT imaging data (see Figure A1 for
reference). Red lines show crib locations, and the sharp boundary at ~127 m elevation is the water table.

A.4
Figure A4. View from the east of reprocessed 3D ERT inversion results over the B-Complex in terms of transparent isosurfaces. The elevated western surface is the barrier.

A.5
Figure A5. View from the east of cross sections of reprocessed ERT imaging data (see Figure A1 for
reference). The sharp boundary at ~127 m elevation is the water table.
