rating roads for motorcyclist safety - virginia tech · analysis: crash records, data ... system to...
TRANSCRIPT

stripes, road-bridge gaps, or sharp turning radii—may prove haz-ardous for motorcycles. Additionally, motorcycles do not provideprotection to users in the same way that cars provide protection to pas-sengers. In the event of a crash, a motorcyclist must rely on the sur-rounding environment for protection from serious injury. Due to thesedifferences, the available safety ratings may not apply to motorcycles.One strategy for reducing motorcycle crashes and fatalities in theUnited States is to identify and highlight roadways that are particu-larly dangerous to motorcyclists. In the near term, developing and pro-moting specific safety ratings for motorcyclists will highlight roadson which motorcyclists need to take particular caution. In the longerterm, roadway-rating systems that are motorcyclist specific will focusthe attention of policy makers on roadways that require improvement.
OBJECTIVE
The goal of this study was to develop a methodology to rate the safetyof U.S. roadways for motorcycle riders. The two components of themethodology were developing safety ratings and visually represent-ing them on a map. For a pilot study, this methodology was appliedto highways in New Jersey. A second goal was to correlate road safetyranking with roadway geometry and physical characteristics.
METHODOLOGY
The approach of this study was to compute road risk based on motor-cycle crash rates. Three data elements were needed to complete theanalysis: crash records, data on motorcycle traffic volume for eachhighway, and roadway geometric feature data. Roadways weredivided into segments based on the functional classification of theroad. For each segment, crash rates were determined, and then thesegment was given a risk rating based on this crash rate. Crash rateswere computed by dividing the total number of crashes on the seg-ment by the motorcycle vehicle miles traveled (VMT) in thousandsover the segment, as shown in Equation 1.
This crash rate normalizes the total number of crashes based onhow often roadways are used by motorcyclists. Therefore, the com-puted crash rates for different segments of roads can be directly com-pared. These crash rates were then categorized into five different risklevels, coded by risk severity, and mapped to create a visual repre-sentation of roadways across the area of interest. In this study, themethodology was demonstrated by using data on more than 1,000 mi
crash ratetotal crashes
VMT=
1 0001
,( )
Rating Roads for Motorcyclist SafetyDevelopment of a Motorcycle Road Assessment Program
Allison Daniello, Kimberly Swanseen, Yusuf A. Mehta, and Hampton C. Gabler
67
Motorcycles are vastly different from other vehicles on the road: they arehighly unstable and provide little protection to users. Because of motor-cycle instability, variations in road surfaces and geometry may be morehazardous to motorcyclists than to other road users. Road safety ratingsfor the entire vehicle fleet, primarily cars, have been applied to roadwaysin Europe, the United States, and Australia. However, these primarilycar-oriented systems have limited value for motorcyclists. This studydevelops a unique road safety rating system designed for motorcyclists.On the basis of normalized motorcycle crash rates, roads were classifiedinto five safety rating categories, ranging from low risk to severe risk.The new methodology for rating roads was applied to 16 roads in NewJersey, covering 1,099.5 mi (1,769.5 km) of road. Roadways weremapped to create a visual representation of the distribution of safety haz-ards on the analyzed roads. Of these roads, 19% posed a severe risk tomotorcyclists. The majority of the roads mapped (27%) had a mediumrisk for motorcycles. The statewide crash risk mapping was supple-mented by an in-depth site investigation of an area known to be particu-larly hazardous to motorcyclists, to develop a better understanding ofpotentially dangerous roadway conditions.
The European Road Assessment Program (EuroRAP), which wasstarted in 2001, developed three different protocols for rating thesafety of roadways: risk mapping, star rating, and performance track-ing (1). The risk-mapping protocol calls for color-coding roads basedon the risk of fatality or severe injury along sections of road. Similarto car-crash–rating systems, EuroRAP developed a four-star–ratingsystem to rate the safety of roads based on their design aspects underthe star-rating protocol. Last, the changes in fatalities and crashes overtime on a roadway were rated based on the performance-tracking pro-tocol (2). Similar rating systems have been applied in the UnitedStates (3) and Australia (4). These systems have based safety ratingson all road users.
Motorcycles, however, are vastly different from other vehicles onthe road. They are highly unstable with unique driving and brakingrequirements. Slight variations in the roadway that would be un-noticed by most cars—e.g., uneven surfaces, low-friction paint
A. Daniello, K. Swanseen, and H. C. Gabler, Virginia Tech–Wake Forest UniversitySchool of Biomedical Engineering and Sciences, Virginia Polytechnic Institute andState University, 445 ICTAS Building, Stanger Street (MC 0194), Blacksburg, VA 24061. Y. A. Mehta, Department of Civil and Environmental Engineering,Rowan University, 329 Rowan Hall, 201 Mullica Hill Road, Glassboro, NJ 08028.Corresponding author: A. Daniello, [email protected].
Transportation Research Record: Journal of the Transportation Research Board,No. 2194, Transportation Research Board of the National Academies, Washington,D.C., 2010, pp. 67–74.DOI: 10.3141/2194-08

of roadway in New Jersey. Last, an in-depth investigation of asevere-risk road segment was compared with the data found in thisstudy to determine factors that may influence motorcycle crashes.
Data Sources
The analysis for this study was based on information gathered fromthree sources. Crash data were drawn from the NJCRASH database,available on the New Jersey Department of Transportation (DOT)website. The NJCRASH database includes records of all police-reported crashes in New Jersey from 1997 to 2008. Crash recordsfrom 2001 to 2008 were used for this study. NJCRASH provides twodata elements that geocode the location of the crash: the StandardRoute Identifier (SRI) and the milepost. The SRI denotes the road-way on which the crash occurred, and the milepost gives the exactlocation on the roadway. Crashes without a milepost record wereexcluded from the analysis since their location could not be deter-mined. On roads that we examined, 11.4% of motorcycle crasheswere excluded due to missing milepost information.
Additionally, the New Jersey DOT publishes yearly average travelactivity by vehicle type, which was used to compute the statewideaverage crash rate and motorcycle representation on highways (5).There are 12 different types of roadway classifications in New Jer-sey. For each roadway classification, the annual percentage of totaltraffic that comprised motorcycles on each roadway type is reported.These data were available for the years 1999 to 2007. For this analy-sis, the percentage of motorcycles on each roadway type was aver-aged for the years 2001 to 2007. Table 1 gives the average percentageof motorcycles in the total traffic volume by roadway type.
One challenge associated with using these data is that vehicledetection systems do not always register motorcycles (6). This studyassumed that the fraction that was miscounted was uniform through-out all counters and resulted in a systematic error. Crash rates com-puted in this methodology are based on the same data and normalizedbased on the statewide average crash rate. Therefore, the risk factorsassociated with each segment are a comparison of crash rate on eachroad segments to the average crash rate in the state and would remainunchanged with a systematic shift in vehicle counts.
68 Transportation Research Record 2194
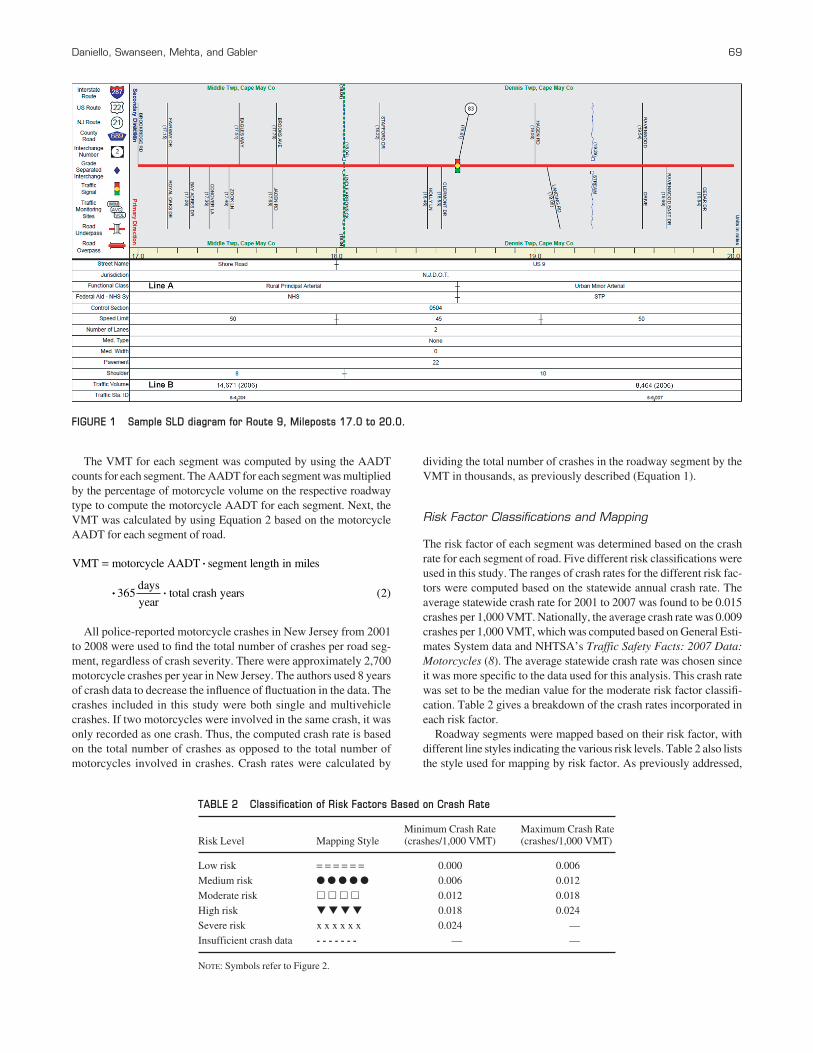
Roadway data were gathered from the New Jersey straight-line dia-grams (SLDs) (7). The SLDs contained detailed information about allroads in New Jersey. The SLDs provided the functional roadway clas-sifications, which were used to divide each roadway into individualsegments, as shown in Line A of Figure 1. These classifications werealso used as a basis for the percentage of road users that were motor-cyclists, as previously described. Also, the average annual daily traf-fic (AADT) was reported at different intervals along each roadway(Line B, Figure 1). This information was used to compute the VMTfor each road segment.
Development of Methodology
Three steps were taken to compute the crash rate for each segment ofroad. First, roads were divided into segments representative of the dif-ferent road classifications as specified in the SLDs. Second, AADTdata were converted to VMT, and the crash rates for each segmentwere computed. Each segment was then assigned a risk factor andmapped by using Google Earth Pro. Last, the risk factor of each seg-ment was compared with the risk factor for cars, which was computedby using the same methods as for motorcycles.
Road Segment Division
Road segment lengths were determined on the basis of the roadwayclassification as specified in the SLD. Crash safety is expected to bea function of road type. For example, divided highways might havea lower crash rate than narrow rural roads. Continuous sections ofroad listed as the same roadway type were grouped together. Addi-tionally, the change in roadway type typically indicates a change inthe roadway usage.
For roads on which the roadway classification remained constantfor long segments of road, the road was divided into 10-mi (16.1-km)segments. Segment lengths of 1, 5, and 10 mi (1.61, 8.04, and 16.1 kmrespectively) were tested to determine the optimal length. There weremore fluctuations in the data due to the lesser number of crashes ineach segment for segments of 1 and 5 mi. The minimum number ofcrashes per segment was set to be 10 crashes to reduce the influenceof fluctuation in the data on the risk factor. Dividing the large seg-ments of road into 10-mi segments typically enabled the number ofcrashes to be above the set minimum number of crashes. Since thisdivision is not as precise, details about fine sections of roads are lost.However, this division was chosen since there was less fluctuation,resulting in more meaningful data.
Computation of Crash Rate
Motorcycle crash rates were based on the motorcycle VMT in thou-sands. The VMT was calculated based on the AADT counts reportedin the SLDs at different intervals along the roadway. There were sev-eral challenges in using the available AADT measurements. First,there were multiple AADT counts within most road segments. Oftenthese counts spanned several years. For such segments, the averageof all AADTs within the segment was taken, to find the AADT forthe road segment. In contrast, some segments did not incorporate anAADT record. In these cases, the AADT was linearly interpolatedbased on the middle distance of the previous and following segmentsof roadway.
TABLE 1 Percentage of Motorcycles by Roadway Type
Average Percentage of Roadway Motorcycles in Total TrafficClassification Volume (2001–2007)a
Rural Interstate 0.07
Rural principal arterial 0.17
Rural minor arterial 0.17
Rural major collector 0.39
Rural minor collector 0.27
Rural local 0.51
Urban Interstate 0.19
Urban freeway and expressway 0.21
Urban principal arterial 0.28
Urban minor arterial 0.27
Urban collector 0.33
Urban local 0.36
aFrom New Jersey DOT travel activity by vehicle type.
The VMT for each segment was computed by using the AADTcounts for each segment. The AADT for each segment was multipliedby the percentage of motorcycle volume on the respective roadwaytype to compute the motorcycle AADT for each segment. Next, theVMT was calculated by using Equation 2 based on the motorcycleAADT for each segment of road.
All police-reported motorcycle crashes in New Jersey from 2001to 2008 were used to find the total number of crashes per road seg-ment, regardless of crash severity. There were approximately 2,700motorcycle crashes per year in New Jersey. The authors used 8 yearsof crash data to decrease the influence of fluctuation in the data. Thecrashes included in this study were both single and multivehiclecrashes. If two motorcycles were involved in the same crash, it wasonly recorded as one crash. Thus, the computed crash rate is basedon the total number of crashes as opposed to the total number ofmotorcycles involved in crashes. Crash rates were calculated by
VMT motorcycle AADT segment length in miles= i
ii i365 2days
yeartotal crash years ( )
Daniello, Swanseen, Mehta, and Gabler 69
dividing the total number of crashes in the roadway segment by theVMT in thousands, as previously described (Equation 1).
Risk Factor Classifications and Mapping
The risk factor of each segment was determined based on the crashrate for each segment of road. Five different risk classifications wereused in this study. The ranges of crash rates for the different risk fac-tors were computed based on the statewide annual crash rate. Theaverage statewide crash rate for 2001 to 2007 was found to be 0.015crashes per 1,000 VMT. Nationally, the average crash rate was 0.009crashes per 1,000 VMT, which was computed based on General Esti-mates System data and NHTSA’s Traffic Safety Facts: 2007 Data:Motorcycles (8). The average statewide crash rate was chosen sinceit was more specific to the data used for this analysis. This crash ratewas set to be the median value for the moderate risk factor classifi-cation. Table 2 gives a breakdown of the crash rates incorporated ineach risk factor.
Roadway segments were mapped based on their risk factor, withdifferent line styles indicating the various risk levels. Table 2 also liststhe style used for mapping by risk factor. As previously addressed,
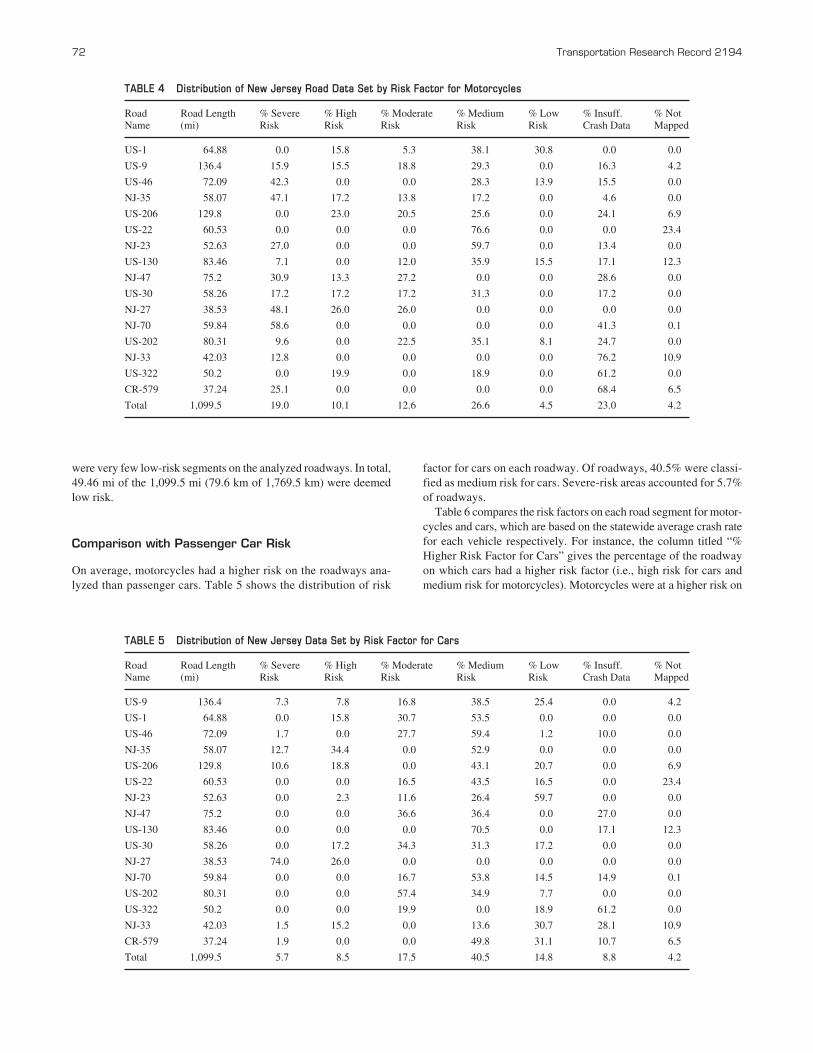
TABLE 2 Classification of Risk Factors Based on Crash Rate
Minimum Crash Rate Maximum Crash RateRisk Level Mapping Style (crashes/1,000 VMT) (crashes/1,000 VMT)
Low risk = = = = = = 0.000 0.006
Medium risk ● ● ● ● ● 0.006 0.012
Moderate risk � � � � 0.012 0.018
High risk ▼ ▼ ▼ ▼ 0.018 0.024
Severe risk x x x x x x 0.024 —
Insufficient crash data - - - - - - - — —
NOTE: Symbols refer to Figure 2.
FIGURE 1 Sample SLD diagram for Route 9, Mileposts 17.0 to 20.0.

there are smaller numbers of motorcycle crashes than car crashes,exacerbating the problem of statistical fluctuation. In our study, risklevels were not calculated for roadway segments with fewer than10 crashes. These segments were represented on the map as dashedlines and labeled as insufficient data. Additionally, some segments ofthe roadways analyzed combined with other roads and crashes wererecorded as having taken place on the other road. These segmentswere omitted from the analysis.
The roads were mapped by using Google Earth Pro based on thestart and end mileposts of each segment. Milepost data were attainedfrom the NJCRASH database by using 2007 and 2008 data. For theseyears, most crashes were geocoded with SRI and milepost, alongwith latitude and longitude coordinates. These coordinates wereinput into Google Earth, marking the road. This crash data were usedspecifically for these purposes, and no other information about thecrashes was retained. Mileposts were marked approximately every0.5 mi. The path feature in Google Earth Pro was used to highlightthe different roadway segments based on the risk level.
Comparison to Risk in Passenger Cars
The crash rate of passenger cars was also computed for each segmentby using the same methods as for motorcycles. The AADT was scaledbased on the percentage of cars on each roadway type and then con-verted to VMT. Risk rates were then assigned to each road based onthe average statewide crash rate of 0.005 crashes per 1,000 VMT for2001 to 2007. The same five risk categories were assigned, with theaverage crash rate being the median value of the “moderate” risk cat-egory. Since these risk factors were developed by using the samemethodology and scaled for each vehicle type, they can be used fordirect comparison.
In-Depth Roadway Inspection Comparison
In a previous study, motorcycle crash sites were visited to develop abetter understanding of roadway conditions that may be hazardous tomotorcyclists. Motorcycles are more vulnerable to variations in theroads as they are significantly less stable than other motor vehicles.The satellite imagery provided a first look at roadway geometry,which may have an influence on the number and severity of crashes.However, the imagery was not of a high enough resolution to deter-mine finer details of the road. One area of particular severity wason County Route (CR) 579, between Mileposts 36 and 37, with 13motorcycle crashes occurring within 8 years. Since this area wasalready known to be hazardous, it was included in this analysis forcomparison to other roadways.
RESULTS
In total, 16 roads in New Jersey were selected for analysis based onthe number of crashes on each roadway and roadway location in thestate. The roads were then segmented, and the AADTs were found.The crash rates were determined, and the roads were mapped accord-ing to their crash risk. The risk of each segment was then comparedwith the crash risk of passenger cars on that segment. The in-depthinvestigation of CR-579 was then analyzed to determine possibleroad geometry or road condition issues that might make it a severelocation.
70 Transportation Research Record 2194
Roadways
Table 3 lists the roads chosen, their respective length, and the num-ber of motorcycle and passenger car crashes that were included inthe analysis on the entire length of road.
All of the roads, with three exceptions, had more than 100 motor-cycle crashes over their spans. NJ-33 and US-322 had fewer crashes,but they were chosen because of their spatial orientation through thestate in order to obtain a more diverse map. CR-579 was chosenbecause of previous knowledge about a dangerous area for motor-cycles. The roads chosen for this study consisted mainly of segmentsclassified as rural and urban principal arterials. However, other typesof roadway classifications included urban freeway and expressways,urban collectors, rural major collectors, and urban and rural minorarterials.
Risk Map
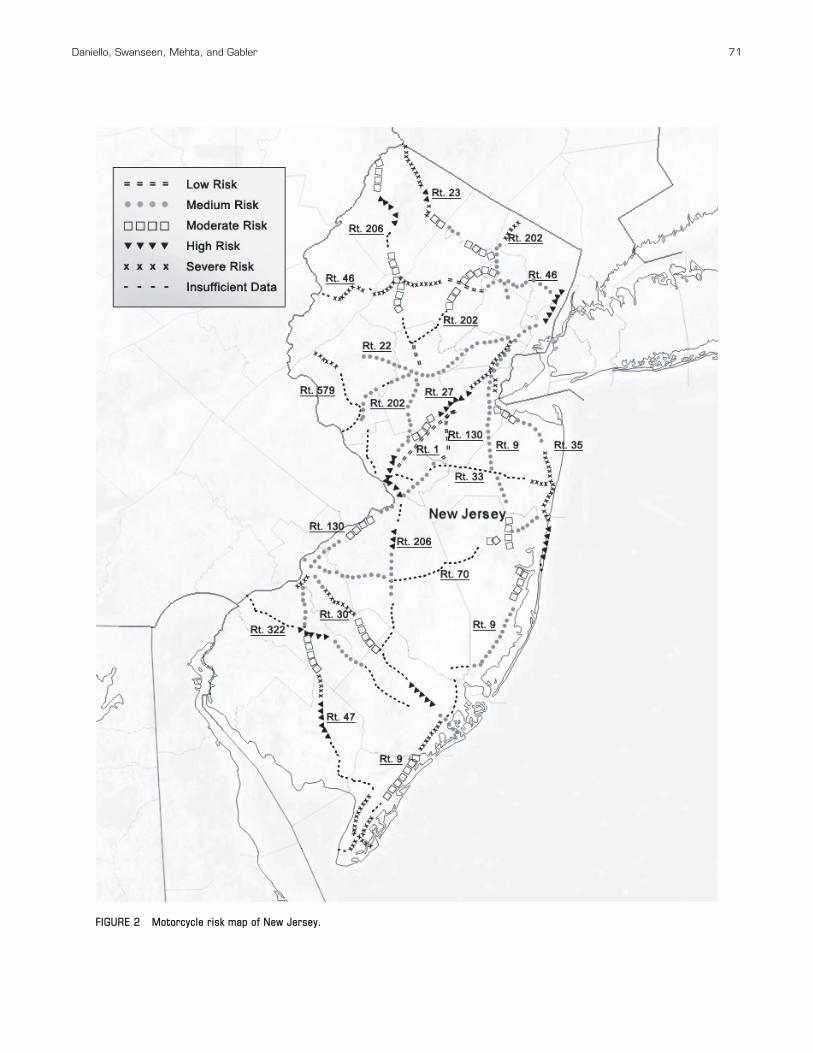
After the roadways were broken down by road type and analyzed,they were transcribed onto a map of New Jersey, by using the pathfunction of Google Earth Pro. The completed map can be seen inFigure 2. These 16 roads correspond to 1,099.5 mi (1,769.5 km) ofroadway.
Table 4 shows the distribution of roadway classifications for eachroadway analyzed. The highest percentage of road segments (26.6%)was classified as medium risk. This is followed closely by the amountof road that had insufficient crash data (23.0%).
Severe risk areas accounted for 19% of the roads that were mapped.This corresponded to more than 200 mi (322 km) of roadway andincluded 756 crashes, more than 28% of the total motorcycle crashesoccurring on the roads that were analyzed in this study. Also, there
TABLE 3 List of Roads for New Jersey MotorcycleCrash Risk Assessment
Number ofRoad Road Length Motorcycle Number of CarName (mi) Crashes Crashes
US-9 136.4 318 28,120
US-1 64.88 279 33,219
US-46 72.09 252 18,838
NJ-35 58.07 215 16,501
US-206 129.8 203 17,526
US-22 60.53 189 17,982
NJ-23 52.63 184 7,573
NJ-47 75.2 175 7,777
US-130 83.46 155 14,385
US-30 58.26 149 12,295
NJ-27 38.53 143 15,375
NJ-70 59.84 130 11,572
US-202 80.31 118 12,598
US-322 50.2 58 3,740
NJ-33 42.03 56 6,842
CR-579 37.24 30 965
Total 1,099.5 2,654 225,308
NOTE: 1 mi = 1.61 km.
Daniello, Swanseen, Mehta, and Gabler 71
FIGURE 2 Motorcycle risk map of New Jersey.
were very few low-risk segments on the analyzed roadways. In total,49.46 mi of the 1,099.5 mi (79.6 km of 1,769.5 km) were deemedlow risk.
Comparison with Passenger Car Risk
On average, motorcycles had a higher risk on the roadways ana-lyzed than passenger cars. Table 5 shows the distribution of risk
72 Transportation Research Record 2194
factor for cars on each roadway. Of roadways, 40.5% were classi-fied as medium risk for cars. Severe-risk areas accounted for 5.7%of roadways.
Table 6 compares the risk factors on each road segment for motor-cycles and cars, which are based on the statewide average crash ratefor each vehicle respectively. For instance, the column titled “%Higher Risk Factor for Cars” gives the percentage of the roadwayon which cars had a higher risk factor (i.e., high risk for cars andmedium risk for motorcycles). Motorcycles were at a higher risk on
TABLE 4 Distribution of New Jersey Road Data Set by Risk Factor for Motorcycles
Road Road Length % Severe % High % Moderate % Medium % Low % Insuff. % NotName (mi) Risk Risk Risk Risk Risk Crash Data Mapped
US-1 64.88 0.0 15.8 5.3 38.1 30.8 0.0 0.0
US-9 136.4 15.9 15.5 18.8 29.3 0.0 16.3 4.2
US-46 72.09 42.3 0.0 0.0 28.3 13.9 15.5 0.0
NJ-35 58.07 47.1 17.2 13.8 17.2 0.0 4.6 0.0
US-206 129.8 0.0 23.0 20.5 25.6 0.0 24.1 6.9
US-22 60.53 0.0 0.0 0.0 76.6 0.0 0.0 23.4
NJ-23 52.63 27.0 0.0 0.0 59.7 0.0 13.4 0.0
US-130 83.46 7.1 0.0 12.0 35.9 15.5 17.1 12.3
NJ-47 75.2 30.9 13.3 27.2 0.0 0.0 28.6 0.0
US-30 58.26 17.2 17.2 17.2 31.3 0.0 17.2 0.0
NJ-27 38.53 48.1 26.0 26.0 0.0 0.0 0.0 0.0
NJ-70 59.84 58.6 0.0 0.0 0.0 0.0 41.3 0.1
US-202 80.31 9.6 0.0 22.5 35.1 8.1 24.7 0.0
NJ-33 42.03 12.8 0.0 0.0 0.0 0.0 76.2 10.9
US-322 50.2 0.0 19.9 0.0 18.9 0.0 61.2 0.0
CR-579 37.24 25.1 0.0 0.0 0.0 0.0 68.4 6.5
Total 1,099.5 19.0 10.1 12.6 26.6 4.5 23.0 4.2
TABLE 5 Distribution of New Jersey Data Set by Risk Factor for Cars
Road Road Length % Severe % High % Moderate % Medium % Low % Insuff. % NotName (mi) Risk Risk Risk Risk Risk Crash Data Mapped
US-9 136.4 7.3 7.8 16.8 38.5 25.4 0.0 4.2
US-1 64.88 0.0 15.8 30.7 53.5 0.0 0.0 0.0
US-46 72.09 1.7 0.0 27.7 59.4 1.2 10.0 0.0
NJ-35 58.07 12.7 34.4 0.0 52.9 0.0 0.0 0.0
US-206 129.8 10.6 18.8 0.0 43.1 20.7 0.0 6.9
US-22 60.53 0.0 0.0 16.5 43.5 16.5 0.0 23.4
NJ-23 52.63 0.0 2.3 11.6 26.4 59.7 0.0 0.0
NJ-47 75.2 0.0 0.0 36.6 36.4 0.0 27.0 0.0
US-130 83.46 0.0 0.0 0.0 70.5 0.0 17.1 12.3
US-30 58.26 0.0 17.2 34.3 31.3 17.2 0.0 0.0
NJ-27 38.53 74.0 26.0 0.0 0.0 0.0 0.0 0.0
NJ-70 59.84 0.0 0.0 16.7 53.8 14.5 14.9 0.1
US-202 80.31 0.0 0.0 57.4 34.9 7.7 0.0 0.0
US-322 50.2 0.0 0.0 19.9 0.0 18.9 61.2 0.0
NJ-33 42.03 1.5 15.2 0.0 13.6 30.7 28.1 10.9
CR-579 37.24 1.9 0.0 0.0 49.8 31.1 10.7 6.5
Total 1,099.5 5.7 8.5 17.5 40.5 14.8 8.8 4.2

31.9% of the roads analyzed, and cars were at a higher risk on only15.0% of the roads. Motorcycles and cars had the same risk factor on27.2% of roads analyzed.
There were a total of 267.1 mi (429.9 km) of severe- and high-risk roads for motorcycles analyzed in this study. Of these, the riskfactor was higher for motorcyclists on 73.8% of the roadway. Thiscorresponds to 197.2 mi (317.4 km). An additional 13.5% (36.2 mior 58.3 km) of these segments had the same risk factor for motor-cycles and cars. On the roads analyzed, 155.0 mi of the roads wereclassified as high or severe risk for cars. Of these roads, 42.1% hada higher risk for cars than for motorcycles, corresponding to 65.3 mi(105.1 km) of roadway. Motorcyclists had a greater risk on 30.4%of these roads (47.2 mi or 76.0 km).
Roadway Inspection: CR-579, BethlehemTownship, Hunterdon County
One roadway of particular interest was between Mileposts 36 and37 on CR-579, in Bethlehem Township, Hunterdon County. In a pre-vious study, this section was determined to be a high-risk area tomotorcyclists.
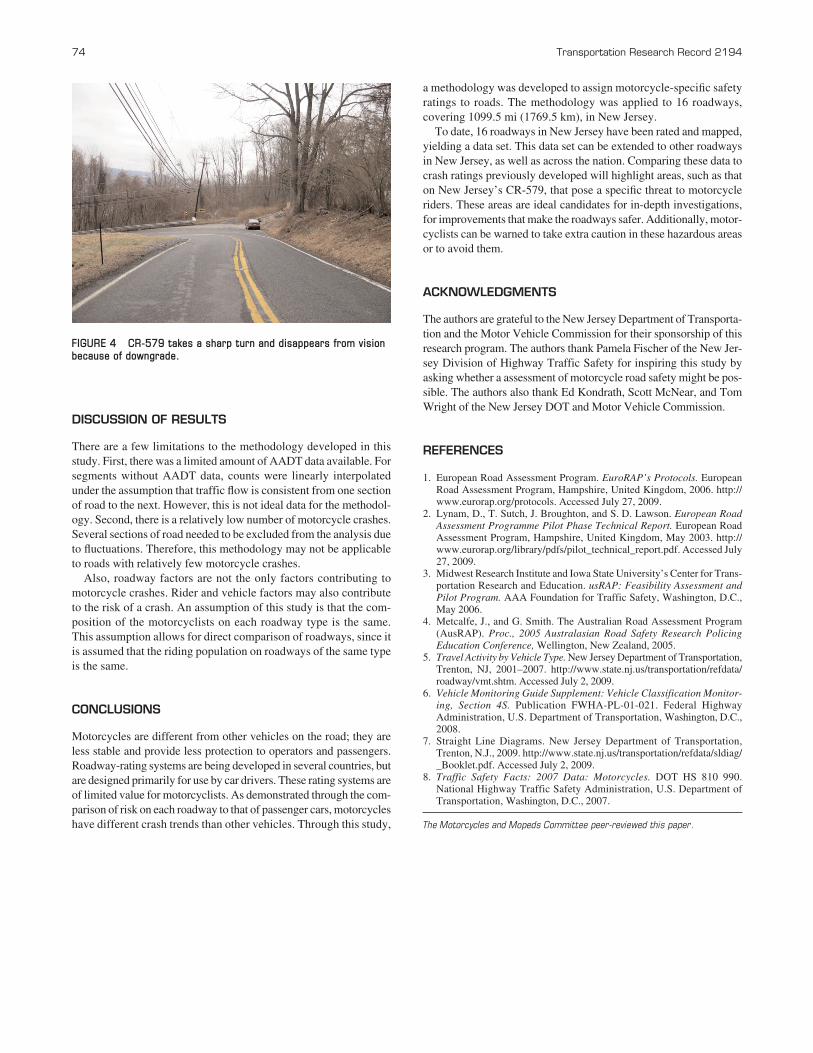
There were 13 motorcycle crashes on this 1-mi segment of roadfrom 2001 to 2008. The motorcycle crash risk for this segment was0.265 crashes per 1,000 VMT. This is more than 170 times higherthan the statewide average crash rate of 0.015 crashes per 1,000 VMTfor motorcycles. This site was chosen for inspection due to the highconcentration of crashes. Google Earth satellite images showed a tightcurve on this segment of road. The road turns 137° about a 49-ft radiusof curvature, as shown in Figure 3.
Of the 13 crashes in this area, 11 occurred when the motorcyclistwas travelling north. In the northbound direction, the road took asharp turn left and disappeared from vision due to the downgrade ofthe road, as shown in Figure 4. The road had an average downgradeof 11° and a 23° slope towards the center of the road. The guardrail
Daniello, Swanseen, Mehta, and Gabler 73
located on this curve had notable damage in five locations, whichmay or may not be related to the motorcycle crashes.
Between 2001 and 2008, there were 42 crashes of all vehicle typeson this 1-mi segment of road including the aforementioned 13 motor-cycle crashes. The crash rate for other vehicles on this segment was0.003 crashes per 1,000 VMT. Based on a statewide average crashrate of 0.004 crashes per 1,000 VMT for other vehicles, this would bea medium risk area for other vehicles. However, it is a severe-risk areafor motorcycles. The crash rate is 79.6 times higher for motorcyclesthan for other vehicles on this segment.
TABLE 6 Breakdown of Risk Factor by Road User
Road Road Length % Higher Risk Factor % Higher Risk % Same % InsufficientName (mi) for Motorcycles Factor for Cars Risk Factor Data
US-1 64.88 0.0 46.2 53.8 0.0
US-9 130.7 34.7 7.7 40.6 17.1
US-22 46.35 21.6 21.6 56.9 0.0
NJ-23 52.63 81.0 0.0 19.0 0.0
NJ-27 38.53 0.0 51.9 48.1 0.0
US-30 58.26 51.5 17.2 14.2 17.2
NJ-33 37.43 14.4 0.0 0.0 85.6
NJ-35 58.07 65.4 0.0 29.9 4.6
US-46 72.09 42.3 13.9 28.3 15.5
NJ-47 75.2 56.6 0.0 14.8 28.6
NJ-70 59.77 11.2 16.7 30.7 41.3
US-130 73.16 21.7 17.7 41.0 19.5
US-202 80.31 9.6 17.2 48.6 24.7
US-206 120.9 35.3 29.2 9.6 25.9
US-322 50.2 38.8 0.0 0.0 61.2
CR-579 34.83 26.8 0.0 0.0 73.2
Average 31.9 15.0 27.2 25.9
FIGURE 3 Severe-risk area on CR-579.
DISCUSSION OF RESULTS
There are a few limitations to the methodology developed in thisstudy. First, there was a limited amount of AADT data available. Forsegments without AADT data, counts were linearly interpolatedunder the assumption that traffic flow is consistent from one sectionof road to the next. However, this is not ideal data for the methodol-ogy. Second, there is a relatively low number of motorcycle crashes.Several sections of road needed to be excluded from the analysis dueto fluctuations. Therefore, this methodology may not be applicableto roads with relatively few motorcycle crashes.
Also, roadway factors are not the only factors contributing tomotorcycle crashes. Rider and vehicle factors may also contributeto the risk of a crash. An assumption of this study is that the com-position of the motorcyclists on each roadway type is the same.This assumption allows for direct comparison of roadways, since itis assumed that the riding population on roadways of the same typeis the same.
CONCLUSIONS
Motorcycles are different from other vehicles on the road; they areless stable and provide less protection to operators and passengers.Roadway-rating systems are being developed in several countries, butare designed primarily for use by car drivers. These rating systems areof limited value for motorcyclists. As demonstrated through the com-parison of risk on each roadway to that of passenger cars, motorcycleshave different crash trends than other vehicles. Through this study,
74 Transportation Research Record 2194
a methodology was developed to assign motorcycle-specific safetyratings to roads. The methodology was applied to 16 roadways,covering 1099.5 mi (1769.5 km), in New Jersey.
To date, 16 roadways in New Jersey have been rated and mapped,yielding a data set. This data set can be extended to other roadwaysin New Jersey, as well as across the nation. Comparing these data tocrash ratings previously developed will highlight areas, such as thaton New Jersey’s CR-579, that pose a specific threat to motorcycleriders. These areas are ideal candidates for in-depth investigations,for improvements that make the roadways safer. Additionally, motor-cyclists can be warned to take extra caution in these hazardous areasor to avoid them.
ACKNOWLEDGMENTS
The authors are grateful to the New Jersey Department of Transporta-tion and the Motor Vehicle Commission for their sponsorship of thisresearch program. The authors thank Pamela Fischer of the New Jer-sey Division of Highway Traffic Safety for inspiring this study byasking whether a assessment of motorcycle road safety might be pos-sible. The authors also thank Ed Kondrath, Scott McNear, and TomWright of the New Jersey DOT and Motor Vehicle Commission.
REFERENCES
1. European Road Assessment Program. EuroRAP’s Protocols. EuropeanRoad Assessment Program, Hampshire, United Kingdom, 2006. http://www.eurorap.org/protocols. Accessed July 27, 2009.
2. Lynam, D., T. Sutch, J. Broughton, and S. D. Lawson. European RoadAssessment Programme Pilot Phase Technical Report. European RoadAssessment Program, Hampshire, United Kingdom, May 2003. http://www.eurorap.org/library/pdfs/pilot_technical_report.pdf. Accessed July27, 2009.
3. Midwest Research Institute and Iowa State University’s Center for Trans-portation Research and Education. usRAP: Feasibility Assessment andPilot Program. AAA Foundation for Traffic Safety, Washington, D.C.,May 2006.
4. Metcalfe, J., and G. Smith. The Australian Road Assessment Program(AusRAP). Proc., 2005 Australasian Road Safety Research PolicingEducation Conference, Wellington, New Zealand, 2005.
5. Travel Activity by Vehicle Type. New Jersey Department of Transportation,Trenton, NJ, 2001–2007. http://www.state.nj.us/transportation/refdata/roadway/vmt.shtm. Accessed July 2, 2009.
6. Vehicle Monitoring Guide Supplement: Vehicle Classification Monitor-ing, Section 4S. Publication FWHA-PL-01-021. Federal HighwayAdministration, U.S. Department of Transportation, Washington, D.C.,2008.
7. Straight Line Diagrams. New Jersey Department of Transportation, Trenton, N.J., 2009. http://www.state.nj.us/transportation/refdata/sldiag/_Booklet.pdf. Accessed July 2, 2009.
8. Traffic Safety Facts: 2007 Data: Motorcycles. DOT HS 810 990.National Highway Traffic Safety Administration, U.S. Department ofTransportation, Washington, D.C., 2007.
The Motorcycles and Mopeds Committee peer-reviewed this paper.
FIGURE 4 CR-579 takes a sharp turn and disappears from visionbecause of downgrade.