rapid technologies to enhance quality control on...
TRANSCRIPT
Rapid Technologies to Enhance Quality Control on Asphalt Pavements Infrared (IR) Scanner Workshop
Hosted by:Virginia DOTEastern Federal LandsMay 17, 2016

Our Focus for Today
2
Workshop Objective …
1. Describe the Infrared Scanner Technology (What is it and Why it is needed?)
2. Understand how to use the IR Equipment & Software
3. Discuss the results from the Virginia DOT and Eastern Federal Lands Demonstration Projects
4. Discuss the Contractor’s and Agency’s Perspective as a QC or QA Tool
5. Know Implementation Strategies

Infrared Scanner Workshop
3
AGENDA:
Time Topic/Presentation
9:30 to 9:45 Welcome and Introductions
9:45 to 10:15 Introduction to Infrared Technology: What is it and Why is it Needed?
10:15 to 10:30 Equipment and Software: How to use it?
10:30 to 11:00 Data Analyses and Findings
11:00 to 11:30 Agency Perspective as a QA Tool
11:30 to 12:00 Contractor’s Perspective as a QC Tool
12:00 to 1:15 Lunch (Catered for workshop)
1:15 to 2:00 Implementation Strategies (focus on Agency use):
1. Products and Application of Products 2. Trouble Shooting Guide Lead Agency Strategies/Specifications
2:00 to 2:30 Questions/Answers and Closing Comments
2:30 to 2:35 IR Workshop Wrap-Up
2:35 to 3:00 Presentation and Demonstration of Ground Penetrating Radar Equipment

Infrared Technology (IR)
What is it and why use it?
May 17, 2016

IR – What is it & why use it?
5
1. IR - Defined. 2. How is it measured?3. Why is it important?

IR – What is it & why use it?
Infrared Thermography:• The mapping of temperature contours (equal
temperature) over the surface of a material. • Contours are used to evaluate materials by
measurement of their surface temperature and its variation.
6

IR – What is it & why use it?
Temperature segregation (differential):• More than 25 ºF difference in mat temperature behind
screed.
7

IR – What is it & why use it?
Types of Temperature Differences: 1. Cold spots
– Truck to truck temperature differences
– Improper loading and unloading of trucks
2. Thermal streaks – Longitudinal segregation– Inadequate or non-uniform
amount of material across the mat

IR – What is it & why use it?
• Cold spots– Temperature difference of
mat between truck exchanges – common.
– Areas with higher air voids• Focused testing have
validated higher air voids– Coring – Radar (full coverage)– Nuclear gauge

IR – What is it & why use it?
Background• 1996 through 2000s – field
work concluded temperature differences could be accurately detected and quantified:– Low temperatures result
in low density zones in mat
– A few States adopt temperature uniformity specification
.
Temperature profile criteria based on desired density
uniformity.

IR – What is it & why use it?
11
1. IR - Defined. 2. How is it measured?3. Why is it important?

IR – What is it & why use it?
History; Mat Temperature Measurements• Temperature guns
– Point readings• Temperature cameras
– Time specific to identify areas with cold spots or thermal streaks
12

IR – What is it & why use it?
History; Mat Temperature Measurements• IR sensors, IR-Bar; first device for continuous readings• Pave-IR Scanner; second generation device for
continuous readings
13

IR – What is it & why use it?
Application & use of temperature cameras• Identify areas with cold spots for biased sampling in
density specification• Identify thermal streaks
14
IR – What is it & why use it?
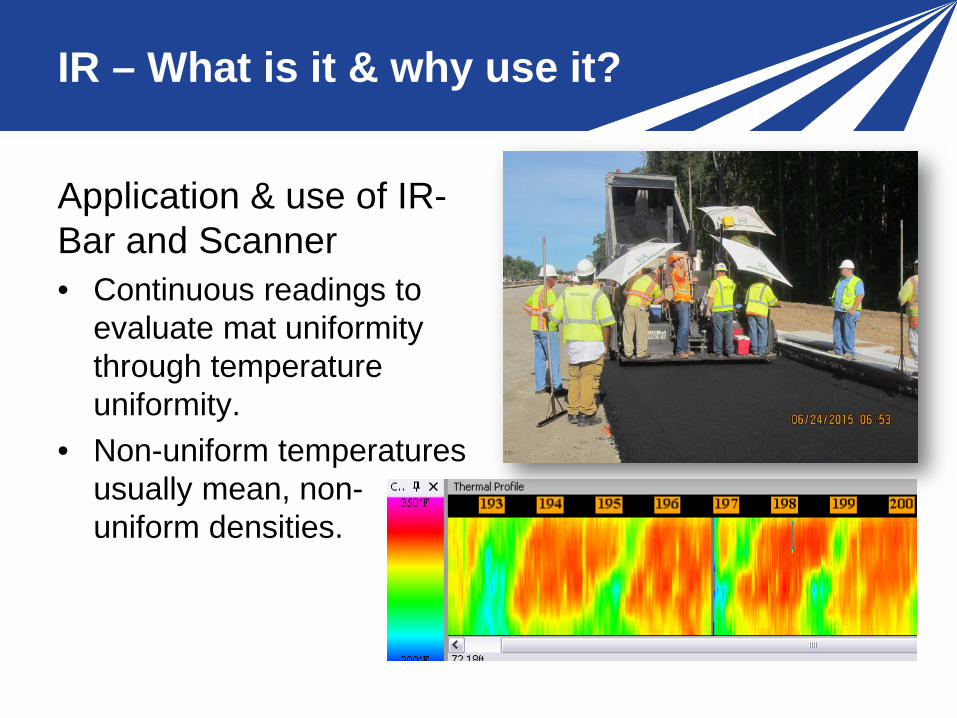
Application & use of IR-Bar and Scanner• Continuous readings to
evaluate mat uniformity through temperature uniformity.
• Non-uniform temperatures usually mean, non-uniform densities.

IR – What is it & why use it?
16
1. IR - Defined. 2. How is it measured?3. Why is it important?

IR – What is it & why use it?
• Aggregate segregation in mat = temperature segregation• Non-uniform temperatures usually result in non-uniform
densities
17

Segregation – A difficult issue to resolve, when it is difficult to identify or confirm.
IR – What is it & why use it?

IR – What is it & why use it?
• Truck to truck segregation results in cold spots; IR can accurately identify these areas.

IR – What is it & why use it?
• Both sided longitudinal and centerline segregation result in thermal streaks; IR can identify these areas.

IR – What is it & why use it?
• Effect of cold spots, low mat temperatures on percent compaction; densities are:– Lower– More variable
21
Outlier?
TTI Study: ∆25 ºF ~ ∆6 pcf
Maine DOT: ∆20 ºF ~ ∆4 pcf
Maine DOT IR Demonstration Project

IR – What is it & why use it?
• Effect of reduced compaction because of lower mat temperatures or inadequate rolling.
22

Impact of temperature differences or areas with low temperatures.
23
Research and Development
IR – What is it & why use it?
Loss of service life or increase in maintenance costs.
IR – What is it & why use it?
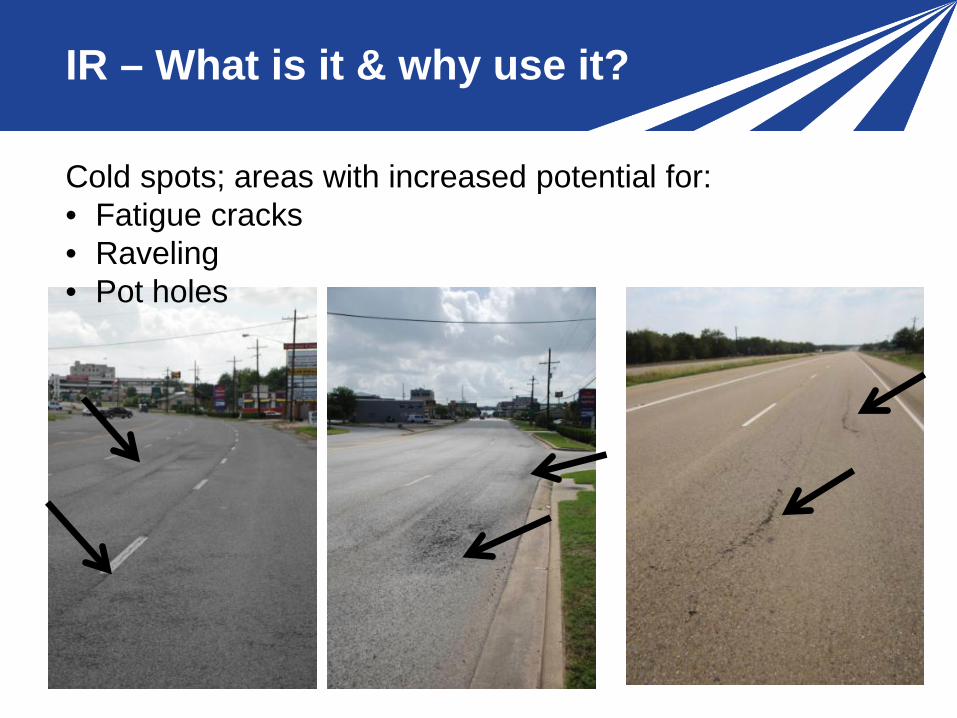
Cold spots; areas with increased potential for:• Fatigue cracks• Raveling• Pot holes

IR – What is it & why use it?
Thermal streaks; longitudinal areas with increased potential for:• Longitudinal cracking
25

IR – What is it & why use it?
• Thermal streaks can be very damaging, depending on the level of density achieved in localized areas.
• Measuring the density, accurately, in a localized area is complicated.
26

Questions?
27
NEXT:
• Equipment and Software: How to use it?

Infrared Technology (IR)
IR Equipment and Software: How to Use It?
May 17, 2016

IR Equipment and Software
29
1. Equipment and Installation2. Software and Its Features

IR Equipment and Software
Equipment• Mast Base• Mast Extension• Mast Arm• IR Scanner• DMI• GPS Unit• Wiring• Connection bolts
& materials

IR Equipment and Software
IR mast base and extension attached to paver.
31Mounted Directly to Screed
Mounted to a Steel Plate Attached to Work Platform

IR Equipment and Software
• IR Scanner attached to paver; scans mat behind screed in one direction.
• GPS attached to the mast arm.
32

IR Equipment and Software
33
IR scan screen used to see/monitor mat temperatures in real time; attached to the mast post or extension.

IR Equipment and Software
34
DMI placed on wheel hub to measure distance during paving operation.

IR Equipment and Software
35
1. Equipment and Installation2. Software and Its Features

IR Equipment and Software
36
Two models of data transfer and extraction

IR Equipment and Software
37
• Online Web App: https://eroutes.info/paveappweb/• Login is user specific
IR Equipment and Software
38
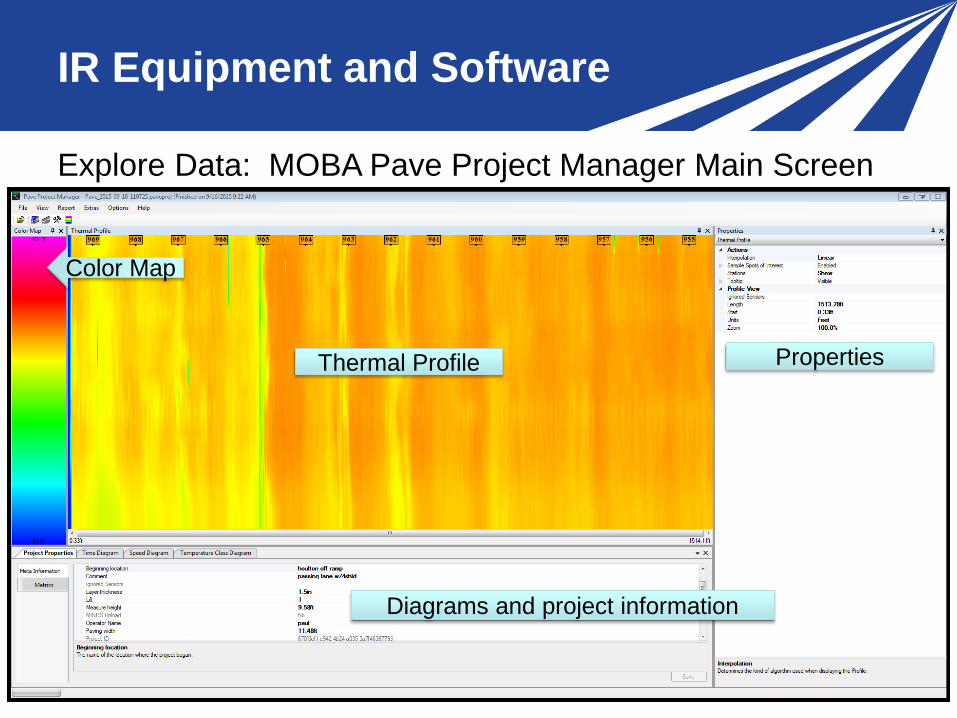
Explore Data: MOBA Pave Project Manager Main Screen
Color Map
Thermal Profile
Diagrams and project information
Properties

IR Equipment and Software
Color Map and Properties for Screen
39

IR Equipment and Software
40
Thermal Profile Properties Screen

IR Equipment and Software
41
Project Properties Screen

IR Equipment and Software
42
Time Diagram Screen

IR Equipment and Software
43
Speed Diagram Screen
IR Equipment and Software
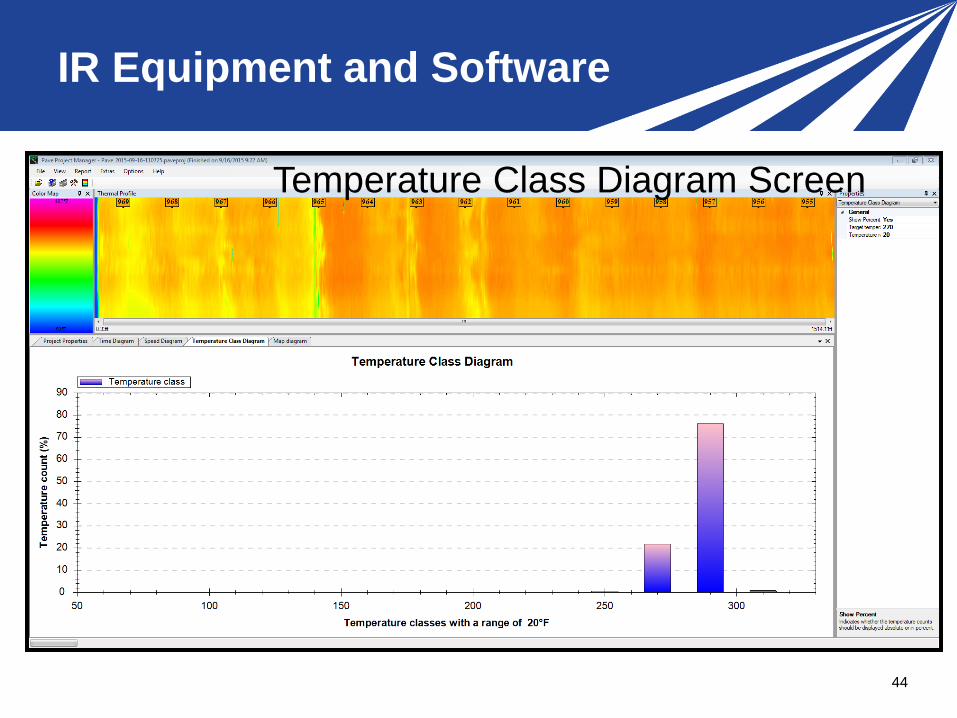
44
Temperature Class Diagram Screen

IR Equipment and Software
45
Map Diagram Screen

IR Equipment and Software
46
Click any location on the thermal profile
Adding Point Measurements

IR Equipment and Software
47
Generates PDF Report
Generating Reports

IR Equipment and Software
48
Generating Reports

IR Equipment and Software
49
Generating Reports

IR Equipment and Software
Exporting Data• Export to .txt (semicolon separated) • Save as .paveproj
50

Questions?
51
NEXT:
• Data Analyses and Findings: US-1 Fort Belvoir,
VA; and US Route 15, Culpeper, VA

Infrared Technology (IR)
Data Analyses and Findings: US Route 15 Rehabilitation; Culpeper, VAUS 1 New Construction; Ft. Belvoir, VA
May 17, 2016

Data Analyses & Findings
53
1. Project Overview2. Data Collection3. Data Processing4. Data Summary

Data Analyses & Findings
54
US Route 15; Northbound and
Southbound Lanes
US-1 Towards Fort Belvoir, VA
US-1 Towards Pohick, VA
Davison Army Airfield
New Bridge US 1; Lanes in Both Directions

Data Analyses & Findings
Mixture delivered to site with end dump discharge trucks.
55
Mixture placed with Caterpillar paver. MTV used on the US Route 15 project.
US Route 15 Project
Mixture placed with Blaw-Knox paver; no MTV used.
US 1 Project

Data Analyses & Findings
Compaction Train; all steel wheel rollers used on both projects.
56
Rollers on US 1
Rollers on US 15

Data Analyses & Findings
57
Nuclear & non-nuclear density gauge used to measure mat density and superimposed on temperature profiles.

Data Analyses & Findings
58
1. Project Overview2. Data Collection3. Data Processing4. Data Summary

Data Analyses & Findings
59
Raw Temperature Profile for first part of the first lot.

Data Analyses & Findings
60
Raw Temperature Profile showing continuous improvement or more uniform mat temperatures as paving progresses.
Example from Maine demonstration project.
Near Start of
Lot
Near Center of Lot
Near End of
Lot

Data Analyses & Findings
61
US 1Summary of Raw Data
for One LotAvg. Temp. = 245.3 ºF
Not mat temperatures

Data Analyses & Findings
62
US 15Summary of Raw Data
for One LotAvg. Temp. = 250.7 ºF
Not mat temperatures

Data Analyses & Findings
63
Data diagrams reviewed during production:1. Paver speed diagram2. Time plot3. Average temperature plot

Data Analyses & Findings
64

Data Analyses & Findings
65

Data Analyses & Findings
66

Data Analyses & Findings
67
1. Project Overview2. Data Collection3. Data Processing4. Data Summary

Data Analyses & Findings
Data Processing—eliminate invalid temperature measurements:1. Eliminate measurement locations within 2 feet of the
mat’s edge.
68

Data Analyses & Findings
Data Processing—eliminate invalid temperature measurements:2. Eliminate data with paver stops greater than 10 seconds,
between locations:– 2 feet behind measurement location of stop– 8 feet in front of measurement location of stop
3. Eliminate temperature readings < 170 ºF and > 400 ºF.
69

Data Analyses & Findings
70
T1.0 T98.5
• Temperature Differential, each 150 foot segment

Data Analyses & Findings
• Temperature Differential Criteria, each 150 foot segment:
• Tdiff < 25 ºF No temperature difference• 25 ºF < Tdiff < 50 ºF Moderate temperature difference• Tdiff > 50 ºF Severe temperature difference
71
0.15.98 TTTDiff −=

Data Analyses & Findings
72
US 15Summary of Processed Data
for one day of paving
Raw IR data: Tavg. = 250.7 ºFProcessed data: Tavg. = 283 ºF

Data Analyses & Findings
73
0
500
1000
1500
2000
2500
180 190 200 210 220 230 240 250 260 270 280 290 300 310
Freq
uenc
y
Temperature Bins (degree F)
US 1Summary of Processed Data
for one day of paving
Raw IR data: Tavg. = 245.3 ºFProcessed data: Tavg. = 286 ºF

Data Analyses & Findings
74
1. Project Overview2. Data Collection3. Data Processing4. Data Summary

Data Analyses & Findings
75
Difference in Traffic Levels – Haul Time
US 15 US 1

Data Analyses & Findings
76
Paver Stops
Total Number of Increments
Number of Increments within Temp. Regimes Thermal
StreakingMinor Moderate SevereUS 1 Project
Exclude 108 2 24 82 NoneInclude 108 2 16 90 None
US Route 15 ProjectExclude 84 72 10 2 NoneInclude 84 71 9 4 None
Processed Data
To include or exclude paver stops?If paver stop cause severe temperature differences:
they should be included. However:

Data Analyses & Findings
77
Required paver stops due to sampling should be eliminated from temperature difference profiles.

Data Analyses & Findings
78
Paver Stops
Total Number of Increments
Number of Increments within Temp. Regimes Thermal
StreakingMinor Moderate SevereExclude 84 72 10 2 NoneInclude 84 71 9 4 None
Processed Data for US 15
Minnesota DOT’s specification:• Minor Temperature Difference: +$20 per Increment• Moderate Temperature Difference: $0 per Increment• Severe Temperature Difference: -$20 per Increment
Total Incentive to Contractor:$1,340 for the project segment [Including paver stops].

Data Analyses & Findings
79
Paver Stops
Total Number of Increments
Number of Increments within Temp. Regimes Thermal
StreakingMinor Moderate SevereExclude 108 2 24 82 NoneInclude 108 2 16 90 None
Processed Data for US 1
Minnesota DOT’s specification:• Minor Temperature Difference: +$20 per Increment• Moderate Temperature Difference: $0 per Increment• Severe Temperature Difference: -$20 per Increment
Total Disincentive (Penalty) to Contractor:$1,760 for the project segment [Including paver stops].
Data Analyses & Findings
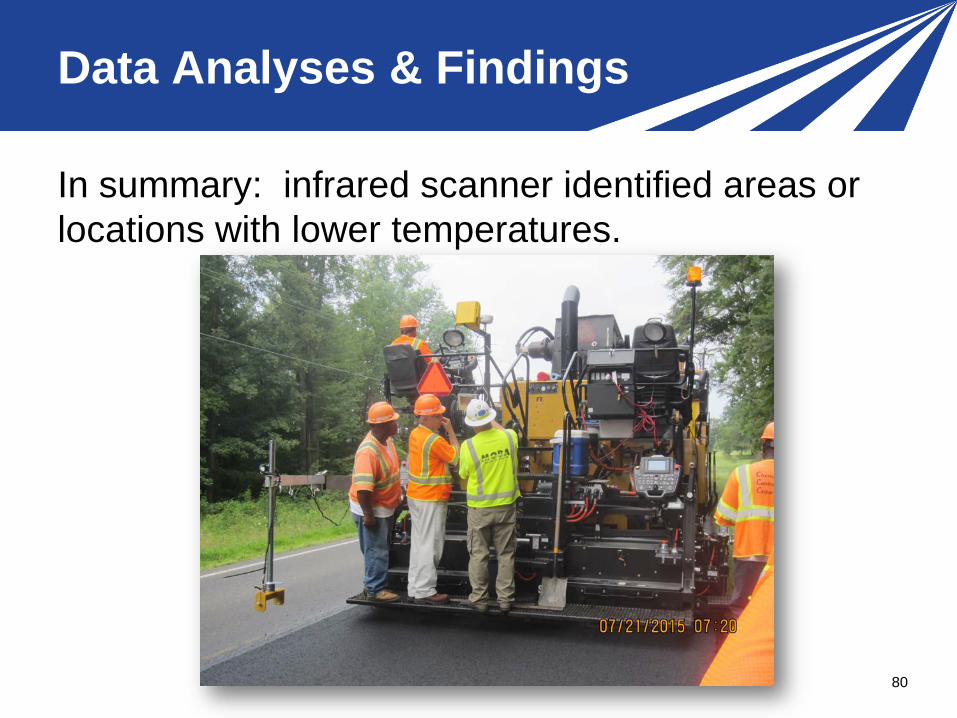
80
In summary: infrared scanner identified areas or locations with lower temperatures.

Data Analyses & Findings
Contact Information:• Kevin McGhee; [email protected]• Ed Dalrymple; [email protected]• Mike Dallaire; [email protected]• Rob Hinman; [email protected]• Paul Angerhofer; [email protected]• Joe Reiter; [email protected]• Harold Von Quintus; [email protected]
81

Questions?
82
NEXT:
• Implementation: Virginia DOT, Eastern Federal
Lands and Contractor Points of View

Infrared Technology (IR)
Implementation: Virginia DOT, Eastern Federal Lands, and Contractor Points of View
May 17, 2016

Agency/Contractor Deployment
1. Agency:– Reasons for deploying IR Technology– Benefits – Agency points of view– Plans to implement IR Technology; short-term plans– Schedule for deployment
2. Contractor: – Reasons for using IR Technology– Benefits – Contractor points of view– Making decisions in real time to minimize penalties– Use of future projects
84

Agency/Contractor Deployment
Some Typical Questions for Deployment:1. How many projects has Pave-IR ScanTM been used on?2. How many projects were for quality assurance?3. What percent of profiles exhibited medium & severe temperature
differences?4. How easy is it to set up the project in Pave-IR ScanTM?5. Any problems experienced with the equipment?6. Has the Pave-IR system changed daily practice?7. Has use of the Pave-IR system changed interaction between the
owner & contractor?8. How easy is the IR data to extract and process?9. Do you review the Pave-IR reports at the end of the day?10. Do you think you are getting a higher quality mat at the end of the
day using the Pave-IR system?85

Infrared Technology (IR)
Implementation Products and Strategies
May 17, 2016

Implementation Products and Strategies
87
1. Field Demonstration Projects and Products2. Application and Use: Examples3. Questions and Answers

CA
AZ
CO
NM
TX
OK AR
LA
MO KY
AL GA
FL
VA
OH
MI
VTAK
MT
NV
MEWA
OR
UTKS
IDWY
ND
SD
MN
NE
WI
IAIL IN
MS
TNSC
NC
WV
PA
NY
CTNJDEMD
MANH
PR
RI
Demonstration Projects and Products
DC
HI
NorthernMarianaIslands /Guam
AmericanSoma
V.I.
EFL

Demonstration Projects and Products
1. Case Study/Demonstration Report2. Showcase3. Trouble Shooting and Best Practices Guide4. Specification Guide5. IR Guide/Primer
89

Demonstration Projects and Products
1. Field Demonstration Projects and Case Study Report:
• Purpose/Focusa) Enhance the deployment and use of the IR
technology. b) Identify/summarize lessons learned from field trials.c) Confirm Pave-IR can identify the different types of
temperature differentials that affect mat density and pavement performance.
d) Demonstrate and discuss value added using IR technology to agency and contractor
90

Demonstration Projects and Products
2. Showcase:• Purpose/Focus
a) Highlight IR technology, provide training & operation.
b) Attendance includes agencies, contractors, industry, consultants and academia.
• Missouri DOT is the host agency• Date is June 1, 2016
91
All participating agencies in IR
demonstration projects have received an
invitation.• Registration site link is on
the showcase agenda.

Demonstration Projects and Products
3. Trouble Shooting and Best Practices Guide• Purpose/Focus
a) Provide guidance on:• Setting up the equipment and getting started.• Interpreting the raw data for making decisions.
b) Identify data collection and maintenance issues with the equipment and software.
92

Demonstration Projects and Products
4. Specification Guide; AASHTO PP 80-14
93

Demonstration Projects and Products
4. Specification Guide, continued• Purpose/Focus
a) Advance standardization of IR equipment and testing protocols through AASHTO.
b) Agencies can customize it to their needsc) Revised/Enhanced AASHTO PP 80-14 d) Agency Experience: Minnesota DOT, Texas DOT,
etc.
94

Demonstration Projects and Products
5. IR Guide/Primer• Purpose/Focus
a) Introduce the Pave-IR method to transportation agencies and contractors.
b) Increase awareness of how IR can improve paving operations and increase uniformity of mat.
c) Demonstrate use of Pave-IR as a QC Tool.
95

Implementation Products and Strategies
96
1. Field Demonstration Projects and Products2. Application and Use: Examples3. Questions and Answers

Application and Use: Examples
Application & Use, WHY:• Continuous readings to evaluate
mat uniformity through temperature uniformity.
• Non-uniform temperatures imply non-uniform densities, which usually mean higher maintenance.
97

Application and Use: Examples
Role of IR in Quality Assurance Programs1. Quality control plan; contractor
– Improve communication between personnel– Reduce risk of being penalized– Forensic tool to trouble shoot low or non-uniform
densities2. Acceptance plan; agency
– Reduce future distress and maintenance costs – Dispute resolution
98

Application and Use: Examples
IR Role in Quality Control Plan; 4 examples1. Missouri demonstration project2. Maine demonstration project3. Virginia demonstration project4. Federal Lands demonstration project
99

Application and Use: Examples
1. Missouri demonstration project– Increased communication between plant and paver to minimize
temperature differentials of mat.
100

Application and Use: Examples
2. Maine demonstration project– Monitor average temperature differential on a lot by lot basis for
identifying need to take action.– 85 percent of segments exhibited < 25 ºF.– If average temperature differential exceeds 15 ºF, risk for penalty
increases.
101
Maine DOT: ∆20 ºF ~ ∆4 pcf

Application and Use: Examples
3. Virginia demonstration project– Identify reason for severe temperature differentials
and take action.• Avg. temperature differential at start of paving
project; about 30 ºF.• Avg. temperature differential after adding two
trucks; about 15 ºF.
102

Application and Use: Examples
4. Federal Lands demonstration project– Identify reason for severe temperature differentials and
take action; loading of trucks.• One dump of mix in truck bed – severe temp.
differential• Two dump, no stockpile – reduced temp. differential.
103

Application and Use: Examples
IR Role in Acceptance Plan; examples:1. Identify cold spots
– Colorado, Michigan, Minnesota, Quebec, Texas, Washington
2. Identify thermal streaks– Quebec
104

Application and Use: Examples
Cold spots; areas with increased potential for:• Fatigue cracks• Raveling• Pot holes
105
• Increase in maintenance costs.
• Loss of service life

Thermal streaks; areas with increased potential for longitudinal cracking.
Research and Development
Application and Use: Examples
Loss of service life & increase in maintenance costs.
106

Application and Use: Examples
Specification Guide; AASHTO PP 80-14
107
1. Scope2. Referenced Document3. Terminology4. General Thermal Profile Requirements5. Hardware6. Data File Format7. Calibration8. Profiler Accuracy9. References10.Appendices (Non-mandatory)
1. Example Acceptance Criteria2. Terminology3. Criteria4. Monetary Adjustment

Application and Use: Examples
IR Role in Acceptance Plan• Determine biased areas for
sampling and testing– Washington DOT
• Determine pay factors– Minnesota DOT– Quebec
• Minnesota pay factors for each 150 foot segment:– $20 bonus; <25ºF– $20 penalty; >50ºF
108

Application and Use: Examples
Washington State DOT; WSDOT SOP 733• Aggregate segregation: spots and streaks defined by
visual inspection• Equipment for measuring temperature differentials:
– Infrared camera– Handheld noncontact infrared device– IR-Bar or IR-Scanner not identified
• Temperature Differential Area: > 25ºF and paver stops are included– Measured prior to compaction
• In temperature differential areas; systematic compaction test is required for all areas.
109

Application and Use: Examples
Alaska DOT; Special Provision draft• IR and IC added to Glenn Hwy project• After test strip is completed, monitor is covered for first
lot, then removed for latter lots and compared to the first:– IR-Scanner
• Temperature Differential Area: > 25ºF and paver stops are included– Measured prior to compaction
• In temperature differential areas:– Perform density profiles– Adjust compaction and paving equipment operation to eliminate
temperature differential areas.110

Application and Use: Examples
Texas DOT; Item 341, Tex-244-F• Equipment for measuring temperature differentials:
– Infrared camera– IR-Bar or IR Scanner
• Temperature Differential Category, behind paver and paver stops are excluded:– < 25ºF is minor thermal segregation– 25ºF to 50ºF moderate thermal segregation– > 50ºF is severe thermal segregation
• In areas with severe temperature differential:– Eliminate or remove and replace.– Density profile not required when using IR devices
111

Application and Use: Examples
Minnesota DOT• Equipment for measuring temperature differentials:
– IR Scanner
• Temperature Differential Category and acceptance:– < 25ºF is minor thermal segregation; $20 bonus/sect.– 25ºF to 50ºF moderate thermal segregation $0 bonus– > 50ºF is severe thermal segregation $20 penalty/sect.
112

Application and Use: Examples
Deployment Strategy, Common Steps/Tasks:1. Define temperature differences that cause significant distress,
increasing maintenance cost & reducing service life (Minnesota, Ontario, Texas, Washington). a) Many published reports that document the importance of temp.
2. Identify mat property changes between areas with severe temperature differentials (Ontario, Texas).a) Many research reports that identify how density affects the mat’s
properties related to performance.3. Draft IR specification (Minnesota, Ontario, Texas, Washington)4. Obtain comments from industry for revising specification; getting input
from other partners (Ontario, Minnesota, Texas).5. Host/sponsor training sessions with equipment/software
113

Application and Use: Examples
Deployment Strategy, Common Steps/Tasks:6. Execute pilot projects over 1 to 2 years (Minnesota, Ontario)7. Educate industry/agency personnel on results (Ontario).8. Update/revise specification (Minnesota, Ontario, Texas, Washington)9. Establish actions based on temperature profile differences (all)
a) Increased density testing (Texas) b) Biased testing (Washington)c) Incentives/disincentives based temperature differentials
(Minnesota, Ontario)10. Confirm appropriateness of acceptance plan (Ontario)11. Full deployment
114

Application and Use: Examples
Conclusion from demonstration projects, to-date:• Pave-IR scanner is one tool
to confirm a uniform, high-quality mat.
115

Implementation Products and Strategies
116
1. Field Demonstration Projects and Products2. Application and Use: Examples3. Questions and Answers

Agency/Contractor Deployment
Some Questions for Deployment:1. How many projects has Pave-IR ScanTM been used on?2. How many projects were for quality assurance?3. What percent of profiles exhibited medium & severe temperature
differences?4. How easy is it to set up the project in Pave-IR ScanTM?5. Any problems experienced with the equipment?6. Has the Pave-IR system changed daily practice?7. Has use of the Pave-IR system changed interaction between the
owner & contractor?8. How easy is the IR data to extract and process?9. Do you review the Pave-IR reports at the end of the day?10. Do you think you are getting a higher quality mat at the end of the
day using the Pave-IR system?11. How have agencies/contractors used the IR products? 117

Workshop Wrap-Up
118
Complete workshop forms.
R06C: additional information on Infrared Tech.
• AASHTO Site: http://shrp2.transportation.org
• FHWA Site: www.fhwa.got.gov/goshrp2
NEXT:
• Presentation and Demonstration of Ground Penetrating
Radar Equipment