rapid exchange between soil carbon and atmospheric carbon dioxide driven by temperature change
TRANSCRIPT
E K S 3
Rapid Exchange Between Soil Carbon and Atmospheric Carbon Dioxide Driven by
Temperature Change Susan E. Trumbore,* Oliver A. Chadwick, Ronald Amundson
Comparison of 14C (carbon-14) in archived (pre-1963) and contemporary soils taken along an elevation gradient in the Sierra Nevada, California, demonstrates rapid (7 to 65 years) turnover for 50 to 90 percent of carbon in the upper 20 centimeters of soil (A horizon soil carbon). Carbon turnover times increased with elevation (decreasing temperature) along the Sierra transect. This trend was consistent with results from other locations, which indicates that temperature is a dominant control of soil carbon dynamics. When extrapolated to large regions, the observed relation between carbon turnover and temperature suggests that soils should act as significant sources or sinks of atmospheric carbon dioxide in response to global temperature changes.
i wo critical questions regarding the role of soils in the global carbon cycle are (i) what is the potential for soils to release carbon from increased decomposition rates in a warmer world and (ii) what is the potential for transient release or sequestering of carbon in soils as a result of interrannual climate variability? Soil organic matter (SOM) contains roughly two-thirds of terrestrial carbon and two to three times as much carbon as atmospheric COz (I). According to estimates based on ecosystem modeling, changes in soil carbon after disturbance, and carbon isotopes, at least half of the organic matter in the 0- to 20-cm layer of soils is in fast-cycling carbon pools with turnover times of decades or less (2-7). Prediction of the short-term effects of climate or land use change on soil carbon storage requires quantification of soil carbon turnover rates and how they vary with factors such as temperature, precipitation, and other soil properties.
To determine the influence of temperature on storage and turnover of soil carbon, we sampled C and 14C from a series of soils along an elevation transect of the western
slope of the Sierra Nevada range, California, that were previously sampled in the period from 1958 through 1963 (8). All the soils have similar parent material, age, relief, slope, and aspect, although climate and vegetation vary with elevation (9). Thermonuclear weapons testing in the early 1960s approximately doubled the amount of 14C in atmospheric COz . Tracing this bomb 14C through SOM reservoirs over the past 30 years provides a means of determining the size and turnover time of fast-cycling soil carbon pools (5-7, 10, 11).
Mean annual temperature decreases with increasing elevation along the Sierra transect according to the atmospheric lapse rate. Precipitation averages between 90 and 120 cm year -1, except at the lowest elevation site (12). Vegetation changes from oak woodland or savanna in the Sierra foothills to mixed conifer forest at higher elevations (13). Soils vary from Alfisols to Inceptisols with increasing elevation and are developed on unglaciated granodiorite. Vegetation and soil carbon are assumed to have achieved steady state with average Holo-
cene climate conditions and roughly equivalent soil residence times with respect to weathering and erosion (14).
Samples from soils originally collected in the period from 1958 through 1963 were obtained from an archive maintained by the Division of Ecosystem Sciences, University of California, Berkeley. Original field notes and topographic maps were used to relocate and resample the same sites in 1992 (to within 100 m of the original locations). Soil bulk density and C and 14C amounts were determined from archived and modern soils with the use of standard methods (15). In Table 1, we present data from soil A horizons (16).
We separated bulk (<2 mm) SOM into three fractions (17): low-density organic matter (<2.0 g cm - 3 ) ; the portion of dense (>2.0 g cm - 3 ) .organic matter that is hy-drolyzable in acids and bases; and the non-hydrolyzable dense residue. Low-density organic matter, consisting of relatively unde-composed vascular plant material mixed with some (<8% by weight) charcoal, made up 50 to 90% of the total carbon in the soil A horizons, with the proportion increasing with elevation (Table 1). The greatest abundance of mineral-associated (>2 g cm - 3 ) organic matter (40 to 50% of total A horizon carbon) was in soils with >10% clay (11). Nonhydrolyzable components made up less than 15% of the total A horizon soil carbon at all sites.
We report 14C data (Table 1) as A14C (18). Negative A14C values (less than -50 per mil) indicate that on average, the carbon has resided in the soil long enough to reflect radioactive decay of cosmogenic 14C. Positive A14C values indicate significant amounts of bomb 14C. SOM fractions with the fastest turnover times have the least negative pre-bomb A14C values and show large increases in A14C (>100 per mil) over the past 30 years. Refractory organic matter fractions have more negative A14C values
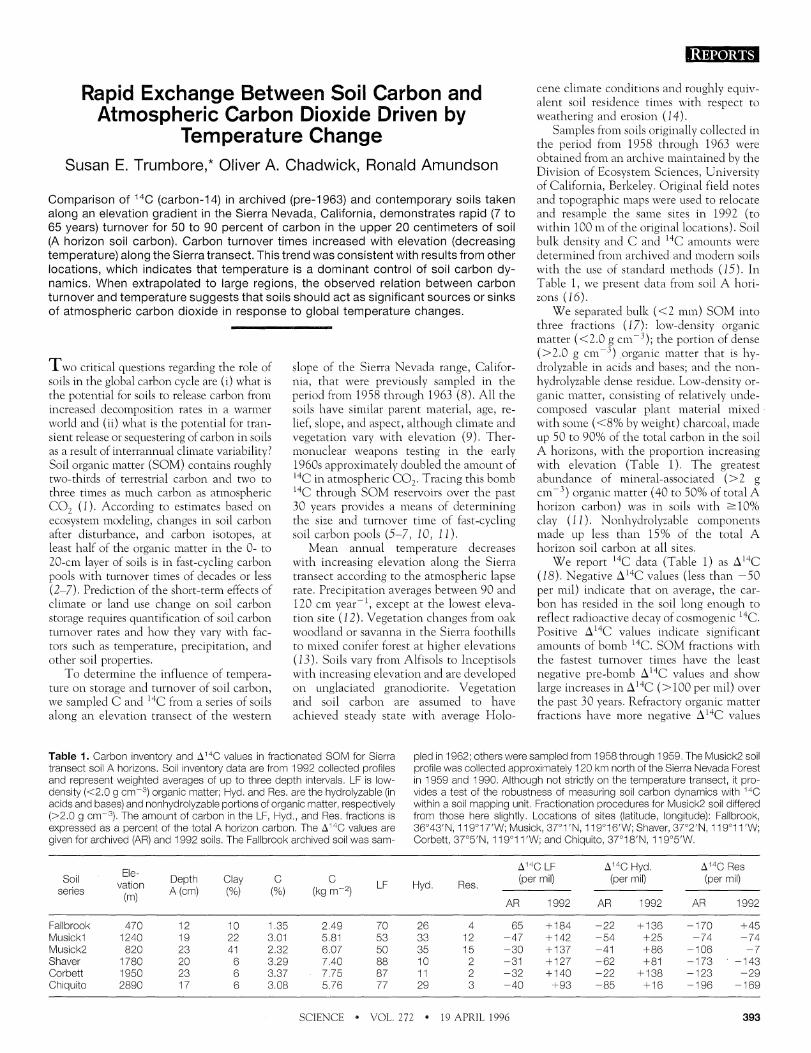
Table 1. Carbon inventory and A14C values in fractionated SOM for Sierra transect soil A horizons. Soil inventory data are from 1992 collected profiles and represent weighted averages of up to three depth intervals. LF is low-density (<2.0 g cm -3) organic matter; Hyd. and Res. are the hydrolyzable (in acids and bases) and nonhydrolyzable portions of organic matter, respectively (>2.0 g cm -3). The amount of carbon in the LF, Hyd., and Res. fractions is expressed as a percent of the total A horizon carbon. The A14C values are given for archived (AR) and 1992 soils. The Fallbrook archived soil was sam
pled in 1962; others were sampled from 1958 through 1959. The Musick2 soil profile was collected approximately 120 km north of the Sierra Nevada Forest in 1959 and 1990. Although not strictly on the temperature transect, it provides a test of the robustness of measuring soil carbon dynamics with 14C within a soil mapping unit. Fractionation procedures for Musick2 soil differed from those here slightly. Locations of sites (latitude, longitude): Fallbrook, 36°43'N, 119°17'W; Musick, 37°1 'N, 119°16'W; Shaver, 37°2'N, 119°11 'W; Corbett, 37°5'N, 119°11 'W; and Chiquito, 37°18'N, 119°5'W.
Soil
series
Fallbrook Musickl Musick2 Shaver Corbett Chiquito
Elevation
(m)
470 1240 820
1780 1950 2890
Depth A (cm)
12 19 23 20 23 17
Clay (%)
10 22 41
6 6 6
C (%)
1.35 3.01 2.32 3.29 3.37 3.08
C (kg m-2)
2.49 5.81 6.07 7.40
- 775 5.76
LF
70 53 50 88 87 77
Hyd.
26 33 35 10 11 29
Res.
4 12 15 2 2 3
A14C LF (per
AR
65 -47 -30 -31 -32 -40
mil)
1992
+ 184 + 142 + 137 + 127 + 140
+ 93
A14CHyd. (per
AR
-22 -54 -41 -62 -22 -85
mil)
1992
+ 136 +25 + 86 +81
+ 138 + 16
A14CRes (per
AR
-170 -74
-106 -173 -123 -196
mil)
1992
+45 -74
- 7 ' -143
-29 -169
SCIENCE • VOL. 272 • 19 APRIL 1996 393

Fig. 1. Esttmates of turnover time for lev-density and hydro- 600
Iyzabe carbon fractions derived from the observed increase in I4C betvieen 1959 and 1992 (19). (A) Changes in A1"C values 200
obsewed in the atmosphere, compared to the change in A1*C values expected in 1950 1970 iggo steady-state SOM reservoirs 0 40 80 120
Year Turnover time (years) ivith turnover times of 20 or 70 years (19) Double-headed ar- - 0 s s o the ( A ) values i i i (B) A(Ai4C) expected for fast- ; cycling carbon \vith different .g 40
turnover tlmes (19). (C) Turnover - times for iov-density organic 20
matter fractons. assumng that E 10 t 10% of the carbon in the 3 0 0
0 10 20 0 10 ow-density fractions is passive, 20 MAT ("C) MAT ("C)
Uncertalntles in turnover tlme derived from the overall accuracy of the radiocarbon measurement [about *I 2 perm in A(AinC)] are of similar magnitude to uncertainties in the amount of passive carbon. (D) Hydrolyzable dense organic matter fraction turnover times do not show a clear trend with altitude. Error bars show the range of turnover times calculated, assulning 0% passive carbon in this fraction (slower turnover) and assulning the amount of passive organic matter needed to explain archived A'4C values for this fraction (19); MAT, mean annual temlserature.
in the 1950s and show little or no increase in .l14C since 1963. With the use of these criteria, the low-density fraction has the shortest, and the nonhydrolyiable dense residue the longest, average turnover time (Table 1).
To quantify turnover times for SOL'I fractions, we compared the observeii in- crease in I14C between 1959 and 1992 [defined as .l(.l'4C)] with the increase pre- dicted with a time-dependent model (19) (Fig. 1). This approach assumes SOM has remained at steady state over the past 30 years. We believe this is true for Slerra transect sites because land use there has not changed during this time (29) and the car- bon Inventory and distribution of carbon among fractions are similar between ar- ch~ved and 1992 soils.
The same I(.l14C) value may yield two possible turnover times (Fig. 1B). For exam- ple, the Shaver soil (elevation, 178G m) shows an increase in h14C from 1959 to 1992 of +I58 per mil (Table 1). This in- crease could represent an average turnover time of either 5 or 57 years (Fig. 1B). The total amount of carbon stored as lon-den- sity organic matter in the Shaver A horizon 1s 6.5 kg mp2. A turnover time of 5 years implies annual steadv-state inputs and loss- es of carbon of 13GG g ~ n - ~ yearp', a factor of 10 greater than is reasonable given esti- mates of litterfall for this site [-1GG g m-2
S. E. Trumbore, Department of Earth System Science, University of California. Irvine, CA 9271 7-31 00, USA. 0 A. Chadwick, Department of Geography, University of California, Santa Barbara. CA 93106. USA. R. Amundson. Division of Ecosystem Sciences, Univer- sity of California, Berkeley, CA 94720. USA.
'To whom correspondence sho~l ld be addressed
yearp' (9)]. We therefore conclude that the turnover time of the Shaver low-density carbon is 57 years (Fig. 1C). Although no flux data are available for the lowest eleva- tion site (Fallbrook), the incorporation of large anlounts of bomb 14C by 1962 indi- cates fast turnover ( s l G years) of the low- density fraction.
Uncertainties in the turnover times sholrn in Fig. 1, C and D, reflect the degree to which the fractionation scheme fails to separate SOM into homogeneous carbon pools that can be representeii by a single, average turnover time. Pre-bomb .li4C val- ues less than -25 per mil in lory-density and nonhydrolyzable fractions indicate that some portion of the carbon is passive and has turnover times longer than IGG years. We estimate the amount of passive carbon to be 1G ? 1G% of the low-density SOM. on the basis of the abundance of dharcoai (up to 8% by weight or 15% of the loa- density carbon). The effect of attributing an additional LC% to the passive pool decreas- es the turnover times derived for the re- mainlng carbon (1 9) by about IC years. The importance of carbon that turns over much faster than the average turnover time (for example, a component of low-density car- bon cycl~ng on annual time scales) is con- strained with estimates of lltterfall or net primary productivity (21 ) to constitute <8% (lowest elevation) and <3% (other sites) of the low-density SOM. This amount is too small to influence the derivation of turnover time from h(h14C) or the predict- ed response of the large low-density pool to a disturbance.
Average turnover times for low-density carbon (Fig. 1C) increase from 6 to 8 years
4 0 L '~'. , 1 1 .kA.-
0 0 10 2 0 30
Mean annual temperature ("C)
Fig. 2. (A) Turnover times'for fast-cycling fractions of IOL~J-density carbon in the upper 20 cm of soil from the Sierra Nevada transect (ths study), Ha- \va (7). and eastern Amazona (22, 23). The ex- ponental curve fit (ivlth 95% confdence Intervals) IS
(1 51 t 47)exp[-(0 134 i- 0.02)Tl where T IS the temperature In degrees Celslus and the standard devlat~on of the curve f ~ t IS 9. Turn- over times derived for the Hawaii sites are inven- tory-welghted averages of actve (1 year turnover) and slow (variable turnover tine) carbon pools reported In (7). (B) Carbon ~nventory-blielghted turnover times for combined ow-density and hy- drolyzable carbon fractions. An exponential curve fit to these data 1s
(138 t 18)exp[-(0.110 i- 0.09)Tl wlth a standard devlatlon of 8. Fittng an exponen- tial curve to the data implies constant Q,, values over a range of temperatures [here, Q,, equals 3.8 In (A) and 3 0 in (B)].
at 17.8"C mean annual temperature (470 m elevation) to 53 to 71 years at 4°C (290G m elevation). Average turnover times for fast- cycling components of hydrolyzable carbon (2G to 300 years) are lllore uncertain and are not related simply to temperature (Fig. ID). We conclude that temperature is the most i~nportant control of Ion-density car- bon turnover times, whereas the amount and turnover time of hvdrolvzable carbon , ,
may be tied to other soil properties. Changes in carbon inventory along the
elevation transect arise from combined variations in the rates of carbon input and decay. Maximum carbon concentration and storage occur at mid-elevation. Decay rates of the lory-density fraction decreased (and turnover times increased) monotonically with temperature along the Sierra elevation transect, whereas carbon inputs to the soil peak at m~d-elevation (21 ). Thus, increases in the carbon inventory from low to mid- elevation resulted from higher carbon in- puts coupled with slower decomposition,
SCIENCE VOL. 272 19 APRIL 1996
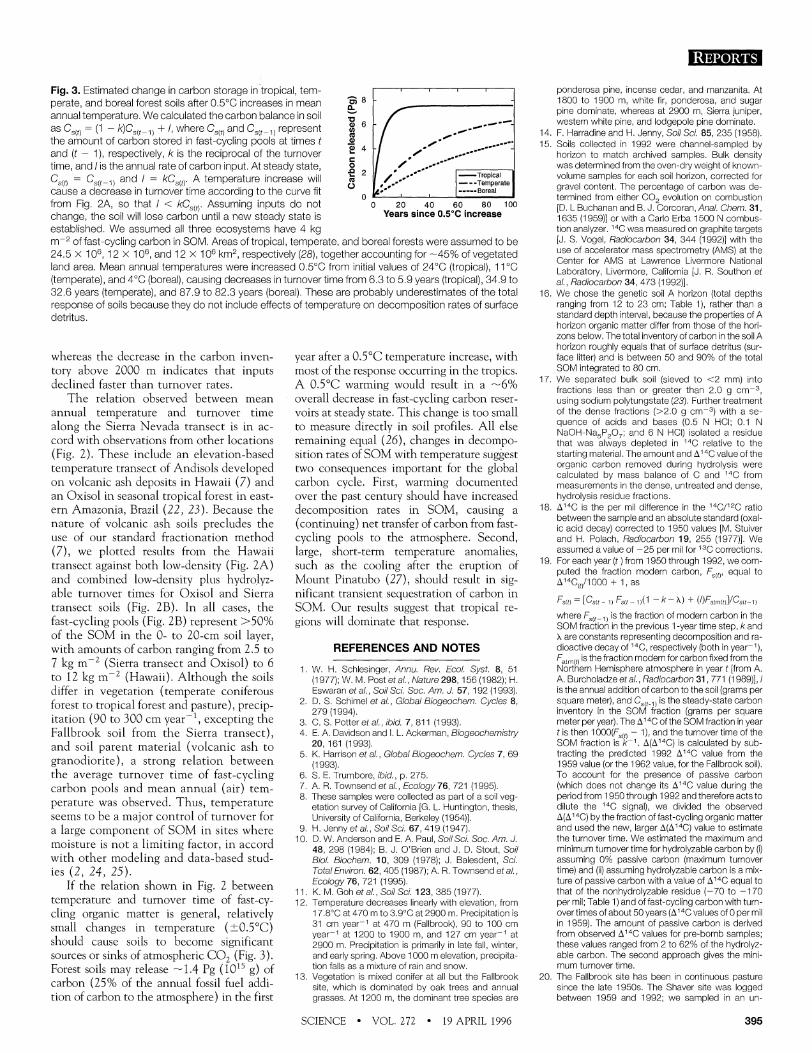
Fig. 3. Estimated change in carbon storage in tropical, tem- perate, and boreal forest soils after 0.5"C increases in mean 2 annual temperature. We calculated the carbon balance in soil as C,,,, = (1 - k)C ,!t+,) + I, where C,!,, and C ,(,_;, represent $ /.--- the amount of carbon stored in fast-cycling pools at times t 3 -...---. and ( t - I ) , respectively, k is the reciprocal of the turnover time, and 1 is the annual rate of carbon input. At steady state, 0
C ,!,; = C,(,-<, and I = kc,(,,. A temperature increase will 2 / --. -Tropical
0 ,-.-- - --Ternparat8 cause a decrease in turnover time according to the curve fit -----Boreal
0 from Fig. 2A, so that I < kc,,,,. Assuming inputs do not o 20 40 60 80 100
change, the soil will lose carbon until a new steady state is Years since 0.5"C increase
established. We assumed all three ecosystems have 4 kg m-' of fast-cycling carbon in SOM. Areas of tropical, temperate, and boreal forests were assumed to be 24.5 x 1 OG, 12 X 1 OG. and 12 x 1 OG km" respectively (28), together accounting for -45% of vegetated land area. Mean annual temperatures were increased 0.5"C from initial values of 24°C (tropical), 11 "C (temperate), and 4°C (boreal), causing decreases in turnover time from 6 .3 to 5 .9 years (tropical), 34.9 to 32.6 years (temperate), and 87.9 to 82.3 years (boreal). These are probably underestimates of the total response of soils because they do not include effects of temperature on decomposition rates of surface detritus.
whereas the decrease in the carbon inven- tory above 2000 m indicates that inputs declined faster than turnover rates.
The relation observed between mean annual temperature and turnover time along the Sierra Nevada transect is in ac- cord with observations frotn other locations (Fig. 2). These include an elevation-based temperature transect of Andisols developed on volcanic ash deposits in Hawaii (7 ) and an Oxisol in seasonal tropical forest in east- ern Amazonia, Brazil (22, 23). Because the nature of volcanic ash soils precludes the use of our standard fractionation method ( 7 ) , we plotted results from the Hawaii transect against both low-density (Fig. 2A) and combined low-density plus hydrolyz- able turnover times for Oxisol and Sierra transect soils (Fig. 2B). In all cases, the fast-cycling pools (Fig. 2B) represent >iO% of the SOM in the 0- to 20-ctn soil layer, with amounts of carbon raneine from 2.5 to " " 7 kg tnp2 (Sierra transect and Oxisol) to 6 to 12 kg m p 2 (Hawaii). Although the soils differ in vegetation (temperate coniferous forest to tropical forest and pasture), precip- itation (90 to 300 cm year-', excepting the Fallbrook soil from the Sierra transect), and soil parent material (volcanic ash to granodiorite), a strong relation between the average turnover time of fast-cycling carbon pools and mean annual (air) tern- perature was observed. Thus, tetnperature seems to be a major control of turnover for a large cotnmnent of SOM in sites where - tnoisture is not a limiting factor, in accord with other modeling and data-based stud- ies ( 2 , 24, 25).
If the relation shown in Fig. 2 between temperature and turnover titne of fast-cy- cling organic matter is general, relatively small changes in temperature (?O.i°C) should cause soils to becotne significant sources or sinks of atmospheric C02 (Fig. 3). Forest soils may release -1.4 Pg ( l 0 l 5 g) of carbon (25% of the annual fossil fuel addi- tion of carbon to the atmosphere) in the first
year after a 0.5"C temperature increase, with most of the response occurring in the tropics. A 0.5"C warming would result in a -6% overall decrease in fast-cvcline carbon reser- , "
voirs at steady state. This change is too small to measure directly in soil profiles. All else remaining equal (26), chatlies in decompo- sition rates of SOM with tetnperature suggest two consequences important for the global carbon cycle. First, wartning documented over the past centurv should have increased decompos'ition rates' in SOM, causing a (continuing) net transfer of carbon frotn fast-
u .
cycling pools to the atmosphere. Second, large, short-term temperature anotnalies, such as the cooling after the eruption of Mount Pinatubo (27), should result in sig- nificant transient sequestration of carbon in SOM. Our results suggest that tropical re- gions will dotninate that response.
REFERENCES AND NOTES
1. W. H. Schles~nger, Annu. Rev. Ecol. Sysr. 8, 51 (1 977): W. M. Poster ai.. Nature 298, 156 (1 982): H. Eswaran et a/. , Soil Sci Soc. Am. J. 57, 192 [ I 993).
2. D. S. Schimel etal., Global Biogeochem. Cycles 8, 279 (1 994).
3. C. S. Potter er a/. , ibid. 7, 81 1 [ I 993). 4. E. A. Dav~dson and I. L. Ackerman. Biogeochemisl'iy
20, 161 (1993). 5. K. Harrson e i a/., Global Biogeochem. Cycies 7. 69
(1 993) 6. S. E. Trumbore, ibid, p. 275. 7. A. R. Townsend et ai., Ecology 76, 721 (1995). 8. These samples were collected as part of a sol veg-
etaton suwey of California [G. L. Huntington, thesis, Unversity of Ca~forn~a. Berkeley (1 954)l.
9. H. Jenny e i a/. , Soil Sci 67. 41 9 (1947). 10. D. W. Anderson and E. A. Paul, SoilSci. Soc. Am. J.
48, 298 (1984); B. J. O'Brien and J. D. Stout, Soil Biol. Biochem. 10, 309 (1978); J. Balesdent, Sci. Totai Environ. 62, 405 (1 987): A. R. Townsend e i a/. , Ecology 76. 721 (1 995).
11 . K. M. Goh e i a/. . Sod Sci. 123. 385 (1 977). 12. Temperature decreases linearly wth elevation, from
17.8"C at 470 m to 3.9"C at 2900 m. Precpitation is 31 cm year-' at 470 m (Fallbrook). 90 to 100 cm year-' at 1200 to 1900 m, and 127 cm year-' at 2900 m. Preciptation is primarily n late fall, winter. and early spring. Above 1000 m elevation. precp~ta- t~on falls as a mlxture of raln and snow.
13. Vegetation is mixed conifer at all but the Fallbrook ste, whch is domnated by oak trees and annual grasses. At 1200 m. the dominant tree species are
ponderosa pine, incense cedar, and manzan~ta. At 1800 to 1900 m. white fir, ponderosa, and sugar pne dominate, whereas at 2900 m, Sierra juniper, western white plne, and lodgepole pine dominate.
14. F. Harradine and H. Jenny, SoiISci. 85. 235 (1958). 15. Soils collected In 1992 were channel-sampled by
horizon to match archived samples. Bulk density was determined from the oven-diy weght of known- volume samples for each soil horizon, corrected for gravel content. The percentage of carbon was de- termined from either CO, evolution on combustion [D. L Buchanan and B. J. Corcoran. Anal. Chem. 31, 1635 (1959)) or with a Carlo Erba 1500 N combus- t~on analyzer. 'C was measured on graph~te targets [J. S. Vogel, Radiocarbon 34, 344 (1992)) with the use of accelerator mass spectrometry (AMS) at the Center for AMS at Lawrence Livermore National Laboratory, Livermore, California [J. R. Southon et a/. . Radiocarbon 34, 473 (1 992)l.
16. We chose the genetic soil A horizon [total depths ranging from 12 to 23 cm: Table I), rather than a standard depth interval, because the properties of A horizon organic matter d~ffer from those of the hori- zons below. The total inventow of carbon In thesoi A horizon roughly equals that of suriace detritus (sur- face litter) and is between 50 and 90% of the total SOM integrated to 80 cm.
17. We separated bulk s o (s~eved to <2 mm) Into fractons less than or greater than 2.0 g cm-7 using sod~um polytungstate (23). Further treatment of the dense fractions (>2.0 g cm-7 with a se- quence of acids and bases (0.5 N HCI; 0.1 N NaOH-Na,P,O,; and 6 N HCI) Isolated a residue that was always depleted in '% relative to the starting material. The amount and A'% value of the organlc carbon removed during hydrolysis were calculated by mass balance of C and '% from measurements n the dense, untreated and dense, hydrolysis res~due fractions.
18 A14C is the per mil difference n the '"CC2C ratio between the sample and an absolute standard (oxa- ic acid decay) corrected to 1950 values [M. Stuiver and H. Polach, Radiocarbon 19, 255 (1977)l. We assumed a value of 2 5 per m ~ l for '3C corrections.
19 For each vear it ) from 1950 throuah 1992, we com- , , , puted the fract~on modern carbon, F,(,,, equal to A1%(,,/l 000 t I, as
Fs,tl LCs(; - 1 1 Fsrt - - k - k ) - (l)Fa-m,t~llCs,t-i,
where F,,,+,, IS the fract~on of modern carbon in the SOM fraction n the previous I -year tme step, k and A are constants representng decompositon and ra- dioactive decay of '%, respectively (both In year '1 , Fa,,, ,, IS the fraction modern for carbon fixed from the ~orthern Hemisphere atmosphere In year i [from A. A. Burcholadze et a/. . Radiocarbon 31 , 771 [ I 989)],1 IS the annual addition of carbon to the soil (grams per square meter), and C,,,.,, is the steady-state carbon inventory in the SOM fraction [grams per square meter per year). The A'" of the SOM fraction in year i IS then 1 OOO(Fs,,, - I ) , and the turnover tme of the SOM fract~on is k- ' . A(A14C) is calculated by sub- tracting the predicted 1992 A14C value from the 1959 value (or the 1962 value. for the Falbrook so~l). To account for the presence of passive carbon (whch does not change ~ t s A'" value durng the period from 1950 through 1992 and therefore acts to dilute the I4C signal), we d~v~ded the observed A(A1^C) by the fraction of fast-cyclng organic matter and used the new, larger A(Ai%) value to estimate the turnover time. We estimated the maximum and minimum turnover time for hydrolyzable carbon by (i) assumlng 0% passlve carbon (max~mum turnover time) and (ii) assuming hydrolyzable carbon is a mix- ture of passive carbon with a value of Aq4C equal to that of the nonhydrolyzabe res~due (-70 to -170 per mil; Table 1) and of fast-cycling carbon with turn- over times of about 50 years (A1^C values of 0 per mil In 1959). The amount of passive carbon IS derived from observed A'% values for pre-bomb samples; these values ranged from 2 to 6256 of the hydroyz- able carbon. The second approach gives the mini- mum turnover trne.
20. The Falbrook s~te has been n contnuous pasture slnce the late 1950s. The Shaver s~te was logged between 1959 and 1992: we sampled In an un-
SCIENCE VOL. 272 19 APRIL 1996

logged stand of trees. 21. Lltterial data, from (9), ndcate that Itterfall inputs of
carbon are between about 50 and 120 g m-' y e a r 1 for coniferous forests of the Slerra transect above 1200 m elevation. We estimated carbon productivity for grasses at the Falbrook slte by assumng that ther values are simllar to those for other grassland soils In Cafornla (between 50 and 100 g m-' y e a r 1 [R. Vaentn eta/. , Ecology 76. 1940 [I 995)].
22 D. C. Nepstad e i a/. , i~laaiure 372, 666 (1 994). 23. S E. Trumbore er a/. , Global Biogeochem. Cycles 9,
51 5 (1 995). 24. W. M Poster a/.. Nature 298, 156 (1 982); D. S. Jen-
klnson, D. E. Adams, A. Wild, /bid. 351,304 (1 991 1: A. R. Townsend eta/.. Clinm. Change 22, 293 (1992).
25. M. Klrschbaum, SoiIBiol. Biochem. 27, 753 (1995). 26. The estimates of carbon change In Fig. 3 Ignore
important factors, such as probable changes In car- bon inputs to the soil by plants and feedbacks be-
tween SOM decomposton and plant productivity, In addition, the climate transects studled in Hawa and the S e r a Nevada Integrate long-term adjustment of ecosystems to average cllmatic conditions, and transient responses may not be predctable from the temperature-turnover relations derlved here How- ever, soil incubations and soil respration measure- ments have shown that on short tme scales, carbon fluxes from soils are strongly dependent on temper- ature, with Q,, values ranglng from 2 to 5 [J. W. Rach and W. H. Schesnger, Tellus 448, 81 (1 992); D. W. Kickghter er a/., J. Geophys Res. 99, 1303 (1 99411 [25), In accord with values, derlved from F I ~ 2, of 3 0 to 3.8. [Q,, sth he rateof a bioogcal process (here, decompositon) at one temperature divded by the rate of the process at a temperature 10°C cooler.]
27. E. G Dutton and J. R. Christy, Geophys. Res. Lett. 19, 2313 (1992): G. W. Basset and Z. Y. Lin. Clinm. Change 25, 179 (1 993).
28. J. Harte, Consider a S,oherica/ Cow (Unversty Sci- ence Books, M I Valley, CA, 1985), p 257.
29 Supported by NASA Mission to Planet Earth tlhrough ~ t s geology program. S E.T. acknowledges addtlon- al support from the Andrew W. Melon Foundaton, 0 .A C. from Jet Propulsion Laboratory-Californa In- sttute of Technology, and R.A. from Caforna Ex- perment Station Hatch funds. We thank L Root for allowing us to resample the Falbrook soil. S. Zheng for analyses. G. Huntington, J. Harden. R. Cicerone, M. Prather, and B. Brasher for dscussons, J Sou- thon for help measuring "% samples, and all of those responsbe for mantaining s o archives at the University of California, Berkeley. Orlglnal field notes and topographic maps for the S~erra Nevada froin 1958 through 1963 were from G. Huntington. Unl- versty of Californa, Davis.
8 November 1995; accepted 4 March 1996
Engineered Interfaces for Adherent Diamond &bond from the intermediate film. We have observed that creation of a
Coatings On Large Thermal-Expansion three-dimensional 13D) therlnallv and
coefficient ~ismatched substrates Rajiv K. Singh, D. R. Gilbert, J. Fitz-Gerald, S. Harkness,
D. G. Lee
Adhesion of thin or thick films on substrates is a critical issue in systems where the thermal-expansion coefficients of the coating and bulk material are significantly different from each other. The large mismatch of the expansion coefficients results in the generation of very high stresses in the coating that may lead to delamination, cracking, or other deleterious effects. A method to increase the adherence of diamond coatings on tungsten- carbide and stainless steel substrates is reported based on a substrate-modification process that creates a three-dimensional thermally and compositionally graded interface. Scratch and indentation tests on diamond-coated steel and tungsten-carbide samples did not exhibit film fracture at the interface and concomitant catastrophic propagation of interfacial cracks.
T h e r e has been a considerable effort in recent years to develop adherent coatings, especially in systems in which there is a large luismatch between the thermal-ex- pansion coefficients (1-6). During heating or cooling, very high stresses are induced in the coating when the thermal-expansion coefficients of the films and the substrate vary significantly from each other. These stresses frequently crack or delaminate the coating from the substrate material. A nun- ber of techniques have been developed to increase adhesion strength so that coatings remain adherent even when subjected to large compressive or tensile stresses. Some of the methods used include roughening of the surface for mechanical interlocking and the use of chemically compatible interlayers having intermediate expansion coefficients (1-4). These methods to enhance adhesion have been successf~~l in some material sys- tems; however, in very large thermal-mis- matched systems, cracking or debonding of the coating can still occur.
Diamond coatinos on substrates like
steel and tungsten-carbide (WC) with co- balt (WC-10% Co) are thermally mis- matched but are expected to have applica- tions in cutting tools and corrosion- and erosion-resistant coatings. Many techniq~~es have been applied to improve adhesion in this case but have met with very limited success ( 1 ) . The main problem for the dep- osition of dialuond thin films on these ma- terials 1s the large thermal stress generated during the deposition process. Besides ther- mal stresses, other complicating problems such as the diffusion of carbon species and the graphitization of diamond species by iron or cobalt can reduce the adhesion strength s~~bstantiallv. -
Several methods to improve the adhe- sion of diamond coatings have been inves- tigated (1-7). One of the most coinmon methods to enhance adhesion is to apply interlayers having intermediate thermal-ex- pansion coefficients. The interlayers are ex- pected to decrease the effect of interfacial stresses and reduce the graphitization and diffusio~~ of carbon s~ecies during deaosi-
, ,
compositionally graded interface bktween diamond and the substrate material leads to improved adhesion of the dialuond film (8). A schematic diagram of the nature of the film in sharp and 3D chemically and ther- lually graded interfaces is shown in Fig. 1. The diamond film was subjected to biaxial compression while the metallic substrate was under tension. Figure 1A shows an idealized representation of the normal stresses across the cross section of the ho- mogeneous coating and freestanding sub- strate at a voint far from the edge. The "
stress distribution in the film is determined by the requirements that the normal forces, and the bending moments, over the total cross section should be zero (9) . Froln the first requirement, stresses of opposite sign must form in the substrate to balance those in the film. Thus. the stress reverses sign at " the interface. Because of the much larger thickness of the substrate, the maenit~~des " of the stresses are much lower in the sub- strate than in the film. The second require-
" - L
tion. However, these methods have been Fig. 1. schematic diagram showing the nature of Depariment of Materials Science and Engineering, ~ n - only partia11~ S U C ~ ~ S S ~ L I ~ chiefly because the stresses present for (A) a planar ~nterface and (B) a versity of Florida, Gainesvil!e, FL 3261 1-2066 USA, residual stresses are still high enough to 3D thermally and compositionally graded interface.
396 SCIENCE VOL. 7 7 2 19 .4PRIL 1996