rapid analysis of drugs and related compounds - bruker · 2016-12-06 · rapid analysis of drugs...
TRANSCRIPT

Rapid Analysis of Drugs and Related Compounds
Anna Codina, Product Portfolio Manager, Pharma Market Bruker UM, London, 17Nov16
December 5, 2016

Pharmaceutical Industry From Drug Discovery to Market
Drug Discovery Drug Development Manufacturing
Process Optimizati
on and Scale Up
Compound Discovery
Target Discovery
Drug Safety, Formulation,
Properties
Application/ Approval
Production Market!
Clinical Trials – Phase I, II and III Phase IV
Ten’
s of
thou
sand
s of c
ompo
unds
I healthy voluntaries II small group of patients III big group of patients
High-throughput, Speed Quality, Control, Compliance

New Solutions
Lead Discovery FBLD
Structure Verification SV
Structure Elucidation SE
Reaction Monitoring RxM
QC
500-700 MHz
SamplePro Tube
SampleJet
QCI (F19)
CMC-q
300-600 MHz
RT or Prodigy
CMC-a / Smart Drive
Sample changer
or
Fusion-SV
Compact/ Impact
400-700 MHz
1.7 mm cryo
CMC-se
Sample changer
Compact / Impact
SmartFormula3D
300 - 600 MHz
RT or Prodigy
InsightMR
Dynamics Center (off line)
300 – 600 MHz
RT or Prodigy
Assure NMR Ascent
Sample changer
FBS TS InsightXpress
Potency by qNMR
qSRC
Drug Discovery Drug Development

Fragment Based Screening
SamplePro Tube
• 500- 700 MHz • QCI probe with F19 • Sample Jet, Te independent racks • CMC-q • New TS parsets & Analysis Tools
Lead Discovery Structure Verification
Structure Elucidation
Reaction Monitoring Quality Control GxP
New

December 5, 2016 6
Screening Libraries
Our libraries had ca. 30% bad samples! • 20% “no compound” no compound in stock solution, or not soluble in buffer • 10% decayed or wrong compound • 50% concentration off by more than +/-30%

December 5, 2016 7
FBS Data Acquisition and Analysis
New

December 5, 2016 8
FBS Data Acquisition and Analysis
New

Lead Discovery FBLD
Structure Verification SV
Structure Elucidation SE
Reaction Monitoring RxM
QC & Impurity profiling QC & IProf
500-700 MHz
SamplePro Tube
SampleJet
QCI (F19)
CMC-q
300-600 MHz
RT or Prodigy
CMC-a / Smart Drive
Sample changer
or
Fusion-SV
Compact/ Impact
400-700 MHz
1.7 mm cryo
CMC-se
Sample changer
Compact / Impact
SmartFormula3D
300 - 600 MHz
RT or Prodigy
InsightMR
Dynamics Center (off line)
300 – 600 MHz
RT or Prodigy
Assure NMR Ascent
Sample changer
FBS TS InsightXpress
Potency by qNMR
qSRC
Drug Discovery Drug Development
December 5, 2016 11
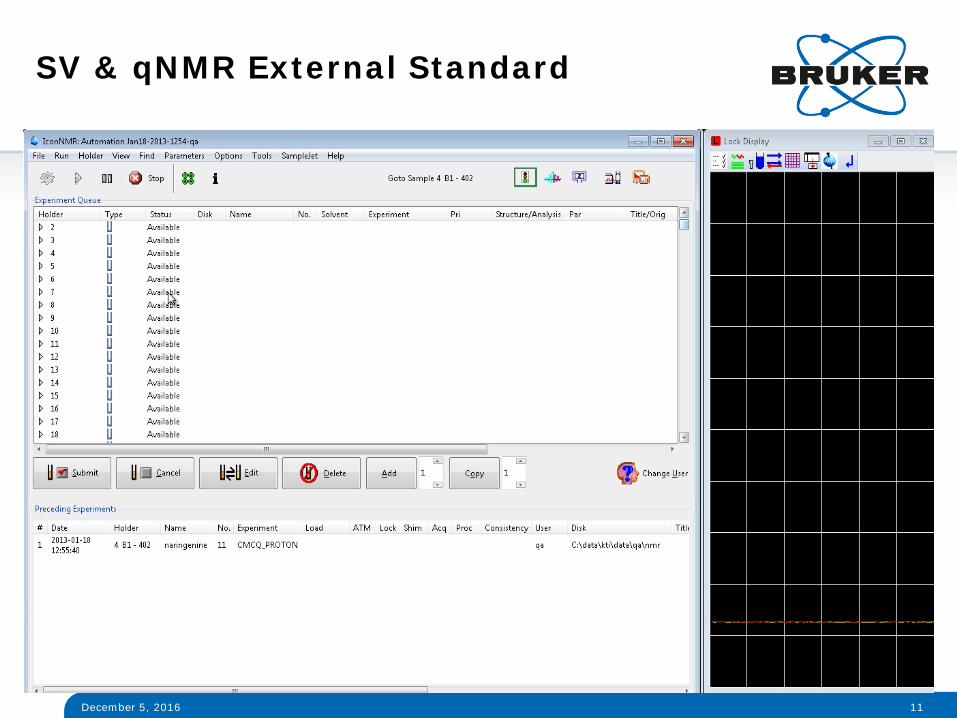
SV & qNMR External Standard

Chemist / Lab Tech
e.g. SmartDriveNMR Requests HSQC
Higher confidence
result
User approaches instrument with question, sample description and restraints
• Instrument decides which experiments to run with which parameters • Automatic data analysis • Yields result with confidence level ( - ) • Decides if- and which other experiments are required to achieve user desired confidence level • If user allotted time permits, system sets up runs follow up experiments
Auto-result
with confidence
level
OK
Automatic decision Auto-result II
OK
Decision Making –> Time Saver

Adding MS to SV = Confidence
Compact MS
Prodigy Probe
Fusion-SV Software
NMR HRAM-MS
Lead Discovery Structure Verification
Structure Elucidation
Reaction Monitoring Quality Control GxP

Structure Elucidation
December 5, 2016
1.7 mm CryoProbe
CMC-se
600 MHz 1.7 mm CryoProbe Resurrecting insensitive experiments Adding Confidence
1,1-adequate 1 mg 23 h Molecular Formula
Codina, A.; Bruker NMR User Meeting, Coventry, U.K., Nov 2010 // Poster and UM talk @ ENC 2011 .

With Lab2Lab, chemists in mid-size to large-size pharma and CRO facilities will always have the ideal spectrometer sitting right there on your lab-bench!
• It can be a 400 MHz PRODIGY system for a structure verification sample or
• It can be 600 MHz DCH CryoProbe for an elucidation sample ON THE SAME BENCH
Novartis’ benchtop 400 MHz system in a chemistry lab
This is how the chemist see’s the NMR
This is the hardware power behind his results
Lab2NMR Sample Management

Lead Discovery FBLD
Structure Verification SV
Structure Elucidation SE
Reaction Monitoring RxM
QC & Impurity profiling QC & IProf
500-700 MHz
SamplePro Tube
SampleJet
QCI (F19)
CMC-q
300-600 MHz
RT or Prodigy
CMC-a / Smart Drive
Sample changer
or
Fusion-SV
Compact/ Impact
400-700 MHz
1.7 mm cryo
CMC-se
Sample changer
Compact / Impact
SmartFormula3D
300 - 600 MHz
RT or Prodigy
InsightMR
Dynamics Center (off line)
300 – 600 MHz
RT or Prodigy
Assure NMR Ascent
Sample changer
FBS TS InsightXpress
Potency by qNMR
qSRC
Drug Discovery Drug Development

InsightMR
Lead Discovery Structure
Verification Structure
Elucidation Reaction
Monitoring Quality Control GxP
InsightMR flow tube InsightMR software
• Online process monitoring in real-time under real conditions
• Process understanding: yield, mechanistic insights and reaction kinetics = > Savings
• Intuitive workflow making NMR an accessible PAT tool

www.bruker.com/InsightMR
InsightMR Accessories New
Lead Discovery Structure Verification
Structure Elucidation
Reaction Monitoring Quality Control GxP
With full package, optional installation

www.bruker.com/InsightMR
InsightMR Successful Stories – Pfizer Collaboration
• Dunn A.L., Codina A., Foley D.A., Zella M.T., Eur. Pharm. Rev., in Press • Foley, D.A, ‘The Advantages of Reaction Monitoring by NMR in the Pharmaceutical Industry’, SelectScience, July 2015 • Foley D.A., Bez, E., Codina A., Colson K.L., Fey M., Krull R, Piroli D., Zell, M., Marquez, B.L., Anal. Chem., 86, 12008 (2014) • Dunn A.L. et . al, MRC, DOI: 10.1002/mrc.4317 • https://www.bruker.com/fileadmin/user_upload/8-PDF-Docs/MagneticResonance/NMR/brochures/T158434_EnhancingReactionMonitoring.pdf
Lead Discovery Structure Verification
Structure Elucidation
Reaction Monitoring Quality Control GxP

20
Flow Behaviour
Hall A. et.al., Catalysis Science & Technology, 2016, DOI: 10.1039/C6CY01754A
Ulrich Hintermair, John Lowe, Andrew Hall
New

Reaction Monitoring by EPR – EMXnano
Making research-grade data accessible to a larger audience
Analyse all EPR species - transition metals, antioxidants and free radicals
Valuable information and insights to biological and chemical reactions
Novel permanent magnet and an efficient new microwave resonator for unmatched sensitivity and stability
Analyse short-lived radicals using ‘spin trapping’
Enables quantitative EPR with the inclusion of Bruker’s patented spin counting module
Flow-through Cell
New

Lead Discovery FBLD
Structure Verification SV
Structure Elucidation SE
Reaction Monitoring RxM
QC
500-700 MHz
SamplePro Tube
SampleJet
QCI (F19)
CMC-q
300-600 MHz
RT or Prodigy
CMC-a / Smart Drive
Sample changer
or
Fusion-SV
Compact/ Impact
400-700 MHz
1.7 mm cryo
CMC-se
Sample changer
Compact / Impact
SmartFormula3D
300 - 600 MHz
RT or Prodigy
InsightMR
Dynamics Center (off line)
300 – 600 MHz
RT or Prodigy
Assure NMR Ascent
Sample changer
FBS TS InsightXpress
Potency by qNMR
qSRC
Drug Discovery Drug Development

Quantification Liquids: Potency Determination
Solids: Quantification of Components

Potency of Drugs Definition
* Webster G.F. and Kumar S., Anal Chem, 86, 11474 (2014)
∑−= mpoundsInactiveCoDrugDrugP )(
Inactive Compounds: • Degradation substances LC-UV • Process impurities LC-UV • Water Karl Fisher • Residual Solvents GC • Inorganic material residue in ignition
Needed before administrating the drug to determine the correct dose based on the amount of active drug in the preparation.
Typically measured by HPLC. Characterised reference standard of the drug itself is needed. Otherwise it is determined by difference:

NMR ‘One-Stop Shop’
potency determination purity assessment relative response factor calculation residual solvent moisture analysis identity testing
‘Potency determination by qNMR has been shown to be a single point replacement for routine development testing which previously involved several experiments and techniques.’*
1 single experiment -> qNMR
* Webster G.F. and Kumar S., Anal Chem, 86, 11474 (2014)
Efficiency, Economy Selectivity

Rapid and Flexible Workflow
Area** IS Area** analyte
Prep. Wt a. [mg] Wt IS [mg] CH Region 1 Region 2 Region 3 Averaged Area a. SD Area a. Potency [%] RSD Potency [%]
1 10.30 5.10 1.03 1.00 0.99 0.98 0.99 0.01 99.112 13.10 5.60 0.88 1.00 0.98 0.97 0.98 0.01 99.193 12.40 17.80 2.93 1.00 0.98 0.82 0.94 0.08 95.42
Average 97.91 1.80
Potency: 98%
New

Quantification Liquids: Potency Determination
Solids: Quantification of Components

Dr. Dirk Stueber, Merck
Physical API form plays crucial role Choose “best” API form for development 80% of API molecules exhibit polymorphism Very wide range of physical and chemical properties Criteria: bioavailability, thermodynamic stability, processability, …
polymorphs
solvates salts
cocrystals
amorphous
Techniques must be available to monitor and quantify physical API forms in solid samples
In Drug Development
Lead Discovery Structure Verification
Structure Elucidation
Reaction Monitoring Quality Control GxP

Dr. Dirk Stueber, Merck
Common techniques for physical characterization: X-ray powder diffraction (other X-ray techniques) Optical + vibrational spectroscopy (Raman, IR, NIR, …) Thermometric methods like Differential Scanning Calorimetry (DSC) and
Thermogravimetry (TG) Solid State NMR (state of the art)
General issues: High LOD, not accurate enough, intricate calibration necessary, not
enough specificity, time consuming
New Approach: Relaxation TD-NMR data to be used for API form identification and
quantification
API form ID and Quantification

Dr. Dirk Stueber, Merck
qSRC
Lead Discovery Structure Verification
Structure Elucidation
Reaction Monitoring Quality Control GxP
The minispec Mq20
Fit/TD data c1 = 0.0877, c2 = 0.912
New

Dr. Dirk Stueber, Merck
Excellent correlation btw prepared and predicted blend compositions Slopes and intercepts close to theoretical values, high R2 and low rms
Prepared m% Ibu
qSRC – 4 scans m% Ibu / rms
qSRC – 32 scans m% Ibu / rms
50.2 50.6 / 0.0082 49.8 / 0.0022
39.9 40.3 / 0.0081 40.9 / 0.0037
30.1 30.8 / 0.0097 31.2 / 0.0030
20.1 20.2 / 0.0116 21.0 / 0.0045
9.9 9.3 / 0.0135 9.5 / 0.0042
5.0 4.6 / 0.0120 4.7 / 0.0048
No increase in accuracy of qSRC for data with higher SNR
qSRC Results System 1
New

Summary
Status InsightMR Available now
InsightXpress Demos @ Uni. of Edinburgh // Coventry 1Q 17
Potency Determination β -> Release TS3.5.pl7
Quantification of solids Demos @ Billerica, US and Fallanden, CH
Drug discovery (FBS) β -> Release RS3.5.pl7
Tools to increase productivity and speed

Acknowledgments
Potency by NMR
Quant. Solid Mixtures
Francesca Benevelli Till Kuehn Fabrice Moriaud Martin Wyser Jochen Klages Christine Bolliger Markus Lang Oliver Horlacher Patrick Amsler
Thomas Williamson Kevin O’Sullivan Ian Sherlock Mark Zell Ruth Boetzel Steve Coombes
Stefan Jehle Peter Neidig Jochem Struppe
Dirk Stueber Thomas Williamson
In-situ Fast RxM
Prof. G. Lloyd-Jones Ted King Ruth Dooley Ariana Jones Dusan Uhrin
Matteo Pennestri Mark Garvey Peter Neidig Martin Hofmann Ulrich Braumann
InsightMR David Foley Mark Zell
Ulrich Hintermair Andrew Hall John Lowe
FBS
Alavar Gossert, Wolfgang Jahnke, Marcel Blommers, Cesar Fernandez Paul Erbel Daniel Wyss Hugh Eaton Bettina Elshorst Markus Schade Stefan Jehle Pavel Kessler Fabrice Moriaud, Matteo Penestri Till Khuehn

INTERNAL USE ONLY
Innovation with Integrity
Copyright © 2016 Bruker Corporation. All rights reserved. www.bruker.com
‘Partnering with scientists to shorten time-to-market with confidence, by gaining qualitative and quantitative insights into molecular structure and dynamics.’