randd.defra.gov.ukrandd.defra.gov.uk/document.aspx?document=11986_final... · web viewin 14 years,...
TRANSCRIPT
FINAL REPORT FOR DEFRA PROJECT FA0115
DETERMINATION OF NITROGEN FACTORS FOR PANGASIUS AND ALASKA POLLACK
Mark Woolfe – RSC-AMC Nitrogen Factors Sub-Committee, Michael Thompson - Birkbeck University of London, Steve Lamming, Rob Olivant and Keith Flint - Young’s Seafood, Grimsby,Charles Boardman - Seachill, Doncaster, Chris Hunt - West Yorkshire Analytical Services, Morley, Leeds, Joanna Topping - LGC, Teddington.
1.0 EXECUTIVE SUMMARY
Labelling rules require that for meat products, the species of meat used should be declared. For fish products, there is still the option to declare the species of fish or use the generic description “fish”. Where ingredients are highlighted in the name of the food, the amount of that ingredient must be declared as a percentage of the final product (QUID- quantitative ingredient declaration). Although the amount of an ingredient is calculated on a recipe basis, enforcement authorities usually check the declaration by analysis of the finished product. The analysis determines the nitrogen content (mainly on a fat free basis) of a meat or fish ingredient and converts this to a meat or fish content using a previously determined nitrogen factor. Manufacturers of fish products usually check the specification of their raw materials, and nitrogen factors are used to determine if the fish raw material contains excess added water. In this project the nitrogen factors for two new important species of fish for the UK market were determined.Pangasius (Pangasius hypophthalmus) is a catfish farmed in the brackish waters of the Mekong Delta in Vietnam. It is imported into the UK under the commercial names Pangasius, Basa, Panga or river cobbler. Another species Pangasianodon bocourti (commercial name - Royal basa) is not marketed in the UK. In 14 years, Vietnam’s aquaculture of Pangasius has risen from 40,000 tonnes of fillets in 1997 to 1.14 million tonnes of fillets in 2010. Around 40% of this production is imported into the European Union. Because of its low price, there have been several prosecutions of fish and chip shops substituting Pangasius for cod. All the Pangasius fish are killed, filleted and packed in Vietnam, and there has been some evidence that some of the product exported to the EU has been soaked in water retaining agents (polyphosphates and citrates), but not declared as such. Therefore, an accepted nitrogen factor would assist in ensuring a level playing field in the market and that consumers are buying correctly labelled or described fish. Alaska pollack has one of the largest catches on a global level (2.83 million tonnes in 2010), and is being increasingly used by European manufacturers as the raw material for fish products, replacing scarcer and more expensive white fish species. It is caught and prepared by Pacific Rim countries, especially Russia and the USA. Nearly 60% of the imported frozen fillets (usually in the form of 10kg fish blocks) are prepared in China where it is more difficult to inspect and control manufacturing practices. Mince blocks are prepared from recovered flesh from the frames after filleting, and are used principally to prepare value-added coated fish products. Soluble nitrogen is lost during the preparation of these mince blocks, and their nitrogen content is lower than fillet blocks. Hence a nitrogen factor is very important in determining if good manufacturing practice has been used.
1
Analytical Division, Analytical Methods CommitteeNitrogen Factors Sub-Committee
The experimental plan involved the preparation of a total of 375 samples from 75 samples of each type of fish achieved in two sessions, one in March and the other in September 2012.Whole Pangasius fish were obtained directly from two main aquaculture centres in Vietnam and fillets prepared without using water. Commercial Pangasius fillets were obtained from processors in Vietnam known to use good manufacturing practices. Whole Alaska pollack were obtained from the main fishing grounds in the Russian and US sectors of the Bering Sea, and filleted without using any water. Frozen Alaska pollack fillet and mince blocks, were obtained from fish caught in both sectors of the Bering Sea during the two main seasons (March (A) and September (B)), and processed in factories or ships known to use good manufacturing practices.All the samples were analysed for nitrogen content, moisture, ash and fat according to established British Standards Institute methods (or their equivalents) and the results analysed statistically. All the laboratories used the rapid Dumas combustion method for the determination of nitrogen content. This method gives slightly higher results (a factor of 1.014) than the Kjeldahl digestion method. Because of problems in sourcing material, it was not possible to obtain an equal distribution of samples of Pangasius and Alaska pollack that covered all the variables of season and origin. However, sufficient samples were obtained to look at trends and show that where significant differences were found, these were not of practical significance in the overall mean and uncertainty.The recommended nitrogen factor for commercial Pangasius fillets is 2.7 (Kjeldahl 2.65), for Alaska pollack fillet block 2.7 (Kjeldahl 2.65), and Alaska pollack mince block 2.5 (Kjeldahl 2.45). The difference between the average nitrogen content for whole Pangasius and whole Alaska pollack and the commercial fillet or fillet block was only 5%, indicating that good manufacturing practice had been used in their preparation, and water uptake had been kept to a minimum. For Alaska pollack, the difference between whole fish and the mince block was 11%, which fits with the known loss of soluble protein during mince recovery. The nitrogen factors determined in this project compare favourably with a German study of organic and conventionally farmed Pangasius fillets. The values also compare favourably with historic data provided by Young’s Seafood. Although double frozen Alaska pollack fillet blocks were not analysed in this study, historic data over 10 years shows that the nitrogen factor of 2.70 for the Alaska pollack fillet block is applicable to both single and double frozen fillet blocks.
2.0 OBJECTIVES OF PROJECT
The main objective of this project is to determine recommended nitrogen factors for two species of fish – Pangasius (Pangasius hypophthalmus) and Alaska pollack (Theragra chalcogramma (Pallas)).
The project commenced in February 2102, and its completion (drafting of the report) was delayed by 4 months, due to a delay in receiving some information about the samples. The milestones are given below:
Target dateNo. of
monthsfrom start
date
Description of milestone Status)
01/02/ 2012 0.25 Commissioning project Completed
15/02/ 2012 1.0 Finalising 1st tranch of samples Completed
15/02/ 2012 1.0 Ordering fish samples Completed
06/03/ 2012 1.5Preparation and distribution of 1st tranch samples Completed
2

31/03/ 2012 2.0 Analysis of samples Completed
01/05/ 2012 3.0 Collation of results 1st interim report Completed
15/10/2012 10.5 Preparation and distribution of 2nd tranch samples
Completed
01/01/2013 12.0 Analysis of samples Completed
01/01/2013 12.0 Collation of results, 2nd interim report Completed
01/02/2013 13.0 Collation of all data Completed
15/02/2013 13.5 Statistical analysisCompleted but delayed
31/03/2013 15.0 Final report to Defra Completed but delayed
3.0 INTRODUCTION
Labelling rules require that for meat products, the species of meat used should be declared. For fish products there is still the option to declare the species of fish or use the generic description “fish”. Where ingredients are highlighted in the name of the food, the amount of that ingredient must be declared as a percentage of the final product (QUID- quantitative ingredient declaration). Although the amount of an ingredient is calculated on a recipe basis, enforcement authorities usually check the declaration by analysis of the finished product. The analysis determines the nitrogen content (mainly on a fat free basis) of a meat or fish ingredient, and converts this to a meat or fish content using a previously determined nitrogen factor. Manufacturers of fish products usually check the specification of their raw materials, and nitrogen factors are used to determine if the fish raw material contains excess added water. The use of nitrogen factors to calculate the fish content of coated fish products has also been accepted at an international level as detailed in Codex Alimentarius(1). A considerable amount of research already has been undertaken to determine robust nitrogen factors for the common meat and poultry species, and some fish species. In this project the nitrogen factors for two new important species of fish for the UK market were determined.
3.1 Pangasius (Pangasius hypophthalmus) Production
The data in Table 1 shows that Vietnam has become, in a very short space of time, the world’s third largest aquaculture producer (2.7 million tonnes) after China (36.7 million tonnes) and India (4.6 million tonnes). It is the fourth largest fish exporter after China, Norway, and Thailand. As shown in Table 2, around half of Vietnam’s aquaculture production is Pangasius, a catfish farmed in the brackish waters of the Mekong Delta. There has been a dramatic rise in production and export of fillets of this fish over the past 15 years, and the EU takes around 40% of this production. Pangasius hypophthalmus is imported into the UK under the commercial names Pangasius, Basa, Panga or river cobbler(2). Another species Pangasianodon bocourti (commercial name - Royal basa) is not marketed in the UK. The production cycle of the fish is shown below in Figure 1. Virtually all the farmed Pangasius that are exported are raised in ponds, and cage production is used only on a small scale for domestic production.
Table 1. Vietnam’s Aquaculture Production 2001-10 in Million Tonnes and Value in Billion US Dollars
2001 2002 2003 2004 2005 2006 2007 2008 2009 2010
3
0.59 0.70 0.94 1.20 1.44 1.66 2.09 2.46 2.56 2.67
$1.35 $1.60 $1.97 $2.44 $2.93 $3.32 $4.03 $4.61 $4.80 $5.15FAO Yearbook Fisheries and Aquaculture Statistics 2010 – FAO Rome 2012
Table 2. Vietnamese Pangasius Production 2001- 10 in Million Tonnes of Fillets, and Value in Billion US dollars
2001 2002 2003 2004 2005 2006 2007 2008 2009 2010
0.114 0.135 0.163 0.255 0.376 0.520 0.850 1.250 1.050 1.140
$0.17 $0.20 $0.24 $0.38 $0.56 $0.78 $1.27 $1.87 $1.57 $1.71
FAO Yearbook Fisheries and Aquaculture Statistics 2010 – FAO Rome 2012
Figure 1 The Aquaculture Production Cycle of Pangasius hypophthalmus
3.2 Alaska Pollack (Theragra chalcogramma (Pallas)) Production
Alaska pollack is sold in the UK under the commercial names Pacific pollack, Pacific pollock, and Atlantic pollock(2). On a global level, Alaska pollack is the second highest caught species after anchoveta. Russia, USA, Korea and Japan are the major fishing nations catching and preparing this (headed and gutted) fish. Russia and the US also have factory vessels producing single frozen fillet and mince blocks. Frozen de-headed and gutted fish are sent to China for filleting as well as double frozen block production. Given the decline and cost of gadoid species (cod, haddock, whiting, and hake) production, Alaska pollack serves as a major raw material for coated fish products. It is imported mainly in the form of frozen blocks of both filleted fish and mince. Table 3 shows that the global catch of Alaska pollack in 2010 was three times that of Atlantic cod. In 2007, the catch of
4

Alaska pollack reached a peak of nearly 3 million tonnes, but has failed to exceed that since, probably because of quota management. Alaska pollack has increasingly become the raw material of choice for white fish products because of its lower price.
Table 3 Global Fisheries Catch of Cod and Alaska Pollack 2006-2010 in Million Tonnes
Fish 2006 2007 2008 2009 2010
Alaska Pollack 2.86 2.91 2.65 2.50 2.83
Atlantic Cod 0.83 0.78 0.77 0.86 0.95FAO Yearbook Fisheries and Aquaculture Statistics 2010 – FAO Rome 2012
4.0 SAMPLE PREPARATION
The project detail was agreed in January 2012. The experimental plan proposed a total of 375 samples consisting of 75 samples of the following categories: whole Pangasius, commercial Pangasius fillets, Alaska pollack fillet block, Alaska pollack mince block.
Whole Pangasius fish were obtained directly from Vietnam. Commercial Pangasius fillets were obtained from processors in Vietnam that had been inspected and approved for good manufacturing practices.
Whole Alaska pollack were obtained from the main fishing grounds in the Russian and US sectors of the Bering Sea. The frozen Alaska pollack fillet and mince blocks used had been prepared from fish caught in both sectors of the Bering Sea and processed in a factory approved and inspected for good manufacturing practices. Where processing is on factory ships, approval is by self-assessment, but checks are made on all consignments to ensure they are within specification. Samples were prepared in two sessions, one in March and the other in Sept. 2012. Table 3 gives the number of samples prepared at each session.
Table 3 Number of Samples Prepared in March and September 2012
Sample No. prepared in March 2012 No. prepared in Sept. 2012
Whole Pangasius 40 35
Commercial Pangasius fillets 51 24
Whole A. Pollack ----- 75
A. pollack fillet block 21 54
A. pollack mince block 12 63
4.1 Pangasius Samples
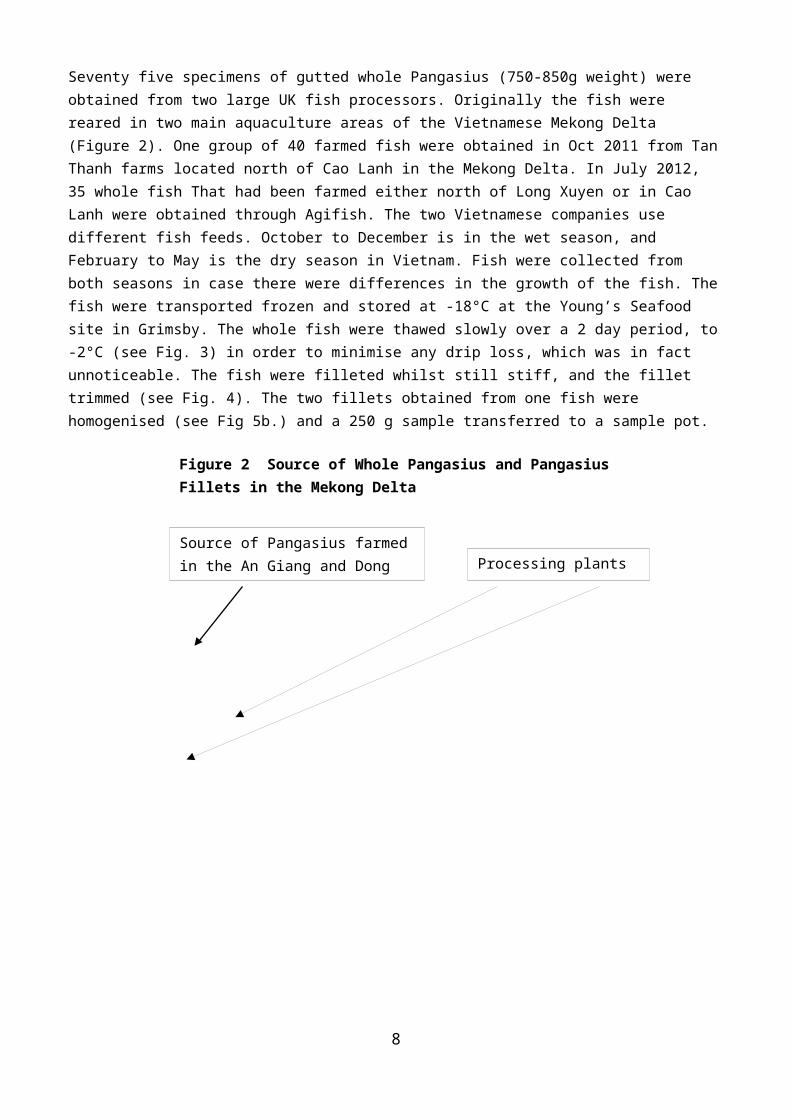
Seventy five specimens of gutted whole Pangasius (750-850g weight) were obtained from two large UK fish processors. Originally the fish were reared in two main aquaculture areas of the Vietnamese Mekong Delta (Figure 2). One group of 40 farmed fish were obtained in Oct 2011 from Tan Thanh
5

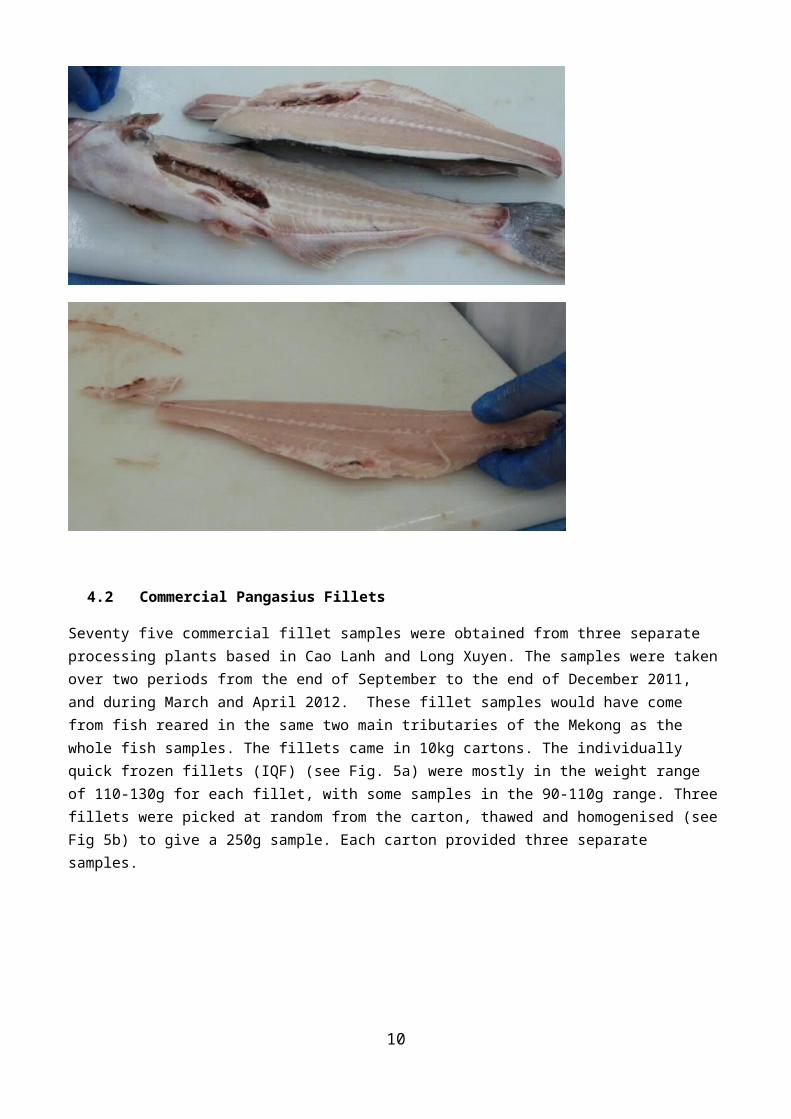
farms located north of Cao Lanh in the Mekong Delta. In July 2012, 35 whole fish That had been farmed either north of Long Xuyen or in Cao Lanh were obtained through Agifish. The two Vietnamese companies use different fish feeds. October to December is in the wet season, and February to May is the dry season in Vietnam. Fish were collected from both seasons in case there were differences in the growth of the fish. The fish were transported frozen and stored at -18°C at the Young’s Seafood site in Grimsby. The whole fish were thawed slowly over a 2 day period, to -2°C (see Fig. 3) in order to minimise any drip loss, which was in fact unnoticeable. The fish were filleted whilst still stiff, and the fillet trimmed (see Fig. 4). The two fillets obtained from one fish were homogenised (see Fig 5b.) and a 250 g sample transferred to a sample pot.
6
Figure 2 Source of Whole Pangasius and Pangasius Fillets in the Mekong Delta
SOUTH CHINA SEA
Source of Pangasius farmed in the An Giang and Dong Thap regions Processing plants

Figure 4 Preparation of Pangasius Fillet From Whole, Gutted Fish
4.2 Commercial Pangasius Fillets
Seventy five commercial fillet samples were obtained from three separate processing plants based in Cao Lanh and Long Xuyen. The samples were taken over two periods from the end of September to the end of December 2011, and during March and April 2012. These fillet samples would have come from fish reared in the same two main tributaries of the Mekong as the whole fish samples. The fillets
7
Figure 3 Example of Time/Temperature Curve of Thawing Pangasius Samples
came in 10kg cartons. The individually quick frozen fillets (IQF) (see Fig. 5a) were mostly in the weight range of 110-130g for each fillet, with some samples in the 90-110g range. Three fillets were picked at random from the carton, thawed and homogenised (see Fig 5b) to give a 250g sample. Each carton provided three separate samples.
IQF Fillets b. Homogenisation of Samples
4.3 Alaska Pollack Samples
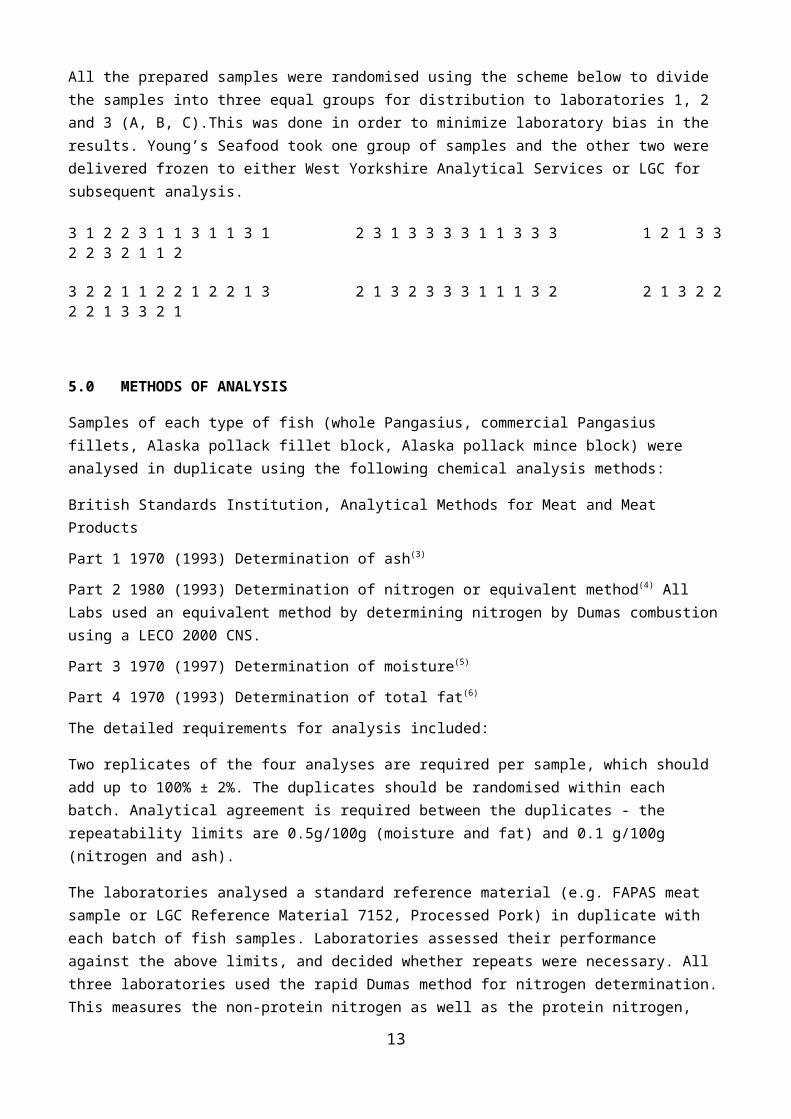
Whole Alaska pollack fish were sourced from both the Russian sector (FAO 61) and the US sector (FAO 67) of the Bering Sea, thawed carefully and whilst still frozen, filleted and the fillets trimmed. Both fillets from one fish were homogenised to give a 250g sample.
Figure 7 Whole Alaska pollack – headed and gutted
8
Figure 5a. IQF Commercial Pangasius Fillets and 5b. Homogenisation of Samples

4.4 Alaska Pollack Blocks
The 7.5kg blocks of Alaska pollack fillets and 7.5kg mince blocks were obtained from both US and Russian processor ships in the A (around March) and B season (around September). It was not possible to obtain equal numbers of A and B season fish and those from the A season predominated. Only single frozen fillet blocks were obtained and no double frozen blocks were used in this study. A section of frozen block was cut by a band saw to give a 240g piece(see Fig. 9) which then was thawed, homogenised, and put into sample pots.
4.5 Sample Distribution
All the prepared samples were randomised using the scheme below to divide the samples into three equal groups for distribution to laboratories 1, 2 and 3 (A, B, C).This was done in order to minimize laboratory bias in the results. Young’s Seafood took one group of samples and the other two were delivered frozen to either West Yorkshire Analytical Services or LGC for subsequent analysis.
9
Figure 8 Trimmed Alaska pollack fillet
Figure 9 Alaska Pollack Fillet and Mince Blocks
3 1 2 2 3 1 1 3 1 1 3 1 2 3 1 3 3 3 3 1 1 3 3 3 1 2 1 3 3 2 2 3 2 1 1 2
3 2 2 1 1 2 2 1 2 2 1 3 2 1 3 2 3 3 3 1 1 1 3 2 2 1 3 2 2 2 2 1 3 3 2 1
5.0 METHODS OF ANALYSIS
Samples of each type of fish (whole Pangasius, commercial Pangasius fillets, Alaska pollack fillet block, Alaska pollack mince block) were analysed in duplicate using the following chemical analysis methods:
British Standards Institution, Analytical Methods for Meat and Meat Products
Part 1 1970 (1993) Determination of ash(3)
Part 2 1980 (1993) Determination of nitrogen or equivalent method(4) All Labs used an equivalent method by determining nitrogen by Dumas combustion using a LECO 2000 CNS.
Part 3 1970 (1997) Determination of moisture(5)
Part 4 1970 (1993) Determination of total fat(6)
The detailed requirements for analysis included:
Two replicates of the four analyses are required per sample, which should add up to 100% ± 2%. The duplicates should be randomised within each batch. Analytical agreement is required between the duplicates - the repeatability limits are 0.5g/100g (moisture and fat) and 0.1 g/100g (nitrogen and ash).
The laboratories analysed a standard reference material (e.g. FAPAS meat sample or LGC Reference Material 7152, Processed Pork) in duplicate with each batch of fish samples. Laboratories assessed their performance against the above limits, and decided whether repeats were necessary. All three laboratories used the rapid Dumas method for nitrogen determination. This measures the non-protein nitrogen as well as the protein nitrogen, and hence gives higher results than the Kjeldahl method(7). The difference is small, and Dumas is higher by a factor of 1.014, which is more important for fish than meat. Therefore it is usual to quote the nitrogen result for both methods of analysis as Kjeldahl is still widely used in laboratories worldwide.
6.0 RESULTS
Annex 1 gives a summary of the all analytical results obtained from the 375 samples of 75 whole Pangasius, 75 commercial Pangasius fillets, 75 whole Alaska pollack, 75 Alaska pollack fillet blocks, and 75 Alaska mince blocks.
6.1 Whole Pangasius
Table 4 shows the overall chemical results of the 75 samples. The average nitrogen content is 2.84g/100g, and the average fat content is 2.91g/100g. The chemical results of the 3 labs were compared, and no significant differences were found any of the analyses. In terms of the nitrogen and fat content, there was a significant difference between the Pangasius fish supplied from the Tan Thanh farm (north of Cao Lanh) and those supplied by Agifish, from both the An Giang and Dong Thap regions, presumably because of difference feeding regimes. The results were combined to give an overall mean.
10
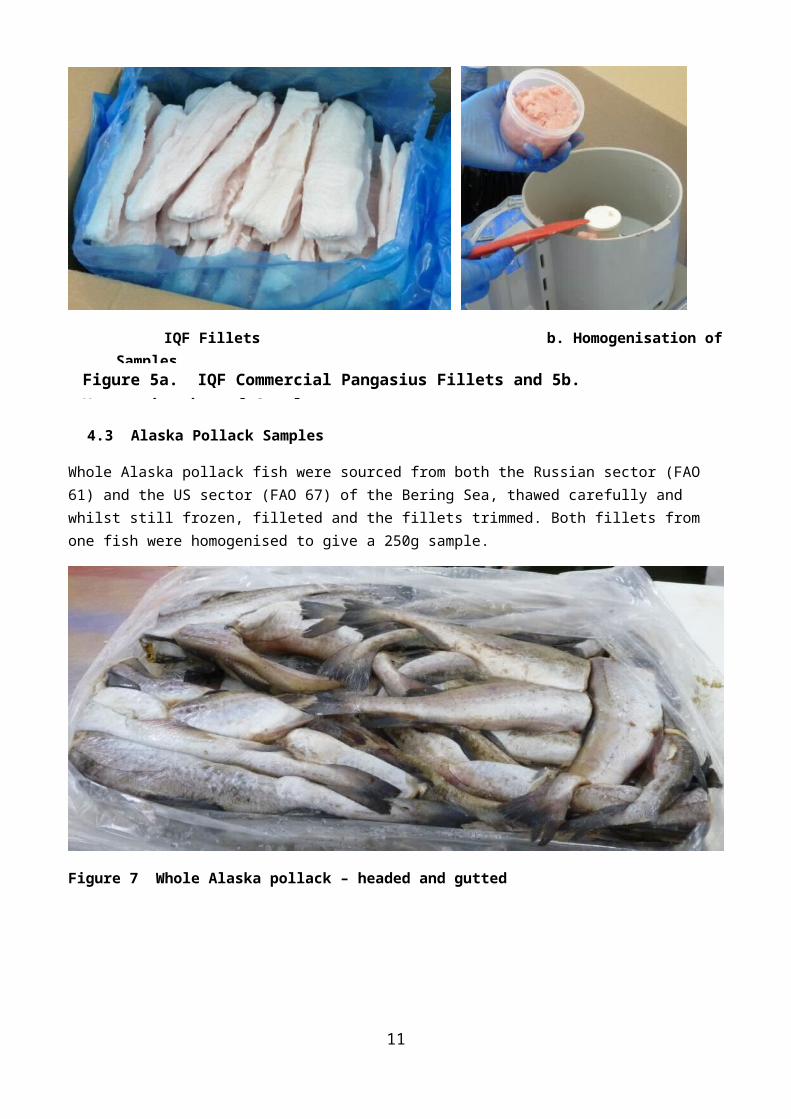
Table 4 Summary of Chemical Analyses for Whole Pangasius
Analyte No Mean% SD SEM
Nitrogen % 75 2.84 0.16 0.019
Fat % 75 2.91 1.09 0.13
Moisture % 75 78.7 1.21 0.14
Ash % 75 1.09 0.11 0.013
Table 5 Two Way Anova Analysis of Means from the 3 Labs and Origin of the Fish
N% Fat% Moisture% Ash%
Lab
A 2.85 2.93 78.3 1.07
B 2.82 2.96 78.8 1.08
C 2.86 2.76 79.0 1.12
Farm * *
Tan Thanh 2.76 3.15 78.51 1.065
Others 2.89 2.61 78.90 1.113
* = differences significant at 95% confidence.
6.2 Commercial Pangasius Fillets
The chemical analyses of the 75 samples gave an average nitrogen content of 2.69 g/100g, and fat content of 1.23g/100g (Table 6). The commercially prepared samples had a significantly lower fat content than the fillets prepared from whole fish by hand because of differences in trimming the fillets.
Table 6 Summary of Chemical Analyses for Pangasius Fillets
Variable No Mean% SD SE Mean
Nitrogen % 75 2.69 0.21 0.024
Fat % 75 1.23 0.46 0.052
Moisture % 75 81.4 1.28 0.15
Ash % 75 0.89 0.10 0.012
Table 7 One Way Anova Analysis of Results from 3 Labs, Origin and Season
11

N% Fat% Moisture% Ash%
Lab *
A 2.60 1.28 81.6 0.86
B 2.74 1.14 81.2 0.90
C 2.75 1.28 81.5 0.91
Season * *
D 2.65 1.20 81.7 0.89
W 2.76 1.29 80.9 0.88
Fillet plant * *
Agifish 2.57 1.15 82.4 0.91
DL147 2.76 1.28 80.8 0.89
DL355 2.70 1.25 81.4 0.84
* = difference(s) significant at 95% confidence.
A comparison was made between:
the results of the 3 laboratories, fillets from fish harvested in the wet and dry season, between the fish processed by the Agifish filleting plant, and those from the other two filleting
plants (DL 147 and 355).
All showed significant differences in the nitrogen content. There also were significant differences in moisture content with season and origin (between Agifish and DL147). All the results were combined to give an average figure for each parameter that was measured.
6.3 Whole Alaska Pollack
The chemical analyses of the 75 whole Alaska pollack samples gave an average nitrogen content of 2.81g/100g, and a fat content of less than 1% (Table 8). Comparison of the results from the 3 labs showed a significant difference in all four chemical analyses, but no difference in season except for ash (Table 9).
Table 8 Summary of Chemical Analyses of Whole Alaska Pollack
Variable No Mean St. Dev SE Mean
Nitrogen % 75 2.81 0.20 0.023
Fat % 75 0.96 0.32 0.0363
Moisture % 75 81. 6 0.90 0.10
Ash % 75 1.22 0.05 0.0062
Table 9 Two Way Anova Analysis of Results from 3 Labs and Season
12
N % Fat % Moisture % Ash %
Season *
A 2.82 0.94 81.5 1.20
B 2.83 0.87 81.2 1.26
Lab * * * *
A 3.00 0.74 80.6 1.21
B 2.73 0.70 81.5 1.23
C 2.75 1.26 82.0 1.26
* = Difference(s) significant at 95% confidence
6.4 Alaska Pollack Fillet Block
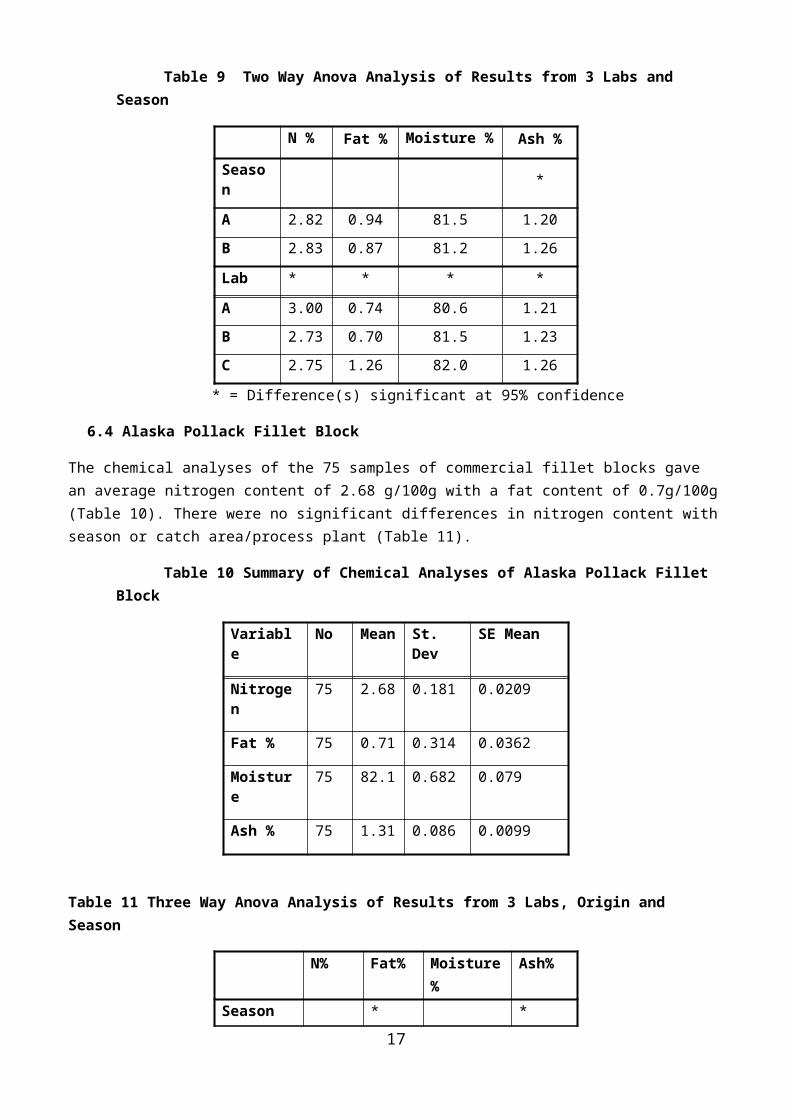
The chemical analyses of the 75 samples of commercial fillet blocks gave an average nitrogen content of 2.68 g/100g with a fat content of 0.7g/100g (Table 10). There were no significant differences in nitrogen content with season or catch area/process plant (Table 11).
Table 10 Summary of Chemical Analyses of Alaska Pollack Fillet Block
Variable No Mean St. Dev SE Mean
Nitrogen 75 2.68 0.181 0.0209
Fat % 75 0.71 0.314 0.0362
Moisture 75 82.1 0.682 0.079
Ash % 75 1.31 0.086 0.0099
Table 11 Three Way Anova Analysis of Results from 3 Labs, Origin and Season
N% Fat% Moisture% Ash%Season * *A 2.69 0.76 82.1 1.30B 2.65 0.62 82.1 1.34Lab * *A 2.71 0.46 81.9 1.27B 2.62 0.58 82.1 1.34C 2.67 1.03 82.3 1.35Catch area * *
FAO61 2.64 0.75 82.2 1.30FAO67 2.70 0.63 82.0 1.34
* = Difference(s) significant at 95% confidence.
6.5 Alaska Pollack Mince Block
The overall average nitrogen content of mince blocks was 2.51 g/100g with a fat content of 0.7g/100g
(Table 12). As all the mince blocks from the Russian sector ( FAO61) were A season, statistical13

analyses were carried out on two subsets of the total data one using the means of analyses for all
Table 12 Summary of Chemical Analyses for Alaska Pollack Mince Block
Variable No Mean St. Dev SE Mean
Nitrogen 75 2.51 0.179 0.021
Fat % 75 0.70 0.224 0.026
Moisture% 75 83.1 0.748 0.086
Ash % 75 1.47 0.100 0.012
Table 13 Two Way Anova of Means of Catch Area FAO67 Mince Block with Labs and Season
N% Fat% Moisture% Ash%
Seasons *
A 2.48 0.68 83.2 1.49
B 2.39 0.60 83.5 1.53
Labs * *
A 2.44 0.50 83.1 1.46
B 2.42 0.56 83.3 1.50
C 2.46 0.85 83.6 1.57
* = difference(s) significant at 95% confidence.
Table 14 Two Way Anova of Means of Season A with Catch Area and Lab.
N% Fat% Moisture% Ash%
Catch area * * *
FAO61 2.61 0.79 82.6 1.39
FAO67 2.49 0.68 83.2 1.49
Labs * *
A 2.61 0.63 82.63 1.41
B 2.50 0.62 82.82 1.42
C 2.54 0.97 83.25 1.49
* = difference(s) significant at 95% confidence.
samples from catch area FAO67 and the means of all season A samples. For mince blocks caught and produced in the US sector of the Bering Sea, there was a significant difference in nitrogen content between seasons but not between labs. Examining mince blocks from fish caught and processed in the A season, there was a significant difference between catch areas/processors in the US and Russian sector.
7.0 CONCLUSIONS
14

It was not possible to obtain an equal distribution of samples covering all the variables of season and origin for Pangasius and Alaska pollack. However, sufficient samples were obtained to look at trends in the overall mean and uncertainty and show that where significant differences were found, these were not of practical significance. A summary of the mean values of each parameter measured are shown in Table 15 for all 5 types of fish. A comparison of the 3 laboratories’ results can be found in Annex 2. Table 16 gives the recommended nitrogen factors for all the types of fish samples for both the Dumas and Kjeldahl methods. These values have been rounded up or down the values to nearest 0.05. The values take into account the low fat contents of the fish, with the standard uncertainty (2xSEM) for means of duplicate analyses. Whole Pangasius and Alaska pollack are not normally sold on the UK market. Therefore, the nitrogen factors for them are for comparison with the processed products – commercial Pangasius fillets, and filleted and minced Alaska pollack blocks. Hence the nitrogen content of the fish ingredient produced by good manufacturing practice for commercial Pangasius fillets is 5% less than the whole fish. For Alaska pollack fillet blocks, the fish ingredient is 5% less than whole fish. For mince block fish ingredient it is 11% less than the whole fish. These figures compare favourably with the interim factors in the UK Code of Practice(8), which indicated a 6-7% difference in nitrogen factor between whole fish and commercial fillets.
The recommended nitrogen factor for Pangasius commercial fillets of 2.69 (Kjeldahl 2.65) compares favourably to a previous German study(9), which found that organically produced Pangasius fillets had a Kjeldahl nitrogen content of 2.72g/100g. Non-organic commercial Pangasius fillets had a Kjeldahl nitrogen content of 2.13-2.52g/100g and were deemed to have been previously soaked in either polyphosphate or citrate before freezing. The nitrogen factor values obtained in this study also compare favourably with historic data provided by Young’s Seafood (Table 17)(10). Double frozen Alaska pollack fillet blocks were not analysed in this study, but it can be seen from historic data that the nitrogen factor value of 2.70 for the Alaska pollack fillet block is applicable to both single and double frozen fillet blocks.
The study will be approved by the RSC-AMC Nitrogen Factors Sub-Committee and published in a peer-reviewed journal.
Table 15 Means of Chemical Analyses and Standard Error for the 5 Types of Fish
Nitrogen% Fat% Moisture% Ash%
Mean SEM Mean SEM MeanSEM Mean SEM
Whole Pangasius 2.84 0.018 2.90 0.13 78.7 0.14 1.09 0.013
Commercial Pangasius fillet 2.69 0.024 1.23 0.05 81.4 0.15 0.89 0.012
Whole Alaska pollack 2.81 0.023 0.96 0.04 81.6 0.10 1.22 0.006
Alaska pollack fillet 2.68 0.021 0.71 0.04 82.1 0.08 1.31 0.010
Alaska pollack mince 2.51 0.021 0.70 0.03 83.1 0.09 1.47 0.012
Table 16 Recommended Nitrogen Factors for Pangasius and Alaska Pollack
Product Nitrogen Factor (Kjeldahl)
Whole Pangasius 2.85 (2.80) ± 0.04
15

Commercial Pangasius Fillets 2.70 (2.65) ± 0.05
Whole Alaska Pollack 2.80 (2.75) ± 0.05
Alaska Pollack Fillet Block 2.70 (2.65) ± 0.04
Alaska Pollack Mince Block 2.50 (2.45) ± 0.04
Table 17 Average Nitrogen Values of Analytical Data Provided by Young’s Seafood
Product Sample Period
No of Samples Average N% St. Dev.
Commercial Pangasius fillets 2007-2013 31 2.82 0.208
Alaska pollack fillet blocks- single frozen 1997-2013 1006 2.69 0.167
Alaska pollack fillet blocks- double frozen 2003-2013 138 2.71 0.15
Alaska pollack mince blocks – single frozen 1997-2013 748 2.54 0.176
8.0 ACKNOWLEDGEMENTS
FA0115 was undertaken as part of the programme of work of the RSC-Analytical Methods Committee – Nitrogen Factors Sub-Committee, and the contribution of members of the Sub-Committee is acknowledged. In particular, Young’s Seafood is thanked for its organisation and preparation of the samples, and providing historic nitrogen data. The project was funded by Defra as part of its Food Authenticity Programme.
9.0 REFERENCES
1. Codex Standard for Quick Frozen Fish Sticks (Fish Fingers), Fish Portions and Fish Fillets - Breaded or in Batter. CODEX STAN 166 – 1989, Rev 2011
2. The Fish Labelling (England) Regulations 2010. SI 210 No 420. HMSO
3. BS4401-1: 1998, ISO 936:1998. Methods of Test for Meat and Meat Products. Part 1: Determination of Total Ash.
4. British Standard, BS 4401:1980 ISO 937:1978, “Methods of Test for Meat and meatproducts- Part 2: Determination of nitrogen content (reference method)”.
5. BS4401-3: 1997, ISO 1442:1997. Methods of Test for Meat and Meat Products. Part 3: Determination of Moisture Content (Reference Method).
6. BS 4401: Part 4: Method A 1970 (Weibull Stoldt, acid hydrolysis) UKAS accredited method based on BS4401-4: 1970. Methods of Test for Meat and Meat Products. Part 4: Determination of Total Fat Content: Method A (Weibull Stoldt).
16
7. M. Thompson, L. Owen, K. Wilkinson, R. Wood and A. Damant, A Comparison of the Kjeldahl and Dumas Methods for the Determination of Protein in Foods, using Data from a Proficiency Testing Scheme, Analyst, 2002, 127, 1666–1668.
8. Code of Practice on the Declaration of Fish Content of Fish Products. UKAFFP, BFFF, BHA, BRC, Sea Fish Industry Authority, LACOTS, Association of Public Analysts. http://www.seafish.org/media/Publications/Fish_Content_CoP.pdf
9. Horst Karl, Ines Lehmann, Hartmut Rehbein & Reinhard Schubring 2010. Composition and quality attributes of conventionally and organically farmed Pangasius fillets (Pangasius hypophthalmus) on the German market. Int. Journal of Food Science and Technology. 45, pp 56-66.
10. Personal communication with Young’s Seafood May 2013
17